Embed Size (px)
Citation preview

University of South FloridaScholar Commons
Graduate Theses and Dissertations Graduate School
10-23-2015
How Overqualification Impacts Job Attitudes andWell-Being: The Unique Roles of Perceptions andRealityMarijana L. ArvanUniversity of South Florida, [email protected]
Follow this and additional works at: http://scholarcommons.usf.edu/etd
Part of the Other Psychology Commons
This Thesis is brought to you for free and open access by the Graduate School at Scholar Commons. It has been accepted for inclusion in GraduateTheses and Dissertations by an authorized administrator of Scholar Commons. For more information, please contact [email protected].
Scholar Commons CitationArvan, Marijana L., "How Overqualification Impacts Job Attitudes and Well-Being: The Unique Roles of Perceptions and Reality"(2015). Graduate Theses and Dissertations.http://scholarcommons.usf.edu/etd/5903
How Overqualification Impacts Job Attitudes and Well-Being:
The Unique Roles of Perceptions and Reality
by
Maryana L. Arvan
A thesis submitted in partial fulfillment
of the requirements for the degree of
Master of Arts
Department of Psychology
College of Arts and Sciences
University of South Florida
Major Professor: Paul Spector, Ph.D.
Chad Dubé, Ph.D.
Stephen Stark, Ph.D.
Date of Approval:
October 19, 2015
Keywords: person-job fit, job stress, relative deprivation, objective overqualification,
perceived overqualification
Copyright © 2015, Maryana L. Arvan

Dedication
This thesis is dedicated to Marcus Arvan, who is not only my husband, but also my
colleague, role model, and greatest supporter. It is also dedicated to my parents, Gurmit Sandhu
and Shirley Sheroian, who first encouraged me to pursue this path, and who continue to amaze
me with their unconditional love, guidance, and wisdom. Lastly, it is dedicated to my three older
sisters, Andreana McCullough, Alaina Sandhu, and Karina Sandhu, who have supported and
inspired me since the day I was born.

Acknowledgments
I would like to thank Dr. Paul Spector, whose expertise, insight, and tireless patience and
encouragement have been invaluable to this project. I am very fortunate to have him as my
advisor and mentor. I would also like to thank the members of my committee, Dr. Chad Dubé
and Dr. Stephen Stark, for all their guidance and assistance. Finally, I thank Soner Dumani for
his generous support and helpful feedback during the development stage of this project.

i
Table of Contents
List of Tables iii
List of Figures iv
Abstract v
Chapter One: Introduction 1
Overqualification 3
Objective and Subjective Overqualification 4
Theoretical Perspectives on Overqualification 6
Overqualification, Job Attitudes, and Well-Being 7
Job Attitudes 8
Health and Well-Being 9
Limitations to the Overqualification Literature 10
Person-Job Fit Theory 12
Person-Job Fit and Strain 14
Relative Deprivation Theory 15
Relative Deprivation and Strain 16
Mediating Effects of Relative Deprivation 17
Individual Moderators of Overqualification and Its Outcomes 19
Cognitive Ability 19
Negative Affectivity 21
Achievement Striving 22
Alternative Models 25
The Current Study 25
Chapter Two: Method 28
Participants and Procedure 28
Classification Into O*NET-SOC Occupations 31
Measures 32
Objective Overqualification 32
Overeducation 33
Skill Overqualification 34
Cognitive Ability Overqualification 35
Perceived Overqualification 36
Relative Deprivation 36
Achievement Striving 37
Cognitive Ability 38
Conversion Into Standardized SAT Scores 38

ii
Representativeness of College Entrance Exams 39
Negative Affectivity 39
Job Satisfaction 40
Psychological Distress 40
Physical Symptoms 40
Demographics 41
Analytic Strategy 41
Chapter Three: Results 43
Correlational Analyses 43
Model Testing 45
Confirmatory Factor Analyses: 45
Hypothesized Model 48
Alternative Models 49
Moderated Regression Analyses 51
Chapter Four: Discussion 53
Implications 57
Limitations and Suggestions for Future Research 58
Conclusion 61
References 62
Tables 68
Figures 75
Appendices 82
Appendix A: O*NET Skills 83
Appendix B: Perceived Overqualification 85
Appendix C: Relative Deprivation 86
Appendix D: Achievement Striving 87
Appendix E: Negative Affectivity 88
Appendix F: Job Satisfaction 89
Appendix G: Psychological Distress 90
Appendix H: Physical Symptoms 91
Appendix I: Demographics 92
Appendix J: Institutional Review Board Approval Letter 93

iii
List of Tables
Table 1 Hypotheses and Statistical Analyses 68
Table 2 Descriptive Statistics and Reliabilities 69
Table 3 Intercorrelations Among Study Variables 70
Table 4 Model Fit Statistics 71
Table 5 Moderated Regression Results of Cognitive Ability Predicting Relative
Deprivation 72
Table 6 Moderated Regression Results of Negative Affectivity Predicting Relative
Deprivation 73
Table 7 Moderated Regression Results of Achievement Striving Predicting Perceived
Overqualification 74

iv
List of Figures
Figure 1 Scatterplot of the relationship between objective overqualification and
perceived overqualification. 75
Figure 2 Scatterplot of the relationship between perceived overqualification and
relative deprivation. 76
Figure 3 Scatterplot of the relationship between relative deprivation and job
satisfaction. 77
Figure 4 Scatterplot of the relationship between relative deprivation and psychological
distress. 78
Figure 5 Scatterplot of the relationship between relative deprivation and physical
strain. 79
Figure 6 SEM results for the hypothesized model. 80
Figure 7 SEM results for the alternative model with direct effects of objective
overqualification on outcomes. 81

v
Abstract
The recent global economic downturn has stimulated a growing interest among scholars
in how employees interpret and respond to the circumstance of being overqualified. However,
the overqualification literature has been hindered by uncertainty regarding the extent to which
employees’ perceptions of being overqualified are based in reality. The present study sought to
address this concern by proposing and testing a theoretical model of objective overqualification,
perceived overqualification, job satisfaction, and well-being using a cross-sectional sample of
full-time employees who had recently graduated from college. Additionally, the present study
investigated cognitive ability, achievement striving, and trait negative affectivity as potential
moderators of several relationships delineated in the proposed model. Results indicated that the
data were consistent with the proposed model, which argues that objective overqualification
predicts employees’ perceptions of being overqualified, which creates feelings of relative
deprivation and ultimately manifests in poorer job satisfaction and reduced well-being.
Importantly, however, the pattern of relationships among study variables suggested that strain
outcomes were mostly driven by perceived overqualification. Furthermore, employees’
perceptions of being overqualified appeared to be influenced considerably by unmeasured factors
besides objective overqualification, potentially including dissatisfaction with other aspects of the
job. There was no support for the hypothesized individual moderators. Overall, the study
highlights the importance of taking a more nuanced approach to studying overqualification
phenomena and cautions against the assumption that being objectively overqualified is a
necessarily undesirable circumstance for individuals and their employers.

1
Chapter One
Introduction
In the aftermath of the 2008-2012 global financial crisis and the tortuous road to
economic recovery, scholars have increasingly focused on individuals who find themselves in
less-than-desirable employment situations (McKee-Ryan & Harvey, 2011; Liu & Wang, 2012).
Overqualification is a specific kind of inadequate employment that occurs when employees have
more qualifications, such as education or experience, than are required by their jobs (Maynard,
Joseph, & Maynard, 2006; Erdogan, Bauer, Peiro, & Truxillo, 2011). Overqualification is
significant in that it is perceived negatively by hiring managers and may act as a barrier to
employment (Erdogan et al., 2011). Especially concerning to organizational researchers is the
growing body of evidence that overqualification can have deleterious effects on employees and
the organizations who employ them, particularly if the overqualification is perceptual in nature
(i.e., self-reported). Indeed, recent research suggests that employees who perceive themselves as
overqualified have poorer job attitudes and well-being (McKee-Ryan & Harvey, 2011; Liu &
Wang, 2012), are more likely to voluntarily turnover (Maynard & Parfyonova, 2013), and
engage in more counterproductive work behaviors (CWBs) (Liu, Luksyte, Zhou, Shi, & Wang,
2015), which are voluntary negative behaviors directed towards other organizational members
that potentially harm an organization and its stakeholders (Spector & Fox, 2005).
Being an area of relatively new interest to management scholars and industrial-
organizational psychologists, theoretical and measurement-related issues abound in recent
reviews on overqualification (e.g., Erdogan et al., 2011; Liu & Wang, 2012). A key area of

2
concern is the lack of clarity on the relationship between objective and subjective measures of
overqualification; similarly, there is ambiguity surrounding their respective relationships with
criteria of interest. This uncertainty presents a serious challenge to the conclusions and practical
implications that can be drawn from the overqualification literature. After all, decisions about the
appropriateness of hiring an overqualified employee are likely to be based on objective indices of
overqualification (Maltarich, Reilly, & Nyberg, 2011; Erdogan et al., 2011), but if objective
overqualification operates distinctly from employees’ perceptions of overqualification, hiring
managers may erroneously believe that they should turn down the strongest candidates for the
job based on the evidence that employees who perceive themselves to be overqualified are more
dissatisfied and likely to turnover. Another related issue in the literature is irresolution regarding
the appropriate theoretical perspective through which overqualification and its outcomes should
be understood (Erdogan et al., 2011). All of these issues are exacerbated by poor measurement,
which is common in studies on overqualification (Liu & Wang, 2012).
The goal of the current study is to address some of these critical theoretical and
conceptual concerns by developing and testing a model of overqualification that illuminates the
relationships between employees’ objective overqualification and perceptions and interpretations
of being overqualified, and demonstrates how they mutually predict outcomes. Specifically, the
proposed model utilizes an integrative theoretical framework that draws upon both person-job fit
theory and relative deprivation theory in order to delineate the nature of the relationships
between objective indicators of overqualification, employee perceptions of overqualification,
negative reactions to the discrepancy between one’s current and ideal employment situations
(i.e., relative deprivation), and employee job satisfaction and well-being. In addition to

3
developing and testing this new model, the present study investigates whether several individual
difference variables moderate several relationships specified in the model.
This introduction begins with a review of the overqualification literature. The following
two sections draw upon person-job fit theory and relative deprivation theory to argue for
relationships between objective overqualification, perceived overqualification, relative
deprivation, job dissatisfaction, and reduced psychological and physical well-being. The next
section proposes several individual difference variables that may influence the hypothesized
processes and outcomes of overqualification. Finally, I provide a detailed overview of the
current study and explain how it contributes to the literature.
Overqualification
Overqualification occurs when individuals possess more education, experience,
knowledge, skills, and abilities than required by their jobs (Maynard et al., 2006).
Overqualification can be understood as a narrower type of underemployment, which is a broader
term used to describe employment situations that are in some way inadequate (Erdogan et al.,
2011; Watt & Hargis, 2010). In his seminal article, Feldman (1996) identified five dimensions
of underemployment: possessing more formal education than a job requires (overeducation),
being involuntarily employed in a field outside the area in which one received formal education
(job field underemployment), possessing higher-level skills and/or having more work experience
than required by a job (skill/experience underutilization), being employed part-time or
temporarily due to involuntary reasons (hours underemployment), and being underpaid when
compared to one’s previous job or to others with similar education and skills (pay
underemployment) (Mc-Kee-Ryan & Harvey, 2011). Overqualification thus combines the
overeducation and skill/experience underutilization dimensions of underemployment (Maynard

4
et al., 2006). In addition to surplus education, skills, and experience, overqualification also
includes surplus knowledge and abilities (Erdogan et al., 2011).
Overqualification and underemployment are multidisciplinary topics that attract scholars
from a diverse range of fields, including economics, sociology, and industrial-organizational
psychology. Although both overqualification and underemployment are multifaceted, their scope
and focus differ. Whereas underemployment includes broader economic indicators such as being
underpaid and involuntary part-time work, overqualification focuses specifically on employee
attributes and characteristics that are not required or utilized by their jobs (Erdogan et al., 2011).
A key distinction in both constructs is whether the dimension(s) being studied are objective or
subjective in nature. I will now discuss this important distinction in greater detail.
Objective and Subjective Overqualification
Overqualification, like underemployment more broadly, can be understood as having
objective and subjective components. Objective overqualification aims to ascertain whether
objective employee qualifications (i.e., education, experience, knowledge, skills, and abilities)
exceed actual job demands and requirements. An example of an objective overqualification
measure would involve comparing employees’ obtained level of education to the education level
required by their jobs. Subjective overqualification, which is often referred to as perceived
overqualification, captures employees’ overall perceptions of feeling overqualified (Erdogan et
al., 2011). There are a number of established scales of perceived overqualification; one of the
most frequently used scales is Maynard and colleagues’ (2006) Scale of Perceived
Overqualification (SPOQ). The SPOQ contains items such as “I have more abilities than I need
to do my job” and “Someone with less education than myself could perform well on this job.”
5
Perceived overqualification thus entails an evaluative element in which employees have judged
that their qualifications exceed the qualifications required by their jobs.
It is important to distinguish between objective or subjective constructs from objective or
subjective measures of overqualification. To illustrate, Verhaest and Omey (2006) identified four
ways of measuring overeducation objectively (i.e., as a dimension of objective
overqualification). The direct self-report method is to simply ask employees whether or not they
have more education than required by their jobs. The indirect self-assessment method asks
employees what the required education level is for their job, and then compares their responses
to their actual level of education. The job analysis method bases the required educational level
for a given job on job analysis data (e.g., from the Occupational Information Network or
O*NET), and then compares to the actual level of education. Finally, the realized match method
determines the required educational level for a given job using the distribution of educational
levels for workers in that occupation. Accordingly, even when overeducation is conceptualized
objectively (as a dimension of objective overqualification), it can be measured in a number of
ways that vary in the extent to which they employ more subjective versus more objective data.
Most of the existing research on overqualification has focused exclusively on perceived
overqualification (Erdogan et al., 2011). Some researchers have argued that the predominant
focus on perceived overqualification is justified, since it is likely a more proximal predictor of
employee outcomes than objective overqualification (Erdogan et al., 2011). In general, however,
researchers are increasingly concerned that the extent to which perceptions of overqualification
(and underemployment more broadly) are based in objective indicators is largely unknown
(Maltarich et al., 2011; Feldman, 2011; McKee-Ryan & Harvey, 2011; Liu & Wang, 2012). To
the best of my knowledge, only several existing studies have explicitly tested the relationship

6
between objective and perceived overqualification. All three studies found a positive association
between the two variables, but it is difficult to draw firm conclusions since they either relied
upon employees’ direct self-assessments to measure overqualification objectively (McKee-Ryan,
Virick, Prussia, Harvey, & Lilly, 2009) or utilized a dichotomous objective overqualification
variable (Maynard, Brondolo, Connelly, & Sauter, 2015; Liu et al., 2015), though most
researchers suggest that overqualification is a continuous variable that should not be
dichotomized (e.g., Luksyte & Spitzmueller, 2011). Although empirical tests of the relationship
between subjective and objective overqualification are extremely rare, most researchers believe
that they are distinct but related constructs (e.g., Liu & Wang, 2012). A number of researchers
have suggested that subjective overqualification mediates the relationships between objective
overqualification and employee outcomes (e.g., Maltarich et al., 2011; Feldman, 1996).
Theoretical Perspectives on Overqualification
Overqualification, like underemployment more broadly, is generally seen as having
negative consequences for employees and organizations by creating negative job attitudes,
reducing well-being, and increasing turnover among employees (Feldman, 1996; Erdogan et al.,
2011; Liu & Wang, 2012). The two most frequently applied theoretical frameworks to explain
the effects of overqualification and underemployment in the organizational literature are person-
job (P-J) fit theory and relative deprivation theory (Luksyte & Spitzmueller, 2011; Erdogan et
al., 2011). The P-J fit theory approach conceptualizes overqualification as a special type of
person-job misfit in which one’s qualifications (e.g., skills, knowledge, and abilities) do not
match job demands; in turn, employee perceptions of this incongruence cause negative
individual and organizational outcomes (Feldman, 2011; Luksyte & Spitzmueller, 2011). The
relative deprivation theory approach to overqualification focuses on the negative consequences

7
that arise when employees perceive that their current job conditions fail to meet their
expectations (i.e., job situations that they desire and feel entitled to).
P-J fit theory and relative deprivation theory both emphasize that overqualification is a
stressful experience for employees (Luksyte & Spitzmueller, 2011). However, each theory is not
without its critics. While P-J fit theory has been praised as a “parsimonious” framework for
overqualification, it has also been criticized for failing to explain why perceptions of
overqualification may persist even if individuals are not objectively overqualified (Luksyte &
Spitzmueller, 2011). Some researchers have therefore argued that relative deprivation theory
provides a better account of the psychological nature of overqualification than P-J fit theory
(Erdogan et al., 2011). On the other hand, however, Luksyte and Spitzmueller (2011) point out
that the relative deprivation theory approach may induce individual biases into measures of
overqualification that may not correspond to objective markers of overqualification. Studies that
rely solely on employees’ feelings of relative deprivation may therefore be primarily assessing
personality. Both person-job fit theory and relative deprivation theory will be discussed in
greater detail in subsequent sections.
Overqualification, Job Attitudes, and Well-Being
Job attitudes and well-being are among the most commonly investigated outcomes in the
overqualification and underemployment literature (Liu & Wang, 2012; McKee-Ryan & Harvey,
2011). Recently, scholars have also explored performance, voluntary turnover, and
counterproductive work behaviors (CWBs) as outcomes of perceived overqualification (Erdogan
& Bauer, 2009; Fine & Nevo, 2008; Maynard & Parfyonova, 2013; Liu et al., 2015), although
the findings on performance are mixed (Erdogan et al., 2011) and may depend on contextual
8
factors such as the extent to which overqualified employees’ peers are also overqualified (Hu et
al., 2014).
Given that they are the focus of the present study and are the primary criteria in many
existing studies, I will now review empirical findings on how job attitudes and well-being relate
to objective and perceived overqualification.
Job Attitudes. Consistent negative patterns have emerged between perceived
overqualification and job attitudes. Perceived overqualification has been found to negatively
relate to job satisfaction (Johnson, Morrow, & Johnson, 2002; Fine & Nevo, 2008; Erdogan &
Bauer, 2009; Maynard et al., 2006; McKee-Ryan et al., 2009; Maynard & Parfyonova, 2013) and
organizational commitment (Johnson et al., 2002; Maynard et al., 2006; McKee-Ryan et al.,
2009; Maynard & Parfyonova, 2013) across a number of studies. Perceived overqualification
has also been positively linked to turnover intentions (Maynard et al., 2006; McKee-Ryan et al.,
2009).
The relationships between job attitudes and objective overqualification are less clear. In
terms of overeducation, studies using the direct self-assessment method (i.e., asking individuals
whether or not their current job requires their level of education) have found a negative link
between overeducation and job satisfaction (Nabi, 2003) and organizational commitment
(Feldman & Turnley, 1995). Additionally, Feldman and Turnley (1995) found that independent
raters’ assessment of whether recent business graduates’ current job titles were relevant to their
degree positively predicted job satisfaction and affective organizational commitment. However,
using the job analysis method, Friedland and Price (2003) failed to find a significant relationship
between overeducation and job satisfaction after controlling for broader underemployment
indicators (hours and pay underemployment). Similarly, using the indirect self-assessment
9
method, Maynard and colleagues (2015) failed to find a significant relationship between
objective overeducation and job satisfaction. In terms of skill overqualification, several studies
on the recently re-employed have found that skill overqualification negatively relates to job
satisfaction and organizational commitment, and positively relates to turnover intentions and job
searching (Feldman, Leana, & Bolino, 2002; McKee-Ryan et al., 2009). Importantly, however,
both of these studies relied on the direct self-assessment method (i.e., providing a list of skills
and asking respondents to indicate how much their current job utilizes each skill, when compared
to their previous jobs). It is therefore plausible that these two studies assessed perceived skill
overqualification more than objective skill overqualification.
Health and Well-Being. There is generally support for the idea that perceived
overqualification negatively relates to health and well-being. Specifically, researchers have
found that higher levels of perceived overqualification are associated with depression, stress
(Johnson & Johnson, 1996; Johnson & Johnson, 1997), somatization (Johnson et al., 2002) and
perceived health decline (Johnson & Johnson, 1999). One longitudinal study (Johnson &
Johnson, 1999) found that perceived overqualification did not predict perceived health or
perceived health decline two years later; however, the study suffered from significant attrition,
and it is possible that the employees who reacted the most adversely to perceived
overqualification were more likely to voluntarily leave their jobs and drop out of the study (the
researchers did not provide an explanation for the significant attrition; nor did they test
differences between the Time 1 only versus Time 1 and Time 2 groups on the focal variables of
interest).
Although empirical findings on perceived overqualification and well-being are fairly
consistent, the few studies conducted on objective overqualification and well-being outcomes
10
have produced contradictory results. Using the direct self-assessment method, researchers have
linked overeducation to poorer life satisfaction (Nabi, 2003; Feldman & Turnley, 1995) and
negative mood (Feldman & Turnley, 1995). However, using the job analysis method, Friedland
and Price (2003) found that overeducation did not predict depressive symptoms, life satisfaction,
positive self-concept, perceived health, or chronic disease after controlling for initial measures of
these variables (hours and pay underemployment were also controlled for). In a similar vein,
Maynard and colleagues (2015) used indirect self-assessment to measure overeducation and
found that it did not have a significant bivariate relationship with career-related work stress.
Limitations to the Overqualification Literature
The previous discussion highlights several key conceptual, theoretical and measurement-
related issues in the overqualification literature. First, it is critical to gain a better understanding
of the relationship between objective and perceived overqualification. A better understanding of
this relationship will elucidate whether perceived overqualification is a simple mediator between
objective overqualification and outcomes, or whether it operates independently (Maltarich, et al.,
2011). Additionally, establishing that these two constructs are in fact distinct can potentially
explain some of the contradictory findings in the literature. Finally, given that hiring decisions
are necessarily based on more objective indicators of overqualification, it is troubling that the
objective overqualification-perceived overqualification relationship remains virtually untested—
particularly since the burgeoning literature on perceived overqualification largely continues to
reinforce its harmful effects.
The issue of construct validity is closely related to another major issue in existing
overqualification research: poor measurement. Inappropriate measurement and operationalization
of various overqualification dimensions are widespread in the literature, making it difficult to
11
draw conclusions (McKee-Ryan & Harvey, 2011; Maltarich et al., 2011). In fact, a number of
studies were excluded from review in the previous sections because they either combined
measures of overqualification with broader underemployment indicators (e.g., Burke, 1997) or
included items that are inconsistent with researchers’ generally agreed-upon definition of
overqualification (e.g., on a job’s lack of growth opportunities, c.f. Bolino & Feldman, 2000;
personal-job values congruence, c.f. Navarro, Mas, & Jimenez, 2010; or job control, c.f. O’Brien
& Feather, 1990). At the most troubling extreme of the measurement issue, Anderson and
Winefield (2011) point out that some researchers do not even provide an explanation of how
underemployment/overqualification status was operationalized in their study. Clearly, weak or
inconsistent measurement raises concerns about the interpretation of existing findings and further
exacerbates the construct validity problem.
The debate surrounding the appropriate theoretical explanation for overqualification and
its outcomes is also closely related to construct validity issues. Given that most researchers agree
that objective overqualification and subjective overqualification are distinct, but related
constructs, a broader, more integrative theoretical framework may be necessary to explain the
differential relationships between the two types of overqualification and outcomes. Indeed,
researchers seem to agree that P-J fit theory is particularly well-suited to explain the impact of
objective overqualification, whereas relative deprivation theory is particularly useful in
explaining the impact of perceived overqualification (e.g., Erdogan et al., 2011; Luksyte &
Spitzmueller, 2011; Feldman, 2011; Liu & Wang, 2012). Studies that include both objective and
perceived overqualification measures should incorporate the most relevant theory for each
respective construct in an integrative framework, as opposed to a “one-theory-fits-all” approach.
Although theoretical explanations should strive to be parsimonious, the persistent debate
12
suggests that no single theory is adequate to explain the complex, multifaceted phenomenon by
which overqualification affects employees and organizations.
Finally, although this issue has not been raised previously, there is a need to explore
individual moderators of the relationship between objective overqualification, perceived
overqualification, and outcomes. Personality characteristics may influence the relationship
between objective overqualification and perceived overqualification. In other words, there may
be differences in how likely an individual is to “notice” the fact that they are objectively
overqualified (Erdogan et al., 2011; Feldman, 2011). Individual differences may also influence
how employees react to perceived overqualification. Although researchers are beginning to
devote more theoretical attention to potential individual moderators of overqualification and its
outcomes (e.g., Liu & Wang, 2012; Feldman, 2011), empirical investigations of potential
boundary conditions are still lacking. This is an important area to address, as it will help identify
the employees at greatest risk of feeling overqualified and experiencing its consequences.
Having provided an overview of the overqualification literature, I now discuss person-job
fit theory and relative deprivation theory in greater detail, and use the tenets of these theories to
develop hypotheses for the present study.
Person-Job Fit Theory
Person-environment (P-E) fit theory posits that compatibility or congruence between the
characteristics of individuals and their work environments positively influences the way
individuals experience those environments (Kristof-Brown, Zimmerman, & Johnson, 2005;
Feldman, 2011). Person-job (P-J) fit is a narrower type of P-E fit that refers to the congruence
between an employee’s characteristics and the characteristics of the job or tasks performed at
work (Kristof-Brown et al., 2005; Kristof, 1996). Edwards (1991) distinguished P-J fit into two
13
types: demands-abilities and needs-supplies. Demands-abilities fit refers to the congruence
between the demands of a job and employee abilities to meet those demands (Edwards, 1991).
Employee abilities refer to abilities in the traditional sense (i.e., aptitudes) as well as experience,
education, knowledge, and skills (Edwards, 1991; Kristof-Brown et al., 2005). Needs-supplies fit
involves the congruence between employee needs and the job supplies (i.e., job or task
characteristics) available to meet those needs (Edwards, 1991). Employee needs can include
individual desires, goals, values, interests, and preferences (Edwards, 1991). When compared to
needs-supplies fit, demands-abilities fit is more consistent with the definition of overqualification
as a situation in which employee education, experience, knowledge, skills, and abilities exceed
job demands (Maynard & Parfyonova, 2013).
In their influential theoretical and meta-analytic review on workplace fit, Kristof-Brown
and colleagues (2005) contend that perceived fit and objective fit are conceptually distinct
constructs since perceived fit allows substantial cognitive manipulation in the process of
appraising one’s environment and thus reflects individual differences in the importance and
salience of different features. At the same time, however, the authors argue that the objective
environment should have at least some influence on individuals’ perceptions, unless individuals
are completely separated from reality. These arguments are consistent with the consensus among
overqualification researchers that perceived overqualification and objective overqualification are
distinct but related constructs. Accordingly, I propose the following hypothesis regarding the
relationship between objective and perceived overqualification:
Hypothesis 1: Objective overqualification will positively relate to perceived
overqualification.
14
Person-Job Fit and Strain
A central tenet of person-environment fit theory is that incongruence between an
individual and their environment causes a variety of psychological, physical, and/or behavioral
strains, such as dissatisfaction, anxiety, and unhealthy behaviors (Edwards, 1993). The
mismatch-strain proposition has been generally supported in the literature, as P-J fit has been
found to relate to beneficial employee and organizational outcomes such as positive job attitudes,
improved psychological and physical well-being, and reduced withdrawal behaviors (Kristof-
Brown et al., 2005). In terms of demand-ability fit specifically, a meta-analysis by Kristof-
Brown and colleagues (2005) found moderate-to-strong positive relationships with job
satisfaction and organizational commitment, and a moderate negative relationship with strain.
P-E fit theorists have argued that strain outcomes are a direct consequence of perceived,
rather than objective misfit (Edwards, 1996), and that objective misfit should have weaker
relationships with outcomes since it is a more distal predictor that must be “filtered” through
employee perceptions (Kristof-Brown et al., 2005). Since objective overqualification is a specific
type of objective P-J misfit, P-E fit theory accordingly entails that its impact on job attitudes and
physical and psychological well-being should be mediated by perceived overqualification. I
therefore hypothesize the following:
Hypothesis 2: The relationships between objective overqualification and job satisfaction
will be mediated by perceived overqualification.
Hypothesis 3a-b: The relationships between objective overqualification and
psychological distress (3a) and physical strain (3b) will be mediated by perceived
overqualification.
15
Relative Deprivation Theory
Relative deprivation is a feeling of deprivation that occurs when individuals desire and
feel entitled to possess an outcome, see that similar others have obtained the outcome, and view
their failure to obtain the outcome as a consequence of external rather than internal factors (e.g.,
due to economic circumstances) (Crosby, 1976). In the overqualification and underemployment
literature, relative deprivation has typically been operationalized using two dimensions of
relative deprivation: desiring a better job and feeling deserving of a better job (Feldman et al.,
2002; McKee-Ryan et al., 2009). Some researchers have also added the dimension of feeling
angry or upset about one’s job situation (e.g., Feldman & Turnley, 2004).
Relative deprivation theory is frequently used to explain the psychological impact of
perceived overqualification, as feelings of relative deprivation can occur when employees find
themselves in a job that fails to meet their desires and expectations. Erdogan and Bauer (2009)
argue that individuals with more qualifications (i.e., education, experience, and KSAs) have
greater expectations about the type of job they deserve and their place in society. Thus, perceived
overqualification can trigger feelings of relative deprivation, which in turn leads to negative
outcomes such as poorer job attitudes and increased withdrawal behaviors (Feldman et al., 2002;
Erdogan & Bauer, 2009). Although the constructs are theoretically related, relative deprivation
assesses broad, affective feelings that measure one’s desire for and sense of entitlement to a
better job, whereas perceived overqualification assesses perceptions of the extent to which one’s
qualifications exceed job demands. In support of the theorized perceived overqualification-
relative deprivation link, McKee-Ryan and colleagues (2009) found moderate-to-strong positive
relationships between perceived overqualification and two dimensions of relative deprivation
(desiring a better job and feeling entitled to a better job). I therefore propose the following

16
hypothesis regarding the nature of the relationship between perceived overqualification and
relative deprivation:
Hypothesis 4: Perceived overqualification will positively relate to relative deprivation.
It is also important to note the role of comparisons in creating feelings of relative
deprivation. Relative deprivation theory suggests that employees use different referents (i.e.,
standards of comparison) when they evaluate their work situations, such as colleagues, previous
work experience, or one’s ideal self (Luksyte & Spitzmueller, 2011).
Relative Deprivation and Strain
The concept of relative deprivation was originally developed to explain the role of
comparisons in shaping individuals’ job attitudes. Specifically, Stouffer, Suchman, DeVinney,
Star, and Williams (1949) used the term “relative deprivation” to describe a phenomenon in
which soldiers in units with higher and more rapid promotion rates were less satisfied with their
promotion system than soldiers in units with fewer and slower promotion rates. Since these
seminal findings, organizational researchers have consistently linked feelings of relative
deprivation to negative job attitudes, including lower job satisfaction and organizational
commitment and higher turnover intentions (Feldman & Turnley, 2004; Feldman et al., 2002;
McKee-Ryan et al., 2009). Relative deprivation has also been found to negatively relate to
organizational trust (Feldman et al., 2002). These findings are consistent with the idea that
relative deprivation, by definition, involves individuals’ judgments that their current situations
are in some way inferior to other situations they desire and feel entitled to. Employees who make
such judgments are likely to have strongly negative evaluations of their jobs. I therefore propose
the following relationship between relative deprivation and job satisfaction:
Hypothesis 5: Relative deprivation will negatively relate to job satisfaction.
17
According to relative deprivation theory, feelings of relative deprivation involve
negative emotions such as anger, dissatisfaction, and resentment, which can trigger symptoms of
stress (Crosby, 1976). Feelings of relative deprivation can therefore be conceptualized as an
emotional strain to a perceived stressor (i.e., being deprived) that in turn influences more distal
well-being outcomes. In support of the hypothesized relationship between relative deprivation
and reduced well-being, studies have found significant relationships between relative deprivation
and negative emotions (Buunk & Janssen, 1992), depression (Keith & Schafer, 1985), burnout,
and a reduced sense of purpose and meaning in life (van Dierendonck, Garssen, & Visser, 2005).
Accordingly, I present the following hypotheses regarding the nature of the relationships
between relative deprivation and psychological and physical well-being:
Hypothesis 6a-b: Relative deprivation will positively relate to psychological distress (6a)
and physical strain (6b).
Mediating Effects of Relative Deprivation
As discussed previously, feelings of relative deprivation are a likely consequence of
perceived overqualification. It is important to note, however, that employees who perceive that
they are overqualified may not always experience feelings of relative deprivation. Erdogan and
colleagues (2011) note that employees may deliberately choose jobs for which they are
overqualified for a variety of reasons, including the desire to have less a demanding job so that
they can better accommodate nonwork responsibilities and interests, or because the job is deeply
aligned with their values. In cases in which employees are aware that they are overqualified but
do not feel deprived by their current employment situations (i.e., they do not desire or feel
entitled to better jobs), negative job attitudes or reduced psychological and physical well-being
are less likely to result. In other words, an employee believing that he or she is overqualified is

18
not, on its own, sufficient to result in adverse outcomes. The harmful effects of perceived
overqualification are contingent upon volition, that is, whether or not the employee has actively
chosen to be in a position for which they are overqualified for personal or professional reasons,
or whether the employee feels helpless or otherwise involuntarily “stuck” in a position for which
they are overqualified. I argue that this critical volitional element is appropriately captured by the
extent to which employees who perceive themselves as overqualified desire and feel entitled to a
better job (i.e., experience relative deprivation).
The previous discussion highlights why the negative consequences of perceived
overqualification are determined by the extent to which employees feel relatively deprived in
their job situations. Consequently, relative deprivation acts as a mediator in the relationships
between perceived overqualification and outcomes. The idea that relative deprivation is the most
proximal predictor of the negative outcomes of overqualification is similar to arguments made by
other researchers (e.g., Feldman et al., 2002; McKee-Ryan et al., 2009; importantly, however,
these researchers have proposed that relative deprivation mediates objective overqualification,
not perceived overqualification). Accordingly, I present the following hypotheses regarding the
mediating effects of relative deprivation on perceived overqualification and its outcomes:
Hypothesis 7: The relationships between perceived overqualification and job satisfaction
will be mediated by relative deprivation.
Hypothesis 8a-b: The relationships between perceived overqualification and
psychological distress (8a) and physical strain (8b) will be mediated by relative
deprivation.
Hypotheses 1-8 summarize the anticipated relationships between the variables in the
proposed model of overqualification, job dissatisfaction, and reduced well-being. In the next
19
section, I address individual differences that may influence several relationships in the
hypothesized model.
Individual Moderators of Overqualification and Its Outcomes
Researchers have argued that individual differences can affect overqualification and
underemployment phenomena in a variety of important ways. For example, Feldman (2011)
argues that personality theory should be used to elucidate how objective underemployment
progresses into subjective underemployment, and to help explain individual reactions to
underemployment. Similarly, Erdogan and colleagues (2011) argue that individual differences
may moderate the relationships between objective overqualification and perceived
overqualification, as well as the relationships between perceived overqualification and various
negative outcomes.
The present study will test three stable individual differences as potential influences in
the overqualification phenomenon: cognitive ability, negative affectivity, and achievement
striving. Cognitive ability and negative affectivity will be tested as moderators of the relationship
between perceived overqualification and relative deprivation. Achievement striving will be
tested as a moderator of the relationship between objective overqualification and perceived
overqualification. To the best of my knowledge, these relationships have not yet been tested.
Cognitive Ability
Cognitive ability is one of the most important predictors in determining individual
outcomes in a variety of life domains, including the workplace (Gottfredson, 1997). General
mental ability, commonly referred to as g or general intelligence, refers to the general ability to
process information that enables complex higher-order thinking skills such as reasoning, decision
making, and problem solving (Gottfredson, 1997). Cognitive ability has proved to be the

20
strongest and most consistent predictor of job performance across occupations. There is evidence
that high-cognitive ability individuals desire more stimulating and challenging work (Ganzach,
1998), and actually pursue higher complexity jobs (Arvey, Abraham, Bouchard, & Segal, 1989;
Wilk, Sackett, & Desmarais, 1995)
Researchers have argued that cognitive ability may operate as a protective factor against
daily stressors and difficult life circumstances (e.g., Stawski, Almeida, Lachman, Tun, &
Rosnick, 2010; Gottfredson, 1997). However, since high cognitive ability individuals seek and
prefer jobs that are more challenging and stimulating, it is possible that they may find the
experience of being unchallenged and bored at work more stressful and frustrating. Boredom is a
negative affective state marked by low motivation and enthusiasm, and has been found to be
associated with work dissatisfaction and strain (Loukidou, Loan-Clarke, & Daniels, 2009). There
is also evidence that intelligent employees are more easily bored (Loukidou, Loane-Clarke, &
Daniels, 2009).
Employees who are high in cognitive ability will likely experience greater boredom in
response to unchallenging, routine work for which they are overqualified (i.e., work that does not
adequately utilize their abilities). Indeed, Feldman (2011) argues that “boredom with the work
itself is experienced constantly” and is difficult to repress. Amplified boredom and frustration
among high cognitive ability employees who perceive that they are overqualified may therefore
increase their likelihood of experiencing relative deprivation, which also involves feelings of
dissatisfaction and frustration. Accordingly, I propose the following hypotheses regarding the
moderating role of cognitive ability in the relationships between perceived overqualification and
relative deprivation:
21
Hypothesis 9: Cognitive ability will moderate the relationship between perceived
overqualification and relative deprivation, such that there will be a stronger positive
relationship between perceived overqualification and relative deprivation among
individuals high in cognitive ability.
Negative Affectivity
Negative affectivity (NA) is a dispositional trait that reflects the tendency to experience
negative emotional states such as anxiety, guilt, and anger over time, as well as the tendency to
have a negative self-concept (Watson & Clark, 1984). Negative affectivity is postulated to
intensify perceptions of (and reactions to) negative stimuli in the environment. More specifically,
Watson and Clark (1984) argue that high NA individuals are more sensitive to the “minor
failures, frustrations, and irritations of daily life, as evidenced by the likelihood, magnitude, and
duration of their reactions.”
There is ample empirical support that NA relates to job stressors (e.g., Spector &
O’Connell, 1994; Penney & Spector, 2005) and strains (Watson & Pennebaker, 1989). Negative
affectivity may influence the relationship between job stressors and strains in multiple ways. One
notable explanation for these relationships is that in any given situation, high NA individuals are
more likely to experience a significant amount of distress (Watson and Pennebaker; 1984). This
idea corresponds to what Spector, Zapf, Chen, and Frese (2000) define as the hyper-responsivity
mechanism, which stipulates that high NA individuals are more sensitive to their environment
and therefore experience exaggerated strain responses to stressors. The hyper-responsivity
mechanism thus argues that NA interacts with job stressors and job strains, such that stressor-
strain relationships are stronger among individuals high in NA (Spector et al., 2000).
22
Given its negative attitudinal, psychological, and behavioral outcomes, perceived
overqualification is treated by many researchers as a job stressor (e.g., Liu & Wang, 2012).
Indeed, in the broader P-E fit literature, misfit is frequently conceptualized as a job stressor
(Yang, Che, & Spector, 2008). Furthermore, as noted in previous sections, relative deprivation
can be conceptualized as a type of emotional strain, since desiring and feeling entitled to a better
job entails feelings of frustration (Liu & Wang, 2012), resentment, and anger (Feldman &
Turnley. 2004). The hyper-responsivity mechanism therefore entails that high NA individuals
should be more likely to experience feelings of relative deprivation in response to perceived
overqualification. This idea is similar to other researchers’ arguments on how individual
reactions to perceived overqualification might be influenced by negative affectivity (Johnson &
Johnson, 2000) and neuroticism (Liu & Wang, 2012; Feldman, 2011). I thus present the
following hypothesis regarding the moderating role of negative affectivity in the relationship
between perceived overqualification and relative deprivation:
Hypothesis 10: Negative affectivity will moderate the relationship between perceived
overqualification and relative deprivation, such that the relationship between perceived
overqualification and relative deprivation will be stronger among individuals high in
negative affectivity.
Achievement Striving
Conscientiousness is a stable personality trait that involves both proactive aspects, such
as achievement orientation and commitment, as well as inhibitive aspects, such as adherence to
one’s ethical principles and cautiousness (Costa & McCrae, 1991; Roberts, Chernyshenko, Stark,
& Goldberg, 2005). Costa and McCrae (1991) argued for six particular facets of
conscientiousness: dutifulness, orderliness, achievement striving, self-discipline, competence,

23
and deliberation (Costa & McCrae, 1991). Although there is debate about the lower-order facet
structure of conscientiousness (Roberts et al., 2005), achievement is one of the narrow traits of
conscientiousness that is generally agreed upon (Dudley, Orvis, Lebiecki, & Cortina, 2006).
Achievement striving reflects individuals’ motivation to achieve goals, pursue excellence, and
strive for competence and success (Costa & McCrae, 1991; Dudley et al., 2006). High
achievement strivers tend to be purposeful, diligent, and have a long-term sense of direction in
life (Costa & McCrae, 1992). Meta-analytic findings indicate that achievement striving and
industriousness (a compound trait of achievement striving and order) positively predict work
dedication, job dedication, and job performance (Dudley et al., 2006; Roberts et al., 2005).
Perceived overqualification has consistently been found to relate to perceptions that a job
lacks opportunities for growth or improvement (Johnson & Johnson, 1996; Johnson & Johnson,
1999). Given the importance that high achievement strivers place on excelling at their work, and
their tendency to have a long-term sense of purpose and direction in their careers, high
achievement strivers may be particularly attentive to how well their current job fits with their
abilities and long-term career goals. As such, individuals high in achievement striving may be
more likely to perceive that they are overqualified when their qualifications objectively exceed
job demands. I therefore propose the following hypothesis regarding the moderating role of
achievement striving in the relationship between objective overqualification and perceived
overqualification:
Hypothesis 11: Achievement striving will moderate the relationship between objective
overqualification and perceived overqualification, such that the relationship between
objective overqualification and perceived overqualification will be stronger among
individuals high in achievement striving.
24
Given that high achievement strivers tend to be goal-oriented and ambitious, it is
important to explain why I do not argue that they will experience greater relative deprivation in
the presence of perceived overqualification. For individuals high in achievement striving,
perceiving their current job as inadequately utilizing their skills, abilities, and other qualifications
is likely to conflict with their robust motivation to achieve. Indeed, Moon (2001) argues that high
achievement strivers are strongly driven to avoid failure and perceiving themselves as failures.
Given their tendencies to avoid failure and take initiative, achievement strivers may undertake
active strategies in order to improve employment situations in which they feel overqualified. For
example, high achievement strivers may initially respond to perceived overqualification by
engaging in job crafting, which involves changing the task boundaries of a job (either physically
or cognitively) and/or changing the relational boundaries of a job (Liu & Wang, 2012).
The relationship between high achievement striving and relative deprivation in the
presence of perceived overqualification may therefore involve a number of contingencies. If high
achievement strivers who perceive that they are overqualified still believe that they can improve
their current job situation into one that is more challenging and suited to their qualifications (e.g.,
through job crafting), achievement striving might dampen the relationship between relative
deprivation and perceived overqualification. On the other hand, if high achievement strivers who
perceive that they are overqualified have already attempted to improve their job situations, but
were unsuccessful (e.g., due to inflexible management), achievement striving might exacerbate
the relationship between relative deprivation and perceived overqualification. Another possibility
is that high achievement strivers who are overqualified may have deliberately chosen those jobs
as part of larger career goals, given their proclivity for crafting and executing long-term plans. In
this instance, there might be no moderating effect of high achievement striving on the

25
relationship between relative deprivation and perceived overqualification. While these questions
are interesting avenues for future research, they are beyond the scope of the present study.
Therefore, no hypothesis is made regarding how achievement striving may influence the
relationship between perceived overqualification and relative deprivation.
Alternative Models
In addition to testing the proposed model outlined in Hypotheses 1-8, I also consider two
alternative models. First, I consider an alternative model that adds direct paths from objective
overqualification to job satisfaction and psychological and physical strain. Consistent with P-E
fit theory (Kristof-Brown et al., 2005), I expect these direct relationships between objective
overqualification and outcomes to be relatively weak since perceived overqualification is taken
into account. However, given that objective overqualification is associated with broader
underemployment indicators that can also negatively impact job attitudes and well-being, such as
being underpaid, it is possible that this model may predict more variance in job satisfaction and
physical and psychological strain than the focal proposed model. The second alternative model
omits objective overqualification and specifies cognitive ability, achievement striving, and
negative affectivity as antecedents of perceived overqualification. This model therefore holds
that individual differences, as opposed to objective overqualification, are the primary influencers
of perceived overqualification. I expect this model to fit the data more poorly than my focal
model, since employee perceptions of overqualification should have some basis in reality and
should not be driven solely by individual differences.
The Current Study
The current study tests a hypothesized theoretical model that delineates the nature of the
relationships between objective overqualification, perceived overqualification, and relative

26
deprivation, and explains how they mutually predict job dissatisfaction and reduced well-being.
It also investigates several individual differences that may strengthen the relationships in the
proposed model. The present study therefore intends to make several important contributions to
the overqualification literature.
The most important contribution intended by the current study is insight into the extent to
which perceptions of overqualification are grounded in reality (i.e., objective overqualification).
Three dimensions of objective overqualification are examined: overeducation, cognitive ability
overqualification, and skill overqualification. Overeducation and cognitive ability
overqualification are assessed using job analysis; skill overqualification is assessed using a
combination of job analysis and indirect self-assessment methods. Both job analysis and indirect
self-assessment have advantages over the direct self-assessment method that has been
predominantly used to measure dimensions of objective overqualification (Luksyte &
Spitzmueller, 2011). Although measuring all possible dimensions of objective overqualification
is beyond the scope of this study, an analysis of the relationship between perceived
overqualification and three forms of objective overqualification marks an important step forward
in understanding the nature of the relationship between these two constructs and their relative
utility in predicting employee outcomes.
A second contribution intended by this study is to elucidate the respective roles of
objective and perceived overqualification in predicting employee job satisfaction and well-being.
Although recent review articles have suggested that job satisfaction (Liu & Wang, 2012) and
well-being outcomes (McKee-Ryan & Harvey, 2012) have fairly well-established relationships
with overqualification, the relationships are in fact far more ambiguous when the distinction
between objective and perceived overqualification is considered. Job attitudes and well-being
27
outcomes therefore warrant reexamination as criteria of both objective and perceived
overqualification.
A final contribution intended by this study is to determine whether cognitive ability,
negative affectivity, and achievement striving operate as potential moderators of the relationships
between overqualification and its outcomes. The processes of forming perceptions of
overqualification and reacting negatively to those perceptions is likely subject to a number of
individual boundary conditions. By investigating potential vulnerability factors that may increase
the likelihood that employees perceive objective overqualification, or experience relative
deprivation in light of those perceptions, this study aims to provide a more complete account of
the negative effects of overqualification on job attitudes and well-being.
The current study uses a sample of recent college graduates, a population for whom
overqualification is particularly relevant (Feldman & Turnley, 1995; Maynard & Parfyonova,
2013). Overqualification may be particularly problematic for college graduates because they are
more likely than employed students or less educated employees to evaluate their current jobs in
terms of their career goals and broader place in society (Maynard & Parfyonova, 2013; Erdogan
& Bauer, 2009). Indeed, researchers have argued that new entrants in the job market, such as
recent college graduates, may be particularly likely to experience relative deprivation (Feldman,
2011).

28
Chapter Two
Method
Participants and Procedure
The sample consisted of 162 recent college graduates who had obtained a bachelor’s
degree in psychology from a large public university located in the Southeastern United States.
This particular sample of recent college graduates is justified for a number of reasons. First, not
all education is created equal (Erdogan et al., 2011). Comparing the impact of overeducation on
college graduates from a diverse range of institutions may be inappropriate because the prestige
of those institutions may play a role in how employees perceive their qualifications and current
job situations. Similarly, the type of degree granted (i.e., major) may also influence how
individuals perceive and react to overqualification. The present sample circumvented these
concerns by holding the type of degree and granting institution constant.
Participants had to be at least 18 years of age and working in a full-time job (at least 30
hours per week) in order to participate in the study. This requirement controls for the effects of
involuntary part-time employment, which is a broader type of underemployment that is beyond
the scope of the present study. Additionally, participants had to have worked at their current jobs
for at least three months, as a minimal amount of job tenure and job familiarity is necessary for
employees to meaningfully rate some of the focal variables in the present study (e.g., perceived
overqualification). Finally, full-time graduate students were not eligible to participate unless they
reported working in a position other than a teaching assistantship, research assistantship, or
fellowship, since such students have not technically entered the workforce.
29
Participants were recruited in two different ways. First, individuals who graduated
between May 2012 and December 2013 were identified using an alumni contact list provided by
the psychology department and invited to participate in the study via both email and physical
mail. Of the 1,167 individuals contacted through this method, 138 participated in the survey
(11.8% response rate). Although this total response rate is fairly low, it is possible that the
effective response rate was higher, since mailing addresses were collected at the time of
graduation and may have been outdated at the time of recruitment, and alumni may not have
frequently used or checked the university email accounts through which they were contacted.
Second, with the assistance of the psychology department, I sent recruitment emails to college
seniors who had declared their intention to graduate during the Spring 2014 or Fall 2014
academic semesters. Students who were interested in participating in the study completed an
online contact information survey in which they provided their name, email addresses, and
expected graduation date. I then contacted them between four to six months following their
expected graduation date. Thirty-six (36) of the 88 individuals contacted through this method
participated in the study (40.9% response rate). It is important to note that a considerable number
of individuals reached through both recruitment methods may have failed to meet the study’s
eligibility criteria, as they may have been working in a position with reduced hours, enrolled as
full-time graduate students without other employment, or been unable to secure any form of
employment after graduation.
Participants recruited through both methods received a letter and/or email informing them
about the nature of the study, including my contact information if they had any questions. The
message also contained the URL to the online survey, which was hosted by Qualtrics, if they met
the eligibility criteria and wished to participate in the study. Informed consent information was
30
presented on the URL landing page, and participants were required to acknowledge it before
proceeding to the survey. Responses to the survey were anonymous. Participants’ contact
information, which was required for compensation purposes, was collected in a separate survey
that could only be accessed through a hyperlink embedded in the final page of the focal survey.
Participants received a $5.00 Starbucks’ eGift or gift card as compensation.
A total of 174 completed survey responses were received. Three participants were
eliminated for not having employment other than full-time graduate teaching assistantships. Five
participants were eliminated for failing to pass at least three out of four quality control items
designed to detect random responding. Finally, two surveys were eliminated due to evidence that
they were duplicates (i.e., consecutively completed surveys with nearly identical responses,
including open-ended questions and personal/demographic data). The final sample therefore
included 162 participants.
The average age of participants was 24.27 years (SD=2.22). The sample was mostly
female (85.2%) and single (78.4%). Participants were ethnically diverse, with 68.5% identifying
as Caucasian/White, 11.7% as African American, 11.1% as Latino/Hispanic, 3.7% as Asian, and
5% as another ethnicity or multiple ethnicities. The average length of time between participants’
graduation date and the date they completed the study was 18.13 months (SD= 8.41), with a
maximum of 35.83 months. Participants were employed in a diverse range of occupations, with
self-reported job titles such as “clinical case manager,” “deputy sheriff,” “certified nursing
assistant,” “licensed massage therapist,” and “animal care technician.” Participants reported an
average job tenure of 13.4 months (SD= 12.38) and organizational tenure of 20.36 months (SD=
19.25). Finally, participants worked an average of 38.72 hours per week (SD= 4.96).

31
Classification Into O*NET-SOC Occupations
In order to obtain objective measures of job characteristics, participants were classified
into an occupation based on the Occupational Information Network (O*NET)’s Standard
Occupational Classification (SOC) taxonomy. O*NET is a comprehensive, continually updated
database of job characteristics and worker attributes that is sponsored by the U.S. Department of
Labor (National Center for O*NET Development, 2015). Data are collected in an ongoing
process from both occupational experts and randomly sampled job incumbents. The O*NET-
SOC taxonomy was last revised in 2010 and currently consists of 976 occupations.
I classified participants’ jobs into O*NET-SOC occupations using three pieces of
information: their self-reported job titles, their self-reported job industry according to the North
American Industry Classification System (which is used in determining the O*NET-SOC
occupation code), and their self-reported O*NET-SOC occupation. I first attempted to determine
participants’ O*NET-SOC occupations by searching for their self-reported job titles in O*NET’s
online “Find Occupations” tool (https://www.onetonline.org/find/). If I could not determine a
participant’s O*NET-SOC occupation based on their self-reported job title alone, I also
examined the industry and O*NET-SOC occupation reported by participants themselves. Given
that participants did not have access to detailed task descriptions for the O*NET-SOC
occupation they chose, and the fact that the titles of many related O*NET-SOC occupations are
similar, my classification was treated as final.
I was able to assign O*NET-SOC occupations to 158 out of 162 participants. The
remaining four participants provided job titles that were too nondescript to make a reliable
O*NET-SOC classification. Additionally, these four participants opted not to select their
O*NET-SOC occupation themselves, since all participants could select an option indicating that
32
“None of these occupations resemble my current job.” Among the 158 participants I was able to
classify, 33 also indicated that none of the O*NET-SOC occupations resembled their current job.
Agreement was therefore calculated using the 125 participants that self-reported an O*NET-SOC
occupation. The O*NET-SOC occupation I chose aligned with the participants’ chosen
classification in 88 out of 125 cases (70.4%).
Participants’ O*NET-SOC occupations were used to obtain objective ratings of job-level
cognitive demands, skill demands, and education requirements. Although O*NET data cannot
provide context-specific information on a given individual’s job, O*NET ratings of job
characteristics have been found to converge with individual-level incumbents’ ratings (Liu,
Spector, & Jex, 2005) and are frequently used in studies examining individual-level phenomena
(e.g., Maltarich et al., 2011; Fisher et al., 2014). The use of O*NET data is described in greater
detail in the sections below.
Measures
Objective Overqualification
Objective overqualification was measured using three indicators: overeducation, skill
overqualification, and cognitive ability overqualification. Treating these different facets as
equally reflecting the objective overqualification construct is consistent with the definition of
overqualification as a situation in which employees possess more education, experience,
knowledge, skills, and abilities than required by their jobs. This point is underscored by Erdogan
and colleagues (2011), who note that “a college graduate applying for a sales job requiring a high
school degree may be overeducated, but they may not feel overqualified if they lack experience
and abilities required by the job.” The next three sections describe the measurement of each of
the three indicators of objective overqualification.
33
Overeducation. Overeducation was measured by calculating the difference between
individuals’ years of education to the typical years of education required by their current jobs, as
rated by O*NET or the U.S. Bureau of Labor Statistics (BLS). Specifically, for a given
occupation, O*NET provides the highest level of education obtained by a majority of incumbents
in that occupation; this education level was then assigned a numeric value denoting the number
of years typically required to attain that education level. O*NET provided the modal education
level possessed by job incumbents for 141 out of 158 O*NET-SOC occupations. For the
remaining 17 occupations, I used the BLS’ 2014-2015 Occupational Outlook Handbook
(http://www.bls.gov/ooh/) to look up the typical entry-level education required by the BLS’
occupational equivalents of the O*NET-SOC occupations. In order to ensure that the O*NET
ratings of modal education among job incumbents and the BLS ratings of typical entry-level
education required by occupations could be combined, I coded both the O*NET and BLS ratings
for all participants’ occupations. There was a high degree of convergence among the 138
occupations that had both types of ratings (r= .74, p <.01), thus supporting the use of BLS ratings
for the 17 occupations for which O*NET did not provide data on required education level.
I determined the years of education associated with each education level using
definitions provided by the U.S. Bureau of Labor Statistics (2013) as well as the coding
procedure followed by Friedland and Price (2003). Specifically, occupations requiring a doctoral
or professional degree were coded as requiring 19 years of education, occupations requiring a
master’s degree were coded as requiring 17.5 years of education, occupations requiring a
bachelor’s degree were coded as requiring 16 years of education , occupations requiring an
associate’s degree were coded as requiring 14 years of education, occupations requiring some
postsecondary education but no degree, including postsecondary vocational training/certification,

34
were coded as requiring 13 years of education, occupations requiring a high school diploma were
coded as requiring 12 years of education, and occupations requiring less than a high school
diploma were coded as requiring 10 years of education. This method adheres to other
researchers’ conceptualization of overeducation as a continuous variable that should not be
measured dichotomously (e.g., Luksyte & Spitzmueller, 2011).
The years of education completed by participants were determined using the same
categories as above. Since all participants had completed their bachelor’s degree, the minimum
years of education among participants was 16. Additionally, participants were asked whether or
not they had received any formal education since obtaining their bachelor’s degree. If they
answered yes to this question, they received a follow-up question asking them to explain the type
of education they had received. I used their open-ended responses to assign them additional years
of completed education. Participants who reported being enrolled in a graduate program or
completing a vocational certification or award or were assigned an additional 1 year of
education. Participants who specifically indicated that they had already completed a master’s
degree were assigned an additional 1.5 years of education. Overall, nearly a quarter of
participants (23.5%) indicated that they had received formal post-baccalaureate education.
Skill Overqualification. Skill overqualification was operationalized as the difference
between the sum of individuals’ ratings of their competence in 35 skills and the sum of O*NET
ratings of the importance of those 35 skills to their occupations. O*NET skills include 10 basic
skills (e.g., writing), one complex problem solving skill, four resource management skills (e.g.,
time management), six social skills (e.g., persuasion), three systems skills (e.g., judgment and
decision making), and 11 technical skills (e.g., troubleshooting). O*NET provides a rating of the
importance of each skill to a given occupation on a scale from 1 (not important) to 5 (extremely
35
important). More information about O*NET skills can be found at
https://www.onetonline.org/find/descriptor/browse/Skills/. Participants’ skills were assessed via
self-report. Specifically, they were presented with a description of each O*NET skill and asked
to rate their competency in each skill on a scale ranging from 1 (This is not a skill of mine) to 5 (I
am excellent at this skill). O*NET skills and descriptions can be found in Appendix A.
Interestingly, the distribution of participant’s self-rated “skill supply” was shifted to the
right of the distribution of O*NET ratings of occupations’ skill demands. In other words,
participants reported having more skills, and greater competence in those skills, than O*NET
indicated was required, on average, by any given occupation. To illustrate, participants’ average
self-reported cumulative skills score was 118.97 (SD= 20.5), whereas the average O*NET
cumulative skill demands score across all occupations was 88.07 (SD= 8.73). The consequence
of this distribution shift was that nearly all participants were skill overqualified to some degree
(i.e., there were fewer near-zero scores indicating an approximate match between participants’
skills and the skills demanded by their jobs, and fewer negative scores indicating skill
underqualification). However, since skill overqualification was operationalized continuously and
the discrepancy between self-reported skills and O*NET-rated occupational skill demands
appeared to be consistent across participants, I determined that the positive bias in skill
overqualification scores would not impede my planned analyses, as higher scores still represent
greater skill overqualification.
Cognitive Ability Overqualification. Cognitive ability overqualification was measured
as the difference between participants’ standardized SAT (critical reading and math) scores and
standardized O*NET ratings of the cognitive demands of their jobs. Participants’ SAT scores
were standardized to represent cognitive ability scores in the population of high school students
36
taking the test, which I argue roughly approximates the general population of the U.S. labor
force; the procedure is described in greater detail in the “Cognitive ability” section below.
Cognitive demands of the job were calculated by averaging O*NET ratings of the importance of
21 cognitive abilities to an occupation (see Maltarich, Nyberg, & Reilly, 2010, for a similar
approach). O*NET cognitive abilities include elements such as inductive reasoning, number
facility, and written comprehension, and are rated on a scale from 1 (not important) to 5
(extremely important). More information on O*NET cognitive abilities is available at
https://www.onetonline.org/find/descriptor/browse/Abilities/1.A.1/.
Average cognitive demands for participants’ occupations were standardized using the
mean (2.99) and standard deviation (0.29) of the average cognitive demands of all occupations
available in O*NET. A positive score on cognitive ability overqualification thus indicates that an
individual’s “supply” of cognitive ability (approximately relative to the general population) is
greater than the cognitive demandingness of the job (relative to the cognitive demands of all
occupations). A negative score, on the other hand, indicates that an individual’s standing on
cognitive ability is lower than his or her job’s standing in cognitive demands.
Perceived Overqualification
Maynard and colleagues’ (2006) nine-item Scale of Perceived Overqualification (SPOQ)
was used to measure perceived overqualification. The scale assesses perceptions of having
surplus education, experience, knowledge, skills, and abilities relative to one’s job. Response
options were on a Likert scale ranging from 1 (strongly disagree) to 5 (strongly agree). The scale
demonstrated high reliability (α= .91). Items for the SPOQ are presented in Appendix B.
Relative Deprivation
Relative deprivation was measured using three items from Feldman and Turnley (2004)

37
and one item developed for this study. To the best of my knowledge, the overqualification and
underemployment literature lacks a well-established relative deprivation measure; researchers
who have explicitly measured relative deprivation have often used self-developed items. In order
to ensure that the three items used by Feldman and Turnley (2004) adequately captured the
relative deprivation construct, I consulted with a subject matter expert (a doctoral student who
specializes in overqualification). We developed an additional item in order to capture
individuals’ beliefs that they would be more satisfied with a different employment situation
relative to their current one, since feeling of dissatisfaction between one’s current and ideal jobs
are central to the relative deprivation construct (Crosby, 1976). This dimension differs from job
satisfaction in that it specifically anchors satisfaction with a current employment situation
relative to an ideal employment situation, as described below.
Participants were asked to reflect on their own experiences, qualifications, and goals in
answering the four questions, thus specifying the standard of reference as one’s ideal self.
Response options were on a Likert scale ranging from 1 (strongly disagree) to 5 (strongly agree).
The scale demonstrated high reliability (α= .91), and a principal axis exploratory factor analysis
with direct oblimin rotation (δ= 0) extracted a one-factor solution (eigenvalue=3.04) that
explained 76% of the variance in the four items. Items for the relative deprivation measure are
presented in Appendix C.
Achievement Striving
Achievement striving was measured with the ten-item achievement striving subscale
from the International Personality Item Pool Representation of the NEO PI-R (IPIP-NEO;
Goldberg, 1999). Participants rated how accurately each statement described them on a Likert

38
scale ranging from 1 (very inaccurate) to 5 (very accurate). The scale demonstrated adequate
reliability (α= .84). Items for the achievement striving measure are presented in Appendix D.
Cognitive Ability
SAT scores and American College Test (ACT) scores converted into SAT scores were
used to measure cognitive ability. Both the SAT and ACT have been found to correlate highly
with established measures of cognitive ability, indicating that both are acceptable measures of
general intelligence (Frey & Detterman, 2004; Koenig, Frey, & Detterman, 2008). Furthermore,
total SAT and ACT scores are typically highly related to each other, with Koenig and colleagues
(2008) reporting a relationship of r= .87.
Participants were asked to report their combined math and critical reading score on the
SAT or their composite ACT score, one of which is required for admission to their alma mater.
Participants were also asked to report the year they graduated from high school for standardizing
purposes. Accuracy of reporting was ensured in two ways. First, participants were given the
option to opt out of this question if they could not remember their scores. Forty-six (46)
participants chose this option. Second, participants were given directions on how to view their
scores using an online transcript viewing resource provided for current and former students of
public universities in the state (transcripts contain their SAT or ACT scores). One-hundred and
sixteen (116) out of 162 participants (72%) reported an SAT or ACT score.
Conversion Into Standardized SAT Scores. Participants who reported composite ACT
scores were assigned (total math and critical reading) SAT scores using concordance tables
provided by College Board, the owner and publisher of the SAT. Participants’ SAT scores were
then standardized using the mean and standard deviation for all SAT test takers in their class
cohort. This information was ascertained using annual data released by College Board of the

39
average scores of all high school seniors who took the SAT at any point during their high school
years. Participants’ standardized SAT therefore represents their cognitive ability relative to the
general population of high school students who take the SAT.
Representativeness of College Entrance Exams. Although neither the SAT or ACT are
taken by the entire population of high school seniors in the U.S., there is evidence that the
population of SAT- and ACT-takers is increasingly approximating the general population of high
school students, and by extension, the general population capable of participating in the U.S.
labor force. A key factor in the growing representativeness of the SAT and ACT is the fact that a
wider range of high school students now have greater access to these exams, and in many cases
are required to take them. Indeed, since 2001, nearly half of the states in the U.S. have entered
into some type of contract with the companies owning the SAT or ACT in order to boost testing
participation (e.g., by offering the test for free and during school hours); approximately 14 of
these states require high school students to take the SAT or ACT as part of a statewide
achievement testing program (Adams, 2014; Teicher Khadaroo, 2015). As a result, overall
testing numbers and participation by minorities and low-income students have surged for both
the SAT and ACT in recent years (Lewin, 2013; Teicher Khadaroo, 2015). Given the increasing
proportion and diversity of high school students taking college entrance exams, it is reasonable
to treat standardized SAT scores as an approximate measure of cognitive ability among the
general population of high school students, most of whom ultimately enter the work force
(particularly if they graduate from high school and/or attend college; U.S. Bureau of Labor
Statistics, 2014).
Negative Affectivity
Trait negative affectivity was measured using the 10-item subscale from the Positive and

40
Negative Affect Schedule (PANAS; Watson, Clark, & Tellegen, 1988). Participants were
presented with 10 different descriptors (e.g., “irritable,” “upset”) and asked to indicate the extent
to which they generally experience each mood state. Responses ranged from 1 (very slightly or
not at all) to 5 (extremely). The scale demonstrated satisfactory reliability (α= .88). Items for the
negative affectivity measure are presented in Appendix E.
Job Satisfaction
Job satisfaction was measured with the three-item subscale from the Michigan
Organizational Assessment Questionnaire (MOAQ; Cammann, Fichman, Jenkins, & Klesh,
1983). Participants indicated their responses on a Likert scale ranging from 1 (strongly disagree)
to 5 (strongly agree). The scale demonstrated high reliability (α= .91). Items for the job
satisfaction measure are presented in Appendix F.
Psychological Distress
Psychological distress was measured with five items of the psychological strain subscale
from the 12-item General Health Questionnaire (GHQ-12; Goldberg & Williams 1991), which
was developed to measure psychological strain related to anxiety and depression. Participants
indicated their responses on a frequency scale from 1 (never) to 5 (all the time). The scale
demonstrated high reliability (α= .89). Although the original subscale contains six items, the item
about losing sleep was deleted due to overlap with an item on the PSI. Items for the
psychological stress measure are presented in Appendix G.
Physical Symptoms
Physical symptoms was measured with a shortened version of Spector & Jex’s (1998)
Physical Symptom Inventory (PSI). Participants were asked how often they have experienced 13
different physical symptoms over the past month, such as trouble sleeping or a headache.

41
Responses were on a frequency scale ranging from 1 (not at all) to 5 (every day). The scale
demonstrated adequate reliability (α= .81). Items for the physical symptoms measure are
presented in Appendix H.
Demographics
Participants were asked to report their age, gender, ethnicity, and marital status. They
were also asked to report the month and year they graduated from college. Participants were
asked a number of questions about their current jobs, including their job title, their O*NET-SOC
occupation (and NAICS job industry), how long they had worked in their position, how long
they had worked at their current organization, and their average work hours per week. Finally,
participants were asked whether they had completed any formal education since obtaining their
Bachelor’s degree. Demographic measures are presented in Appendix I.
Analytic Strategy
The hypotheses in the current study were tested using correlation analyses, moderated
regression, and structural equation modeling. Table 1 summarizes the analyses used to test each
hypothesis. Mplus Version 7.0 (Muthén & Muthén, 1998-2012) was used to perform
confirmatory factor analyses (CFAs) and structural equation modeling (SEM). In order to
address missing data, robust full-information maximum likelihood estimation (MLR) was used
for both the CFAs and SEM (Muthén & Muthén, 1998-2012). Full-information maximum
likelihood estimation is considered an optimal strategy to address missing data in confirmatory
factor analyses and SEM because it utilizes all available data from the full sample (Brown,
2015). Specifically, full-information maximum likelihood estimation uses raw data (instead of a
variance-covariance matrix) to calculate a log-likelihood for each individual observation and
then sums across the total cases for the overall sample log-likelihood, thus allowing for

42
differences in the number of variables or items across individuals (Graham & Coffman, 2012;
Brown, 2015). The remaining analyses for this study were conducted in SPSS statistical
software.
According to a power analysis, a sample size of approximately 300 would be necessary to
have adequate power (.80) to detect a one-way interaction in a hierarchical regression analysis
that predicts a small amount of incremental variance in the criterion (∆R2=.03) while still
keeping the significance level at the conventional value of .05 (Soper, 2015). Since the sample
size is 162 in the present study, I raised my significance level to .10 for my moderated regression
analyses in order to maximize power. This approach is consistent with the recommendations of
Bing, LeBreton, Davinson, Migetz, and James (2007), who argue that the low power to detect
moderating effects in field research warrants the use of a one-tailed test (p<.10) of the
significance of an interaction term when an a priori hypothesis has been made about the specific
nature of the interaction. The significance level is .05 for all other analyses.

43
Chapter Three
Results
The results of this study are presented in three sections. First, I discuss the results of
correlational analyses testing Hypotheses 1, 4, 5, and 6, which predict relationships between
adjacent variables in the proposed model. In the next section, I discuss the SEM results of the
proposed model and alternative models, and examine the mediating effects stipulated by
Hypotheses 2, 3, 7, and 8. The third and final section presents the results of the moderated
regression analyses used to test Hypotheses 9, 10, and 11.
Correlational Analyses
Descriptive statistics and reliabilities for all study variables are presented in Table 2, and
Table 3 contains intercorrelations between all study variables. In order to create a composite
objective overqualification variable, scores on skill overqualification, overeducation, and
cognitive overqualification were standardized and summed.
Hypothesis 1, which stated that objective overqualification would positively relate to
perceived overqualification, was supported (r= .54, p<.01). Hypothesis 4 was also supported, as
perceived overqualification positively related to relative deprivation (r= .53, p<.01). Consistent
with Hypothesis 5, relative deprivation had a robust negative relationship with job satisfaction
(r= -.73, p<.01). Finally, relative deprivation positively related to both psychological distress (r=
.38, p<.001) and physical symptoms (r= .24, p<.01), thus supporting Hypothesis 8. Overall, all
hypotheses regarding the relationships between adjacent variables in the hypothesized model
were supported. Figures 1-5 depict scatterplots of these bivariate relationships.

44
Although they were not specifically hypothesized, a number of bivariate relationships
between the study variables are worthy of note. As can be seen in Table 3, the relationship
between relative deprivation and perceived overqualification (r= .53, p<.01) was stronger than
the relationship between relative deprivation and objective overqualification (r= .30, p<.01) or
any of its facets (r’s ranged from .17, ns, to .32, p<.01). Additionally, only the relationship
between job satisfaction and perceived overqualification was significant (r= -.38, p<.01); job
satisfaction did not significantly relate to objective overqualification (r= -.11, ns) or any of its
facets (r’s ranged from -.14 to .04, ns).
I re-ran these correlational analyses using only the subset of participants with scores on
both objective and perceived overqualification (N=111) as a first step in investigating whether
there were significant differences between objective overqualification and perceived
overqualification in their respective effect sizes with relative deprivation and job satisfaction.
Importantly, the correlations found in the subset of 111 participants were virtually the same as
the correlations found in the full sample. Specifically, for relative deprivation and perceived
overqualification, r= .53 (p<.01), for relative deprivation and objective overqualification, r= .30
(p<.01), and the correlation coefficients between relative deprivation and the three objective
overqualification facets ranged from .17 (ns) to .34 (p<.01). Similarly, for job satisfaction and
perceived overqualification, r= -.37 (p<.01), for job satisfaction and objective overqualification,
r= -.11 (ns), and the correlation coefficients between job satisfaction and the three objective
overqualification facets ranged from -.17 (ns) to .04 (ns). Using software by Lee and Preacher
(2013), which follows Steiger’s (1980) approach, I performed a series of two-tailed asymptotic
z-tests in order to compare dependent correlations. The results indicated that the relationship
between relative deprivation and perceived overqualification was significantly greater than the

45
relationship between relative deprivation and objective overqualification (z= 2.9, p<.01) or any
of its facets (z values ranged from 2.62 to 3.72, p<.01). Additionally, the relationship between
job satisfaction and perceived overqualification was significantly greater than the relationship
between job satisfaction and objective overqualification (z= -3.04, p<.01) or any of its facets (z
values ranged from-3.94, p<.01, to -2.418, p<.05).
Both objective overqualification and perceived overqualification had a similar pattern of
nonsignificant relationships with the two well-being variables. Specifically, neither perceived
overqualification (r= .08, ns) or objective overqualification (r= .09 ns) or any of its facets (r’s
ranged from -.12 to .13, ns) had significant relationships with psychological distress. Similarly,
neither perceived overqualification (r= .04, ns) or objective overqualification (r= .01, ns) or any
of its facets (r’s ranged from -.05 to .01, ns) had significant relationships with physical
symptoms. Finally, of the various overqualification dimensions, only skill overqualification had
significant relationships with personality variables, demonstrating both a positive relationship
with achievement striving (r= .32, p<.01) and a negative relationship with negative affectivity
(r= -.16, p<.05).
Model Testing
Confirmatory Factor Analyses
In order to assess the extent to which the indicators of the self-report measures to be used
in the structural equation model fit their hypothesized latent constructs, I first performed a six-
factor CFA on perceived overqualification, relative deprivation, job satisfaction, psychological
distress, and physical strain. Fit indices for this six-factor model failed to meet commonly-used
criteria of acceptable fit, χ2(517)= 918.613, p<.001, CFI= .86, TLI= .84, RMSEA= .069 [90%
CI: .062, .076] (Hu & Bentler, 1999). An examination of residual variance and covariances and
46
factor loadings indicated two potential sources of misspecification: the perceived
overqualification scale (SPOQ) and the physical symptoms inventory (PSI).
I first addressed misfit with the SPOQ. In their original article introducing and presenting
validity evidence on the SPOQ, Maynard and colleagues (2006) encountered similar issues
regarding the scale’s factor structure. Specifically, although the results of principal components
analyses across two studies indicated that one factor explained most of the variance in the nine
items, a three-factor CFA model fit the data better than a one-factor model. The authors still
maintained that the high internal consistency of the scale, along with the results of the two PCAs,
warranted its use as a unidimensional measure. As can be seen in Appendix B, however, three
dimensions clearly emerge from the nine items of the SPOQ: three items assess excess
education, three items assess excess KSAs (i.e., knowledge, skills, and abilities), and three items
assess excess experience and training. It is therefore possible that a higher-order model with
three first-order factors for each dimension best fits the SPOQ, particularly given the strong
internal consistency found among the items in this study (α= .91) and in Maynard and
colleagues’ (2006) three studies (α ranged from .89 to .92).
Since the SPOQ is used as a unidimensional scale in the literature, and establishing the
appropriate factor structure of the SPOQ is beyond the scope of the present study, I chose to
address this issue by creating three-item parcels for each dimension of the SPOQ: overeducation,
excess KSAs, and overexperience. The score for each parcel was calculated by taking the
average score of the three items assigned to it. This strategy is referred to as domain-
representative or facet-representative parceling (Little, Cunningham, Shahar & Widaman, 2002;
Little, Rhemtulla, Gibson, & Schoemannand, 2013). Facet-representative parceling is appropriate
when researchers are interested in modeling a general latent factor and the effects of lower-level
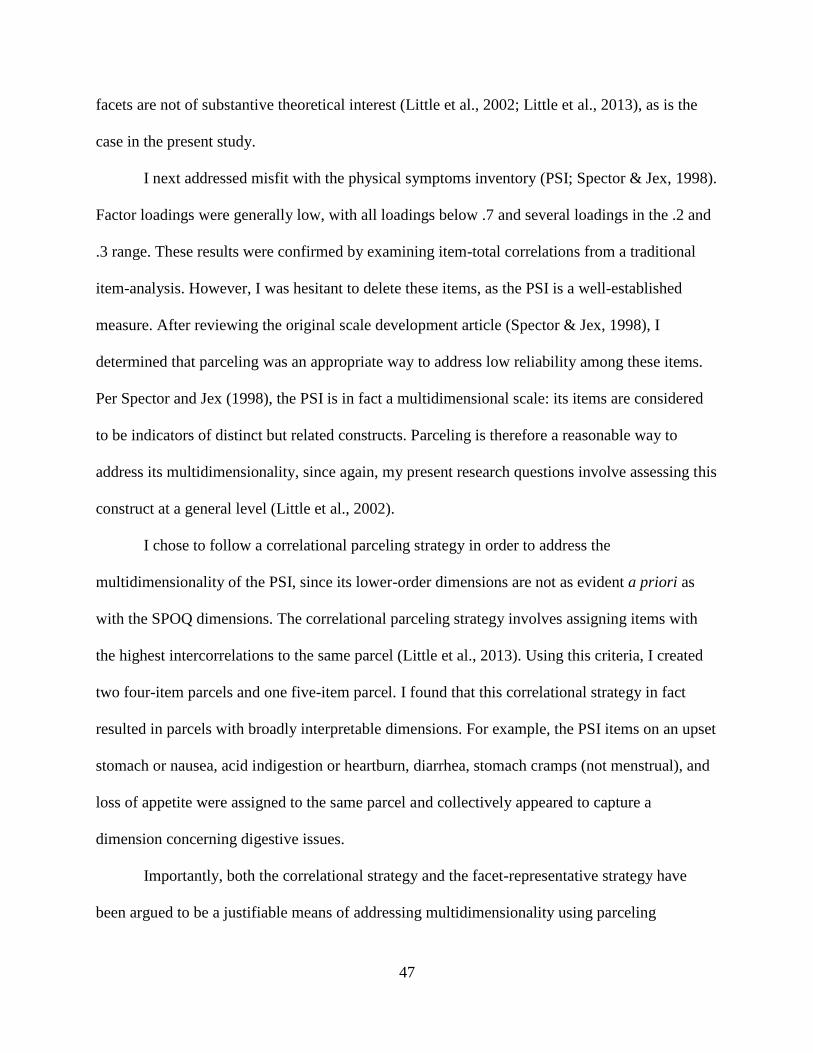
47
facets are not of substantive theoretical interest (Little et al., 2002; Little et al., 2013), as is the
case in the present study.
I next addressed misfit with the physical symptoms inventory (PSI; Spector & Jex, 1998).
Factor loadings were generally low, with all loadings below .7 and several loadings in the .2 and
.3 range. These results were confirmed by examining item-total correlations from a traditional
item-analysis. However, I was hesitant to delete these items, as the PSI is a well-established
measure. After reviewing the original scale development article (Spector & Jex, 1998), I
determined that parceling was an appropriate way to address low reliability among these items.
Per Spector and Jex (1998), the PSI is in fact a multidimensional scale: its items are considered
to be indicators of distinct but related constructs. Parceling is therefore a reasonable way to
address its multidimensionality, since again, my present research questions involve assessing this
construct at a general level (Little et al., 2002).
I chose to follow a correlational parceling strategy in order to address the
multidimensionality of the PSI, since its lower-order dimensions are not as evident a priori as
with the SPOQ dimensions. The correlational parceling strategy involves assigning items with
the highest intercorrelations to the same parcel (Little et al., 2013). Using this criteria, I created
two four-item parcels and one five-item parcel. I found that this correlational strategy in fact
resulted in parcels with broadly interpretable dimensions. For example, the PSI items on an upset
stomach or nausea, acid indigestion or heartburn, diarrhea, stomach cramps (not menstrual), and
loss of appetite were assigned to the same parcel and collectively appeared to capture a
dimension concerning digestive issues.
Importantly, both the correlational strategy and the facet-representative strategy have
been argued to be a justifiable means of addressing multidimensionality using parceling
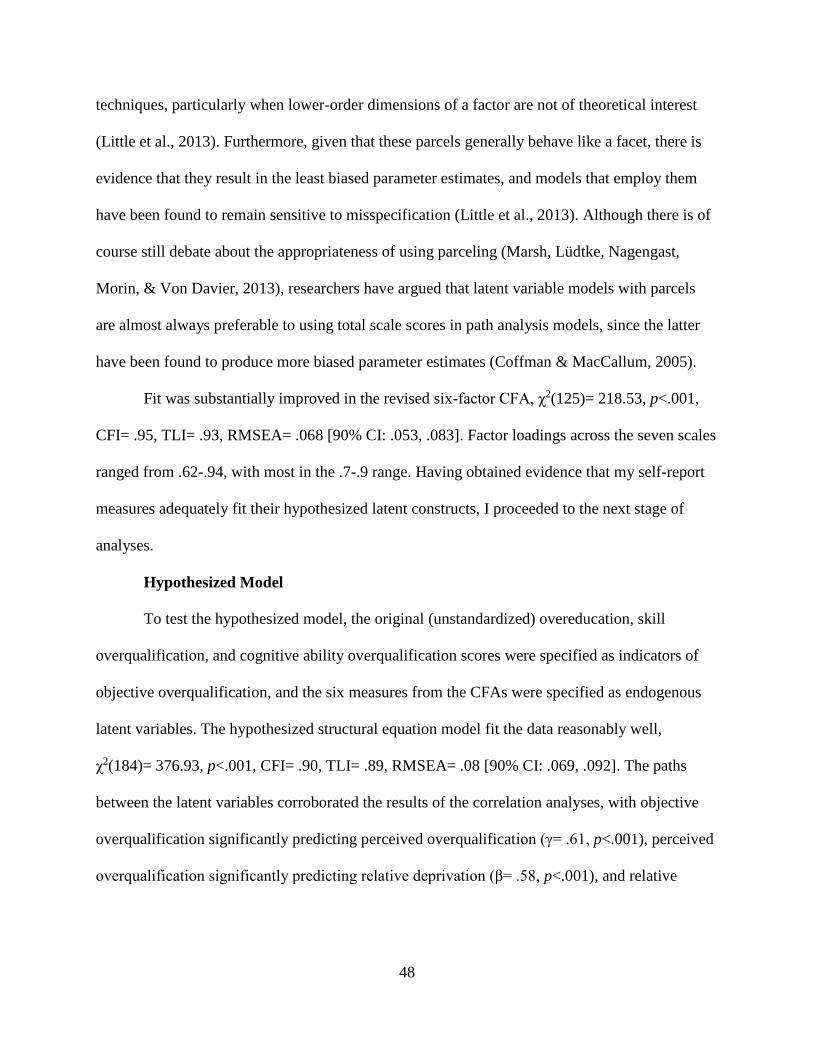
48
techniques, particularly when lower-order dimensions of a factor are not of theoretical interest
(Little et al., 2013). Furthermore, given that these parcels generally behave like a facet, there is
evidence that they result in the least biased parameter estimates, and models that employ them
have been found to remain sensitive to misspecification (Little et al., 2013). Although there is of
course still debate about the appropriateness of using parceling (Marsh, Lüdtke, Nagengast,
Morin, & Von Davier, 2013), researchers have argued that latent variable models with parcels
are almost always preferable to using total scale scores in path analysis models, since the latter
have been found to produce more biased parameter estimates (Coffman & MacCallum, 2005).
Fit was substantially improved in the revised six-factor CFA, χ2(125)= 218.53, p<.001,
CFI= .95, TLI= .93, RMSEA= .068 [90% CI: .053, .083]. Factor loadings across the seven scales
ranged from .62-.94, with most in the .7-.9 range. Having obtained evidence that my self-report
measures adequately fit their hypothesized latent constructs, I proceeded to the next stage of
analyses.
Hypothesized Model
To test the hypothesized model, the original (unstandardized) overeducation, skill
overqualification, and cognitive ability overqualification scores were specified as indicators of
objective overqualification, and the six measures from the CFAs were specified as endogenous
latent variables. The hypothesized structural equation model fit the data reasonably well,
χ2(184)= 376.93, p<.001, CFI= .90, TLI= .89, RMSEA= .08 [90% CI: .069, .092]. The paths
between the latent variables corroborated the results of the correlation analyses, with objective
overqualification significantly predicting perceived overqualification (γ= .61, p<.001), perceived
overqualification significantly predicting relative deprivation (β= .58, p<.001), and relative

49
deprivation negatively predicting job satisfaction (β= -.77, p<.001) and positively predicting
psychological distress (β= .39, p<.001) and physical symptoms (β= .33, p<.001).
Mplus uses the multivariate delta method for calculating the significance of indirect
effects (MacKinnon, 2008), which is similar to the Sobel method. There was a negative and
significant indirect effect of objective overqualification on job satisfaction through perceived
overqualification and relative deprivation (-.27, p<.001), thus supporting Hypotheses 2 and 7.
Consistent with Hypotheses 3 and 8, objective overqualification also had positive and significant
indirect effects on both psychological distress (.14, p<.001) and physical symptoms (.12, p<.01)
through perceived overqualification and relative deprivation. The results therefore supported all
mediating pathways specified in the proposed model. Figure 1 contains the SEM results of the
hypothesized model.
Alternative Models
I first tested the alternative model without objective overqualification, in which cognitive
ability, negative affectivity, and achievement striving were specified as antecedents of perceived
overqualification. Since there was only one item for cognitive ability (i.e., standardized SAT
score), I treated all three individual difference variables as observed. This model fit the data
poorly, χ2(182)= 411.54, p<.001, CFI= .82, TLI= .80, RMSEA= .104 [90% CI: .091, .118],
suggesting that the focal model should be preferred.
I next tested the alternative model that added direct paths between objective
overqualification and job satisfaction, psychological distress, and physical symptoms. Since the
hypothesized model constrains these three paths to zero, it can be considered nested within this
alternative model, which freely estimates these paths. Model fit was similar to the proposed
model except for small decrements in the χ2 and RMSEA values, χ2(181)= 365.03, p<.001, CFI=

50
.90, TLI= .89, RMSEA= .079 [90% CI: .067, .091]. I tested the difference between these two
nested models using the SB-χ2 scaled difference test (Satorra & Bentler, 2001; Byrne, 2012). The
results indicated that the alternative model with direct paths between objective overqualification
and outcomes fit the data better than the focal proposed model, Td (3)= 11.17, p<.05. As can be
seen in Figure 2, the significance and direction of all the paths found in the focal model remained
the same in this alternative model, although they were slightly stronger than in the focal model.
Similarly, all the indirect effects found in the alternative model were the same, albeit slightly
stronger, as in the focal model, with objective overqualification having a significant negative
indirect effect on job satisfaction (-.32, p<.001) and a significant positive indirect effect on
psychological distress (.18, p<.001) and physical symptoms (.16, p<.01). The results of this
alternative model therefore maintain support for Hypotheses 2, 3, 7, and 8. Additionally, as with
the focal model, the direction and significance of the paths between adjacent variables in this
alternative model complement the results of the correlational analyses supporting Hypotheses 1,
4, 5, and 6.
However, an unexpected pattern emerged with the direct paths between objective
overqualification and job satisfaction and physical distress. Recall my earlier suggestion that
these direct relationships would be negative, since objective overqualification is associated with
broader underemployment indicators that can potentially harm job attitudes and well-being
through other mechanisms. The direct paths in this alternative model suggested precisely the
opposite: that is, the direct path between objective overqualification and job satisfaction was
positive (γ= .18, p<.05) and the direct path between objective overqualification and physical
symptoms was negative (γ= -.25, p<.05). The direct path between objective overqualification and
psychological distress failed to reach significance, although it was in the same negative direction
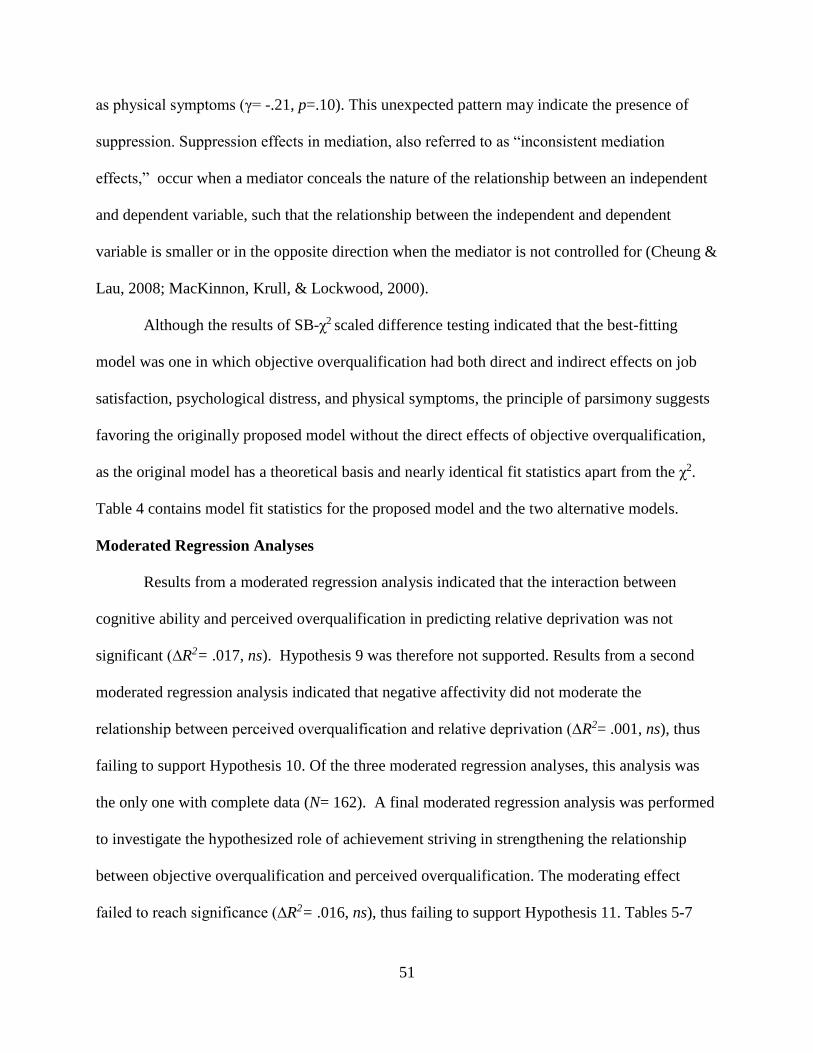
51
as physical symptoms (γ= -.21, p=.10). This unexpected pattern may indicate the presence of
suppression. Suppression effects in mediation, also referred to as “inconsistent mediation
effects,” occur when a mediator conceals the nature of the relationship between an independent
and dependent variable, such that the relationship between the independent and dependent
variable is smaller or in the opposite direction when the mediator is not controlled for (Cheung &
Lau, 2008; MacKinnon, Krull, & Lockwood, 2000).
Although the results of SB-χ2 scaled difference testing indicated that the best-fitting
model was one in which objective overqualification had both direct and indirect effects on job
satisfaction, psychological distress, and physical symptoms, the principle of parsimony suggests
favoring the originally proposed model without the direct effects of objective overqualification,
as the original model has a theoretical basis and nearly identical fit statistics apart from the χ2.
Table 4 contains model fit statistics for the proposed model and the two alternative models.
Moderated Regression Analyses
Results from a moderated regression analysis indicated that the interaction between
cognitive ability and perceived overqualification in predicting relative deprivation was not
significant (∆R2= .017, ns). Hypothesis 9 was therefore not supported. Results from a second
moderated regression analysis indicated that negative affectivity did not moderate the
relationship between perceived overqualification and relative deprivation (∆R2= .001, ns), thus
failing to support Hypothesis 10. Of the three moderated regression analyses, this analysis was
the only one with complete data (N= 162). A final moderated regression analysis was performed
to investigate the hypothesized role of achievement striving in strengthening the relationship
between objective overqualification and perceived overqualification. The moderating effect
failed to reach significance (∆R2= .016, ns), thus failing to support Hypothesis 11. Tables 5-7

52
contain the results of the moderated regression analyses for cognitive ability, negative affectivity,
and achievement striving.
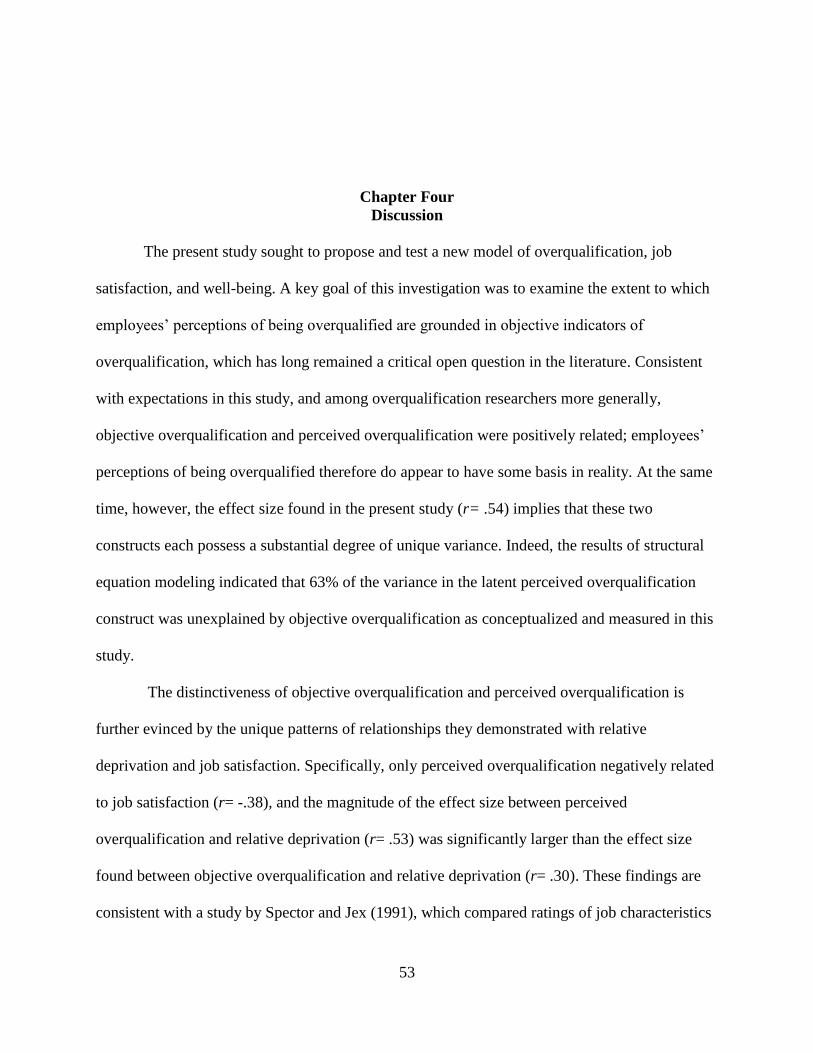
53
Chapter Four
Discussion
The present study sought to propose and test a new model of overqualification, job
satisfaction, and well-being. A key goal of this investigation was to examine the extent to which
employees’ perceptions of being overqualified are grounded in objective indicators of
overqualification, which has long remained a critical open question in the literature. Consistent
with expectations in this study, and among overqualification researchers more generally,
objective overqualification and perceived overqualification were positively related; employees’
perceptions of being overqualified therefore do appear to have some basis in reality. At the same
time, however, the effect size found in the present study (r= .54) implies that these two
constructs each possess a substantial degree of unique variance. Indeed, the results of structural
equation modeling indicated that 63% of the variance in the latent perceived overqualification
construct was unexplained by objective overqualification as conceptualized and measured in this
study.
The distinctiveness of objective overqualification and perceived overqualification is
further evinced by the unique patterns of relationships they demonstrated with relative
deprivation and job satisfaction. Specifically, only perceived overqualification negatively related
to job satisfaction (r= -.38), and the magnitude of the effect size between perceived
overqualification and relative deprivation (r= .53) was significantly larger than the effect size
found between objective overqualification and relative deprivation (r= .30). These findings are
consistent with a study by Spector and Jex (1991), which compared ratings of job characteristics
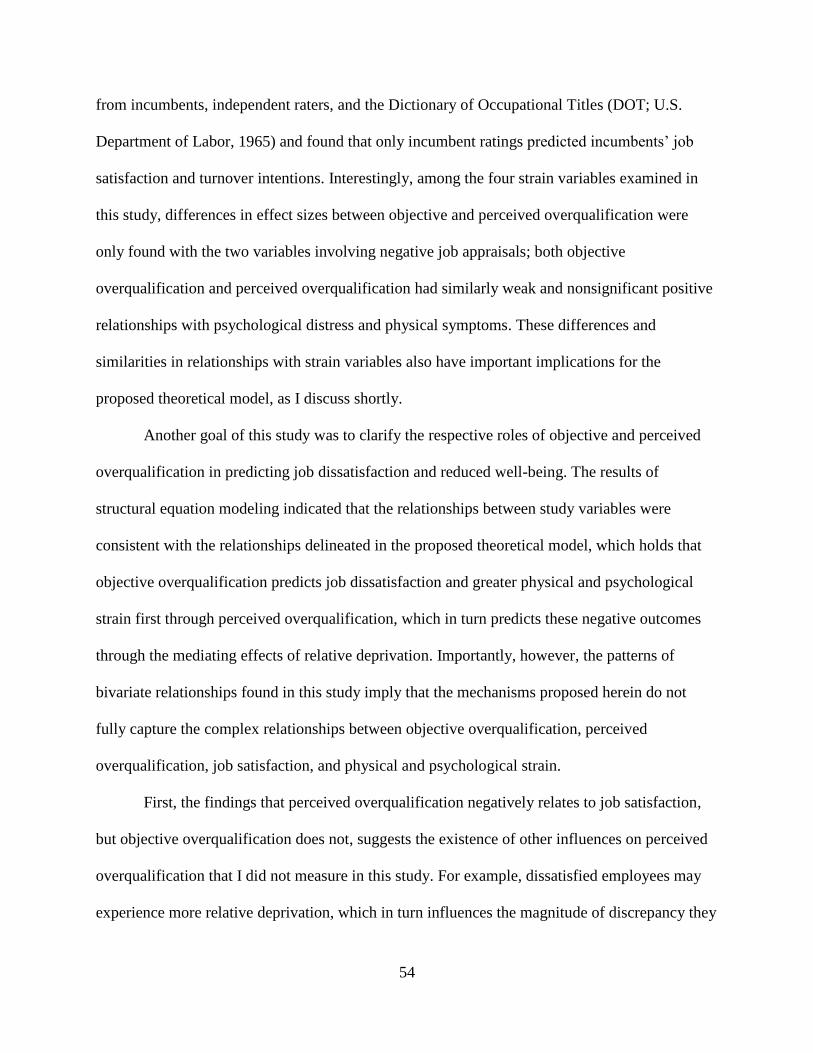
54
from incumbents, independent raters, and the Dictionary of Occupational Titles (DOT; U.S.
Department of Labor, 1965) and found that only incumbent ratings predicted incumbents’ job
satisfaction and turnover intentions. Interestingly, among the four strain variables examined in
this study, differences in effect sizes between objective and perceived overqualification were
only found with the two variables involving negative job appraisals; both objective
overqualification and perceived overqualification had similarly weak and nonsignificant positive
relationships with psychological distress and physical symptoms. These differences and
similarities in relationships with strain variables also have important implications for the
proposed theoretical model, as I discuss shortly.
Another goal of this study was to clarify the respective roles of objective and perceived
overqualification in predicting job dissatisfaction and reduced well-being. The results of
structural equation modeling indicated that the relationships between study variables were
consistent with the relationships delineated in the proposed theoretical model, which holds that
objective overqualification predicts job dissatisfaction and greater physical and psychological
strain first through perceived overqualification, which in turn predicts these negative outcomes
through the mediating effects of relative deprivation. Importantly, however, the patterns of
bivariate relationships found in this study imply that the mechanisms proposed herein do not
fully capture the complex relationships between objective overqualification, perceived
overqualification, job satisfaction, and physical and psychological strain.
First, the findings that perceived overqualification negatively relates to job satisfaction,
but objective overqualification does not, suggests the existence of other influences on perceived
overqualification that I did not measure in this study. For example, dissatisfied employees may
experience more relative deprivation, which in turn influences the magnitude of discrepancy they

55
perceive between their qualifications and the demands of their jobs. This explanation entails that
the proposed direction of effects predicting job satisfaction actually occur in reverse to predict
perceived overqualification. Another possibility is that the effects on perceived overqualification
occur in both directions, such that both objective overqualification and job dissatisfaction
mutually influence perceived overqualification. Such bidirectional influences are particularly
plausible given the significant relationship between objective overqualification and relative
deprivation (r= .30).
Second, the observed pattern of relationships in this study might seem to suggest that the
proposed theoretical model is appropriate for predicting well-being outcomes, even if it may not
completely explain the relationships between objective overqualification, perceived
overqualification, and job attitudes. After all, neither perceived overqualification nor objective
overqualification had significant zero-order correlations with psychological distress or physical
symptoms, but the results from structural equation modeling were consistent with the hypothesis
that both forms of overqualification indirectly influence well-being outcomes through the
mediating role of relative deprivation. Before drawing such a conclusion, however, this
explanation should also be weighed against a potential alternative. Specifically, given the
potential bidirectional relationship between perceived overqualification and job satisfaction
outlined above, job dissatisfaction may in fact be responsible for the positive indirect effect of
perceived overqualification on psychological distress and physical strain. In other words,
employees who are unhappy with their jobs may experience greater relative deprivation and
therefore make heightened judgments about the extent to which they are overqualified for their
jobs, which in turn intensifies feelings of relative deprivation and ultimately reduces well-being
outcomes in a kind of “closed-loop” feedback system.
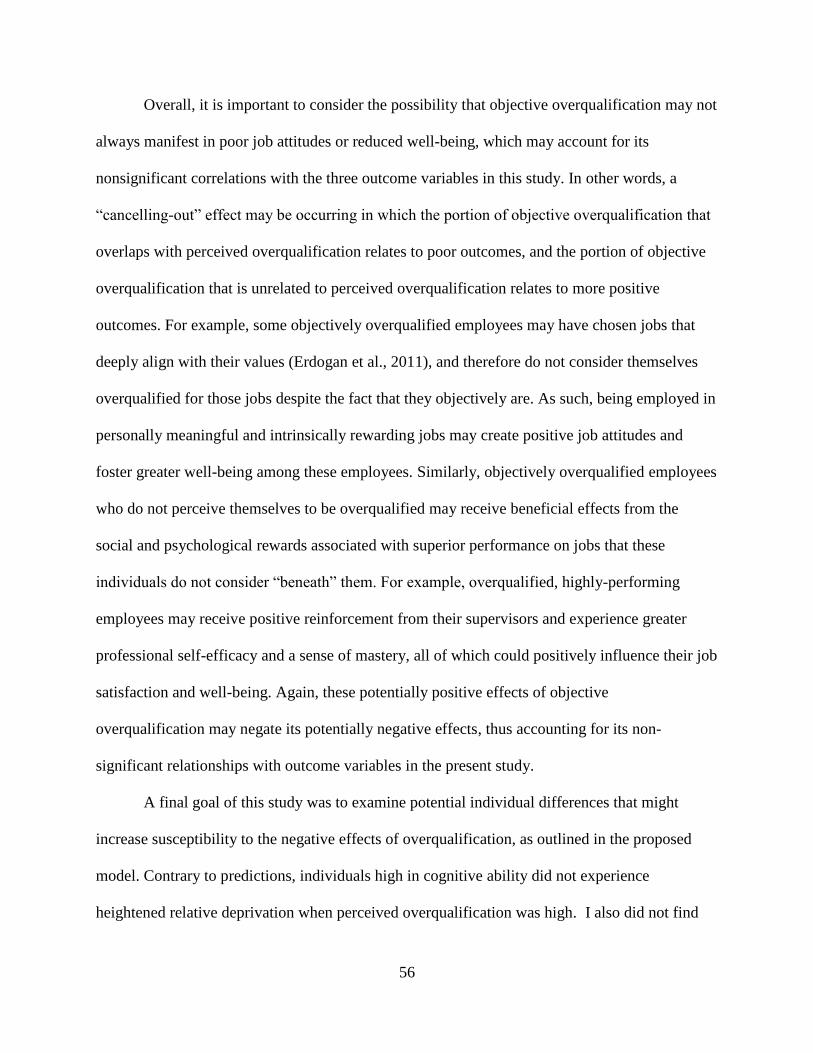
56
Overall, it is important to consider the possibility that objective overqualification may not
always manifest in poor job attitudes or reduced well-being, which may account for its
nonsignificant correlations with the three outcome variables in this study. In other words, a
“cancelling-out” effect may be occurring in which the portion of objective overqualification that
overlaps with perceived overqualification relates to poor outcomes, and the portion of objective
overqualification that is unrelated to perceived overqualification relates to more positive
outcomes. For example, some objectively overqualified employees may have chosen jobs that
deeply align with their values (Erdogan et al., 2011), and therefore do not consider themselves
overqualified for those jobs despite the fact that they objectively are. As such, being employed in
personally meaningful and intrinsically rewarding jobs may create positive job attitudes and
foster greater well-being among these employees. Similarly, objectively overqualified employees
who do not perceive themselves to be overqualified may receive beneficial effects from the
social and psychological rewards associated with superior performance on jobs that these
individuals do not consider “beneath” them. For example, overqualified, highly-performing
employees may receive positive reinforcement from their supervisors and experience greater
professional self-efficacy and a sense of mastery, all of which could positively influence their job
satisfaction and well-being. Again, these potentially positive effects of objective
overqualification may negate its potentially negative effects, thus accounting for its non-
significant relationships with outcome variables in the present study.
A final goal of this study was to examine potential individual differences that might
increase susceptibility to the negative effects of overqualification, as outlined in the proposed
model. Contrary to predictions, individuals high in cognitive ability did not experience
heightened relative deprivation when perceived overqualification was high. I also did not find
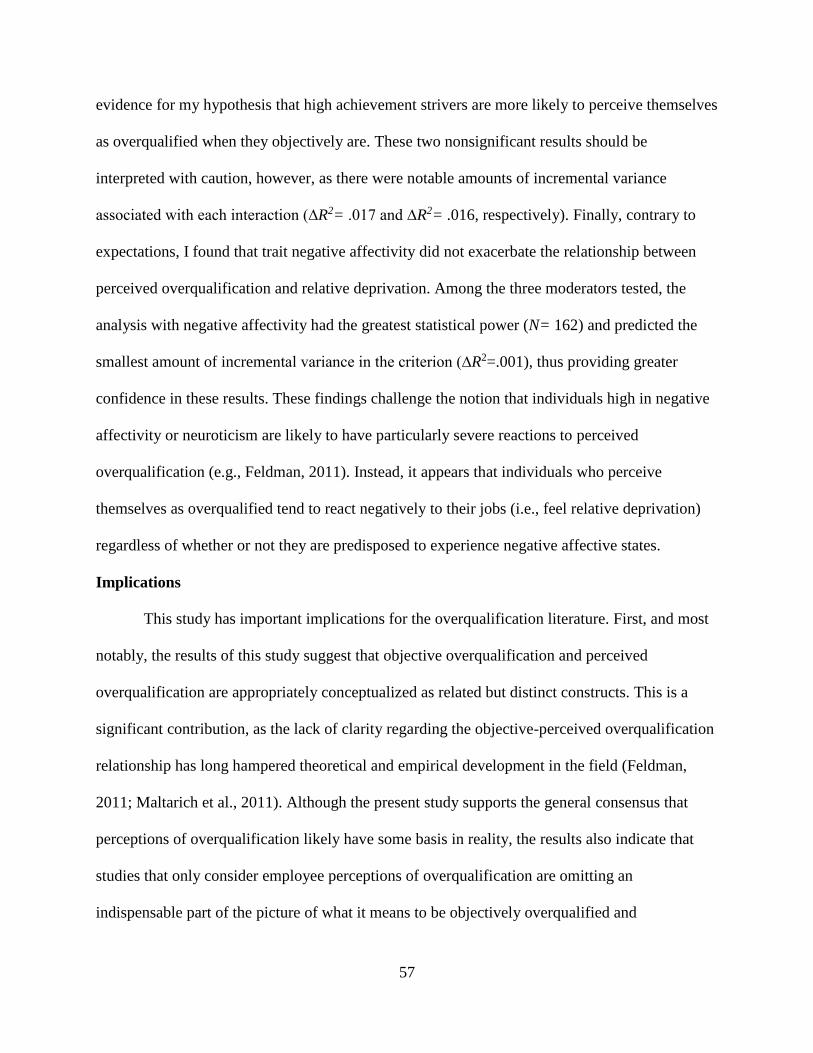
57
evidence for my hypothesis that high achievement strivers are more likely to perceive themselves
as overqualified when they objectively are. These two nonsignificant results should be
interpreted with caution, however, as there were notable amounts of incremental variance
associated with each interaction (∆R2= .017 and ∆R2= .016, respectively). Finally, contrary to
expectations, I found that trait negative affectivity did not exacerbate the relationship between
perceived overqualification and relative deprivation. Among the three moderators tested, the
analysis with negative affectivity had the greatest statistical power (N= 162) and predicted the
smallest amount of incremental variance in the criterion (∆R2=.001), thus providing greater
confidence in these results. These findings challenge the notion that individuals high in negative
affectivity or neuroticism are likely to have particularly severe reactions to perceived
overqualification (e.g., Feldman, 2011). Instead, it appears that individuals who perceive
themselves as overqualified tend to react negatively to their jobs (i.e., feel relative deprivation)
regardless of whether or not they are predisposed to experience negative affective states.
Implications
This study has important implications for the overqualification literature. First, and most
notably, the results of this study suggest that objective overqualification and perceived
overqualification are appropriately conceptualized as related but distinct constructs. This is a
significant contribution, as the lack of clarity regarding the objective-perceived overqualification
relationship has long hampered theoretical and empirical development in the field (Feldman,
2011; Maltarich et al., 2011). Although the present study supports the general consensus that
perceptions of overqualification likely have some basis in reality, the results also indicate that
studies that only consider employee perceptions of overqualification are omitting an
indispensable part of the picture of what it means to be objectively overqualified and
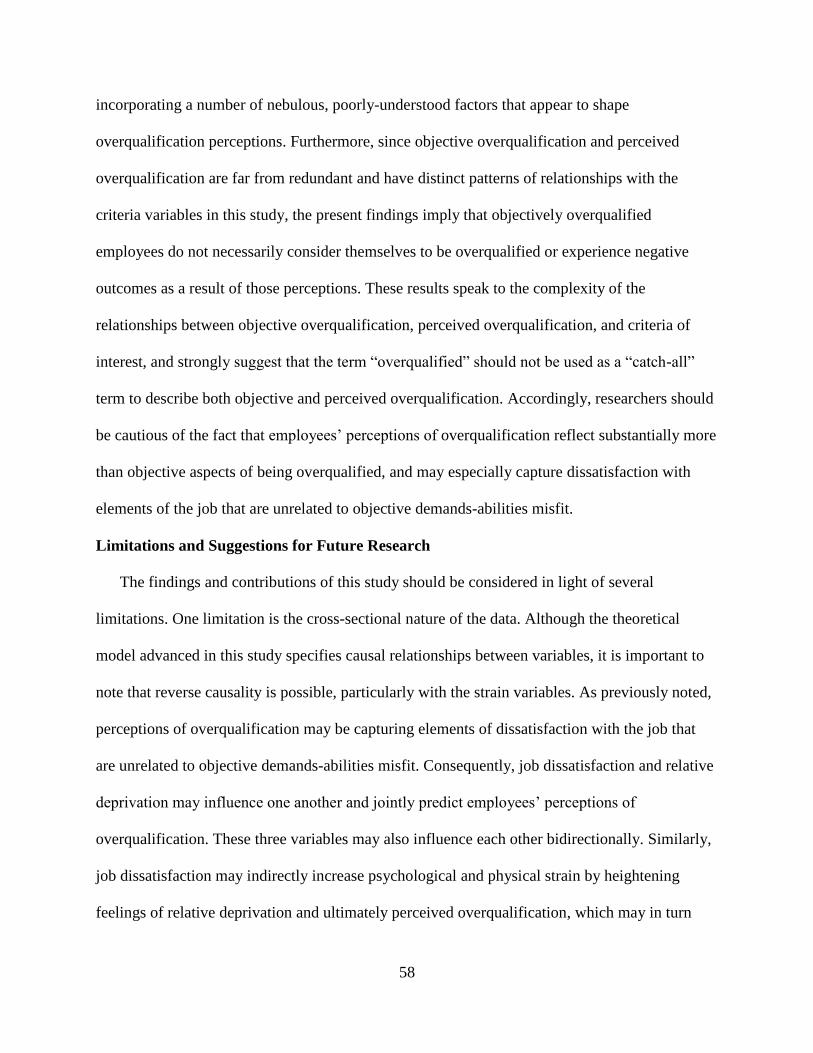
58
incorporating a number of nebulous, poorly-understood factors that appear to shape
overqualification perceptions. Furthermore, since objective overqualification and perceived
overqualification are far from redundant and have distinct patterns of relationships with the
criteria variables in this study, the present findings imply that objectively overqualified
employees do not necessarily consider themselves to be overqualified or experience negative
outcomes as a result of those perceptions. These results speak to the complexity of the
relationships between objective overqualification, perceived overqualification, and criteria of
interest, and strongly suggest that the term “overqualified” should not be used as a “catch-all”
term to describe both objective and perceived overqualification. Accordingly, researchers should
be cautious of the fact that employees’ perceptions of overqualification reflect substantially more
than objective aspects of being overqualified, and may especially capture dissatisfaction with
elements of the job that are unrelated to objective demands-abilities misfit.
Limitations and Suggestions for Future Research
The findings and contributions of this study should be considered in light of several
limitations. One limitation is the cross-sectional nature of the data. Although the theoretical
model advanced in this study specifies causal relationships between variables, it is important to
note that reverse causality is possible, particularly with the strain variables. As previously noted,
perceptions of overqualification may be capturing elements of dissatisfaction with the job that
are unrelated to objective demands-abilities misfit. Consequently, job dissatisfaction and relative
deprivation may influence one another and jointly predict employees’ perceptions of
overqualification. These three variables may also influence each other bidirectionally. Similarly,
job dissatisfaction may indirectly increase psychological and physical strain by heightening
feelings of relative deprivation and ultimately perceived overqualification, which may in turn

59
magnify feelings of relative deprivation and reduce well-being. Future research employing
longitudinal designs is necessary to establish temporal precedence between objective
overqualification, perceived overqualification, and strain outcomes, and investigate whether the
direction of effects is consistent with the causal sequence hypothesized in the present study or
better coheres with an alternative explanation.
Another limitation of this study is that it was not possible to measure all dimensions of
objective overqualification. Although assessing three dimensions of objective overqualification
is an important step forward in understanding the objective overqualification construct, future
research should also incorporate the dimensions of objective overexperience and excess
knowledge, both of which were not measured in this study. One possible avenue for gaining this
data is through supervisor reports or human resources personnel (e.g., Liu et al., 2015).
Finally, a significant limitation of this study is the fact that its tests of individual moderators
were underpowered, especially for the hypotheses involving cognitive ability (N= 116) and
achievement striving (N= 111). It is therefore possible that the moderating role of cognitive
ability in the relationship between perceived overqualification and relative deprivation was
underestimated; similarly, the nonsignificant interaction between achievement striving and
objective overqualification in predicting perceived overqualification should be interpreted with
caution. Future research should re-examine these relationships with a greater sample size in order
to draw firmer conclusions.
A key recommendation for future research is to carefully consider the roles of both
perceptions and the reality of overqualification in forming and answering research questions.
Indeed, the results of this study demonstrate that researchers otherwise risk creating an
oversimplified and potentially misleading picture of objectively overqualified employees, who

60
may not necessarily consider themselves to be overqualified or experience negative outcomes as
a result of those perceptions. These concerns are especially salient in light of the fact that hiring
decisions are necessarily based employees’ objective qualifications (Erdogan et al., 2011;
Maltarich et al., 2011). As such, the present findings should compel future researchers to
employ a more comprehensive and nuanced approach of investigating and discussing
overqualification phenomena than is typical in most existing studies.
Another important avenue for future theoretical and empirical research is to investigate
whether objective overqualification is indeed associated with greater job satisfaction and well-
being among employees who do not perceive themselves to be overqualified, and if so, the
mechanisms accounting for this positive association. The previous discussion already highlighted
two potential mechanisms; others may exist as well. By facilitating knowledge of the
circumstances in which objectively overqualified individuals do not judge themselves as being
overqualified, such research could also provide insight into the process through which
individuals come to perceive themselves as being overqualified, which is currently an open
question (Feldman, 2011). Indeed, the results of this study attest to the importance of obtaining a
clearer understanding of the factors that influence employees’ perceptions of overqualification.
Finally, it is important for future research to continue examining potential boundary
conditions of objective overqualification and perceived overqualification, both at the individual
and work-group level. For example, Hu and colleagues (2014) found that employees who
perceived that they were overqualified found their work more meaningful and significant, and
perceived better fit with their work groups, when the average level of perceived overqualification
reported by their peers was also high. In general, it would be useful to find more individual and
group-level moderators that could potentially ameliorate the association between perceived
61
overqualification and strain, including feelings of relative deprivation. Additionally, it is
important for future research to continue exploring individual- and group-level moderators that
increase or mitigate the likelihood that objective overqualification manifests in perceived
overqualification.
Conclusion
This study provides critical insight into the conceptual nature of overqualification and
helps elucidate the respective roles of objective overqualification and perceived overqualification
in predicting employee job satisfaction and well-being. As hypothesized, objective
overqualification and perceived overqualification were distinct but related constructs, and the
results from structural equation modeling were consistent with a theoretical model in which
objective overqualification predicts job dissatisfaction and physical and psychological strain
through the mediating roles of both perceived overqualification and relative deprivation.
However, the unique patterns of relationships demonstrated by objective overqualification and
perceived overqualification with strain outcomes suggest that objective overqualification may
not always manifest in negative outcomes, and that the relationships between objective
overqualification, perceived overqualification, and strain variables may be more complex than
delineated in the proposed model. Finally, there was insufficient evidence for the hypothesized
individual moderator effects. Overall, the results of the present study highlight the importance of
distinguishing objective overqualification from perceived overqualification, and suggest that
devoting greater attention to the factors that influence these two constructs and their respective
roles in predicting employee outcomes is essential to the development of the overqualification
literature and the soundness of the conclusions drawn from it.

62
References
Adams, C.J. (2014). State initiatives widen reach of ACT, SAT tests. Education Week, 34(10), 1,
10-11.
Akaike, H. (1973). Information theory and an extension of the maximum likelihood principle. In
B.N. Petrov & B.F. Csaki (Eds.), Second International Symposium on Information
Theory (pp.267-281). Budapest: Academiai Kiado.
Anderson, S., & Winefield, A. H. (2011). The impact of underemployment on psychological
health, physical health, and work attitudes. In D. C. Maynard & D.C. Feldman (Eds.),
Underemployment: Psychological, economic, and social challenges (pp.165–185). New
York, NY: Springer.
Arvey, R. D., Bouchard, T. J., Segal, N. L., & Abraham, L. M. (1989). Job satisfaction:
Environmental and genetic components. Journal of Applied Psychology, 74(2), 187-192.
Bolino, M. C., & Feldman, D. C. (2000). The antecedents and consequences of
underemployment among expatriates. Journal of Organizational Behavior, 21(8), 889-911.
Burke, R. J. 1997. Correlates of under-employment among recent business school graduates.
International Journal of Manpower, 18: 627-635.
Buunk, B. P., & Janssen, P. P. (1992). Relative deprivation, career issues, and mental health
among men in midlife. Journal of Vocational Behavior, 40(3), 338-350.
Bing, M. N., LeBreton, J. M., Davison, H., Migetz, D. Z., & James, L. R. (2007). Integrating
implicit and explicit social cognitions for enhanced personality assessment: A general
framework for choosing measurement and statistical methods. Organizational Research
Methods, 10(2), 346-389.
Brown, T. A. (2015). Confirmatory factor analysis for applied research. New York, NY:
Guilford Publications.
Byrne, B. M. (2012). Structural equation modeling with Mplus: Basic concepts, applications,
and programming. New York, NY: Routledge.
Cammann, C., Fichman, M., Jenkins, G. D., & Klesh, J. (1983). Michigan Organizational
Assessment Questionnaire. In S.E. Seashore, E.E. Lawler, P.H. Mirvis, & C. Cammann
(Eds.), Assessing organizational change: A guide to methods, measures, and practices (pp.
71-138). New York; Wiley-Interscience.
Cheung, G. W., & Lau, R. S. (2008). Testing mediation and suppression effects of latent
variables: Bootstrapping with structural equation models. Organizational Research
Methods, 11(2), 296-325.
Coffman, D. L., & MacCallum, R. C. (2005). Using parcels to convert path analysis models into
latent variable models. Multivariate Behavioral Research, 40(2), 235-259.
Costa, P. T., McCrae, R. R., & Dye, D. A. (1991). Facet scales for agreeableness and
conscientiousness: a revision of the NEO personality inventory. Personality and Individual
Differences, 12(9), 887-898.
63
Costa, P. T., & McCrae, R. R. (1992). Revised NEO Personality Inventory (NEO-PI-R) and NEO
Five-Factor Inventory (NEO-FFI) professional manual. Odessa, FL: Psychological
Assessment Resources.
Crosby, F. (1976). A model of egoistical relative deprivation. Psychological Review, 83(2), 85-
113.
Dudley, N. M., Orvis, K. A., Lebiecki, J. E., & Cortina, J. M. (2006). A meta-analytic
investigation of conscientiousness in the prediction of job performance: examining the
intercorrelations and the incremental validity of narrow traits. Journal of Applied
Psychology, 91(1), 40-57.
Edwards JR. (1991). Person-job fit: A conceptual integration, literature review and
methodological critique. In C.L. Cooper and I.T. Robertson (Eds.), International review
of industrial/organizational psychology, (Vol. 6, pp. 283-357). London: Wiley.
Edwards, J. R. (1996). An examination of competing versions of the person-environment fit
approach to stress. Academy of Management Journal, 39(2), 292-339.
Edwards, J. R., & Van Harrison, R. (1993). Job demands and worker health: Three-dimensional
reexamination of the relationship between person-environment fit and strain. Journal of
Applied Psychology, 78(4), 628-648.
Erdogan, B., & Bauer, T. N. (2009). Perceived overqualification and its outcomes: the
moderating role of empowerment. Journal of Applied Psychology, 94(2), 557-565.
Erdogan, B., Bauer, T. N., Peiro, J., & Truxillo, D. M. (2011). Overqualified employees: Making
the best of a potentially bad situation for individuals and organizations. Industrial and
Organizational Psychology, 4(2), 215-232.
Feldman, D. C. (1996). The nature, antecedents and consequences of underemployment. JournaL
of Management, 22(3), 385-407.
Feldman, D. C. (2011). Theoretical frontiers for underemployment research. In D. C. Maynard &
D.C. Feldman (Eds.), Underemployment: Psychological, economic, and social challenges
(pp.277–305). New York, NY: Springer.
Feldman, D. C., Leana, C. R., & Bolino, M. C. (2002). Underemployment and relative
deprivation among re‐employed executives. Journal of Occupational and Organizational
Psychology, 75(4), 453-471.
Feldman, D. C., & Turnley, W. H. (1995). Underemployment among recent business college
graduates. Journal of Organizational Behavior, 16(S1), 691-706.
Feldman, D. C., & Turnley, W. H. (2004). Contingent employment in academic careers: Relative
deprivation among adjunct faculty. Journal of Vocational Behavior, 64(2), 284-307.
Fine, S., & Nevo, B. (2008). Too smart for their own good? A study of perceived cognitive
overqualification in the workforce. The International Journal of Human Resource
Management, 19(2), 346-355.
Fisher, G. G., Stachowski, A., Infurna, F. J., Faul, J. D., Grosch, J., & Tetrick, L. E. (2014).
Mental work demands, retirement, and longitudinal trajectories of cognitive
functioning. Journal of Occupational Health Psychology, 19(2), 231-242.
Frey, M. C., & Detterman, D. K. (2004). Scholastic assessment or g? The relationship between
the scholastic assessment test and general cognitive ability. Psychological Science, 15(6),
373-378.
Friedland, D. S., & Price, R. H. (2003). Underemployment: Consequences for the health and
well-being of workers. American Journal of Community Psychology, 32(1-2), 33-45.

64
Ganzach, Y. (1998). Intelligence and job satisfaction. Academy of Management Journal, 41(5),
526-539.
Goldberg, L. R. (1999). A broad-bandwidth, public domain, personality inventory measuring the
lower-level facets of several five-factor models. In I. Mervielde, I. Deary, F. De Fruyt, &
F. Ostendorf (Eds.), Personality psychology in Europe, Vol. 7 (pp. 7-28). Tilburg, The
Netherlands: Tilburg University Press.
Goldberg, D. P., & Williams, P.(1991). A user’s guide to the General Health Questionnaire.
Windsor: NFER-Nelson.
Gottfredson, L. S. (1997). Why g matters: The complexity of everyday life. Intelligence, 24(1),
79-132.
Graham, J.W., & Coffman, D.L. (2012). Structural equation modeling with missing data. In R.H.
Hoyle (Ed.), Handbook of structural equation modeling (pp.277-294). New York, NY:
Guilford Press.
Johnson, G. J., & Johnson, W. R. (1996). Perceived overqualification and psychological well-
being. The Journal of Social Psychology, 136(4), 435-445.
Johnson, G. J., & Johnson, W. R. (1997). Perceived overqualification, emotional support, and
health. Journal of Applied Social Psychology, 27(21), 1906-1918.
Johnson, G. J., & Johnson, W. R. (1999). Perceived overqualification and health: A longitudinal
analysis. The Journal of Social Psychology, 139(1), 14-28.
Johnson, G. J., & Johnson, W. R. (2000). Perceived overqualification, positive and negative
affectivity, and satisfaction with work. Journal of Social Behavior & Personality, 15(2),
167-184
Johnson, W. R., Morrow, P. C., & Johnson, G. J. (2002). An evaluation of a perceived
overqualification scale across work settings. The Journal of Psychology, 136(4), 425-441.
Keith, P. M., & Schafer, R. B. (1985). Role behavior, relative deprivation, and depression among
women in one-and two-job families. Family Relations, 34, 227-233.
Koenig, K. A., Frey, M. C., & Detterman, D. K. (2008). ACT and general cognitive ability.
Intelligence, 36(2), 153-160.
Kristof‐Brown, A. L., Zimmerman, R. D., & Johnson, E. C. (2005). Consequences of
individuals’ fit at work: A meta-analysis of person-job, person-organization, person-
group, and person-supervisor fit. Personnel Psychology, 58(2), 281-342.
Lee, I. A., & Preacher, K. J. (2013, September). Calculation for the test of the difference between
two dependent correlations with one variable in common [Computer software]. Available
from http://quantpsy.org.
Lewin, T. (2013, August 2). Testing, testing: More students are taking both the ACT and SAT.
Retrieved from http://www.nytimes.com/2013/08/04/education/edlife/more-students-are-
taking- both-the-act-and-sat.html
Little, T. D., Cunningham, W. A., Shahar, G., & Widaman, K. F. (2002). To parcel or not to
parcel: Exploring the question, weighing the merits. Structural Equation Modeling, 9(2),
151-173.
Little, T. D., Rhemtulla, M., Gibson, K., & Schoemann, A. M. (2013). Why the items versus
parcels controversy needn’t be one. Psychological Methods, 18(3), 285-300.
Liu, C., Spector, P., & Jex, S. (2005). The relation of job control with job strains: A comparison
of multiple data sources. Journal of Occupational and Organizational Psychology, 78(3),
325-336.
65
Liu, S., & Wang, M. (2012). Perceived Overqualification: A Review and Recommendations for
Research and Practice. In P. L. Perrewé, J. Halbesleben, & C. C. Rosen (Eds.), The Role
of the Economic Crisis on Occupational Stress and Well Being (Vol. 10, pp.1-42).
Bingley, UK: Emerald Group Publishing.
Loukidou, L., Loan‐Clarke, J., & Daniels, K. (2009). Boredom in the workplace: More than
monotonous tasks. International Journal of Management Reviews, 11(4), 381-405.
Luksyte, A., & Spitzmueller, C. Behavioral Science Approaches to Studying Underemployment.
In D. C. Maynard & D.C. Feldman (Eds.), Underemployment: Psychological, economic,
and social challenges (pp.35–56). New York, NY: Springer.
MacKinnon, D. P., Krull, J. L., & Lockwood, C. M. (2000). Equivalence of the mediation,
confounding and suppression effect. Prevention Science, 1(4), 173-181.
MacKinnon, D.P. (2008). Introduction to statistical mediation analysis. New York, NY:
Lawrence Erlbaum Associates.
Maltarich, M. A., Nyberg, A. J., & Reilly, G. (2010). A conceptual and empirical analysis of the
cognitive ability–voluntary turnover relationship. Journal of Applied Psychology, 95(6),
1058-1070.
Maltarich, M. A., Reilly, G., & Nyberg, A. J. (2011). Objective and subjective overqualification:
Distinctions, relationships, and a place for each in the literature. Industrial and
Organizational Psychology, 4(2), 236-239.
Marsh, H. W., Lüdtke, O., Nagengast, B., Morin, A. J., & Von Davier, M. (2013). Why item
parcels are (almost) never appropriate: Two wrongs do not make a right—Camouflaging
misspecification with item parcels in CFA models. Psychological Methods, 18(3), 257.
Maynard, D. C., Brondolo, E. M., Connelly, C. E., & Sauer, C. E. (2015). I'm too good for this
job: Narcissism's role in the experience of overqualification. Applied Psychology, 64(1),
208-232.
Maynard, D. C., Joseph, T. A., & Maynard, A. M. (2006). Underemployment, job attitudes, and
turnover intentions. Journal of Organizational Behavior, 27(4), 509-536.
Maynard, D. C., & Parfyonova, N. M. (2013). Perceived overqualification and withdrawal
behaviours: Examining the roles of job attitudes and work values. Journal of
Occupational and Organizational Psychology, 86(3), 435-455.
McKee-Ryan, F. M., & Harvey, J. (2011). “I have a job, but...”: A review of underemployment.
Journal of Management, 37(4), 962-996.
McKee‐Ryan, F. M., Virick, M., Prussia, G. E., Harvey, J., & Lilly, J. D. (2009). Life after the
layoff: Getting a job worth keeping. Journal of Organizational Behavior, 30(4), 561-580.
Moon, H. (2001). The two faces of conscientiousness: duty and achievement striving in
escalation of commitment dilemmas. Journal of Applied Psychology, 86(3), 533-540.
Muthén, L.K. and Muthén, B.O. (1998-2012). Mplus User’s Guide. Seventh Edition. Los
Angeles, CA: Muthén & Muthén.
Nabi, G. R. (2003). Graduate employment and underemployment: opportunity for skill use and
career experiences amongst recent business graduates. Education+ Training, 45(7), 371-
382.
Navarro, M. L. A., Mas, M. B., & Jiménez, A. M. L. (2010). Working conditions, burnout and
stress symptoms in university professors: validating a structural model of the mediating
effect of perceived personal competence. The Spanish Journal of Psychology, 13(01),
284-296.

66
O'Brien, G. E., & Feather, N. T. (1990). The relative effects of unemployment and quality of
employment on the affect, work values and personal control of adolescents. Journal of
Occupational Psychology, 63(2), 151-165.
Penney, L. M., & Spector, P. E. (2005). Job stress, incivility, and counterproductive work
behavior (CWB): The moderating role of negative affectivity. Journal of Organizational
Behavior, 26(7), 777-796.
Roberts, B. W., Chernyshenko, O. S., Stark, S., & Goldberg, L. R. (2005). The structure of
conscientiousness: An empirical investigation based on seven major personality
questionnaires. Personnel Psychology, 58(1), 103-139.
Satorra, A., & Bentler, P. M. (2001). A scaled difference chi-square test statistic for moment
structure analysis. Psychometrika, 66, 507-514.
Soper, D.S. (2015). A-priori Sample Size Calculator for Hierarchical Multiple Regression
[Software]. Available from http://www.danielsoper.com/statcalc.
Spector, P. E., & Jex, S. M. (1991). Relations of job characteristics from multiple data sources
with employee affect, absence, turnover intentions, and health. Journal of Applied
Psychology, 76(1), 46-53.
Spector, P. E., & Jex, S. M. (1998). Developmental of four self-report measures of job stressors
and strain: Interpersonal conflict at work scale, organizational constraints scale,
quantitative workload inventory, and physical symptoms inventory. Journal of
Occupational Health Psychology, 3 (4), 356-367.
Spector, P. E., & O'Connell, B. J. (1994). The contribution of personality traits, negative
affectivity, locus of control and Type A to the subsequent reports of job stressors and job
strains. Journal of Occupational and Organizational Psychology, 67(1), 1-12.
Spector, P. E., Zapf, D., Chen, P. Y., & Frese, M. (2000). Why negative affectivity should not be
controlled in job stress research: don't throw out the baby with the bath water. Journal of
Organizational Behavior, 21(1), 79-95.
Stawski, R. S., Almeida, D. M., Lachman, M. E., Tun, P. A., & Rosnick, C. B. (2010). Fluid
cognitive ability is associated with greater exposure and smaller reactions to daily
stressors. Psychology and Aging, 25(2), 330-342.
Steiger, J. H. (1980). Tests for comparing elements of a correlation matrix. Psychological
Bulletin, 87(2), 245-251
Stouffer, S. A., Suchman, E. A., DeVinney, L. C., Star, S. A., & Williams, R. M. (1949). The
American soldier: Adjustment during army life. Princeton, NJ: Princeton University
Press.
Teicher Khadaroo, S. (2015, September 3). As states change use of SAT and ACT,
disadvantaged students get boost. Retrieved from http://www.csmonitor.com/USA/
Education/2015/0903/As-states-change-use-of-SAT-and-ACT-disadvantaged-students-
get-boost
U.S. Bureau of Labor Statistics (2013). http://www.bls.gov/emp/ep_definitions_edtrain.pdf
U.S. Bureau of Labor Statistics (2014). Table 501.50: Employment to population ratios of
persons 16 to 64 years old, by age group and highest level of educational attainment:
Selected years, 1975 through 2014. Retrieved from http://nces.ed.gov/programs/digest/
d14/tables/dt14_501.50.asp
U.S. Department of Labor (1965). Dictionary of occupational titles (3rd ed.). Washington, DC:
U.S. Government Printing Office.
67
van Dierendonck, D., Garssen, B., & Visser, A. (2005). Burnout prevention through personal
growth. International Journal of Stress Management, 12(1), 62-77.
Verhaest, D., & Omey, E. (2006). The impact of overeducation and its measurement. Social
Indicators Research, 77(3), 419-448.
Watson, D., & Clark, L. A. (1984). Negative affectivity: the disposition to experience aversive
emotional states. Psychological Bulletin, 96(3), 465-490.
Watson, D., Clark, L. A., & Tellegen, A. (1988). Development and validation of brief measures
of positive and negative affect: the PANAS scales. Journal of Personality and Social
Psychology, 54(6), 1063-1070.
Watson, D., & Pennebaker, J. W. (1989). Health complaints, stress, and distress: exploring the
central role of negative affectivity. Psychological Review, 96(2), 234-254.
Watt, J. D., & Hargis, M. B. (2010). Boredom proneness: Its relationship with subjective
underemployment, perceived organizational support, and job performance. Journal of
Business and Psychology, 25(1), 163-174.
Wilk, S. L., Desmarais, L. B., & Sackett, P. R. (1995). Gravitation to jobs commensurate with
ability: Longitudinal and cross-sectional tests. Journal of Applied Psychology, 80(1), 79-
85.
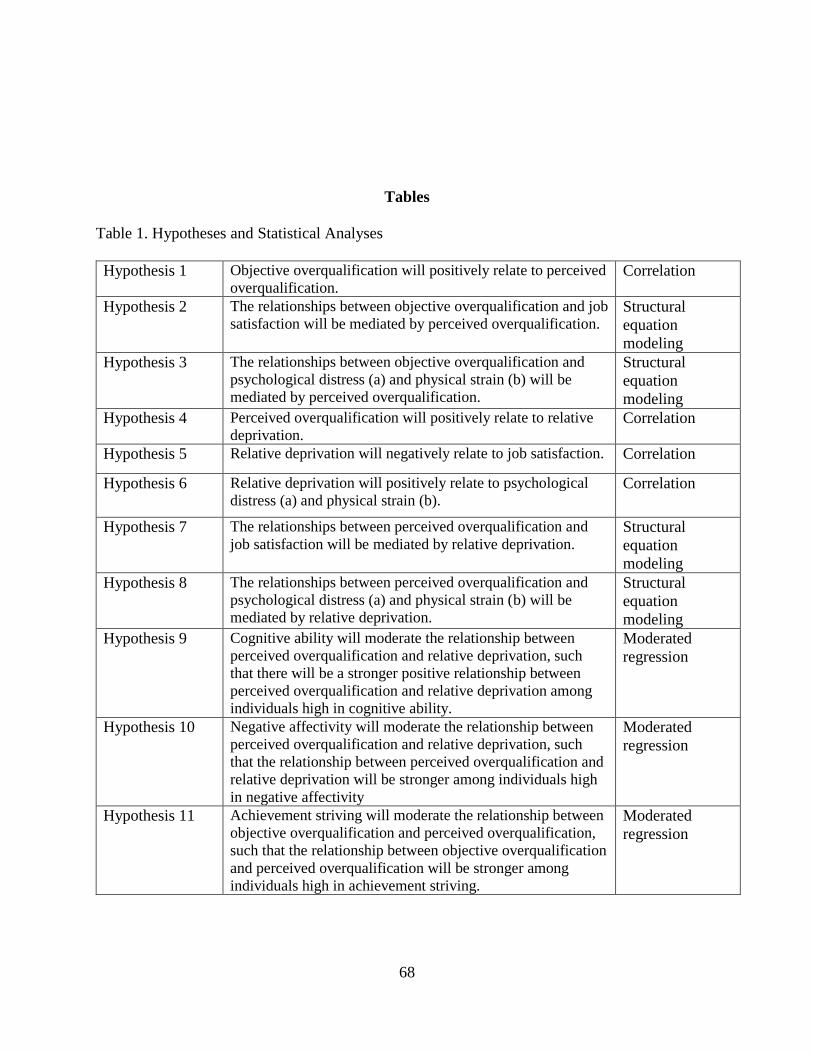
68
Tables
Table 1. Hypotheses and Statistical Analyses
Hypothesis 1 Objective overqualification will positively relate to perceived
overqualification. Correlation
Hypothesis 2 The relationships between objective overqualification and job
satisfaction will be mediated by perceived overqualification. Structural
equation
modeling
Hypothesis 3 The relationships between objective overqualification and
psychological distress (a) and physical strain (b) will be
mediated by perceived overqualification.
Structural
equation
modeling
Hypothesis 4 Perceived overqualification will positively relate to relative
deprivation. Correlation
Hypothesis 5 Relative deprivation will negatively relate to job satisfaction. Correlation
Hypothesis 6 Relative deprivation will positively relate to psychological
distress (a) and physical strain (b). Correlation
Hypothesis 7 The relationships between perceived overqualification and
job satisfaction will be mediated by relative deprivation. Structural
equation
modeling
Hypothesis 8 The relationships between perceived overqualification and
psychological distress (a) and physical strain (b) will be
mediated by relative deprivation.
Structural
equation
modeling
Hypothesis 9 Cognitive ability will moderate the relationship between
perceived overqualification and relative deprivation, such
that there will be a stronger positive relationship between
perceived overqualification and relative deprivation among
individuals high in cognitive ability.
Moderated
regression
Hypothesis 10 Negative affectivity will moderate the relationship between
perceived overqualification and relative deprivation, such
that the relationship between perceived overqualification and
relative deprivation will be stronger among individuals high
in negative affectivity
Moderated
regression
Hypothesis 11 Achievement striving will moderate the relationship between
objective overqualification and perceived overqualification,
such that the relationship between objective overqualification
and perceived overqualification will be stronger among
individuals high in achievement striving.
Moderated
regression
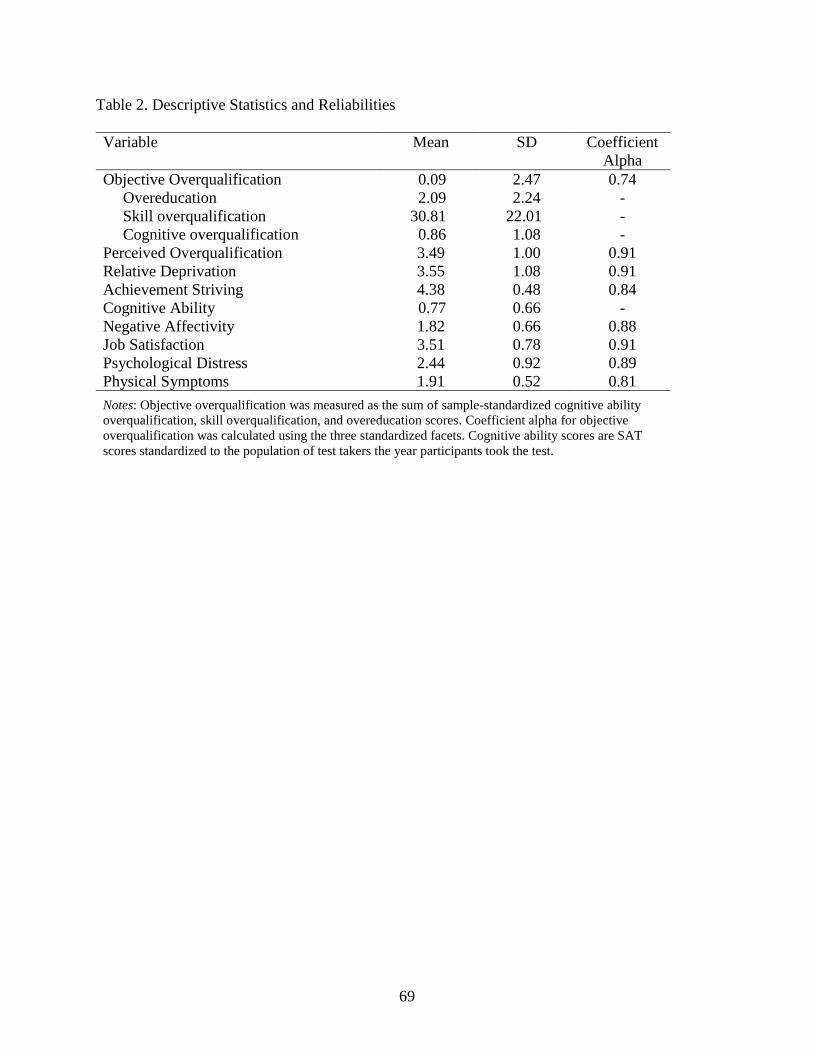
69
Table 2. Descriptive Statistics and Reliabilities
Variable Mean SD Coefficient
Alpha
Objective Overqualification 0.09 2.47 0.74
Overeducation 2.09 2.24 -
Skill overqualification 30.81 22.01 -
Cognitive overqualification 0.86 1.08 -
Perceived Overqualification 3.49 1.00 0.91
Relative Deprivation 3.55 1.08 0.91
Achievement Striving 4.38 0.48 0.84
Cognitive Ability 0.77 0.66 -
Negative Affectivity 1.82 0.66 0.88
Job Satisfaction 3.51 0.78 0.91
Psychological Distress 2.44 0.92 0.89
Physical Symptoms 1.91 0.52 0.81
Notes: Objective overqualification was measured as the sum of sample-standardized cognitive ability
overqualification, skill overqualification, and overeducation scores. Coefficient alpha for objective
overqualification was calculated using the three standardized facets. Cognitive ability scores are SAT
scores standardized to the population of test takers the year participants took the test.
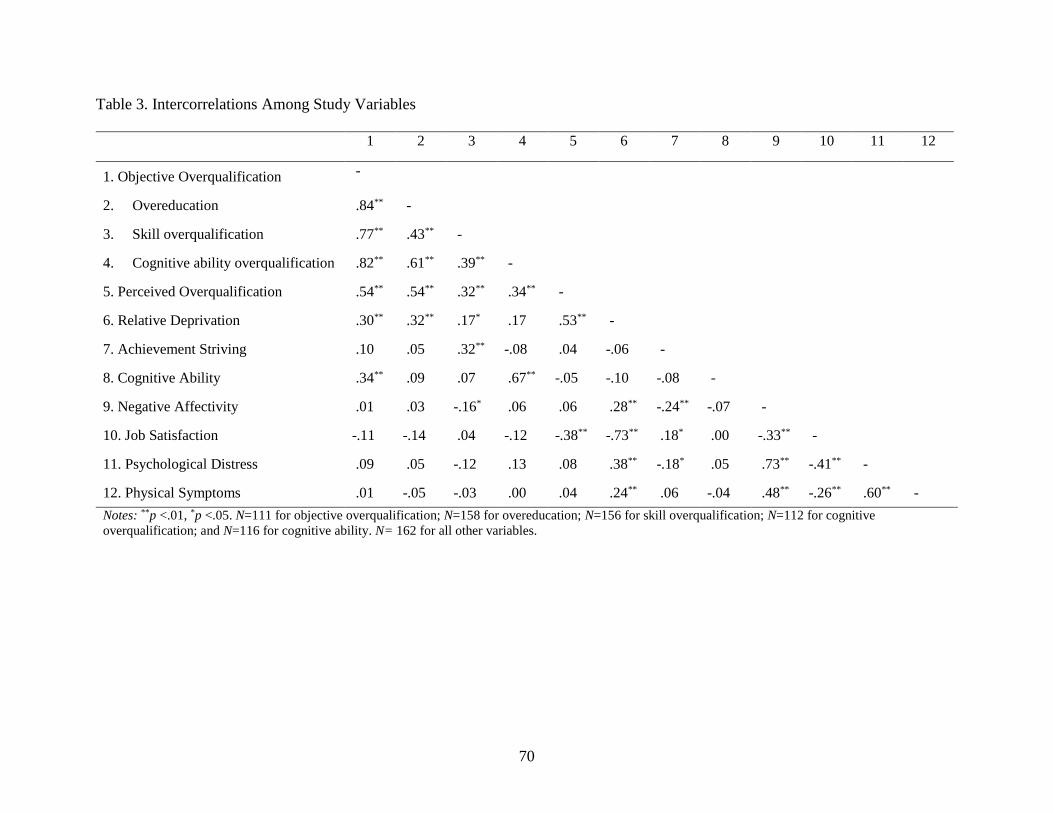
70
Table 3. Intercorrelations Among Study Variables
1 2 3 4 5 6 7 8 9 10 11 12
1. Objective Overqualification -
2. Overeducation .84** -
3. Skill overqualification .77** .43** -
4. Cognitive ability overqualification .82** .61** .39** -
5. Perceived Overqualification .54** .54** .32** .34** -
6. Relative Deprivation .30** .32** .17* .17 .53** -
7. Achievement Striving .10 .05 .32** -.08 .04 -.06 -
8. Cognitive Ability .34** .09 .07 .67** -.05 -.10 -.08 -
9. Negative Affectivity .01 .03 -.16* .06 .06 .28** -.24** -.07 -
10. Job Satisfaction -.11 -.14 .04 -.12 -.38** -.73** .18* .00 -.33** -
11. Psychological Distress .09 .05 -.12 .13 .08 .38** -.18* .05 .73** -.41** -
12. Physical Symptoms .01 -.05 -.03 .00 .04 .24** .06 -.04 .48** -.26** .60** -
Notes: **p <.01, *p <.05. N=111 for objective overqualification; N=158 for overeducation; N=156 for skill overqualification; N=112 for cognitive
overqualification; and N=116 for cognitive ability. N= 162 for all other variables.

71
Table 4. Model Fit Statistics
Model description χ2 df Td CFI ∆CFI TLI RMSEA 90% CI:
RMSEA
AIC
Hypothesized model 376.93** 184 - .900 - .885 .08 .069, .092 9320.33
Model with individual differences as antecedents of
perceived overqualification
411.54** 182 - .822 - .798 .104 .091, .118 5042.82
Model with direct effects of objective
overqualification (Final model)
365.03** 181 11.17* .904 .004 .889 .079 .067, .091 9313.42
Note: *p < .05, **p < .01. Td = Satorra-Bentler scaled chi-square difference test for nested models; CFI = comparative fit index; TLI – Tucker-Lewis index of
fit; RMSEA = root mean square error of approximation; AIC= Akaike Information Criterion. The AIC for the model with individual differences should not be
compared to the other models, as this model has a different variance-covariance matrix and therefore a different metric to calculate the AIC.
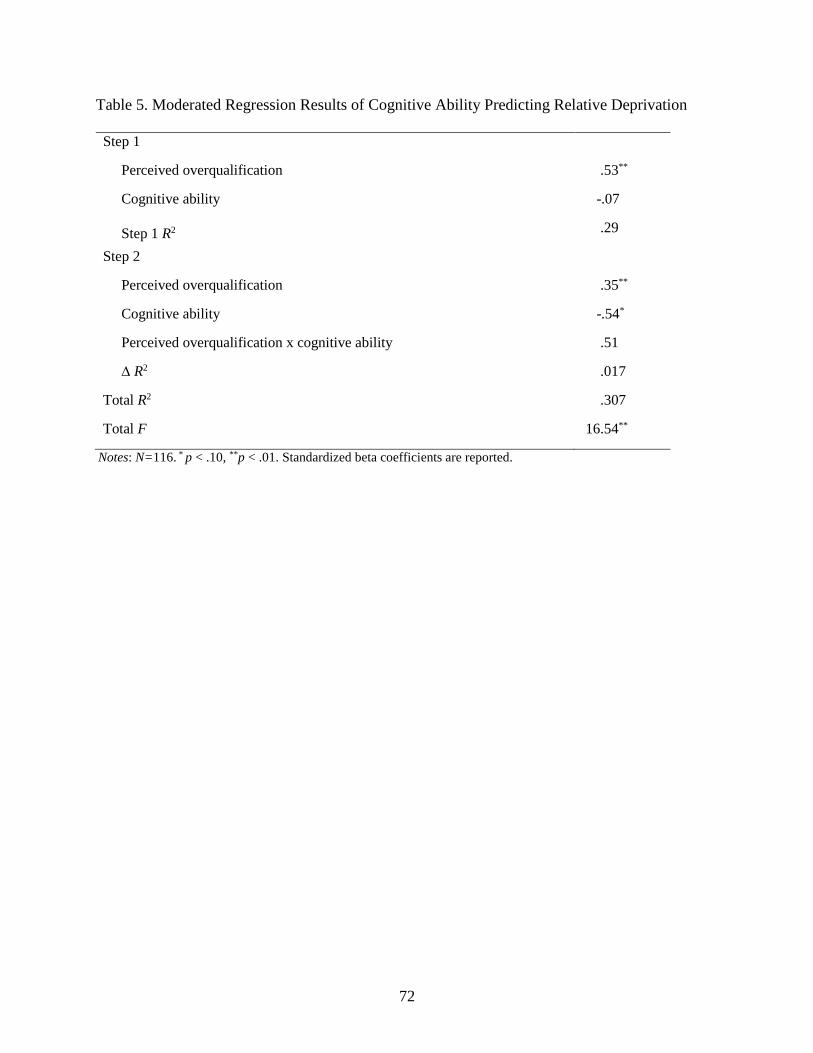
72
Table 5. Moderated Regression Results of Cognitive Ability Predicting Relative Deprivation
Step 1
Perceived overqualification .53**
Cognitive ability -.07
Step 1 R2 .29
Step 2
Perceived overqualification .35**
Cognitive ability -.54*
Perceived overqualification x cognitive ability .51
∆ R2 .017
Total R2 .307
Total F 16.54**
Notes: N=116. * p < .10, **p < .01. Standardized beta coefficients are reported.

73
Table 6. Moderated Regression Results of Negative Affectivity Predicting Relative Deprivation
Step 1
Perceived overqualification .51**
Negative affectivity .25**
Step 1 R2 .339
Step 2
Perceived overqualification .41*
Negative affectivity .11
Perceived overqualification x negative affectivity .18
∆ R2 .001
Total R2 .341
Total F 27.19**
Notes: N= 162. * p < .05, **p < .01. Standardized beta coefficients are reported.
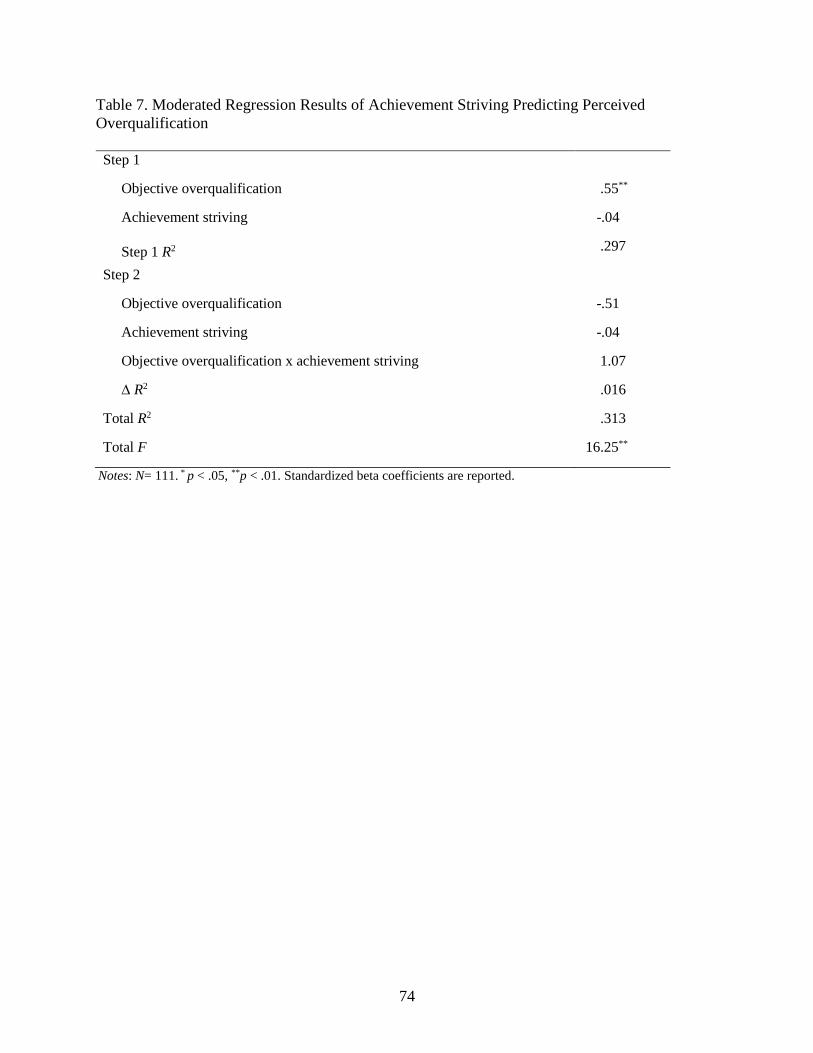
74
Table 7. Moderated Regression Results of Achievement Striving Predicting Perceived
Overqualification
Step 1
Objective overqualification .55**
Achievement striving -.04
Step 1 R2 .297
Step 2
Objective overqualification -.51
Achievement striving -.04
Objective overqualification x achievement striving 1.07
∆ R2 .016
Total R2 .313
Total F 16.25**
Notes: N= 111. * p < .05, **p < .01. Standardized beta coefficients are reported.
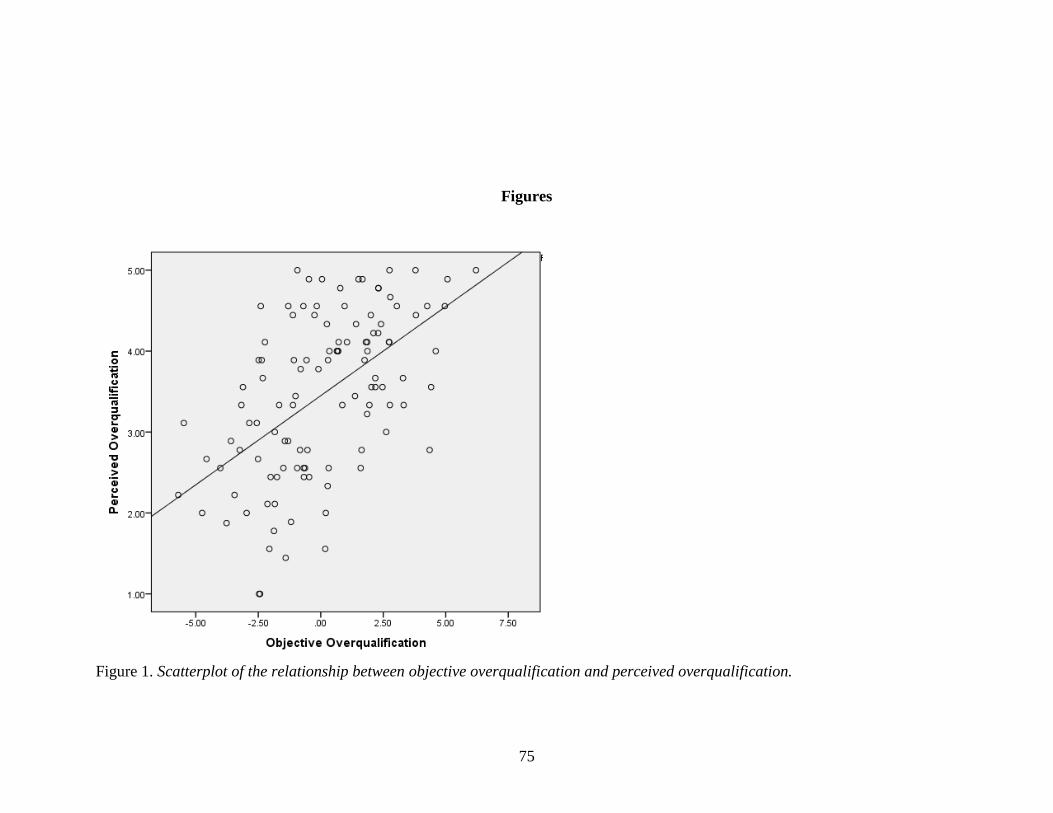
75
Figures
Figure 1. Scatterplot of the relationship between objective overqualification and perceived overqualification.
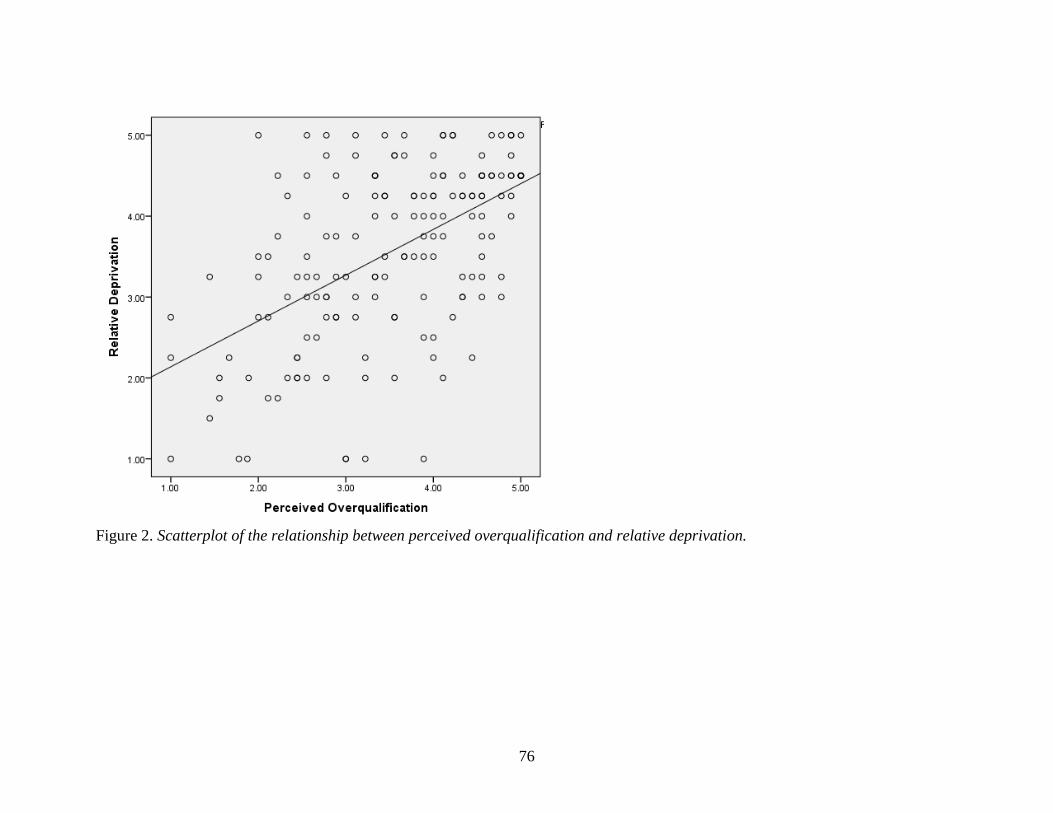
76
Figure 2. Scatterplot of the relationship between perceived overqualification and relative deprivation.
77
Figure 3. Scatterplot of the relationship between relative deprivation and job satisfaction.
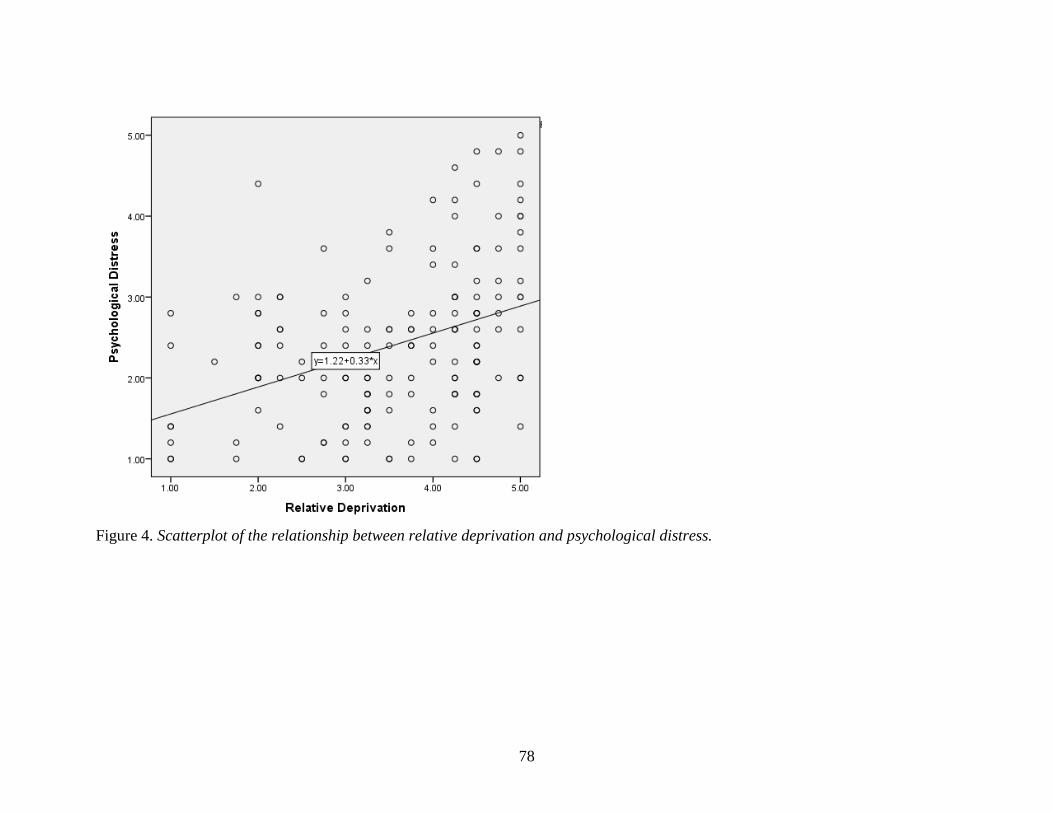
78
Figure 4. Scatterplot of the relationship between relative deprivation and psychological distress.
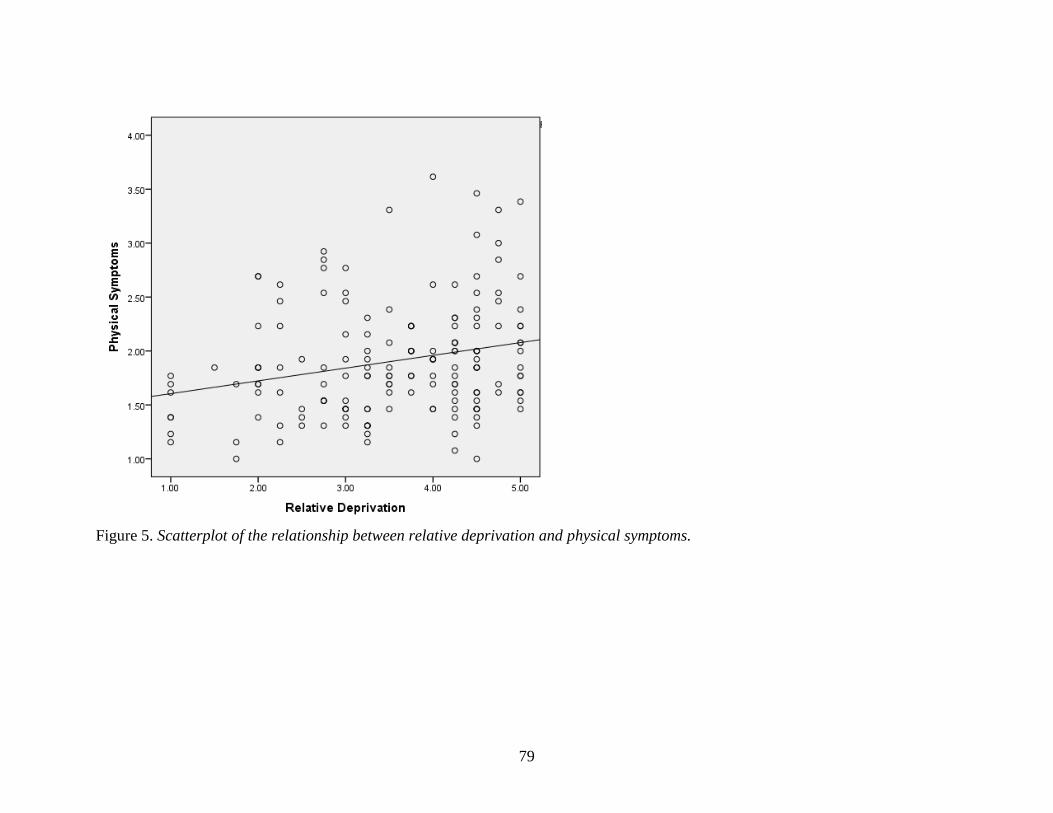
79
Figure 5. Scatterplot of the relationship between relative deprivation and physical symptoms.

80
Figure 6. SEM results for the hypothesized model. **p< .01. Standardized coefficients are reported. χ2(184)= 376.93**, CFI= .90, TLI=
.885, RMSEA= .08, AIC= 9320.33.

81
Figure 7. SEM results for the alternative model with direct effects of objective overqualification on outcomes. *p < .05, **p < .01.
Standardized coefficients are reported. χ2(181)= 365.03**, CFI= .904, TLI= .889, RMSEA= .079, AIC= 9313.42.

82
Appendices

83
Appendix A: O*NET Skills
Response options range from 1 (“This is not a skill of mine”) to 5 (“I am excellent at this skill”)
The following items include a wide variety of skills individuals may have. Please rate the extent
to which you have each skill.
1. Active Learning- Understanding the implications of new information for both current and
future problem-solving and decision-making.
2. Active Listening- Giving full attention to what other people are saying, taking time to
understand the points being made, asking questions as appropriate, and not interrupting at
inappropriate times.
3. Critical Thinking — Using logic and reasoning to identify the strengths and weaknesses of
alternative solutions, conclusions or approaches to problems.
4. Learning Strategies — Selecting and using training/instructional methods and procedures
appropriate for the situation when learning or teaching new things.
5. Mathematics — Using mathematics to solve problems.
6. Monitoring — Monitoring/Assessing performance of yourself, other individuals, or
organizations to make improvements or take corrective action.
7. Reading Comprehension — Understanding written sentences and paragraphs in work related
documents.
8. Science — Using scientific rules and methods to solve problems.
9. Speaking — Talking to others to convey information effectively.
10. Writing — Communicating effectively in writing as appropriate for the needs of the
audience.
11. Complex Problem Solving — Identifying complex problems and reviewing related
information to develop and evaluate options and implement solutions.
12. Management of Financial Resources — Determining how money will be spent to get the
work done, and accounting for these expenditures.
13. Management of Material Resources — Obtaining and seeing to the appropriate use of
equipment, facilities, and materials needed to do certain work.
14. Management of Personnel Resources — Motivating, developing, and directing people as they
work, identifying the best people for the job.
15. Time Management — Managing one's own time and the time of others.
16. Coordination — Adjusting actions in relation to others' actions.
17. Instructing — Teaching others how to do something.
18. Negotiation — Bringing others together and trying to reconcile differences.
19. Persuasion — Persuading others to change their minds or behavior.
20. Service Orientation — Actively looking for ways to help people.
21. Social Perceptiveness — Being aware of others' reactions and understanding why they react
as they do.
22. Judgment and Decision Making — Considering the relative costs and benefits of potential
actions to choose the most appropriate one.
23. Systems Analysis — Determining how a system should work and how changes in conditions,
operations, and the environment will affect outcomes.

84
24. Systems Evaluation — Identifying measures or indicators of system performance and the
actions needed to improve or correct performance, relative to the goals of the system.
25. Equipment Maintenance — Performing routine maintenance on equipment and determining
when and what kind of maintenance is needed.
26. Equipment Selection — Determining the kind of tools and equipment needed to do a job.
27. Installation — Installing equipment, machines, wiring, or programs to meet specifications.
28. Operation and Control — Controlling operations of equipment or systems.
29. Operation Monitoring — Watching gauges, dials, or other indicators to make sure a machine
is working properly.
30. Operations Analysis — Analyzing needs and product requirements to create a design.
31. Programming — Writing computer programs for various purposes.
32. Quality Control Analysis — Conducting tests and inspections of products, services, or
processes to evaluate quality or performance.
33. Repairing — Repairing machines or systems using the needed tools.
34. Technology Design — Generating or adapting equipment and technology to serve user
needs.
35. Troubleshooting — Determining causes of operating errors and deciding what to do about it.
Source: Occupational Information Network (O*NET; http://www.onetonline.org/skills/)

85
Appendix B: Perceived Overqualification
Response options: 1= “Strongly Disagree,” 2= Disagree,” 3= “Neutral,” 4= “Agree,” 5=
“Strongly Agree”
Please reflect the response which best reflects how you feel.
1. My job requires less education than I have.
2. The work experience that I have is not necessary to be successful on this job.
3. I have job skills that are not required for this job.
4. Someone with less education than myself could perform well on this job.
5. My previous training is not being fully utilized on this job.
6. I have a lot of knowledge that I do not need in order to do my job.
7. My education level is above the education level required by my job.
8. Someone with less experience than myself could do my job just as well.
9. I have more abilities than I need in order to do my job.
Source: SPOQ; Maynard, Joseph, and Maynard (2006)

86
Appendix C: Relative Deprivation
Response options: 1= “Strongly Disagree,” 2= Disagree,” 3= “Neutral,” 4= “Agree,” 5=
“Strongly Agree”
Please reflect on your own experiences, qualifications, and goals in order to answer the questions
below.
1. I want a better job situation than the one I have now.
2. I think I ought to have a better job situation than the one I have now.
3. I am angry or upset about my current job situation.
4. I think I will be more satisfied with another job situation when compared to my current one.
Source: Feldman and Turnley (2004); last item self-developed
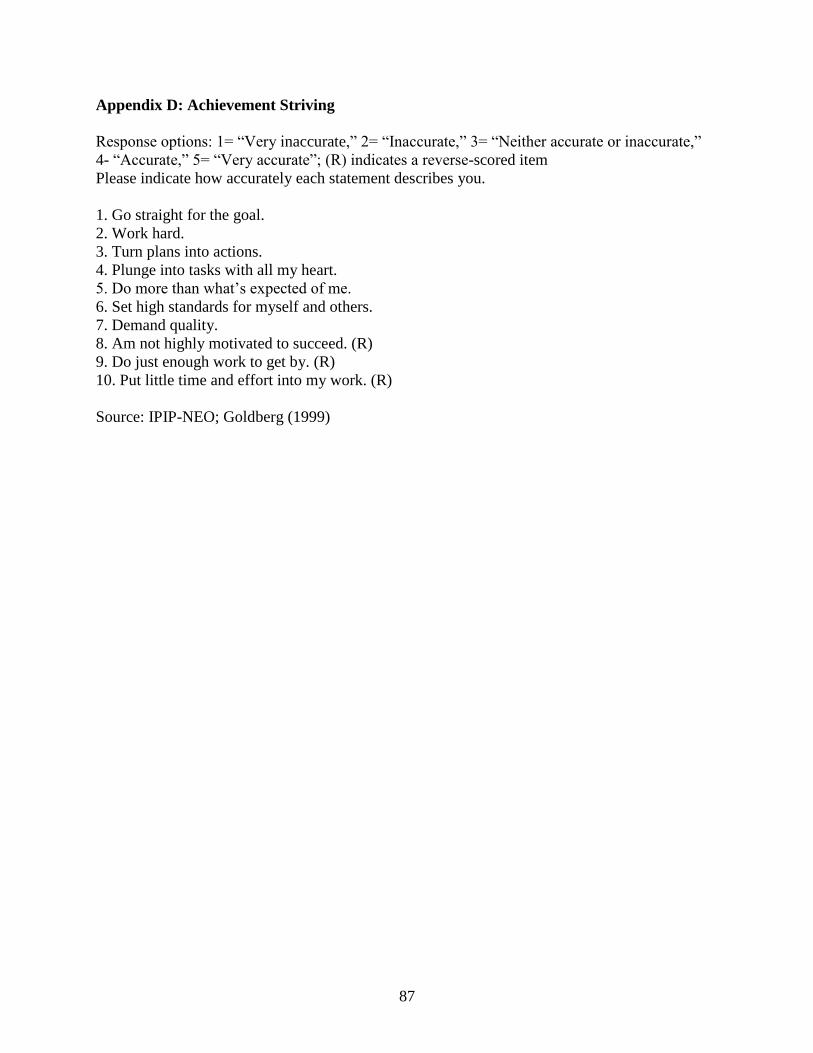
87
Appendix D: Achievement Striving
Response options: 1= “Very inaccurate,” 2= “Inaccurate,” 3= “Neither accurate or inaccurate,”
4- “Accurate,” 5= “Very accurate”; (R) indicates a reverse-scored item
Please indicate how accurately each statement describes you.
1. Go straight for the goal.
2. Work hard.
3. Turn plans into actions.
4. Plunge into tasks with all my heart.
5. Do more than what’s expected of me.
6. Set high standards for myself and others.
7. Demand quality.
8. Am not highly motivated to succeed. (R)
9. Do just enough work to get by. (R)
10. Put little time and effort into my work. (R)
Source: IPIP-NEO; Goldberg (1999)
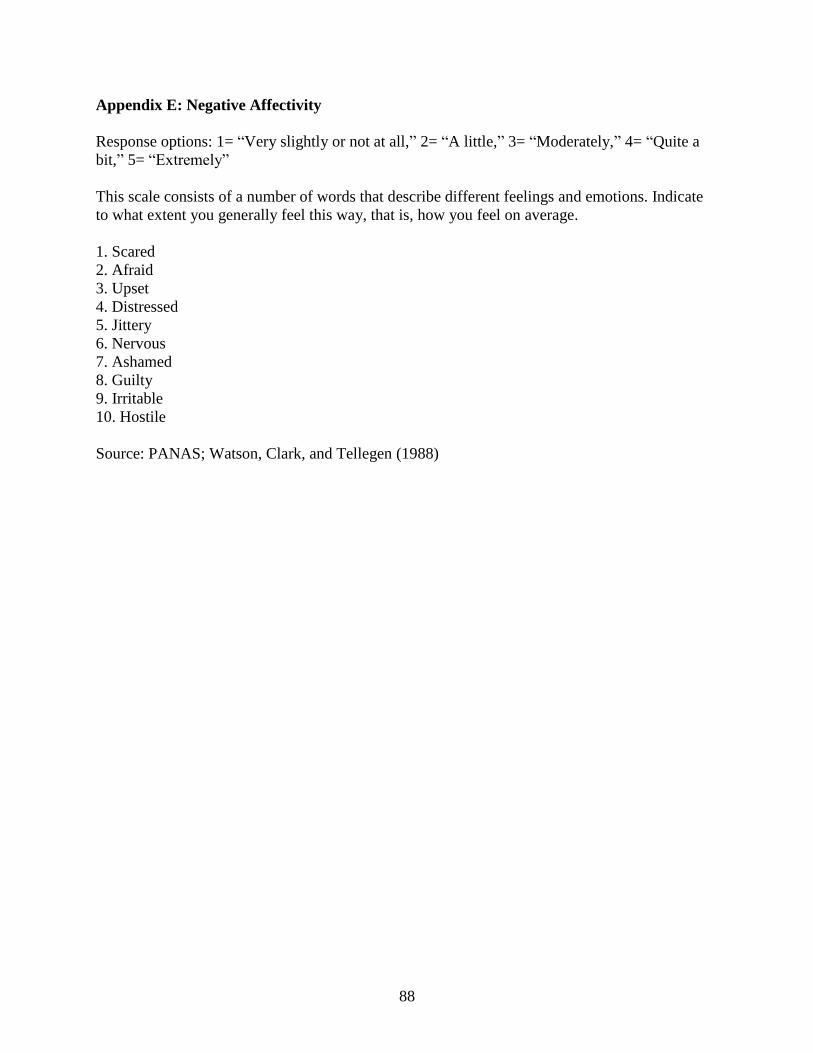
88
Appendix E: Negative Affectivity
Response options: 1= “Very slightly or not at all,” 2= “A little,” 3= “Moderately,” 4= “Quite a
bit,” 5= “Extremely”
This scale consists of a number of words that describe different feelings and emotions. Indicate
to what extent you generally feel this way, that is, how you feel on average.
1. Scared
2. Afraid
3. Upset
4. Distressed
5. Jittery
6. Nervous
7. Ashamed
8. Guilty
9. Irritable
10. Hostile
Source: PANAS; Watson, Clark, and Tellegen (1988)
89
Appendix F: Job Satisfaction
Response options: 1= “Strongly Disagree,” 2= Disagree,” 3= “Neutral,” 4= “Agree,” 5=
“Strongly Agree”
Please indicate the response which best reflects how you feel.
1. In general, I do not like my job.
2. All in all, I am satisfied with my job.
3. In general, I like working here.
Source: MOAQ; Cammann, Fichman, Jenkins, and Klesh (1983)

90
Appendix G: Psychological Distress
Response options: 1= “Never,” 2= “Rarely,” 3= “Sometimes,” 4= “Often,” 5= “All the time”
Have you recently…
1. Felt constantly under strain?
2. Felt that you couldn’t overcome your difficulties?
3. Been feeling unhappy and depressed?
4. Been losing confidence in yourself?
5. Been thinking of yourself as worthless?
Source: Goldberg and Williams (1991)

91
Appendix H: Physical Symptoms
Response options: 1= “Not at all,” 2= “Once or twice,” 3= “Once or twice per week,” 4=
“Almost every day,” 5= “Every day”
Over the past month, how often have you experienced each of the following symptoms?
1. An upset stomach or nausea
2. Backache
3. Trouble sleeping
4. Headache
5. Acid indigestion or heartburn
6. Eye strain
7. Diarrhea
8. Stomach cramps (Not menstrual)
9. Constipation
10. Ringing in the ears
11. Loss of appetite
12. Dizziness
13. Tiredness or fatigue
Source: PSI; Spector and Jex (1998)

92
Appendix I: Demographics
1. Gender: ___ Male ___ Female
2. Age: ___
3. Ethnicity:
___ Caucasian/White
___ Native American
___ Latino/Hispanic
___ African American
___ Asian
___ Other (please specify): ____________________
4. Marital status:
___ Single
___ Married
___ Divorced / separated
___ Live-in partner / Domestic partnership
5. Field of Bachelor’s degree: ________________
6. Date of graduation (Month/Year): _ _ / _ _ _ _
7. Have you completed any formal education since obtaining your Bachelor’s degree?
___ Yes ___ No
If yes: Please explain: _________________
8. Please select the industry that is most relevant to your current job.
(Response options included the NAICS job industries used by O*NET)
9. Please select the occupation that is the closest to your current job.
(Response include the O*NET-SOC occupations for each industry, as well as the option,
“None of these occupations are close to my current job”).
10. What is your current job title? _________________
11. How many hours do you work per week? ___
12. When did you begin working for your current company? (Month/ Year) _ _ / _ _ _ _
13. When did you begin working in your current position? (Month/ Year) _ _ / _ _ _ _
14. What year did you graduate from high school? _ _ _ _
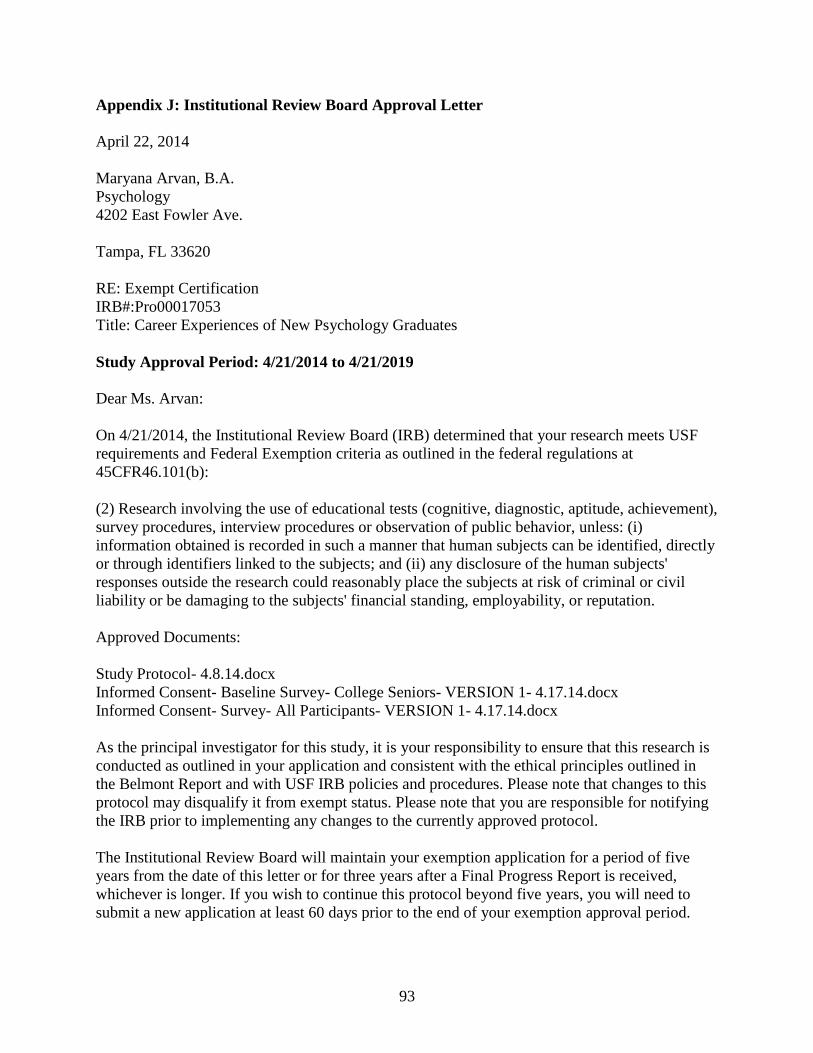
93
Appendix J: Institutional Review Board Approval Letter
April 22, 2014
Maryana Arvan, B.A.
Psychology
4202 East Fowler Ave.
Tampa, FL 33620
RE: Exempt Certification
IRB#:Pro00017053
Title: Career Experiences of New Psychology Graduates
Study Approval Period: 4/21/2014 to 4/21/2019
Dear Ms. Arvan:
On 4/21/2014, the Institutional Review Board (IRB) determined that your research meets USF
requirements and Federal Exemption criteria as outlined in the federal regulations at
45CFR46.101(b):
(2) Research involving the use of educational tests (cognitive, diagnostic, aptitude, achievement),
survey procedures, interview procedures or observation of public behavior, unless: (i)
information obtained is recorded in such a manner that human subjects can be identified, directly
or through identifiers linked to the subjects; and (ii) any disclosure of the human subjects'
responses outside the research could reasonably place the subjects at risk of criminal or civil
liability or be damaging to the subjects' financial standing, employability, or reputation.
Approved Documents:
Study Protocol- 4.8.14.docx
Informed Consent- Baseline Survey- College Seniors- VERSION 1- 4.17.14.docx
Informed Consent- Survey- All Participants- VERSION 1- 4.17.14.docx
As the principal investigator for this study, it is your responsibility to ensure that this research is
conducted as outlined in your application and consistent with the ethical principles outlined in
the Belmont Report and with USF IRB policies and procedures. Please note that changes to this
protocol may disqualify it from exempt status. Please note that you are responsible for notifying
the IRB prior to implementing any changes to the currently approved protocol.
The Institutional Review Board will maintain your exemption application for a period of five
years from the date of this letter or for three years after a Final Progress Report is received,
whichever is longer. If you wish to continue this protocol beyond five years, you will need to
submit a new application at least 60 days prior to the end of your exemption approval period.
94
Should you complete this study prior to the end of the five-year period, you must submit a
request to close the study.
We appreciate your dedication to the ethical conduct of human subject research at the University
of South Florida and your continued commitment to human research protections. If you have any
questions regarding this matter, please call 813-974-5638.
Sincerely,
Kristen Salomon, Ph.D., Vice Chairperson
USF Institutional Review Board