Embed Size (px)
Citation preview

Eric P. Rubin Social Norming and Thermostat Settings Spring 2013
1
How Personalized Normative Feedback Affects Home Thermostat Settings
Eric P. Rubin
ABSTRACT
Personalized Normative Feedback (PNF), personalized comparison to the average behavior of
peers, has been shown to reduce residential energy use, but the underlying psychological
mechanism is not well understood. To evaluate the merits of the Theory of Changing Normative
Beliefs relative to the Focus Theory of Normative Conduct, I used Amazon’s Mechanical Turk
to administer PNF about home thermostat settings to Chicago residents. From November 2012
to March 2013, I surveyed subjects about settings, normative beliefs, demographics, habits, and
motivations and administered PNF to my treatment group (n = 16) but not my control (n = 8). I
then followed up with subjects over a month later to find their new settings and beliefs.
Subjects’ change in setting was not significantly predicted by initial setting. Normative beliefs
were positively correlated with initial settings (R2 = 0.48, F(1,37) = 33.9, p < 0.0001) and
significantly improved a multivariate model of setting (ANOVA: F(1,11) = 5.49, p < 0.05). For
the treatment group but not the control group, change in beliefs was negatively correlated with
initial beliefs (R2 = -0.42, F(1,14) = 10.13, p < 0.01) and change in behavior was positively
correlated with change in beliefs (R2 = 0.46, F(1,14) = 11.96, p < 0.01). The greatest decrease in
settings came from subjects in the treatment group (n = 2) who initially believed the average
setting was high and whose beliefs moved toward the norm conveyed by PNF. Overall, this pilot
study supports the validity of the normative belief concept and offers preliminary support that
PNF can affect repeated, private conservation behaviors by changing normative beliefs.
KEYWORDS
normative beliefs, misperception, Focus Theory of Normative Conduct, Social Norms Theory,
Opower

Eric P. Rubin Social Norming and Thermostat Settings Spring 2013
2
INTRODUCTION
Many environmental problems are in large part caused by the aggregated choices of
average people (Vandenbergh 2004, Jackson 2005). Climate change, for instance, is produced in
large part by the cumulative choices of individuals regarding purchases, transportation, diet, and
direct home energy consumption (Dernbach 2007). In the short term, it is often too expensive,
impractical, or politically controversial for governmental bodies to adequately constrain and
influence individuals’ decisions through traditional tools such as standards, prohibitions, and
market-based interventions (Vandenbaugh 2004, Costa and Kahn 2010, Allcott and Mullainathan
2010). Furthermore, repeated studies have shown that the traditional tools of non-governmental
environmental organizations are ineffective. That is, campaigns that rely solely on education,
incentives, and appeals to social or environmental values have generally proven ineffective
(Stern 1999, Stern 2000, Schultz 2002, Wilson and Dowlatabadi 2007, Goldstein et al. 2008,
Nolan et al. 2008). Fortunately, there is a growing body of evidence that “social norming”—
providing information about the common behavior or values of a social group—can affect
individuals’ environmental behavior (Schultz et al. 2008). In addition, social norming is a lever
that acts immediately, cost-effectively, and without controversial government intervention
(Allcott 2011, Allcott and Mullainathan 2010).
Terminology
For the purposes of this paper, I distinguish between two types of norms: “injunctive
norms,” which are what most people in a reference group think one ought to do, and “descriptive
norms,” which are what most people in a reference group actually do (Cialdini et al. 1991). For
example, an injunctive norm might be that 80% of Americans think one ought to vote in national
elections. The corresponding descriptive norm might be that 3 in 5 Americans actually do vote
in national elections.
Furthermore, I distinguish between “norms”—what most people in a reference group
actually value or do—and “normative beliefs,” which are an individual’s perception of what is
commonly valued or done by members of a reference group (Schultz et al. 2008, Nolan 2011).
Descriptive normative beliefs are subconscious estimates of a descriptive norm based on three

Eric P. Rubin Social Norming and Thermostat Settings Spring 2013
3
factors: observation of others, communication from third parties and media, and extrapolation
from personal behavior (Nolan 2011, Lapinski and Real 2005, Fig 1). In this model, which I will
refer to as the “three-factor model of normative belief generation,” normative beliefs are
influenced by personal behavior through the false consensus effect—the tendency for individuals
to think that other people believe what they believe and behave as they behave (Nolan 2011,
Monin and Norton 2003, van der Pligt 2006, Baer et al. 1991). Although normative beliefs can
be produced at any time, they do not persist in consciousness (Nolan 2011). They are not fixed,
but rather dynamically update in response to new observation, communication, or changes in
personal behavior (Nolan 2011, Monin and Norton 2003).
Fig 1. The three-factor model of normative belief generation. Dynamically updated,
subconscious estimates of the prevalence of different behaviors are based on (1) observations of
others, (2) communication from third parties and media, and (3) extrapolation from personal
behavior. Self-knowledge sometimes informs normative beliefs through a false consensus effect,
whereby individuals assume that the behavior of others is similar to their own behavior.
Models of social influence
In sociology and psychology, descriptive and injunctive normative beliefs are often
modeled as sources of influence for individual behavior, especially when the individual attributes
self-similarity, social significance, and/or value to the reference group (Schultz et al. 2008,
Cialdini and Goldstein 2004, Lapinski et al. 2007). Beliefs about whether most people engage in
a behavior (descriptive normative beliefs) have been shown to correlate with water conservation,
household recycling, buying organic food, household energy conservation, and other pro-

Eric P. Rubin Social Norming and Thermostat Settings Spring 2013
4
environmental behaviors (Lapinkski et al. 2007, Thøgersen 2006, Nolan et al. 2008, Gockeritz et
al. 2010). Beliefs about what most people approve of (injunctive normative beliefs), which may
be inferred from descriptive normative beliefs (Thøgersen 2006), have been shown to correlate
with transportation choice and choosing low home thermostat settings, for example (Bamberg et
al. 2007, Black et al. 1985).
One limitation of these studies is that correlation does not distinguish between behavior
conforming to normative beliefs and reported normative beliefs that are generated in part by
extrapolating from personal behavior. Individual behavior conforming to group standards is a
well-established phenomenon with documented mechanisms. These mechanisms may include
trust in others’ judgment, anticipated social sanction, emulation of aspirational others,
maintenance of group identity, an obligation to do one’s fair share, or expectations of aggregate
outcome for group endeavors (Deutsch and Gerard 1955, Thøgersen 2006, Rimal and Real 2005,
Abrams et al. 1990, Vandenbaugh 2004, Steg and de Groot). For the purposes of this paper, I
will refer to all these mechanisms as “social influence.” Although it is plausible that normative
beliefs affect behavior through social influence, it is also likely that normative beliefs (especially
descriptive normative beliefs) are partially based on self-knowledge, and thus the correlation
may capture a bi-directional causality—not the simple social influence that is commonly
proposed.
Models of social norming
Public health interventions and the Theory of Changing Normative Beliefs
To the extent that social norming is the deliberate manipulation of normative beliefs,
research on social norming may provide stronger proof of a causal relationship between
normative beliefs and behavior than correlational studies can (Borsari and Carey 2001). Social
norming either takes the form of “social marketing,” in which the same normative message is
broadcast to everyone, or “personalized normative feedback,” in which each individual receives
a personalized comparison to average behavior (Neighbors et al. 2004). For example, a social
marketing intervention targeting home energy use conveyed the message “Join your neighbors in
conserving energy . . . 77% of San Marcos residents often use fans instead of air conditioning to
Eric P. Rubin Social Norming and Thermostat Settings Spring 2013
5
keep cool in the summer” (Nolan et al. 2008). In contrast, a personalized normative feedback
(PNF) approach to home energy conservation consisted of a graphical comparison of each
resident’s energy use to the neighborhood average (a descriptive norm) (Allcott 2011).
Homeowners received injunctive personalized normative feedback, too. For example, energy-
efficient homeowners received congratulations for their low usage: “You should be proud . . . ”
(Allcott 2011).
In the domain of public health, both social marketing and PNF are commonly designed
with the intention of changing the normative beliefs of a target population (Borsari and Carey
2001, Perkins 2002). This framework, which I refer to here as the Theory of Changing
Normative Beliefs (although it is sometimes called Social Norms Theory), is grounded in the
assumptions that people’s normative beliefs influence their behavior, that social norming affects
normative beliefs, and that those new normative beliefs will lead to behavior change (Carey et al.
2010, Borsari and Carey 2001). Public health researchers and professionals often seek to reduce
risky behaviors, such as binge drinking, adolescent drug use, and unprotected sex, by
disseminating information about the true prevalence of such behaviors (Blanton et al. 2008).
This approach is implemented in cases where researchers have evidence that their target
population has an inflated perception of how common the risky behavior is (Blanton et al. 2008).
For example, there have been many interventions to reduce collegiate binge drinking by de-
biasing students’ exaggerated descriptive normative beliefs (Baer et al. 1990, Borsari and Carey
2001). Most of these social norming interventions are bundled with other preventative strategies,
such as education about outcomes or training in resisting social pressure, and their evaluation is
often focused on how the manipulation of these bundles affects behavioral outcomes, rather than
the psychological mechanisms responsible for the success or failure of interventions (Borsari and
Carey 2001). One of the notable exceptions to this “black box,” outcome-driven tendency is a
study in which researchers provided only descriptive personalized normative feedback to their
treatment group and measured the change in normative beliefs and behavior of their subjects in
control and treatment (Neighbors et al. 2004). This study showed that PNF produced a persistent
reduction in alcohol consumption that was mediated by a change in normative beliefs about
alcohol consumption (Neighbors et al. 2004).

Eric P. Rubin Social Norming and Thermostat Settings Spring 2013
6
Opower and the Focus Theory of Normative Conduct
Research on pro-environmental social norming tends to forgo analyzing the mechanisms
by which social norming affects environmental behavior, focusing instead on maximizing
conservation (Ayres et al. 2009, Costa and Kahn 2010, Allcott 2011), evaluating social
marketing relative to other techniques of persuasion (Nolan et al. 2008, Goldstein et al. 2008), or
evaluating PNF relative to other forms of feedback (Schultz 1999, Jensen 1986, Fischer 2008).
The study and application of pro-environmental PNF has been dominated by the company
Opower and sociologist Robert Cialdini, who is both Chief Scientist at Opower and the lead
theorist behind the Focus Theory of Normative Conduct, a model of social influence (Allcott and
Mullainathan 2010, Davis 2011, Opower 2013, Cialdini et al. 1991). Opower partners with
utilities to provide Home Energy Reports: letters to homeowners that include graphical
comparison to the energy consumption of “all neighbors” and “efficient neighbors” and
personalized injunctive feedback in the form of smiley faces (Allcott 2011, Fig 5b). The reports
also include personalized energy conservation tips with estimated cost savings (Allcott 2011).
For example, a personalized tip might inform a homeowner that she can save $30 per year by
installing occupancy sensors (Allcott 2011). Opower Home Energy Reports produce an average
of 2-3% energy savings at a cost of 3-5 cents per avoided kilowatt-hour (Opower 2012, Allcott
2011). The three major academic analyses of Opower’s Home Energy Reports have all shown a
persistent effect, as did an analysis of PNF targeting residential recycling (Costa and Kahn 2010,
Ayres et al. 2009, Allcott 2011, Schultz 1999).
The persistent behavioral change induced by pro-environmental personalized normative
feedback interventions is not just practically significant, but also theoretically intriguing.
Opower’s Home Energy Reports are highly informed by their Chief Scientist Robert Cialdini
(whose views on social influence highlight the role of norm salience and unconscious processes),
and they are closely modeled on a 2007 intervention that sought to apply Cialdini’s Focus
Theory of Normative Conduct to reducing residential energy consumption (Cialdini et al. 1991,
Rosenberg 2013, Opower 2013, Schultz et al. 2007, Allcot 2011). According to the Focus
Theory of Normative Conduct, all norms do not affect us all the time, but rather norms affect our
behavior when our social or physical context focuses our attention on what is commonly done or
valued (Cialdini et al. 1991). The theory is based on a series of experiments by Robert Cialdini

Eric P. Rubin Social Norming and Thermostat Settings Spring 2013
7
that show that subjects’ one-time tendency to litter tends to conform to either descriptive or
injunctive norms to the extent that environmental cues and priming draw their attention to those
norms (Cialdini et al. 1991). Such cues included observation of others’ littering behavior,
observation of a confederate’s littering behavior, and seemingly mass-produced pamphlets
planted on the subjects’ windshield wipers with messages about injunctive norms pertaining to
various pro-social behaviors (Cialdini et al. 1991). When the Focus Theory of Normative
Conduct is applied to personalized normative feedback, the feedback is conceived of as a
normative cue that tends to produce conformity in recipients such that their behavior is more in
line with the conveyed norm (Schultz et al. 2007). This theoretical approach does not rely on an
intervening change in normative beliefs.
Opower’s Home Energy Reports are different in kind from Cialdini’s littering
experiments, as are all forms of PNF that target repeated pro-environmental behaviors (such as
recycling) or important decisions (such as purchasing an efficient appliance). The Focus Theory
of Normative Conduct is based on evidence that subtle priming and environmental factors can
draw an individual’s attention to group standards of behavior or values and produce short-term
conformity in behavior, possibly without the individuals being conscious of any normative
influence on their behavior (Cialdini et al. 1991). In contrast, personalized normative feedback
for recycling and home energy conservation involves an explicit, tailored communication about
normative standards (Schultz 1999). Furthermore, if Home Energy Reports work by causing
homeowners to act on the energy saving tips, then these pro-environmental interventions affect
repeated behaviors, which are often executed after normative focus has faded, and purchasing
decisions that likely involve significant conscious deliberation, which may affect mechanisms of
social influence (Allcott 2011, Schultz et al. 2008). There are plausible explanations for how
feedback could lead to a cascade of delayed cues that reinvigorate that normative focus (such as
through conversations about the feedback or through the persistent physical presence of a Home
Energy Report). However, it may be more useful and accurate to conceptualize the effect of
personalized normative feedback as operating through more stable cognitive mechanisms. In
light of the theory underlying public health interventions, changing normative beliefs are a likely
candidate for a durable mechanism by which personalized normative feedback might affect
repeated behaviors and major purchasing decisions (Allcott 2011).

Eric P. Rubin Social Norming and Thermostat Settings Spring 2013
8
Objectives of the current research
The current pilot study is designed to evaluate whether change in repeated residential
energy conservation behaviors (home thermostat settings) induced by PNF can be best
understood as the product of changing normative beliefs. This overarching research question
represents a novel application of the dominant paradigm in public health social norming. To test
the relative merits of the Theory of Changing Normative Beliefs, I first evaluate the explanatory
power of the Focus Theory of Normative Conduct, which in this context merely predicts
conformity to the descriptive norm based on initial behavior. I will then test the validity of four
sequential assumptions of the Theory of Changing Normative Beliefs:
1) that normative beliefs are correlated with behavior;
2) that normative beliefs are influenced by PNF;
3) that behavior shifts in tandem with belief change; and
4) that the behavioral change that occurs is predominantly tied to beliefs that are shifting
toward the norm conveyed by PNF.
METHODS
Individualized comparisons to the norm of overnight thermostat setting
To evaluate the ability of the Focus Theory of Normative Conduct and the Theory of
Changing Normative Beliefs to explain how PNF affects home thermostat settings, I delivered
PNF to subjects in my treatment group (n=16) and measured their change in behavior and
normative beliefs. The PNF was designed to shift each subject’s “overnight thermostat setting”
toward the descriptive norm for overnight thermostat setting in the study population, possibly by
shifting their focus to that norm and possibly through an intervening shift in normative beliefs.
In the surveys I administered to subjects, I defined overnight thermostat setting as “the
temperature that your household's thermostat is set to when most members of the household are
asleep.”

Eric P. Rubin Social Norming and Thermostat Settings Spring 2013
9
Why overnight thermostat settings?
My primary consideration in selecting a behavior was that I wanted to choose a private,
repeated behavior that affects household energy use. Opower’s PNF is interesting in that it
affects behaviors that are unseen by society and thus less likely to be shaped by social sanction
than many behaviors targeted in public health social norming (Cialdini and Goldstein 2004,
Abrams et al. 1990). Surveys of homeowners who received Home Energy Reports show that
Opower’s PNF also affects behaviors that are repeated (including maintaining a lower thermostat
setting), and thus unlikely to always be performed when homeowners are focused on social
norms (Carrol et al. 2009, Schultz 1999). Thermostat setting is a residential energy behavior that
is both anonymous and repeated, and thus has psychologically interesting parallels to previous
pro-environmental social norming.
I focused the study on subjects’ selection of overnight thermostat setting because this
behavior is easily self-reported and quantified, significantly affects home energy consumption
(Vine 1986, Peffer et al 2011), and can be influenced by a modest intervention (Black et al.
1985). It was important that the target behavior could be self-reported, because I do not have
access to data on anyone’s overall energy consumption or the resources to directly measure
subjects’ home energy behavior. By restricting my behavior to overnight thermostat setting, I
increase the likelihood that subjects are referring to the same behavior.
Overnight thermostat setting was also a suitable choice of target behavior because it
varies continuously with small differences between possible values (degrees Fahrenheit).
Choosing a precisely quantifiable behavior increased the likelihood of capturing small effects of
the intervention and the similarity to interventions that affect kg of recycling or kWh of
conserved energy (Schultz 1999, Opower 2012). Another reason I chose this target behavior is
that residential thermostats control 9% of energy consumption in the United States (Peffer et al.
2011), which increases the potential real-world applicability of the findings.
A final and important reason I chose overnight thermostat setting as the target behavior is
because it is easily influenced by a subtle, one-time social norming intervention. Thermostat
setting is likely to be influenced by persuasive messaging because changing one’s thermostat
setting is relatively simple, fast, and involves no intervening steps (Fuller et al. 2010,
McKenzie‐ Mohr 2000). Futhermore, energy conservation behaviors—such as lowering

Eric P. Rubin Social Norming and Thermostat Settings Spring 2013
10
thermostat settings—generally has fewer barriers than energy efficiency behaviors—such as
buying more efficient appliances or upgrading one’s residence (Black et al. 1985). Thermostat
setting in particular is more tied to injunctive normative beliefs—which may be inferred from
descriptive normative beliefs (Thøgersen 2006)—than other residential energy conservation
behaviors (Black et al. 1985). Descriptive norms are more influential when there are perceived
benefits to aligning behavior with the group (Rimal and Real 2005, Rimal et al. 2005,
Vandenbaugh 2004), which applies to thermostat settings because subjects either save money by
decreasing their settings toward the norm or increase comfort by increasing their settings toward
the norm.
Overview of experimental design
My experimental design consisted of three phases: (1) a preliminary survey to identify
the average overnight thermostat setting of the study population; (2) a baseline survey, which
included questions about each subject’s overnight setting and normative beliefs and ended with
PNF comparing each subject’s setting to the average setting calculated from the preliminary
survey; (3) a follow-up survey to measure each subject’s new thermostat setting and descriptive
normative belief. This ideal experimental design was complicated by three main factors: (1) I
assigned subjects in the preliminary survey to the control group and measured their change in
settings and beliefs; (2) there was a second batch of the baseline survey and follow-up survey to
recruit more subjects; (3) 85% of subjects in the first baseline survey received PNF and 100% of
subjects in the second baseline survey received PNF (Fig 2).
Eric P. Rubin Social Norming and Thermostat Settings Spring 2013
11
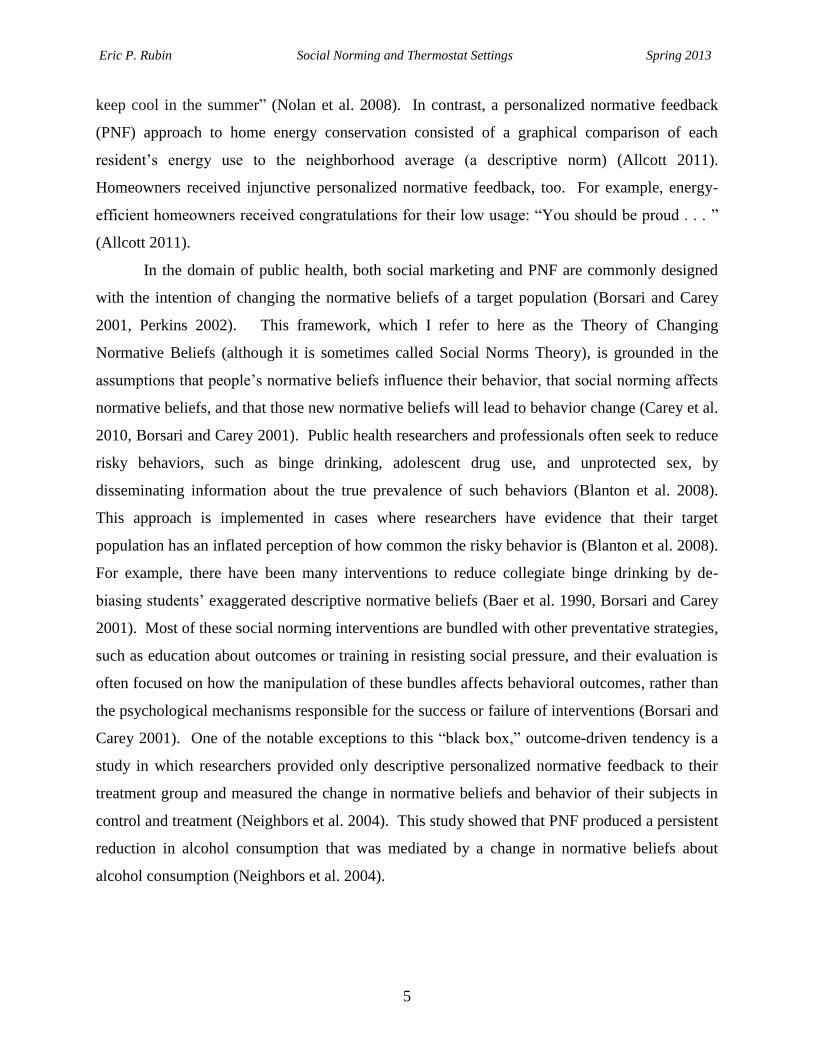
Fig 2. Overview of my experimental design. Respondents to the preliminary survey provided the
information on average behavior that I later conveyed to subjects in the treatment group. There
were two batches of baseline surveys, roughly one month apart. At the end of the first, 85% of
respondents received PNF. At the end of the second, 100% of respondents received PNF.
Eric P. Rubin Social Norming and Thermostat Settings Spring 2013
12
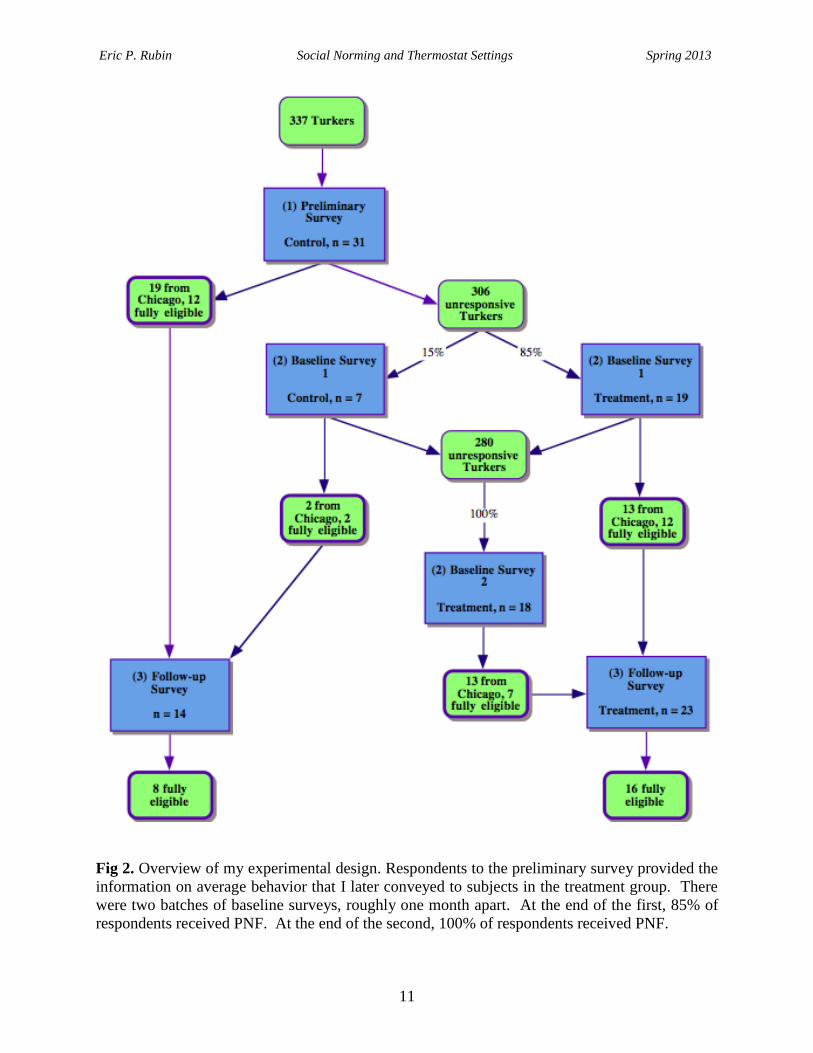
Phase 1: Preliminary survey
Participants, study site
Amazon’s Mechanical Turk: To cheaply reach a large, diverse, non-local population, I used
Amazon Mechanical Turk (MTurk) to obtain participants for my study. MTurk is an online
crowdsourcing tool that allows anyone to pay for the completion of small, simple tasks or for
MTurk workers (“Turkers”) to complete tasks for money (Amazon Mechanical Turk 2012,
<http://mturk.com/>). Turkers from America differ somewhat from the general population, but
there have been studies of these differences and I also gathered demographic data from all
participants to gauge the external validity of the findings (Ross et al. 2010, Ipeirotis 2010). The
most significant difference between American Turkers and Americans is that about two thirds of
Turkers are female (Ross et al. 2010). Although the wages on MTurk can be very low, which
might lead one to assume that Turkers are disproportionately poor, Turkers mostly do not engage
in MTurk out of financial necessity (Ross et al. 2010, Kaufmann et al. 2011). MTurk is a
budding tool for social scientists, because it allows researchers to obtain a large sample of
empirically reliable subjects from all over the world for very little cost (Paolacci et al. 2010,
Rand 2012).
To ensure that the average setting I calculated from the preliminary survey would feel
relevant to the subjects, I required that test subjects all live in a single city. An important
byproduct of this limitation is that I reduced climatic variability, but the size of the study area
was primarily constrained by the goal that subjects view the residents of the study area as self-
similar. This goal stems from the well-supported theory that people respond more strongly to the
norms of those whom they see as being similar to them, because this gives more practical and
psychological significance to social norms (Rimal and Real 2005, Abrams et al. 1990, Terry and
Hogg 2000, Smith and Louis 2008). I double-checked the ZIP codes of all respondents and
removed all data from respondents outside the city of Chicago.
Chicago: I chose Chicago because it is cold and populous. The average monthly temperature in
Chicago for all the months during which I conducted my study was 34 degrees (NOAA 2006).
Because Chicago is so cold, subjects were more likely to have potential perceived benefits to

Eric P. Rubin Social Norming and Thermostat Settings Spring 2013
13
conforming to descriptive norms, regardless of whether they initially had below- or above-
average settings. The cold magnifies the financial incentive to reduce thermostat settings and the
comfort gained by increasing thermostat settings. Another reason I chose Chicago is that it is the
third most populous city in the United States in 2010 after New York and Los Angeles with a
population of almost 2.7 million people (United States Census Bureau 2010). Because the
distribution of MTurk users is roughly the same as the overall population distribution (Ipeirotis
2010), choosing Chicago increased the chances of getting enough respondents. (Los Angeles is
too warm and I have anecdotal evidence that many people in New York either do not pay their
own heating bills or do not have control over the ambient temperature in their apartments.)
Geographic restriction using MTurk qualifications: Because MTurk does not allow
Requesters to limit the Turkers who complete their task to a specific city, I enlisted the help of
Dahn Tahrir, a researcher who has compiled the locations of 50,000 Turkers worldwide. Dahn
shared the worker IDs of the 337 Turkers who recently self-identified as living in Chicago and
whose IP addresses he had verified to be within the city limits. For each round of surveys, I
assigned a qualification to the Chicago Turkers who had not completed previous surveys. When
Turkers are assigned a qualification, they receive an email with the name of that qualification, so
I included the URL of my survey in the qualification title, along with an invitation to participate.
I sought to make qualification emails increasingly persuasive for each successive batch of
Turkers, because they had been unmoved by all previous attempts enlist their participation
(Fig 3).
Fig 3. An email alerting Turkers who had declined several batches of invitations that they were
invited to participate in my survey.
Eric P. Rubin Social Norming and Thermostat Settings Spring 2013
14
Turkers who clicked the link in the qualification email were invited to participate in “A
5-minute survey about home thermostat settings and demographics” that they were informed was
being conducted by a U.C. Berkeley student for the purpose of an undergraduate thesis.
Within two days of the first batch of qualification emails, 31 of the 337 Turkers had
completed the preliminary survey. Each Turker received $0.50 for completing the preliminary
survey, which is a high wage for MTurk given the brevity of the survey (Polacci et al. 2010).
As with all my subjects, I filtered the respondents to my preliminary survey according to
several criteria. I removed all subjects who provided wildly unrealistic answers or answered the
whole survey in under a minute. I also removed respondents who did not provide a ZIP code in
the City of Chicago. I designated as “fully eligible” only those respondents who paid their own
heating bill and had exactly one thermostat in their household that they were able to control. For
all analysis of behavior change, I looked only at fully eligible subjects in order to control for the
presence of personal financial incentive, which could be a major confounding variable, and to
ensure that all subjects were capable of engaging in a behavior that was equivalent (changing
their household’s singular thermostat).
Preliminary Survey Questions
I first determined the norm for overnight thermostat setting by conducting a preliminary
survey in which I asked subjects to estimate their average overnight thermostat setting in the
week preceding the survey. Because I would later use subjects from the preliminary survey in
the control group, I also asked basic demographic questions, questions about what motivated
participants to set their thermostat as they did, and questions about thermostat usage (Appendix
A). Because the preliminary survey was identical to the baseline survey except for the absence
of PNF, a more detailed justification for the preliminary survey questions can be found in the
section “Baseline Survey Questions.”

Eric P. Rubin Social Norming and Thermostat Settings Spring 2013
15
Phase 2: Baseline survey and PNF
Participants
Throughout my experiment, each successive round of surveys was open to Turkers from
Chicago who had not filled out previous surveys. Due to low response rates and low rates of
fully eligible respondents, I made several modifications to my ideal experimental design. The
most significant was that I conducted two batches of baseline surveys and follow-up surveys to
augment my sample size. I also added the respondents from my preliminary survey as my
control group, which gave me a surplus of control subjects relative to treatment subjects. I
corrected this imbalance and achieved an adequate number of subjects in treatment by randomly
providing PNF to 85% of my first batch of baseline respondents and 100% of my second batch.
Payment also was not constant between batches or within batches. Subjects in later batches
tended to receive higher wages as did subjects who responded on later days within a given batch
($1.25 to $2 in the first baseline survey, $2 in the first follow-up survey, $2 to $3 in the second
baseline survey, and $2 to $3 in the second follow-up survey). Every subject received every
invitation to participate in the study until that subject finally participated, which meant that later
subjects had found the invitations up until that point to be insufficiently motivational. As a
result, later subjects required more invitations per batch and higher financial incentives to
overcome their increased reluctance to participate.
Baseline survey questions
In the baseline survey, the two most important questions I asked were: (1) “In the last
week, what was your average overnight thermostat setting?” and (2) “What do you think the
average overnight thermostat setting was for all households in Chicago in the last week?” I
interpreted the answer to the first question as the subject’s initial overnight thermostat setting and
the answer to the second question as the subject’s normative beliefs about overnight thermostat
setting.
To ensure that subjects were capable of engaging in the behavior change, I also asked all
the subjects if they had exactly one thermostat in their household that they were able to set. I

Eric P. Rubin Social Norming and Thermostat Settings Spring 2013
16
asked if the subjects had exactly one thermostat because subjects with no thermostat could not
engage in behavior change and subjects with more than one thermostat did not necessarily have a
single setting and would not be engaging in the same behavior change as subjects with a single
thermostat. I asked the subjects if they could control their households’ thermostat settings
because those subjects who could not control their settings could not engage in the desired
behavior change. Those subjects from the preliminary survey and the baseline survey who did
not have exactly one thermostat that they could control were not invited to participate in the
follow-up survey.
To check for external validity and internal validity, and to understand whether subjects’
thermostat behavior was habitual, I also asked subjects about demographics, thermostat usage,
and what factors motivated their thermostat setting. I asked whether subjects had a thermostat
that could be programmed to change automatically at a certain time, because subjects with
programmable thermostats would be engaging in a one-time behavior change, which is easier.
The survey instrument is in Appendix A.
Post-survey PNF
To measure the change in overnight thermostat setting due only to social norming, I
included PNF at the end of the baseline survey for some subjects and had other subjects take
surveys without PNF.
To approximate Opower’s PNF but introduce a minimum of variables that would
confound the effect of norm misperception, I designed the intervention to closely resemble just
the descriptive normative component of Opower’s feedback (Fig 4, Fig 5). The intervention was
a computer-generated, individualized graphical comparison between (1) the subject’s thermostat
setting, (2) the average (median) setting from the preliminary survey, and (3) the bottom 20th
percentile thermostat setting from the preliminary survey. Although including the 20th percentile
setting complicated the analysis, I chose to include the “efficient” norm to increase the real-
world applicability of the study by more closely approximating Opower’s feedback, which seeks
to effect unidirectional behavioral change. Because the relative difference between even
uncommonly high and low thermostat settings is graphically unimpressive, I designed the
feedback to emphasize the absolute difference between the subject’s setting and the norm and the

Eric P. Rubin Social Norming and Thermostat Settings Spring 2013
17
20th percentile setting and the norm. I emphasized the absolute difference by essentially making
the norm the horizontal axis and then graphing the deviations of the subject’s setting and
efficient setting from the norm.
(a) Citywide Comparison (b) Citywide Comparison
Fig 4. Two examples of my PNF comparing (1) the subject’s thermostat setting (below-average
(a), above-average (b)), (2) the average (median) setting from the preliminary survey, and (3) the
bottom 20th percentile thermostat setting from the preliminary survey.

Eric P. Rubin Social Norming and Thermostat Settings Spring 2013
18
(a) Citywide Comparison (b)
Fig 5. (a) An example of my PNF comparing (1) the subject’s thermostat setting (average), (2)
the average (median) setting from the preliminary survey, and (3) the bottom 20th percentile
thermostat setting from the preliminary survey; (b) Two key components of Opower’s Home
Energy Report: personalized energy saving tips and a PNF comparing (1) the recipient’s
household energy consumption, (2) the average energy consumption for nearby residents with
similar home characteristics, and (3) the bottom 20th percentile of energy consumption for nearby
residents with similar home characteristics. Opower’s PNF also includes an injunctive norm
(Great / Good / Below average).
Although modern Opower letters contain an injunctive norm, energy saving tips, and a
statement of how much money homeowners could save by implementing each set of tips, I chose
not to include any of these elements so that the data would reflect more purely the isolated effect

Eric P. Rubin Social Norming and Thermostat Settings Spring 2013
19
of a single aspect of social norming on behavior change. I excluded the injunctive norm that
Opower traditionally includes (in the form of smiley faces and praise), because the variability
associated with a qualitatively different type of norm did not seem worth the increased real-
world applicability. I did not include energy conservation tips because the target behavior is
self-explanatory and it would confound my data. I did not include an estimate of monetary
savings because it would be a confounding variable.
To ensure that the subjects attended to the intervention, they were asked to correctly
recall how their setting compared to the average setting before they could proceed to the
webpage with the survey completion code.
Phase 3: Follow-up survey
Participants
At least a month after the completion of their initial survey, I sent qualification emails to
the fully eligible Turkers who had completed the preliminary survey and the baseline survey
inviting them to complete a follow-up survey. I chose one month because I wanted to study the
persistent effects of PNF.
Follow-up survey questions
To determine the effect of feedback, I asked subjects from both the control and treatment
groups to once again estimate for the last week their average overnight thermostat setting and the
average overnight thermostat setting was for all households in Chicago.
Analysis
Internal and external validity
To assess the internal validity of my results, I used two-sample t-tests to compare the
initial settings and beliefs of my control and treatment groups. To confirm that outdoor
Eric P. Rubin Social Norming and Thermostat Settings Spring 2013
20
temperatures did not affect my results, I first regressed initial settings against various outdoor
temperature variables and then regressed initial beliefs against various outdoor temperature
variables. I also regressed the change in settings against the change in temperature variables and
the change in beliefs against the change in temperature variables. I downloaded outdoor
temperature data from NOAA (NOAA 2006). To assess the external validity of my results, I
compared summary statistics for various demographic variables to the averages for MTurk users,
Chicagoans, and Americans.
Evaluating the Focus Theory of Normative Conduct
My experiment was not designed to test the Focus Theory of Normative Conduct as a
whole, but specifically to test whether Focus Theory of Normative Conduct, as applied in the
study that inspired Opower’s Home Energy Report (Schultz et al. 2007), can explain how PNF
affects behavior better than the Theory of Changing Normative Beliefs can. Although a
thorough test of the Focus Theory of Normative Conduct would measure the association between
normative focus and concurrent behavior, I worked with only the data that was evaluated in the
descriptive normative portion of the energy conservation intervention that inspired Opower—
initial and final behavior and whether subjects had their attention focused on a descriptive norm.
I tested whether subjects who received PNF conformed their behavior to the norm more than
subjects in the control group.
To determine whether subjects who receive PNF will conform their behavior to the norm
more than subjects in the control group, I categorized subjects in the control and treatment
groups by their initial setting relative to the norm (below-average, average, above-average) and
tested for significant differences in behavior change (Schultz et al. 2007). I used a two-way
ANOVA with interaction effects to test whether subjects who were initially below, at, and above
68 degrees had significantly different average changes in settings depending on whether they
received PNF. To test within the treatment group and within the control group for differences in
behavior change between initial setting groups, I employed Kruscal-Wallis one-way ANOVAs,
which test whether the medians of non-parametric samples (behavior change for initial setting
groups) are significantly different. For all of the tests, I used only fully eligible subjects with
Chicago ZIP codes.

Eric P. Rubin Social Norming and Thermostat Settings Spring 2013
21
Practical questions
Is change in setting correlated with initial setting? I also investigated two questions that do
not directly pertain to the relative merits of the Focus Theory of Normative Conduct and the
Theory of Changing Normative Beliefs. The first was how well initial setting predicts change in
behavior when viewed continuously instead of categorically. Although the Focus Theory of
Normative Conduct does predict conformity in proportion to initial deviance from the norm,
whoever is administering PNF always, by necessity, knows the initial behavior of individuals,
which makes initial behavior a potential practical predictor of behavior change. Analysts at
Opower and social scientists have found that baseline usage is the strongest predictor of behavior
change in response to PNF targeting residential recycling or energy conservation (Allcott 2011,
Ayres et al. 2009, Schultz 1999). There has been mixed evidence as to whether individuals who
conserve more than average initially decrease their conservation in response to PNF—the so-
called “boomerang effect” (Allcott 2011, Schultz et al. 2007, Fischer 2008, Jensen 1986). In an
attempt to thwart a possible boomerang effect, Opower includes individualized injunctive
feedback (praise for low initial energy use and conspicuously absent praise for high initial energy
use) (Schultz et al. 2007). There is conflicting research on the efficacy of this approach (Schultz
et al. Allcott 2011).
To analyze how change in settings varies with initial settings, I regressed change in
setting against initial setting for both the control and treatment groups independently. I used
only fully eligible subjects with Chicago ZIP codes. To analyze whether there was a boomerang
effect, I compared linear regressions for all of the data to linear regressions for only the subjects
who had average or above-average initial settings. Finally, I used an ANCOVA to see whether
the effect of initial setting on change in setting was due to subjects’ response to PNF or if it
represented an independent phenomenon (such as regression to the mean).
Is there a bias to the inaccuracy of normative beliefs? The second question of practical
significance was how normative beliefs related to the true descriptive norm. Although injunctive
norms are one way to achieve unidirectional behavior change, de-biasing inflated normative
beliefs is another. For each batch of initial surveys, I calculated the inaccuracy of each subject’s

Eric P. Rubin Social Norming and Thermostat Settings Spring 2013
22
normative beliefs as the difference between the subject’s normative beliefs and the median of
that subject’s initial survey batch. I used a t-test to compare the mean of all misperceptions to 0
and analyzed summary statistics for the distribution of the misperception to evaluate whether
there was a bias in subjects’ errors. Because I was interested in initial misperception and not
response to treatment, I included all initial responses (both control and treatment) from
respondents with Chicago ZIP codes, including those who were not fully eligible.
Evaluating the Theory of Changing Normative Beliefs
Are initial normative beliefs correlated with initial behavior? To test whether normative
beliefs were correlated with initial behavior, I regressed normative belief against initial setting. I
used all initial responses (both control and treatment) from respondents with Chicago ZIP codes,
including those who were not fully eligible. To evaluate whether there was a systematic
tendency for subjects’ beliefs to be higher or lower than their own behavior, I compared the
difference of each subject’s setting and belief to 0 with a single-sample t-test. To test whether
the difference between beliefs and settings depends on initial setting, I regressed the difference
between each subject’s belief and setting against his or her initial setting.
Initial settings and normative beliefs may be influenced by other factors, such as the
temperature outside (Kempton 1986), demographic factors (Stern et al. 1983, Black et al. 1985,
Vine 1986, Vine and Barnes 1988), and motivations for thermostat setting to the extent that they
correlate with attitudes (Stern et al. 1983, Black et al. 1985). To capture the unique predictive
contribution of normative beliefs beyond these factors, I made nested linear models with
successively more groups of variables (Nolan et al. 2008). First, to assess the influence of
outside temperature alone on settings, I regressed initial setting against temperature variables
(minimum daily temperature and average monthly temperature). Then, to evaluate the additional
predictive power of demographic variables, I simultaneously added demographic variables to the
model (age, income bracket, years of schooling, household size, homeownership, and whether
subjects paid for their heating). Next, to understand the unique contribution of motivations in
addition to temperature and demographics, I simultaneously added self-reported motivation for
initial setting to the model (concern with the environment, comfort, wastefulness, and personal
finance transformed from “None,” “A little,” “A moderate amount,” “A lot” to 0, 1, 2, 3).

Eric P. Rubin Social Norming and Thermostat Settings Spring 2013
23
Finally, to determine how much of the predictive power of normative beliefs remained after the
effects of outside temperature, demographics, and self-reported infuences on thermostat settings
had been accounted for, I added normative beliefs to the model. I used an ANOVA to
distinguish which additions to the model significantly improved its predictive capacity. For real-
world applications and to better understand the external validity of my results, I stripped away
the least significant variables from the model one at a time until the second-order Akaike's
Information Criterion score increased appreciably. This process allowed me to create the most
parsimonious but maximally predictive model of thermostat setting and to understand which
climatic, demographic, motivational, and perceptual factors most heavily influence thermostat
settings.
The first time I ran the nested models, I left out political affiliation variables from the
demographic level (whether the subject was a Democrat and whether the subject was a
Republican). I wished to better understand the effect of political affiliation in light of evidence
from Costa and Kahn that Democrats and Republicans respond very differently to Opower’s
Home Energy Reports, so I re-ran the models with political affiliation variables in the
demographic tier.
Does PNF influence normative beliefs? To evaluate whether normative beliefs moved toward
68 as a result of the treatment group, I regressed change in normative beliefs against initial
normative beliefs for the control and treatment groups and compared my results. I also
qualitatively analyzed the distribution of normative beliefs initially and in the followup for both
the control and treatment groups. For both of these investigations, I used only fully eligible
subjects with Chicago ZIP codes. Finally, I used an ANCOVA to see whether the effect of
initial belief on change in belief was due to subjects’ response to PNF or if it represented an
independent phenomenon (such as regression to the mean).
Does change in normative beliefs predict change in behavior? To test whether a change in
normative beliefs was associated with a change in behavior, I regressed change in normative
beliefs against change in behavior for both my control and treatment groups and compared the
results. I used only fully eligible subjects with Chicago ZIP codes.

Eric P. Rubin Social Norming and Thermostat Settings Spring 2013
24
Is behavior change associated with beliefs shifting toward the conveyed norm? I wanted to
differentiate between behavior moving in tandem with randomly changing normative beliefs
(which might be caused by behavior affecting beliefs through the false consensus effect) and
behavior moving in tandem with beliefs that conform to the norm conveyed by PNF (which is
more likely a result of social influence and generally representative of the Theory of Changing
Normative Beliefs). To do this, I made a plot that simultaneously displayed the initial setting,
final setting, initial beliefs, and final beliefs of each subject in the control and treatment groups
and qualitatively analyzed the patterns that emerged. For my qualitative analysis, I used only
fully eligible subjects with Chicago ZIP codes.
RESULTS
Participants
Internal validity
My control and treatment groups were systematically different across several dimensions.
All but one member of the control group was contacted earlier and had almost twice as long
between initial assessment and follow-up as members of the control group (Fig 6a, Fig 6b).
These differences in timing corresponded with differences in daily average temperatures, daily
minimum daily temperatures, and monthly average temperatures (Fig 7).

Eric P. Rubin Social Norming and Thermostat Settings Spring 2013
25
(a)
(b)
Fig 6. Subjects in the control group had longer delay times and were generally contacted sooner.
(a) Initial and follow-up settings and initial and follow-up survey dates for all fully eligible
members of the control and treatment groups. The mean initial settings of the control and
treatment groups were not significantly different. (b) Initial and follow-up normative beliefs and
initial and follow-up survey dates for all fully eligible members of the control and treatment
groups. The mean initial normative beliefs of the control and treatment groups were not
significantly different.

Eric P. Rubin Social Norming and Thermostat Settings Spring 2013
26
Fig 7. Monthly average, daily average, and daily minimum outdoor temperatures in Chicago
corresponding to the dates on which subjects took initial or follow-up surveys. Outdoor
temperature data for intervening dates is excluded. Outdoor temperatures became generally
colder from November to January and then began warming again. The coldest temperatures
were during the second baseline survey.
For all initial respondents, there was not a statistically significant correlation between
initial thermostat setting and daily minimum temperature or between initial thermostat setting
and monthly average temperature. Nor was there a statistically significant correlation between
initial normative beliefs and daily minimum temperature or between initial normative beliefs and
monthly average temperature. For both the control and treatment groups, there were not
statistically significant correlations between subjects’ change in thermostat setting and the
change in daily minimum temperature or average monthly temperature nor any linear
combination of those temperature variables. Change in beliefs was similarly not correlated with
the change in any combination of temperature variables. The average initial settings for my
control (67.4 degrees) and treatment (68.1 degrees) groups were not significantly different
(Welch’s two sample t-test: t = 0.34, df = 14.5, p = 0.74), nor were average initial normative
beliefs for my control (69.4 degrees) and treatment (68.4 degrees) groups significantly different
(Welch’s two sample t-test: t = -0.61, df = 12.0, p = 0.55).
Respondents in my treatment and control groups were qualitatively similar in their
education levels, political affiliation, thermostat characteristics and habits, self-reported concerns
and influences for thermostat setting, and time spent completing the survey. The most striking
difference between the control and treatment groups was that while roughly two thirds of my

Eric P. Rubin Social Norming and Thermostat Settings Spring 2013
27
control subjects and roughly two thirds of all initial subjects were female, only 18% of the
respondents in the treatment group were female.
External validity
In the aggregate, initial respondents were similar to the overall U.S. population and
Chicago population in household size and median income, but they wre more educated, and
disproportionately female (Table 1). My initial respondents were younger than the average
American but not the average Chicago resident. Compared to MTurk workers from the United
States, my respondents were similar in age (median age in mid-thirties) and gender (roughly 2/3
female), but they had higher education levels and income (Ross et al. 2010). The majority of
respondents were Democrats (53%) and renters (60%), although there was a plurality of
Independents (32%) and homeowners (34%).
Table 1: Demographic summary statistics for respondents, Chicago residents, and Americans.
Initial respondents
Chicago
United States
Mean household size
2.56
2.57
2.60
Median household income ~$50,000 $47,000 $53,000
% high school grad or more 95 80.2 85.4
% bachelors or higher 68 32.9 28.2
% female 61 51.5 50.8
Median age 31 32.9 37.2
My survey also yielded information about respondents’ self-reported motivations for
choosing their thermostat settings. Overall, respondents reported that their choice of thermostat
setting was most influenced by concern for comfort and personal finances, slightly less
influenced by concern with being wasteful, even less influenced by environmental concerns, and
almost not at all influenced by political concerns (Fig 8).

Eric P. Rubin Social Norming and Thermostat Settings Spring 2013
28
Fig 8. Distribution of self-reported influences on thermostat setting. Concern with comfort and
personal finances were the most influential.
Evaluating the Focus Theory of Normative Conduct
The interaction between initial setting group and receiving treatment produced nearly
significant differences in mean change in setting (two-way ANOVA: F(2,26) = 3.28, p = 0.054).
However, within the treatment group and within the control group, the median setting was not
significantly different depending on whether their initial settings were below average, average, or
above average (Treatment, Kruskal-Wallis one-way ANOVA: X2 = 3.95, df = 2, p = 0.14;
Control, Kruskal-Wallis one-way ANOVA: X2 = 1.28, df = 2, p = 0.53).
Fig 9. Change in thermostat setting as a function of initial setting group (below-average, average,
or above-average) for fully eligible subjects from Chicago in both control and treatment. There
are not significant differences in the median of change in setting between initial setting groups.
There are not significant differences in the median of change in setting due to the combined
effect of initial setting group and whether the subject received PNF.

Eric P. Rubin Social Norming and Thermostat Settings Spring 2013
29
Practical Questions
Is change in setting correlated with initial setting?
A linear regression of change in setting against initial setting for the treatment group was
not significant (R2 = -0.2105, F(1,14) = 3.73, p = 0.07 , Fig 10). The same regression applied to
only the data for which initial setting is 68 or greater yields an adjusted R2 of -0.47 and is almost
significant at a 1% level (R2 = -0.53, F(1,9) = 9.97, p = 0.012 , Fig 10). For this subset of the
data, the slope of the linear model is -0.61 (± 0.19) degrees of change in setting for every
additional degree of initial setting.
Fig 10. Change in setting as a function of initial setting for the control and treatment groups. For
subjects in the treatment group with average or above-average initial settings, change in setting
decreases with initial setting (p < 0.05). Subjects A, B, and C are noteworthy because they all
have very high initial settings, but only subjects A and B decreased their settings. The negative
proportionality between initial setting and change in setting does not extend to subjects in the
treatment group with below-average initial settings. Points are jittered to prevent overlap.
For the control group, a linear regression of change in setting against initial setting is not
significant (R2 =0.21, F(1,6) = 1.603, p = 0.25). The effect of initial setting as a continuous
Eric P. Rubin Social Norming and Thermostat Settings Spring 2013
30
variable on change in setting is significantly different for the control and treatment groups
(ANCOVA: F(1,28) = 7.29, p = 0.011)
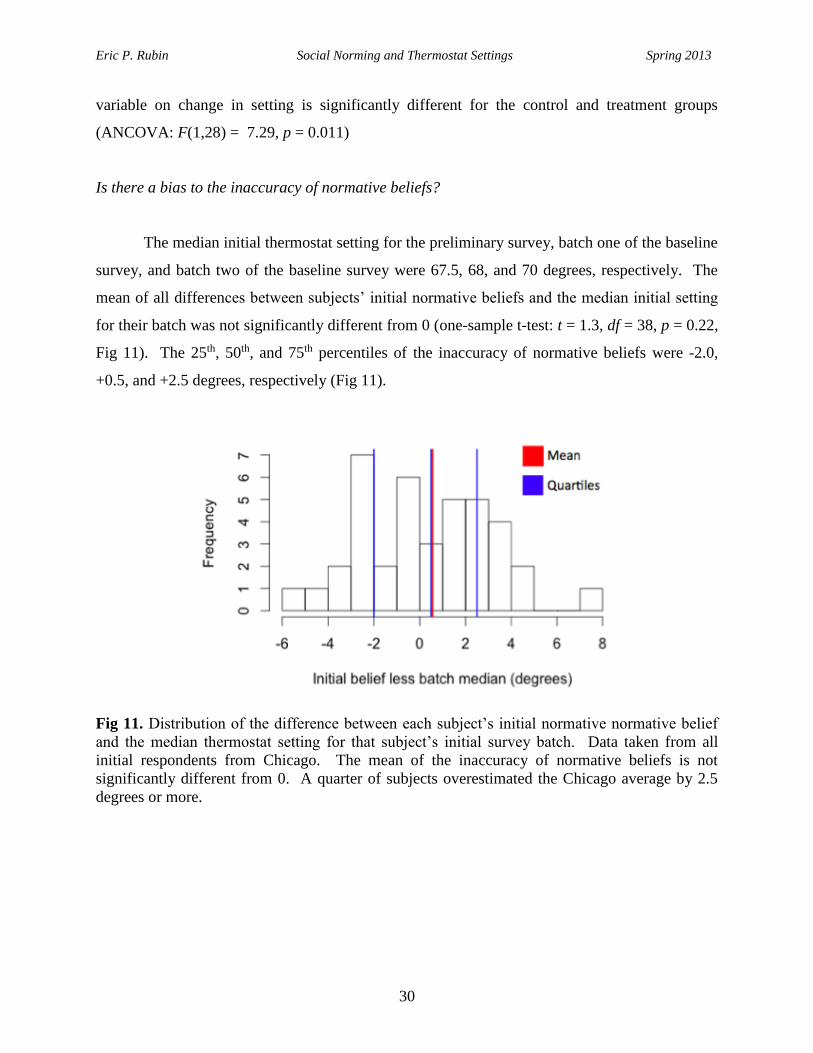
Is there a bias to the inaccuracy of normative beliefs?
The median initial thermostat setting for the preliminary survey, batch one of the baseline
survey, and batch two of the baseline survey were 67.5, 68, and 70 degrees, respectively. The
mean of all differences between subjects’ initial normative beliefs and the median initial setting
for their batch was not significantly different from 0 (one-sample t-test: t = 1.3, df = 38, p = 0.22,
Fig 11). The 25th, 50th, and 75th percentiles of the inaccuracy of normative beliefs were -2.0,
+0.5, and +2.5 degrees, respectively (Fig 11).
Fig 11. Distribution of the difference between each subject’s initial normative normative belief
and the median thermostat setting for that subject’s initial survey batch. Data taken from all
initial respondents from Chicago. The mean of the inaccuracy of normative beliefs is not
significantly different from 0. A quarter of subjects overestimated the Chicago average by 2.5
degrees or more.
Eric P. Rubin Social Norming and Thermostat Settings Spring 2013
31
Theory of Changing Normative Beliefs
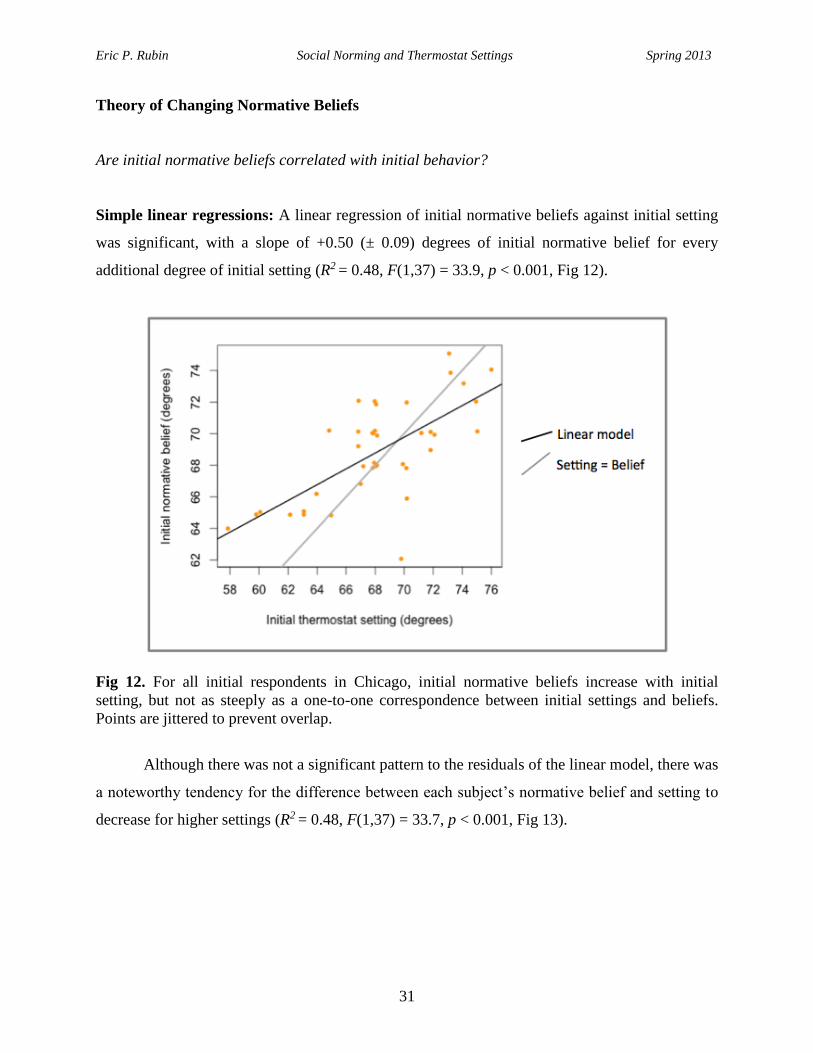
Are initial normative beliefs correlated with initial behavior?
Simple linear regressions: A linear regression of initial normative beliefs against initial setting
was significant, with a slope of +0.50 (± 0.09) degrees of initial normative belief for every
additional degree of initial setting (R2 = 0.48, F(1,37) = 33.9, p < 0.001, Fig 12).
Fig 12. For all initial respondents in Chicago, initial normative beliefs increase with initial
setting, but not as steeply as a one-to-one correspondence between initial settings and beliefs.
Points are jittered to prevent overlap.
Although there was not a significant pattern to the residuals of the linear model, there was
a noteworthy tendency for the difference between each subject’s normative belief and setting to
decrease for higher settings (R2 = 0.48, F(1,37) = 33.7, p < 0.001, Fig 13).

Eric P. Rubin Social Norming and Thermostat Settings Spring 2013
32
Fig 13. For all initial respondents in Chicago, subjects with lower initial settings were more
likely to think their setting was below average and subjects with higher initial settings were more
likely to think their setting was above average. Points are jittered to prevent overlap.
Overall, the average difference between each subject’s belief and setting (0.69 degrees)
was not significantly different from 0 (One-sample t-test: t = 1.42, df = 38, p = 0.16). Of the 39
initial responses, 6 subjects thought their setting was exactly average, 21 thought most people
had a higher setting than they did, and 12 thought most people had a lower setting than they did.
Nested linear modeling: The addition of normative beliefs to nested linear models improves the
amount of variance explained and the overall likelihood that the model is correct. In the simplest
model, temperature variables alone explained 22% of the variance in initial settings with monthly
average temperature making the most significant contribution to the prediction of initial settings
(intermediate models available in Appendix B). The addition of demographic variables to the
model increased the explained variance to 52%. Income, monthly temperature, whether the
subjects paid for their own heating were the most significant predictors in this model. Adding
subjects self-reported motivations for thermostat setting increased the variance explained to 65%
with concern for comfort being the most predictive new variable. Finally, the addition of initial
normative beliefs to the model increased the variance explained to 85% (Fig 14, Table 2).
Normative beliefs were an important factor in this final model; however, the magnitude of the

Eric P. Rubin Social Norming and Thermostat Settings Spring 2013
33
standardized effect of income and monthly average temperature were greater than the magnitude
of the standardized effect of normative beliefs. Both income and monthly average temperature
had higher probabilities of contributing to the final nested model (Table 3).
Fig 14. Percentage of the variance in initial settings explained by each nested model. Initial
normative beliefs contributed an additional 20% to the variance in initial settings explained by
the model.
Table 2. Correlation and significance for nested models. The addition of normative beliefs
increased the adjusted R2 of the model by 23% and yielded the most significant model.
Outside
temperature
Outside
temperature +
demographics
Outside
temperature +
demographics +
motivations
Outside
temperature +
demographics +
motivations +
beliefs
Multiple R2
0.22
0.52
0.65
0.85
Adjusted R2 0.15 0.31 0.36 0.63
p Value 0.05 0.05 0.08 0.005

Eric P. Rubin Social Norming and Thermostat Settings Spring 2013
34
Table 3. Standardized estimates, t-values, and p-values for the final model containing outdoor
temperature variables, demographic variables, self-reported influences on thermostat setting, and
citywide descriptive normative beliefs.
Predictor
Beta (standardized)
t-Value
p-Value
Normative beliefs
+0.59
3.468
0.004
Comfort +0.39 2.273 0.04
Wasteful -0.002 -0.012 0.99
Environmental -0.29 1.601 0.13
Financial -0.31 -1.421 0.18
Age -0.08 -0.499 0.63
Income -0.73 -3.614 0.003
Household size -0.04 -0.286 0.78
Education level +0.39 2.027 0.06
Homeowner +0.28 1.418 0.18
Pay heating -0.46 -2.317 0.04
Daily min temp +0.23 1.352 0.20
Monthly average -0.74 -3.624 0.003
The addition of demographic factors significantly improved the predictive capacity of the
model (ANOVA: F(6,18), = 3.65, p < 0.5), but self-reported motivations did not (ANOVA:
F(4,14) = 3.27, p = 0.12). Normative beliefs had the most significant change in the predictive
capacity of the model (ANOVA: F(1,13) = 4.36, p < 0.01).
The ratio of explanatory power to density of the model (as measured by second-order
AIC) was appreciably improved by removing the least significant variables one-by-one from the
largest model (AICc = 103.15) until the model was based on only normative beliefs, monthly
average temperature, income, whether the subjects paid for heating, and concern with comfort

Eric P. Rubin Social Norming and Thermostat Settings Spring 2013
35
(AICc = 68.28). Reducing the model to beliefs, concern with comfort, and monthly temperature
increased AICc to 69.6 and yielded a highly significant model (R2 = 0.50, F(3,23) = 7.715, p <
0.001). A simple regression of setting against perception had an AICc of 72.6.
Although I did not include political affiliation variables in my main nested models, my
additional exploration of nested models suggests that subjects who were Democrats tended to
have lower initial settings. In the second-tier model with climatic and demographic variables,
the influence of Democratic affiliation was significant and had the fourth largest effect size after
monthly average outdoor temperature, whether subjects paid for heating, and income. However,
in the final model, Democratic affiliation was not significant (ß(standardized) = -0.22, t = -0.14,
p = 0.18). The inclusion of political affiliation variables into the nested models reduces the
unique contribution of normative beliefs—it only adds 8% to the variance explained—but the
addition of normative beliefs was still significant (Table 4, ANOVA: F(1,11) = 5.49, p < 0.05).
The final model with political affiliation included had a worse ratio of explanatory power to
parsimony as measured by the second-order AIC (AICc = 126.9).
Table 4. Correlation and significance for nested models with political affiliation variables added,
beginning with the second-tier model. With political affiliation variables, the addition of
normative beliefs increased the adjusted R2 of the model by 13% and yielded the second most
significant model.
Outside
temperature
Outside
temperature +
demographics
Outside
temperature +
demographics +
motivations
Outside
temperature +
demographics +
motivations +
beliefs
Multiple R2
0.22
0.71
0.77
0.85
Adjusted R2 0.15 0.52 0.50 0.63
p Value 0.05 0.008 0.04 0.01

Eric P. Rubin Social Norming and Thermostat Settings Spring 2013
36
Does PNF influence normative beliefs?
For the treatment group, change in normative beliefs was significantly correlated with
initial normative beliefs (R2 = -0.42, F(1,14) 10.13, p < 0.01, Fig 15). In the linear model,
predicted normative beliefs decreased by -0.58 (± 0.18) for every additional degree of initial
normative beliefs. The most common final beliefs were 68 and 65 (n=7, n =4). A quarter of
subjects (n=4) of subjects shifted their beliefs to 68 exactly and 19% (n=3) of subjects remained
at 68. Two subjects (13%) shifted their beliefs to 65, the 20th percentile setting conveyed in
PNF, and another two maintained their beliefs at 65.
In the control group, a linear regression of change in beliefs against initial beliefs
explained less of the variance, had a flatter slope (-0.1855 ± 0.11 degrees of belief change per
degree initial beliefs), and was not significant (R2 = 0.33, F(1,6) = 3.02, p = 0.13). The
difference in the effect of initial beliefs on final beliefs was significantly different between the
control and treatment groups (ANCOVA: F(1,28) = 4.47, p < 0.05, Fig 15).
In the control group, 63% of subjects (n=5) had no change in beliefs. There was also no
significant correlation for the control data when I subsetted it less strictly by adding in subjects
who did not pay their own utilities or even by relinquishing the eligibility criteria altogether. No
single value was overrepresented in the final beliefs. Two subjects reported 72 as their follow-up
belief, making it the most represented final belief. No subjects reported 65 as their follow-up
belief.

Eric P. Rubin Social Norming and Thermostat Settings Spring 2013
37
Fig 15. There was a significant negative correlation between change in beliefs and initial beliefs
for subjects who received PNF (p < 0.01) but not for subjects in the control group. A
disproportionate number of subjects in the treatment group had final beliefs that were 68 (gray
diagonal line) or 65 (green diagonal line). Points are jittered to prevent overlap.
Is change in normative beliefs predictive of change in behavior?
For the treatment group, change in settings was significantly positively correlated with
change in normative belief (R2 = 0.46, F(1,14) =11.96, p < 0.01, Fig 16) In the linear model,
predicted change in settings increased by 0.71 degrees (± 0.21) for every additional degree of
change in normative beliefs. However, this model is strongly leveraged by Subject D, who
increased his thermostat setting and normative belief by 7 degrees (Fig 16). Without subject D,
the correlation was much weaker and not significant (R2 = 0.18, F(1,13) = 2.782, p = 0.12). It is
noteworthy that subjects A and B, who were the two subjects with high initial settings who
decreased their settings the most, decreased their settings and beliefs by substantial and roughly
equivalent amounts, although each subject decreased his belief by slightly more than his setting
(Fig 16).
For the control group, in contrast, change in settings was not significantly correlated with
change in normative belief (R2 = 0.002, F(1,6) = 1.38, p = 0.91).

Eric P. Rubin Social Norming and Thermostat Settings Spring 2013
38
Fig 16. For the treatment group but not the control group, a greater change in beliefs
significantly correlates with a greater change in behavior, though the effect size is not as strong
as a one-to-one correspondence between belief change and behavior change. Subjects A and B
in the treatment group substantially decreased their settings and beliefs. Subject D substantially
increased his setting and belief. Points are jittered to prevent overlap.
Is behavior change associated with beliefs shifting toward the conveyed norm?
By simultaneously visualizing initial settings, follow-up settings, initial beliefs, and
follow-up beliefs for each subject, it is possible to see qualitative relationships between those
variables and the difference between their initial and final values (Fig 17). The most noteworthy
new information from this qualitative assessment is that subjects with high initial beliefs (n=2)
who decreased their beliefs toward 68 had the largest decrease in settings. These two subjects
(subjects A and B) decreased their settings roughly as much as they decreased their beliefs. The
other subject with a significant change in settings (subject D) was the subject who strongly
contributed to the positive correlation between change in settings and change in beliefs. Subject
D did not change his beliefs to align with the conveyed norm, although he did change his settings
as much as his beliefs. Instead, his beliefs shifted away from the norm conveyed by PNF, as did
his behavior.

Eric P. Rubin Social Norming and Thermostat Settings Spring 2013
39
Fig 17. Initial settings, follow-up settings, initial beliefs, and follow-up beliefs for each fully
eligible subject in the treatment group. Each arrow indicates a change in setting and/or belief of
a subject between the initial survey and follow-up survey. Subjects A and B decreased their
settings and beliefs. Subject C did not change his setting or belief. Subject D increased his
setting and belief. Points are jittered to prevent overlap.
Fig 18. Initial settings, follow-up settings, initial beliefs, and follow-up beliefs for each fully
eligible subject in the control group. Each arrow indicates a change in setting and/or belief of a
subject between the initial survey and follow-up survey. Points are jittered to prevent overlap.

Eric P. Rubin Social Norming and Thermostat Settings Spring 2013
40
In the control group, no notable new information or patterns emerge through this
visualization method. Only one subject had beliefs that moved toward the norm and only one
subject had settings that moved roughly in tandem with beliefs (Fig 18).
DISCUSSION
The Theory of Changing Normative Beliefs explains the findings from this pilot study
more powerfully than does the Focus Theory of Normative Conduct. To predict a subject’s
change in thermostat setting in response to PNF, it is not sufficient to know that subject’s initial
setting—it is also necessary to know whether that subject’s normative beliefs were influenced by
PNF. Multiple lines of evidence support this conclusion. Initial setting as a categorical variable
failed to predict differences in behavior change, discrediting the utility of the Focus Theory of
Normative Conduct in this context. All four assumptions of the Theory of Changing Normative
Beliefs were validated. Initial normative beliefs and initial settings were positively correlated,
and there was a substantial effect size. These findings suggest that there is a strong (perhaps bi-
directional) causal link between beliefs and settings, as has been demonstrated in previous
studies of many other behaviors (Monin and Norton 2003, van der Pligt 2006, Lapinkski et al.
2007, Thøgersen 2006, Nolan et al. 2008, Gockeritz et al. 2010). This link is further supported
by evidence I gathered from nested hierarchical modeling, which indicates that knowledge of
subjects’ initial beliefs increases the explanatory power of a multivariate model of initial settings
in a way that is significant, substantial, and separate from any intervening connection to outside
temperatures, demographic factors, or self-reported influences to thermostat setting (Nolan et al.
2008). In addition, my analysis confirms research that suggests PNF has a durable influence on
normative beliefs (Nolan 2011, Neighbors et al. 2004) and provides some evidence that a change
in beliefs is correlated with a change in thermostat settings. My most holistic analysis of
subjects’ response to PNF suggests that there was a tendency for subjects to decrease their
settings if they had initially overestimated the citywide average and if they changed their
normative beliefs in response to PNF (Fig 19). The finding that changing normative beliefs
mediate the effect of PNF on behavior is consistent with studies involving collegiate binge
drinking (Neighbors et al. 2004, Collins et al. 2002, Mattern and Neighbors 2004).

Eric P. Rubin Social Norming and Thermostat Settings Spring 2013
41
Fig 19. The three-factor model of normative belief generation integrated with the Theory of
Changing Normative Beliefs. My results are harmonious with this model in that they
demonstrate a correlation between beliefs and behavior, influence of PNF on normative beliefs,
and influence of normative beliefs on behavior.
Participants
Internal Validity
The most important systematic difference between the control and treatment groups was
whether subjects received PNF. Systematic differences in initial settings and beliefs between the
control and treatment groups would detract very heavily from the internal validity of my study,
but there were not significant differences in initial settings or beliefs between the control and
treatment groups.
A systematic difference in outside temperature between control and treatment groups
could also be a major confounding factor. In my multivariate models, lower temperatures—
especially lower average monthly temperatures—were associated with higher initial settings. It
is plausible that outdoor temperature would confound the relationship between settings and
beliefs or that changes in behavior or beliefs might be misattributed to PNF when they were in

Eric P. Rubin Social Norming and Thermostat Settings Spring 2013
42
fact due to differences in outdoor temperature. This is because many people subscribe to the
valve theory of thermostats, which supposes that a house will heat up faster if the thermostat is
set higher (Kempton 1986). Although the valve theory is not accurate, if subjects used it as their
model of how their thermostats worked, they might have increased the nighttime setting on cold
nights when they wanted to minimize the time before they were warm and comfortable.
Although there were temperature differences between the control and treatment groups,
they do not damage the internal validity of this study for three main reasons. First, unique
contribution of beliefs to the explanatory power of the nested models suggests that the
connection between normative beliefs and thermostat settings is not caused by a connection
between beliefs and outdoor temperatures. Second, neither change in settings nor change in
beliefs significantly correlated with change in any of the temperature variables or any
combination of the temperature variables (although monthly temperature was a significant
variable within the nested models). Third, there were no significant differences in average initial
settings or average initial beliefs between the control and treatment groups.
The delay between initial contact and follow-up was markedly different for the control
and treatment groups, but it was similar (33 days ± 4 days) within the treatment group, which is
far more important. For the treatment group, longer delay times might be associated with a
greater decay in belief and behavior change due to PNF. However, for the control group, delay
time only matters as it relates to outdoor temperature, which I have analyzed separately.
The only significant demographic difference between the control and treatment groups
was the proportion of females in each group, but gender was not a significant variable in the
nested hierarchical models of initial settings.
External validity
Based on demographic factors alone, the results of this pilot study can be generalized to
populations of Chicagoans and Americans that are younger, more educated, and
disproportionately Democrats. My test subjects were generally younger than the average
American, which may have affected their tendency to change their normative beliefs and
consequently their behavior in response to PNF, although I have no evidence to support this. My
sample was also skewed toward college graduates and Democrats, who have been shown to be
Eric P. Rubin Social Norming and Thermostat Settings Spring 2013
43
more responsive to Opower (Costa and Kahn 2010). The two subjects in the treatment group
who most strongly informed my qualitative analysis were Democrats, but only one was a college
graduate. Overall, my subjects were also disproportionately female, but subjects in my treatment
group were not.
Evaluating the Focus Theory of Normative Conduct
There is very little evidence that the Focus Theory of Normative Conduct effectively
explains the impact of PNF on thermostat settings. I found that subjects’ average change in
settings was almost significantly different (p = 0.054) depending on whether they received PNF
and their initial setting group (below-average, average, above-average). The combination of
whether subjects received PNF and their initial setting group might suggest that PNF induces
conformity in the treatment group. However, there was no statistical evidence of conformity
within the treatment group. The Kruscal-Wallis test shows that within the treatment group there
were not statistically significant differences in the median change in behavior between any of the
initial setting groups. Thus, even if one were to assume that subjects with below-average initial
settings did not conform to the descriptive norm because they instead focused on an implicit,
pro-environmental injunctive norm, the Kruscal-Wallis test indicates that the behavior of
subjects with above-average initial settings was not significantly different from that of the
average or below-average initial setting groups. In summary, categorizing subjects by their
initial behavior relative to the norm does not accurately predict patterns of behavior change
within the treatment group, nor is there strong statistical evidence that there are any significant
differences in behavior change that are a product of both receiving PNF and initial setting group.
Practical questions
Is change in setting correlated with initial setting?
My results indicate that subjects with the highest initial settings decreased their settings
the most in response to PNF, but that subjects with below-average initial settings generally did
not increase their settings.

Eric P. Rubin Social Norming and Thermostat Settings Spring 2013
44
My results do not suggest that all subjects conform to the norm in proportion to their
initial deviance from it; however, subjects with higher initial settings in the treatment group
whose initial settings were average or above-average had a tendency to reduce their settings
more. Other literature on pro-environmental social norming has offered these explanations for
why individuals who conserve the least initially might conserve the most in response to PNF:
regression to the mean, the relative ease of conservation given high initial consumption, and
Feedback Theory (Allcott 2011, Schultz 1999). I discuss each of these potential explanations
below.
Regression to the mean could explain why subjects’ settings become more moderate in
proportion to their initial deviance from the norm, because my experimental design is a test/re-
test of thermostat settings that have some random fluctuation (Schultz 1999). However, given all
my data, it is unlikely that the conformity in proportion to initial deviance that I did observe was
caused by regression to the mean. In the control group, extreme settings tended to become more
extreme in a manner that was significantly different from the effect of initial setting on change in
settting in the treatment group. For subjects in the treatment group with below-average initial
settings, the most extreme settings did not become more moderate.
It could be that subjects with the highest settings in the treatment group tended to lower
their thermostat settings the most because they could do so without being uncomfortable. One
would expect that a subject who turns her thermostat down by five degrees or more would have a
very high initial setting, because few people with average initial settings would be comfortable
with such low final settings. For many types of pro-environmental PNF, it is plausible that
subjects who have the most undesirable behavior initially will respond the most to feedback, in
part because it is easiest for them to do so (Allcott 2011). For example, someone who recycles
only 10% of his household waste may increase recycling rates more than someone who recycles
90% of her household waste, not because he is more motivated by PNF, but because it is easier
to do so (Schultz 1999).
Finally, it has been proposed that PNF is best conceptualized as operating like any other
form of feedback (Schultz 1999). According to Feedback Theory, when recipients of feedback
are informed of the discrepancy between their behavior and a standard, subjects are motivated to
align their behavior with the standard in proportion to the magnitude of that discrepancy so long
as the standard represents a goal they feel they should achieve (Schultz 1999, Collins et al.
Eric P. Rubin Social Norming and Thermostat Settings Spring 2013
45
2002). It is unimportant whether the standard is the past behavior of the recipient, the goal of an
authority figure, or a social norm (Jensen 1986). It is possible that subjects’ response to PNF as
a function of initial setting can be explained by considering PNF as generic feedback (Schultz
1999). Even the lack of conformity from subjects with below-average initial settings can be
explained if one assumes that those subjects did not find the norm motivational. Perhaps they
did not perceive benefits to increasing their settings. Many subjects with low settings said their
initial thermostat setting was very influenced by substantial concern with personal finances,
which would suggest that for these subjects the perceived cost of conformity would be high,
which tends to dampen conformity (Rimal and Real 2005, Rimal et al. 2005). Another reason
that subjects with below-average initial settings might not have found the citywide average to be
a motivational standard is that the PNF also provided the “efficient setting,” which conveys
social approval for energy conservation in a manner similar to the explicit injunctive norms used
by Opower (Schultz et al. 2007).
The relationship between change in settings and initial settings in my data could be
consistent with Feedback Theory if one assumes that subjects with below-average initial settings
generally did not find the standard conveyed by PNF to be motivational. Moreover, a logical
advantage of Feedback Theory relative to the Focus Theory of Normative Conduct is that the
standard provided by feedback is a persistent mental construct that might explain the effect of
PNF on behaviors executed after normative focus has faded (Schultz 1999). However, Feedback
Theory has two chief limitations. First, emphasizing PNF as feedback and not as social
influence impedes program designers from considering the proximate psychological mechanisms
by which normative beliefs can influence behavior. Second, this approach does not explicitly
consider the difference between cases in which the normative standard reminds recipients of a
pre-existing belief and those in which it changes the recipient’s normative belief; yet, to the
extent that normative beliefs influence behavior, successfully changing normative beliefs is
much more likely to induce behavior change (Borsari and Carey 2001).

Eric P. Rubin Social Norming and Thermostat Settings Spring 2013
46
Is there a bias to the inaccuracy of normative beliefs?
Normative beliefs about thermostat settings were often inaccurate, but there was not a
bias to the inaccuracy. Subjects were not significantly more likely to overestimate the citywide
average setting than to underestimate it.
Because thermostat setting is a private behavior—that is, invisible to the public eye—it is
understandable that normative beliefs were not tightly clustered on the true value, because there
is less opportunity for observations of others to correctly inform individuals’ beliefs. It is also
unsurprising that there was not a significant bias to the inaccuracy of normative beliefs. Based
on the three-factor model of normative belief formation, it is reasonable to expect that people
will have a bias to the inaccuracy of their normative beliefs about a behavior only if they
disproportionately observe one extreme of the behavior or disproportionately receive
communication about one extreme of the behavior. For example, college students overestimate
the prevalence of alcohol abuse because binge drinking is conspicuous and communication about
binge drinking exceeds its true prevalence (Prentice and Miller 1993, Baer et al. 1991, Borsari
and Carey 2001). Unlike binge drinking, neither high nor low thermostat settings are
conspicuous or overrepresented in communications (Baer et al. 1991).
Although there was not a statistical bias to the inaccuracy of normative beliefs regarding
thermostat settings, there was appreciable opportunity for reducing inflated normative beliefs.
Overestimates were as high as 8 degrees, and 31% of subjects (12/39) overestimated by 2
degrees or more. To the extent that my sample is representative of broader demographics and
the Theory of Changing Normative Beliefs is correct, this wide distribution of normative beliefs
is promising for future PNF campaigns.
Evaluating the Theory of Changing Normative Beliefs
Are initial normative beliefs correlated with initial behavior?
Initial beliefs significantly predicted initial behavior, and the strength of the correlation
(R2 = 0.48) was comparable to that found in previous research on the influence of descriptive
normative beliefs on home energy conservation (R2 = 0.45) (Nolan et al. 2008). This finding is

Eric P. Rubin Social Norming and Thermostat Settings Spring 2013
47
also congruent with research on the false consensus effect. Research shows that university
students who showered more during a water shortage estimated that their also peers showered
more (Monin and Norton 2003), and homeowners with high thermostats settings are less likely to
think most members of the broader population decrease their thermostat settings when not at
home (van der Pligt 2006).
The relationship between initial settings and initial beliefs does not imply a uniform false
consensus effect, nor do my results imply that everyone sets their thermostat to match their
beliefs. All subjects with initial settings below 65 degrees thought the average setting was above
their setting, and all subjects with initial settings above 73 degrees thought the average setting
was below their setting. The tendency for people with extreme settings to have more moderate
normative beliefs is congruent with the three-factor model of normative beliefs. For subjects
with extreme settings, communication and observations about the norm are likely to be closer to
the true norm than self-knowledge. The relationship between beliefs and behavior in my data
suggests that beliefs are not the product of self-knowledge and random variability, but, rather,
self-knowledge and constant factors that pull beliefs toward a central value closer to the true
norm.
My investigation of the correlation between initial settings and initial beliefs does not
yield evidence of bi-directional causal relationship between settings and beliefs, but it does not
preclude it, either. My analysis shows that there is a linear relationship between subjects’ initial
settings and their initial beliefs about the citywide average, but based on my analysis, without
information about subjects’ response to PNF, this connection could be explained by the three-
factor model, social influence, or both.
My nested linear models show that there is a relationship between beliefs and settings
that is not due to confounding connections between beliefs and climatic, demographic, or
motivational variables. This connection speaks to a unique mental phenomenon that explains an
additional 20% of the variance in initial settings and dramatically improves the model’s
statistical significance (Nolan et al. 2008). It is noteworthy that including political affiliation to
the demographic variables decreases the marginal contribution of normative beliefs to variance
explained by the model to 8%. This is still more than the unique explanatory power attributed to
normative beliefs in previous research (6%) in which political affiliation was not one of the
demographic variables (and thus its potential to confound the relationship between beliefs and

Eric P. Rubin Social Norming and Thermostat Settings Spring 2013
48
behavior was not taken into account) (Nolan et al. 2008). Backwards stepwise modeling shows
that the significance and the effect size of normative beliefs are comparable to that of variables
we intuitively expect to affect settings, such as concern with comfort and monthly temperature
(Stern et al. 1983, Kempton 1986). The linear model has a slope of +0.50 degrees of initial
normative belief for every additional degree of initial setting. That the slope of the linear model
is not as steep as +1 degree of belief / degree of setting suggests that other factors, such as
comfort, personal finances, and unbiased observations and communications, pull behavior and
beliefs toward 68 degrees. That the slope of the linear model is markedly steeper than a flat line
suggests (in conjunction with evidence from multivariate modeling) that the causal relationship
between beliefs and behavior is strong.
Just as the three-factor formation of normative beliefs is not necessarily conscious (Nolan
2011), normative beliefs can strongly influence behavior yet operate unconsciously (Schultz et
al. 2008, Nolan et al. 2008, Melnyk et al. 2011). An example of this disconnection can be found
in a study of normative influence on household energy conservation. Researchers found that
while residents thought their normative beliefs about their neighbors’ energy behavior did not
strongly influence their energy use, their descriptive normative beliefs were actually more
predictive of their energy use than demographic variables or beliefs about environmental, social,
or personal financial effects of energy conservation (Nolan et al. 2008). Similarly, descriptive
social norming spurred the greatest reductions in home energy use—exceeding the impact of
alternative appeals to environmental protection, social responsibility, or personal financial
benefits—but residents who received information about social norms had the lowest estimation
of how much the intervention they received influenced their behavior (Nolan et al. 2008).
Does PNF influence normative beliefs?
Whereas the beliefs of subjects in the control group tended to remain fixed, the beliefs of
subjects in the treatment group generally became more moderate in proportion to their initial
deviance from the conveyed norm. For the treatment group, normative beliefs in the follow-up
survey were disproportionately 65 and 68 degrees. The plurality of subjects who reported 65
degrees as their follow-up normative belief suggests that some subjects only remembered the
efficient setting from the PNF even though they had to correctly enter the difference between

Eric P. Rubin Social Norming and Thermostat Settings Spring 2013
49
their setting and the average setting (68) to complete the baseline survey. In line with the three-
factor model of normative belief formation, I assume that subjects who shifted their beliefs
toward the norm conveyed by PNF but did not report their follow-up beliefs as exactly 68 are not
misremembering the information from the PNF, but rather these subjects may have used PNF as
one input to their dynamically updated beliefs, along with new observations, communications,
and changes in personal behavior (Nolan 2011). A study of the effect of a one-time PNF
intervention shows that PNF affected normative beliefs about residential recycling and that the
subsequent decay of that effect was consistent with the three-factor model and not forgetfulness
(Nolan 2011). The finding that PNF affects normative beliefs is also consistent with analysis of
PNF targeting binge drinking (Collins et al. 2002, Neighbors et al. 2004), as well as social
marketing targeting binge drinking (Clapp et al. 2003).
Is change in normative beliefs predictive of change in behavior?
As one might expect from the strong connection between initial beliefs and initial
behavior, there is a positive correlation between change in beliefs and change in behavior. As
with the correlation between initial beliefs and initial behavior, this correlation alone does not
speak to whether belief change affects behavior change, vice versa, or a combination. For the
control group there is no correlation between change in beliefs and change in behavior, largely
because there is so little change in beliefs. To more fully understand whether PNF causes belief
change, which then causes behavior change, it is necessary to analyze both the change in
behavior and beliefs of each subject and the initial behavior and beliefs of each subject.
Is behavior change associated with beliefs shifting toward the conveyed norm?
Qualitative analysis of the initial and follow-up settings and beliefs of each subject added
valuable insights about the missing boomerang effect, the non-uniform response of subjects with
high initial settings, and the causality of the relationship between change in settings and change
in beliefs.
In the treatment group, all but one of the subjects shifted their beliefs toward either the
efficient setting or the average setting conveyed in PNF. Subjects with initial beliefs below 68

Eric P. Rubin Social Norming and Thermostat Settings Spring 2013
50
degrees either remained fixed in their beliefs or increased their estimation of the citywide
average without a corresponding increase in settings. This suggests that the lack of a boomerang
effect is not due to a lack of belief change, but to the reluctance of subjects with below-average
initial settings to shift their behavior to match their increased estimation of the average. If this
finding holds true for broader populations and for other private, negative-cost conservation
behaviors, then PNF might productively target a wide range of such behaviors. Normative
beliefs about private behaviors are likely to be inaccurate but not biased, which means that PNF
can productively reduce underestimations of conservation, but it will also reduce overestimations
of conservation. Fortunately, this pilot study suggests that for conservation behaviors that save
residents money, changing normative beliefs do not induce a boomerang effect.
Of the three subjects with unusually high initial settings (subjects A, B, and C), the two
who decreased their settings (subjects A and B) also shifted their beliefs toward the norm,
whereas the one who did not change his setting (C) had unchanged beliefs. Unlike the Focus
Theory of Normative Conduct and Feedback Theory, the Theory of Changing Normative Beliefs
also explains why certain subjects with high-initial settings reduce their settings in response to
PNF and others do not.
My qualitative analysis does not prove a causal sequence of influence whereby PNF
affects beliefs and beliefs affect behavior. However, it does reveal that in the treatment group
(but not the control group) most of the subjects who changed their behavior in tandem with their
beliefs shifted their beliefs toward 68 and/or 65. One prominent counterexample is subject D,
who significantly increased his beliefs and behavior away from the norm. In light of his
increased deviance from the norm, D likely represents an example of the influence of behavior
on beliefs due to the false consensus effect, rather than a data point in support of the Theory of
Changing Normative Beliefs (Nolan 2011, Monin and Norton 2003, van der Pligt 2006).
Thus, my results indicate that normative beliefs conform to PNF and settings move in
tandem with beliefs for subjects with high initial settings and beliefs. This offers preliminary
support that descriptive-only PNF about a citywide reference group can increase overall
residential conservation behavior by changing normative beliefs about those behaviors. This
finding is consistent with the only other study of a descriptive-only PNF to date in which
measured normative beliefs were measured, which found that the impact of descriptive-only PNF
on binge drinking is mediated by changing normative beliefs (Neighbors et al. 2004). It is also

Eric P. Rubin Social Norming and Thermostat Settings Spring 2013
51
in harmony with research on a social marketing campaign targeting binge drinking that found a
change in normative beliefs mediated a change in drinking behavior (Mattern and Neighbors
2004), but in contrast to an equivalent study that found social marketing affected normative
beliefs but produced opposing behavioral changes (Clapp et al. 2003).
It is noteworthy that changing normative beliefs about the entire city of Chicago
influenced individuals’ behavior. There is empirical evidence of correlations between normative
beliefs pertaining to widespread geographical reference groups and residential energy
conservation behavior (Nolan et al. 2008, van der Pligt 2006); however, many theories of social
influence strongly emphasize the importance of reference groups that are socially significant,
aspirational, and/or very similar to the subjects of influence, (Thøgersen 2006, Rimal and Real
2005, White et al. 2009, Abrams et al. 1990, Terry and Hogg 2000). Although descriptive
normative beliefs about all Chicago residents are unlikely to directly affect behavior through
proximate mechanisms that require these qualities of the reference group, it is possible that my
data captures the influence of a more local reference group. Normative beliefs about local
reference groups (such as friends) may “spill over” and inform normative beliefs about more
global reference groups (such as Chicago residents), and vice versa (Nolan 2011). Thus, my data
that demonstrates an initial correlation between beliefs and settings may not speak to a direct
connection between citywide normative beliefs and settings, and my data on changing normative
beliefs may capture the effect of indirectly changing subjects’ beliefs about a more local
reference group.
Limitations
In addition to the limited sample size, the chief limitations of this study concern how and
what variables I measured, the design of the PNF, and the target behavior.
With respect to measurement, settings were self-reported and not directly measured.
There is some evidence that self-reported thermostat settings and measured indoor temperatures
bear a close relationship (Vine and Barnes 1988). While it is plausible that the behavior change I
recorded is inaccurate because so many people do not know how to use their programmable
thermostats (Peffer et al. 2011), I can still generalize about the effect of beliefs on intentions, if
not actual energy use outcomes. My analysis of the inaccuracy of normative beliefs is also

Eric P. Rubin Social Norming and Thermostat Settings Spring 2013
52
limited by my measurement technique. When I calculated how inaccurate each subject’s
normative beliefs were, I used the median of his or her initial survey batch as the “true” norm. I
am also limited in my conclusions by what variables I chose to measure. Because I only
followed up with subjects once, I cannot comment on the decay of normative belief change or
behavior change in response to the PNF. Because I did not ask subjects about their opinions on
the reference group or the behavior, I also cannot comment on the specific proximate
mechanisms that lead from a change in normative beliefs to a change in behavior.
The design of the PNF also limits the conclusions I can draw from this study. I included
the “efficient setting” in an effort to be more faithful to Opower’s PNF, but in doing so I created
a more complex PNF that has an implicit, pro-environmental frame and two sets of standards.
This particularly complicates my analysis of the missing boomerang effect and of whether
subjects who reported 65 degrees as their follow-up beliefs were influenced by the efficient
setting, the average setting, or random variability. The context of my PNF was also unrealistic—
and therefore limited in its applicability—because subjects who received PNF had to accurately
report the difference between their settings and the average, and because all subjects had to
generate an estimate of the citywide average, which is itself a type of normative focus.
Reporting the difference between personal and average behavior requires a degree of attention to
the PNF that might not occur for individuals receiving unsolicited PNF in the real world. This
forced attention is particularly important because there is inconsistent evidence suggesting as to
whether cognitive deliberation increases (Melnyk et al. 2011) and decreases (Kredentser et al.
2011) the power of descriptive normative influence. Additionally, the normative focus due to
generating citywide estimates may play a confounding role and is not necessarily accounted for
by the control group, because there may be interaction effects between normative focus and
treatment (Schultz et al. 2008).
The behavior I targeted with my intervention also limits the inference of this study.
Home thermostat setting has four main dimensions that make it potentially incomparable to other
behaviors that might be targeted in a pro-environmental social norming campaign. First, because
I restricted my treatment and control groups to subjects who paid their own utility bills, I was
more likely to avoid the boomerang effect, and subjects with high initial thermostat settings had
a greater incentive to conform to the norm. Negative-cost behaviors are much more easily
influenced than behaviors that involve an unambiguous sacrifice (such as recycling) or an

Eric P. Rubin Social Norming and Thermostat Settings Spring 2013
53
immediate sacrifice for future benefit (such as purchasing an energy-efficient appliance or
upgrading building efficiency) (Wilson and Dowlatabadi 2007). Second, residential thermostat
settings may be only partially determined by my subjects. A substantial percentage (35%) of my
subjects reported that they were not always the person to change their thermostat to its nighttime
setting in the week prior to my survey, and most (86%) of all my initial subjects from Chicago
lived in households of two people or more. In this way, thermostat setting is like turning off
lights in a home, but unlike using public transportation to commute to work. Third, thermostat
setting is a private behavior, unlike taking reusable bags to the grocery store or installing solar
panels on one’s roof. Private behaviors are less likely to be affected by the powerful proximate
mechanism of anticipated social sanction or approval (Thøgersen 2006). But, as my research
suggests, normative beliefs about private behaviors may be more inaccurate, which would
provide more opportunity for informing individuals that their peers engage in more pro-
environmental behavior than they had estimated. Finally, thermostat setting may be a one-time,
a habitual, or an inconsistently repeated action, depending on whether individuals have
programmable thermostats and how they use them. Holding other factors constant, it should be
easier to persuade someone to do something once, rather than to do that thing repeatedly (Wilson
and Dowlatabadi 2007). About half (53%) of all respondents had programmable thermostats,
and about half of those respondents (24% of all subjects) reported that their nighttime thermostat
settings were fully automated. Among the subjects who did not fully automate their thermostat
settings, there is a psychologically important difference between those who had a consistent habit
of setting their thermostats and those who did not. Habits are actions that are repeatedly
performed in a similar way in a consistent context until they become automatic behavioral
scripts, and they introduce an important element of inertia to behavioral interventions (Oulette
and Wood 1998). On the one hand, strong, pre-existing habits are resistant to intentions and
personal standards for moral behavior that are in opposition to the habits (Ji and Wood 2007,
Oulette and Wood 1998, Klöckner, C. A., and E. Matthies, Macey and Brown 1983). Strong,
pre-existing habits are thus difficult to affect through social norming; however, the momentum of
habits implies that a behavioral intervention that successfully instills a new habit will be likely to
produce durable behavioral change (Wilson and Dowlatabadi 2007). Only 16% of all my initial
subjects personally adjusted their thermostats to the nighttime settings most nights of the week
and at a consistent time, which means that it is unlikely that many subjects adjust their

Eric P. Rubin Social Norming and Thermostat Settings Spring 2013
54
thermostats according to a subconscious, self-perpetuating behavioral script (Oulette and Wood
1998). Most of my initial subjects (53%) and half of my subjects in the treatment group
(including the two subjects who decreased their settings most in response to the PNF) said they
personally adjusted their nighttime thermostat setting by hand 1 to 3 nights per week but the
timing was not consistent. I did not have a sufficiently large sample size to restrict my subjects
to a single behavioral type. The variation in behavior type introduces a potentially confounding
factor to my study. The prominence of repeated but non-habitual behavior limits the ability to
apply my findings to other behavior types, especially habitual behaviors. However, more
importantly, because full automation and strong habits were infrequent, it is even more
interesting that I saw behavioral changes caused by changing normative beliefs that persisted a
month after PNF. This persistence without mechanical or subconscious automation suggests that
changing normative beliefs through PNF can affect a stable precursor to behavior, such as
intentions or personal moral standards for behavior (Oulette and Wood 1998, Wilson and
Dowlatabadi 2007, Jackson 2005, Carrol et al. 2009).
Broader Implications and Future Research
Uncovering the dominant mechanism by which PNF affects behavior has profound
implications for program design. Thus, it is important that this pilot study supports the
applicability of the Theory of Changing Normative Beliefs over the Focus Theory of Normative
Conduct in the context of this pro-environmental PNF. An intervention based only on the Focus
Theory of Normative Conduct would be designed very differently than one that incorporates the
concept of persistent normative beliefs. This is not to suggest that pro-environmental social
norming explicitly or exclusively relies on the Focus Theory of Normative Conduct. In fact,
some of the literature that I most heavily rely on in the present research makes passing reference
to the likelihood that changing normative beliefs mediate the effect of Opower’s Home Energy
Reports (Allcott 2011) and that normative focus is ill-suited to explain persistent behavior
change due to PNF (Schultz 1991). By contrasting interventions rooted in normative focus to
interventions that explore the possibilities of changing normative beliefs, my intention is partly
to comment on normative focus. But even more, my aim is to highlight the importance of

Eric P. Rubin Social Norming and Thermostat Settings Spring 2013
55
understanding how social norming affects behavior, how context-dependent the mechanisms may
be, and how social norming can be tailored in response.
A social norming campaign based on the Focus Theory of Normative Conduct logically
would emphasize focusing individuals’ attention on a pro-environmental norm at the time and
place that they engage in the target behavior. The Focus Theory of Normative Conduct is most
applicable when there are competing norms and intervention designers want to manage
individuals’ focus so that they attend to the pro-environmental norm (Cialdini et al. 1991). For
example, if most people use an excessive quantity of paper towels in public restrooms, one might
reduce paper towel use by using signage to focus attention on pro-environmental injunctive
norms (Cialdini et al. 2006). As journalist Tina Rosenburg of the New York Times writes:
One of the most important keys to making social norming work is salience. “We
can only hold one thing in consciousness at a time—and that thing drives
behavior,” said Cialdini, who is writing his next book about the topic. Success is
more likely if the social norming message hits people just when they are about to
make that behavioral decision (2013).
On the other hand, an intervention that incorporates the Theory of Changing Normative
Beliefs could easily and productively target a different range of behaviors and would be more
able to optimize the effect of well-established proximate mechanisms. Although we usually do
not think about our normative beliefs, they are persistent in a way that normative focus is not,
and the influence of PNF on normative beliefs is similarly durable (Nolan 2011, Neighbors et al.
2004). A social norming intervention based on the Theory of Changing Normative Beliefs
logically could target repeated behaviors without requiring repeated normative focus or the
perpetuating effects of habit or automation. A wide range of research links normative beliefs to
stable, conscious mental constructs that directly influence behavior, such as intentions to behave
a certain way or personal standards of moral behavior (Jackson 2005, Wilson and Dowlatabadi
2007, Thøgersen 2006).
An intervention that emphasizes changing normative beliefs logically will be most
productive if it targets a behavior for which normative beliefs are inaccurate. Inaccuracy could
either be the product of public misrepresentation (as in the case of collegiate binge drinking) or
the obscurity of anonymous behavior, in which case the current research offers preliminary
evidence that normative beliefs may be widely distributed but unbiased. This pilot study
suggests that correcting unbiased, inaccurate normative beliefs does not necessarily produce a

Eric P. Rubin Social Norming and Thermostat Settings Spring 2013
56
boomerang effect; however, if future studies show that this does not apply to positive-cost
behaviors, the boomerang effect could potentially be rectified by using a competitive frame or a
pro-environmental frame or by including a pro-environmental injunctive norm of a peer group
(Schultz et al. 2007, Gockeritz et al. 2010).
The final advantage to the normative belief paradigm is that it is easily synthesized with
research on specific proximate mechanisms that mediate the effect of normative beliefs on
behavior. One of the most interesting possibilities for future research is to investigate these
proximate mechanisms through survey questions and variations in PNF. This approach, which
has been applied to a limited extent by researchers studying binge drinking interventions
(Neighbors et al. 2004, Rimal and Real 2005), could lead to much more effective and tailored
PNF, as is illustrated by the following three hypothetical examples (Table 5).
Table 5. Three very different hypothetical contexts lend themselves on theoretical grounds to
three different proximate mechanisms of social influence. These proximate mechanisms suggest
different optimal reference groups and framing techniques to maximize the efficacy of PNF that
changes normative beliefs.
Behavior type
Reference
group type
Proximate Mechanism /
Frame of PNF
Reference Group
Example
Uncertain
Self-similar
Perceived benefits
Neighbors
Public
Socially
significant
Social sanction or approval
Facebook friends
Moral / Cooperative
Expansive Aggregate outcome expectation
and/or reciprocity
Americans
First, research might test whether PNF can best affect difficult or ambiguous purchasing
decisions by changing normative beliefs about self-similar reference groups through the
proximate mechanism of changing perceived benefits. Research has shown that people often
conform to descriptive norms for behaviors they are uncertain about in an effort to follow the
most adaptive course of action, especially if they perceive that the reference group is similar to
them, and that people are more likely to follow descriptive norms if they think that others are
benefiting from engaging in the widespread behavior (Deutsch and Gerard 1955, Lapinski et al.
2007, Rimal and Real 2003, Rimal and Real 2005, Rimal et al. 2005, Abrams et al. 1990). By

Eric P. Rubin Social Norming and Thermostat Settings Spring 2013
57
measuring and manipulating the perceived self-similarity of the reference group and the benefits
subjects associate with the pro-environmental behavior, researchers could better understand how
interventions work and then design them more effectively. For the preceding example,
researchers might use a proximate geographic reference group (such as neighbors) to emphasize
self-similarity and frame PNF to emphasize the benefits of the behavior.
A second possibility for future research that embodies this methodology is to test whether
PNF best affects publicly visible behavior by changing injunctive normative beliefs about
socially significant reference groups through the proximate mechanism of anticipated social
sanction or approval (Cialdini and Goldstein 2004, Abrams et al. 1990). Researchers might
convey descriptive norms and subsequently measure inferred injunctive norms and also
manipulate and measure anticipated social sanction or approval (Thøgersen 2006). Positive
findings from such research might produce an intervention that compares individuals’ behavior
to that of their Facebook friends, conveys the pro-environmental opinions of individuals’
Facebook friends, and is framed to emphasize the possibility of social elevation and/or the threat
of losing social status.
A final possibility along these lines would be to test how PNF best affects
environmentally conscious populations and/or behaviors that are more often thought of in terms
of morality or cooperation. For such cases, a larger reference group (such as all Americans) may
incite a greater sense of moral obligation, because it can affect recipients’ beliefs that their
contribution would be part of a successful effort and/or that they are not doing their fair share to
address a communal problem relative to the larger population (Steg and de Groot 2010,
Vandenbaugh 2004, Staats and Midden 1996). By measuring and manipulating individuals’
perceptions of the reference group as well as their aggregate outcome expectations, their sense
that they are contributing fairly, and their perceived moral obligation, researchers might uncover
insights that would lead to a more effectively framed PNF that highlights the most commonly
motivational aspects of the PNF for that context. With all three of the preceding examples,
tailoring PNF will not necessarily narrow its impact, because changes in normative beliefs about
one reference group have been shown to affect beliefs about other reference groups (Nolan 2011)
and because multiple frames can operate at once.

Eric P. Rubin Social Norming and Thermostat Settings Spring 2013
58
Conclusion
Pro-environmental PNF can be a powerful tool for changing individual behavior, which
is at the root of so many environmental problems, but to reach its potential we need to
understand how it works. The Focus Theory of Normative Conduct is empirically supported for
subtle cues affecting one-time behaviors, but to effectively target behaviors executed after
normative focus has faded, it may be more accurate and useful to think in terms of changing
normative beliefs and the proximate mechanisms by which normative beliefs affect behavior.
This study suggests that for a repeated, negative-cost, private residential conservation behavior,
there are inaccurate but unbiased normative beliefs about average behavior in a geographical
reference group, those beliefs are significantly positively correlated with behavior, and they are
persistently affected by PNF. Furthermore, my results indicate that for this behavior type,
correcting inaccurate normative beliefs does not produce a boomerang effect, and subjects with
above-average initial settings and beliefs change their behavior if PNF changes their normative
beliefs. Future research is required to evaluate the Theory of Changing Normative Beliefs for
other behaviors and populations and to understand what proximate mechanisms dominate this
effect. The insights from such research could produce much more sophisticated and effective
social norming interventions. This would allow for cheap, effective, uncontroversial behavior
change—something that no education campaign or governmental market intervention could do.

Eric P. Rubin Social Norming and Thermostat Settings Spring 2013
59
ACKNOWLEDGEMENTS
Joe Kantenbacher, Chris Jones, and Rick Diamond inspired me to step into the world of
pro-environmental behavioral psychology. Alan Meier saved me from doing a survey of
Berkeley students by telling me about MTurk. Lyle Mills was endlessly patient and helpful with
respect to creating my survey, and without Dahn Tamir’s cleverness and worker IDs, I would
have been forced to study social norms at a national scale. Christopher Carney, Gary James Tull,
Cathy Weir, Taylor Hickok, Karen Scruggs, Paz Lozano, Leyla Holt, Allie Lyn, and—above
all—Avry Schellenbach, were an invaluable source of emotional support throughout this
complicated, unpredictable project.
The design, implementation, and analysis of this project was deeply informed by hours of
conversation with my mentor, Joe Kantenbacher, my advisors, Kurt Spreyer and Tina Mendez,
my graduate student stats guru, Carrie Cizauskas, my brilliant consult at Opower, Erin Sherman,
and my parents. This thesis is built on their insights and guidance, and it is finally complete
thanks to their tenaciously generous contributions of time and thoughtfulness.
REFERENCES
2005-2013. Amazon Mechanical Turk. Amazon.com, Inc.
<https://www.mturk.com/mturk/welcome>
2012. Get Chicago, IL Demographics. <http://www.illinois-demographics.com/chicago-
demographics> (Version 05/7/2013)
2013. Field listings – median age. CIA World Factbook.
<https://www.cia.gov/library/publications/the-world-factbook/fields/2177.html> (Version
05/7/2013)
2006. National Weather Service Forecast Office: Chicago, IL. National Oceanic and
Atmospheric Administration. <http://www.nws.noaa.gov/climate/xmacis.php?wfo=lot>.
“34 degrees Fahrenheit” was calculated as the unweighted average of the monthly
average temperatures for the Chicago Area.
2010. United States Census 2010 Interactive Population Map. United States Census Bureau.
<http://2010.census.gov/2010census/popmap/>

Eric P. Rubin Social Norming and Thermostat Settings Spring 2013
60
2013. State and County Quick Facts – Chicago, Illinois. United States Census Bureau.
<http://quickfacts.census.gov/qfd/states/17/1714000.html> (Version 05/7/2013)
2013. State and County Quick Facts – USA. United States Census Bureau.
<http://quickfacts.census.gov/qfd/states/00000.html> (Version 05/7/2013)
Abrams, D., M. Wetherell, S. Cochrane, M. A. Hogg, and J. C. Turner. 1990. Knowing what to
think by knowing who you are: Self-categorization and the nature of norm formation,
conformity and group polarization. British Journal of Social Psychology 29:97–119.
Allcott H. 2011. Social norms and energy conservation. Journal of Public Economics 95:1082-
1095.
Allcott H., and S. Mullainathan. 2010. Behavior and energy policy. Science 327:1204-1205.
Ayres, I., Raseman, S., & Shih, A. 2009. Evidence from two large field experiments that peer
comparison feedback can reduce residential energy usage. National Bureau of Economic
Research paper w15386
Baer, J. S., A. Stacy, and M. Larimer. 1991. Biases in the perception of drinking norms among
college students. Journal of Studies on Alcohol and Drugs 52:580-586.
Bamberg, S., M. Hunecke, and A. Blöbaum. 2007. Social context, personal norms and the use of
public transportation: Two field studies. Journal of Environmental Psychology 27:190–
203.
Black, J. S., P. C. Stern, and J. T. Elworth. 1985. Personal and contextual influences on
househould energy adaptations. Journal of Applied Psychology 70:3-21.
Blanton, H., A. Köblitz, and K. D. McCaul. 2008. Misperceptions about norm misperceptions:
descriptive, injunctive, and affective “social norming” efforts to change health behaviors.
Social and Personality Psychology Compass 2: 1379–1399.
Borsari, B., and Carey, K. B. 2001. Peer influences on college drinking: A review of the
research. Journal of substance abuse, 13:391-424.
Carey, K. B., J. M. Henson, and M. P. Carey. 2010. Perceived norms mediate effects of a brief
motivational intervention for sanctioned college drinkers. Science and Practice 17:58-71.
Carrol, E., E. Hatton, and M. Brown. 2009. Research study: residential energy use behavior
change pilot. Presentation by Franklin Energy and Greenway Insights. Available at:
<http://opower.com/uploads/library/file/3/
residential_energy_use_behavior_change_pilot.pdf>
Cialdini, R. B., Demaine, L. J., Sagarin, B. J., Barrett, D. W., Rhoads, K., & Winter, P. L. 2006.
Managing social norms for persuasive impact. Social Influence 1:3–15.

Eric P. Rubin Social Norming and Thermostat Settings Spring 2013
61
Cialdini, R. B., and N. J. Goldstein. 2004. Social Influence: Compliance and Conformity. Annual
Review of Psychology 55:591–621.
Cialdini R. B., C. Kallgren, and R. Reno. 1991. A Focus Theory of Normative Conduct - a
Theoretical Refinement and Reevaluation of the Role of Norms in Human-Behavior.
Advances in Experimental Social Psychology 24:201-234.
Clapp, J. D., Lange, J. E., Russell, C., Shillington, A., & Voas, R. B. 2003. A failed norms social
marketing campaign. Journal of Studies on Alcohol and Drugs, 64:409-414.
Costa, D. and M. Kahn. 2010 Energy conservation ‘nudges’ and environmentalist ideology:
evidence from a randomized residential electricity field experiment. National Bureau of
Economic Research working paper 15939.
Davis, M. 2011. Behavior and energy savings: evidence from a series of experimental
interventions. Environmental Defense Fund. Available at
http://www.edf.org/documents/11769_BehaviorAndEnergySavings.pdf
Dernbach, J. C. 2007. Harnessing Individual Behavior to Address Climate Change: Options for
Congress. SSRN eLibrary.
Deutsch M., and H. B. Gerard. 1955. A study of normative and informational social influences
upon individual judgment. Journal Abnormal and Social Psychology 51-31:629-2366.
Fischer, C. 2008. Feedback on household electricity consumption: a tool for saving energy?
Energy Efficiency 1:79–104.
Fuller, M. C., C. K., M. Zimring, I. Hoffman, K. L. Soroye, and C. Goldman. 2010. Driving
demand for home energy improvements: motivating residential customers to invest in
comprehensive upgrades that eliminate energy waste, avoid high bills, and spur the
economy. LBNL-3960E. Lawrence Berkeley National Laboratory: Environmental
Energy Technologies Division. Berkeley, CA, USA.
Goldstein N. J., R. B. Cialdini, and V. Griskevicius. 2008. A room with a viewpoint: Using
social norms to motivate environmental conservation in hotels. Journal of Consumer
Research 35:472-482.
Ipeirotis, P. 2010. Demographics of Mechanical Turk. CeDER-10–01 working paper, New York
University.
Jackson, T. 2005. Motivating sustainable consumption. A review of evidence on consumer
behaviour and behavioural change. A report to the Sustainable Development Research
Network, Surrey: Centre for Environmental Strategies. Available at: <http://www.sd-
research.org.uk/wp-content/uploads/motivatingscfinal_000.pdf>

Eric P. Rubin Social Norming and Thermostat Settings Spring 2013
62
Jensen, T. 1986. Comparison processes in energy conservation feedback effects. Advances in
Consumer Research 13:486-491.
Ji, M. F., & Wood, W. 2007. Purchase and consumption habits: Not necessarily what you intend.
Journal of Consumer Psychology, 17:261-276.
Kaufmann, N., Schulze, T., & Veit, D. 2011. More than fun and money. worker motivation in
crowdsourcing–a study on Mechanical Turk. Proceedings of the Seventeenth Americas
Conference on Information Systems 1-11.
Kempton, W. 1986. Two theories of home heat control. Cognitive Science, 10:75-90.
Klöckner, C. A., and E. Matthies. 2004. How habits interfere with norm-directed behaviour: A
normative decision-making model for travel mode choice. Journal of Environmental
Psychology 24:319-327.
Lapinski, M. K., and R. N. Rimal. 2005. An explication of social norms. Communication
Theory. 15:127-147.
Lapinski, M. K., Rimal, R. N., DeVries, R., & Lee, E. L. 2007. The role of group orientation and
descriptive norms on water conservation attitudes and behaviors. Health Communication,
22:133-142.
Macey, S. M., & Brown, M. A. 1983. Residential Energy Conservation The Role of Past
Experience in Repetitive Household Behavior. Environment and Behavior, 15:123-141.
Mattern, J. L., and C. Neighbors. 2004. Social Norms Campaigns: Examining the Relationship
between Changes in Perceived Norms and Changes in Drinking Levels. Journal of
Studies on Alcohol and Drugs 65:489.
McKenzie‐ Mohr, D. 2000. New ways to promote pro-environmental behavior: Promoting
sustainable behavior: An introduction to community‐ based social marketing. Journal of
Social Issues, 56:543-554.
Melnyk, V., Herpen, E. V., Fischer, A. R., & van Trijp, H. 2011. To think or not to think: the
effect of cognitive deliberation on the influence of injunctive versus descriptive social
norms. Psychology & Marketing, 28:709-729.
Monin, B., and M. I. Norton. 2003. Perceptions of a fluid consensus: Uniqueness bias, false
consensus, false polarization, and pluralistic ignorance in a water conservation crisis.
Personality and Social Psychology Bulletin. 29:559-567.
OPower. 2013. Management & Advisors. <http://opower.com/company/people/management>
(Version 05/6/2013).

Eric P. Rubin Social Norming and Thermostat Settings Spring 2013
63
OPower. 2012. Results. <http://opower.com/utilities/results> (Version 04/6/2012).
Ouellette, J. A., & Wood, W. 1998. Habit and intention in everyday life: the multiple processes
by which past behavior predicts future behavior. Psychological bulletin, 124:54-74.
Paolacci, G, J. Chandler, and P. Ipeirotis. 2010. Running experiments on Amazon’s Mechanical
Turk. Judgement and Decision Making. 5:411-419.
Peffer, T., Pritoni, M., Meier, A., Aragon, C., & Perry, D. 2011. How people use thermostats in
homes: A review. Building and Environment, 46:2529-2541.
Perkins, H. W. 2002. Social norms and the prevention of alcohol misuse in collegiate contexts.
Journal of Studies on Alcohol and Drugs Supplement 14:164-172.
Prentice, D. A., and D. T. Miller. 1993. Pluralistic ignorance and alcohol use on campus: Some
consequences of misperceiving the social norm. Journal of personality and social
psychology 64:243-255
Rand D. G. 2012. The promise of Mechanical Turk: How online labor markets can help theorists
run behavioral experiments. Journal of Theoretical Biology 299:172-179.
Rimal R., M. Lapinski, R. Cook, and K. Real. 2005. Moving toward a theory of normative
influences: How perceived benefits and similarity moderate the impact of descriptive
norms on behaviors. Journal of Health Communication 10:433-450.
Rimal, R. N., and K. Real. 2003. Understanding the influence of perceived norms on behaviors.
Communication Theory 13:184–203.
Rimal, R. N., and K. Real. 2005. How behaviors are influenced by perceived norms: a test of the
theory of normative social behavior. Communication Research 32:389–414.
Rosenburg, T. 2013. The destructive influence of imaginary peers. New York Times.
<http://opinionator.blogs.nytimes.com/2013/03/27/the-destructive-influence-of-
imaginary-peers/>
Ross, J., L. Irani, M. S. Silberman, A. Zaldivar, and B. Tomlinson. 2010. Who are the
crowdworkers?: shifting demographics in mechanical turk. Pages 2863–2872 CHI 2010
Extended Abstracts on Human Factors in Computing Systems. ACM, New York, NY,
USA.
Schultz, P. W. 2002. Knowledge, information, and household recycling: examining the
knowledge-deficit model of behavior change. Pages 67-82 in T. Dietz, and P. C. Stern,
editors. New tools for environmental protection: Education, information, and voluntary
measures. National Academy Press, Washington, D.C., USA

Eric P. Rubin Social Norming and Thermostat Settings Spring 2013
64
Schultz P. W., J. M. Nolan, R. B. Cialdini, N. J. Goldstein, and V. Griskevicius. 2007. The
constructive, destructive and reconstructive power of social norms. Psychological
Science 18:429-434.
Schultz, W. P., J. J. Tabanico, and T. Rendon. 2008. Normative beliefs as agents of influence –
basic processes and real-world applications. Pages 385-402 in W. D. Crano, and R.
Prislin, editors. Attitudes and attitude change. Taylor & Francis Group, LLC, New York,
New York, USA.
Smith, J. R., and W. R. Louis. 2008. Do as we say and as we do: the interplay of descriptive and
injunctive group norms in the attitude–behaviour relationship. British Journal of Social
Psychology 47:647–666.
Staats, H. J., A. P. Wit, and C. Midden. 1996. Communicating the greenhouse effect to the
public: Evaluation of a mass media campaign from a social dilemma perspective. Journal
of environmental management 46.2:189-203
Steg, L., and J. de Groot. 2010. Explaining prosocial intentions: Testing causal relationships in
the norm activation model. British Journal of Social Psychology 49:729-743.
Stern, P. C. 1999. Information, incentives, and proenvironmental consumer behavior. Journal of
Consumer Policy 63:428-433
Stern, P. C. 2000. New Environmental Theories: Toward a Coherent Theory of Environmentally
Significant Behavior. Journal of Social Issues 56:407–424.
Stern, P. C., J. S. Black, and J. T. Elworth. 1983. Responses to changing energy conditions
among Massachusetts households. Energy 8:515-523.
Terry, D. J. and M. A. Hogg, editors. 2000. Attitudes, behavior, and social context: the role of
norms and group membership. Lawrence Erlbaum Associates, Inc., Mahwah, New
Jersey, USA.
Thøgersen, J. (2006). Norms for environmentally responsible behaviour: An extended taxonomy.
Journal of Environmental Psychology, 26(4), 247-261.
Vandenbergh, M. P. 2004. Order without Social Norms: How Personal Norm Activation Can
Protect the Environment. Northwestern University Law Review 99:1101.
Van der Pligt, J. 1985. Energy conservation: two easy ways out. Journal of Applied Social
Psychology, 22:3-15.
Verplanken, B., I. Walker, A. Davis, and M. Jurasek. 2008. Context change and travel mode
choice: Combining the habit discontinuity and self-activation hypotheses. Journal of
Environmental Psychology 28:121–127.
Eric P. Rubin Social Norming and Thermostat Settings Spring 2013
65
Vine, E. L. 1986. Saving energy the easy way: An analysis of thermostat management. Energy
11:811–820.
Vine, E., and B. K. Barnes. 1988. ScienceDirect.com - Energy - Monitored indoor temperatures
and reported thermostat settings: How different are they? 14:299-308
White, K. M., Smith, J. R., Terry, D. J., Greenslade, J. H., & McKimmie, B. M. 2009. Social
influence in the theory of planned behaviour: The role of descriptive, injunctive, and in-
group norms. British Journal of Social Psychology, 48:135-158.
Wilson, C., and Dowlatabadi, H. 2007. Models of decision making and residential energy use.
Annual Review of Environmental Resources 32:169-203.

Eric P. Rubin Social Norming and Thermostat Settings Spring 2013
66
APPENDIX A: Baseline Survey Instrument

Eric P. Rubin Social Norming and Thermostat Settings Spring 2013
67

Eric P. Rubin Social Norming and Thermostat Settings Spring 2013
68

Eric P. Rubin Social Norming and Thermostat Settings Spring 2013
69

Eric P. Rubin Social Norming and Thermostat Settings Spring 2013
70
APPENDIX B: Intermediate Results of Nested Modeling
Outside temperature
Standardized Beta t-Value p-Value
Daily min temp 0.14 0.58 0.57
Monthly average -0.55 -2.24 0.03
Outside temperature + demographics
Standardized Beta t-Value p-Value
Age 0.17 0.92 0.37
Income -0.48 -2.27 0.035
Household size 0.014 0.083 0.93
Education level 0.14 0.69 0.50
Homeowner 0.14 0.75 0.46
Pay heating -0.60 -3.15 0.006
Daily min temp 0.18 0.78 0.44
Monthly average -0.74 -3.11 0.006
Outside temperature + demographics + self-reported influences
Standardized Beta t-Value p-Value
Comfort 0.3783 7.49 0.08
Wasteful -0.11 1.90 0.72
Environmental 0.13 -0.37 0.58
Financial 0.39 0.01 0.99
Age 0.11 0.55 0.59
Income -0.46 -1.85 0.09
Household size -0.025 -0.15 0.88
Education level 0.12 0.52 0.61
Homeowner 0.25 0.95 0.36
Pay heating -0.5292 -2.020 0.06
Daily min temp 0.1918 0.852 0.41
Monthly average -0.7670 -2.825 0.01