Embed Size (px)
DESCRIPTION
How PETS Can Help Make Services Work for Poor People. Distance Learning Clinic April 14, 2004 Ritva Reinikka Research Manager Development Research Group The World Bank. Similar changes in public spending can be associated with vastly different changes in outcomes. - PowerPoint PPT Presentation
Citation preview

How PETS Can Help Make Services Work for Poor People
Distance Learning ClinicApril 14, 2004Ritva Reinikka
Research ManagerDevelopment Research Group
The World Bank
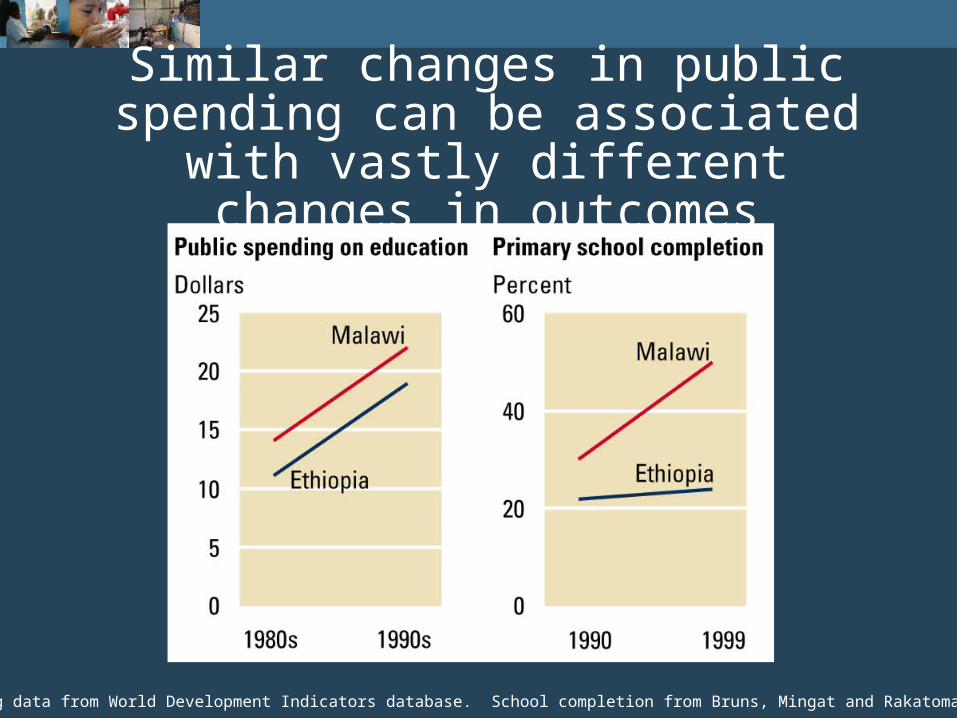
Similar changes in public spending can be associated with vastly different changes in
outcomes
Sources: Spending data from World Development Indicators database. School completion from Bruns, Mingat and Rakatomalala 2003
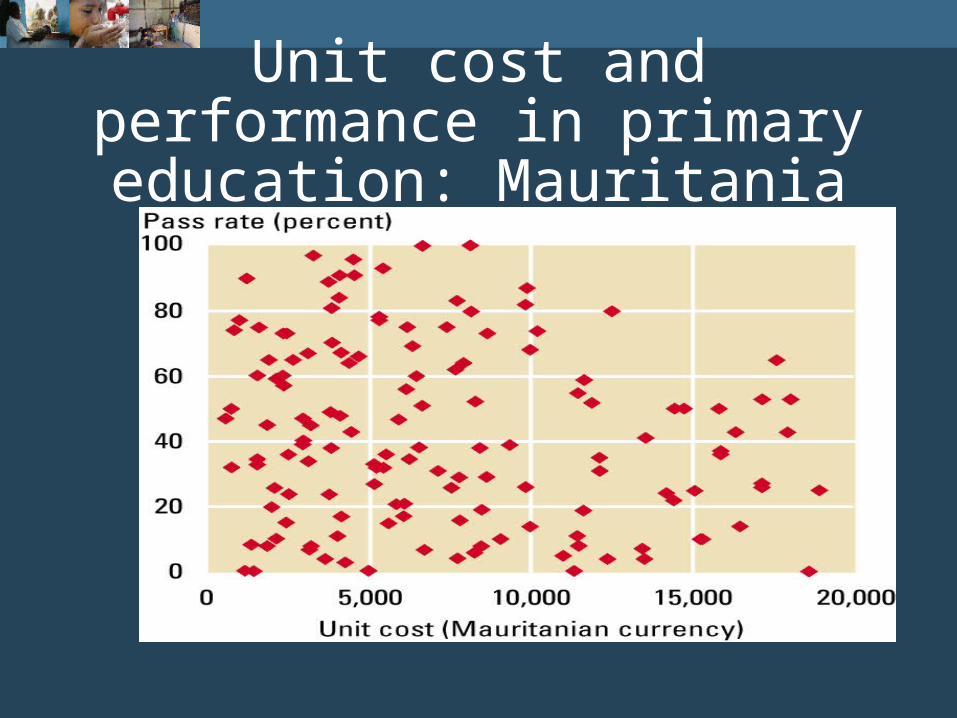
Unit cost and performance in primary education: Mauritania
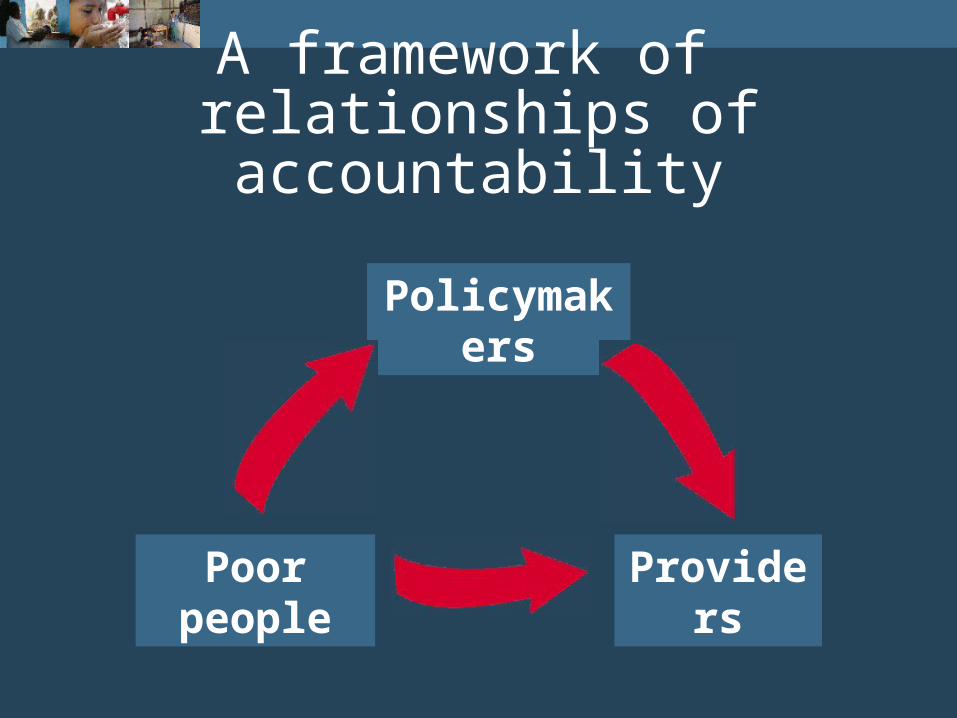
Poor people Providers
Policymakers
A framework of relationships of accountability
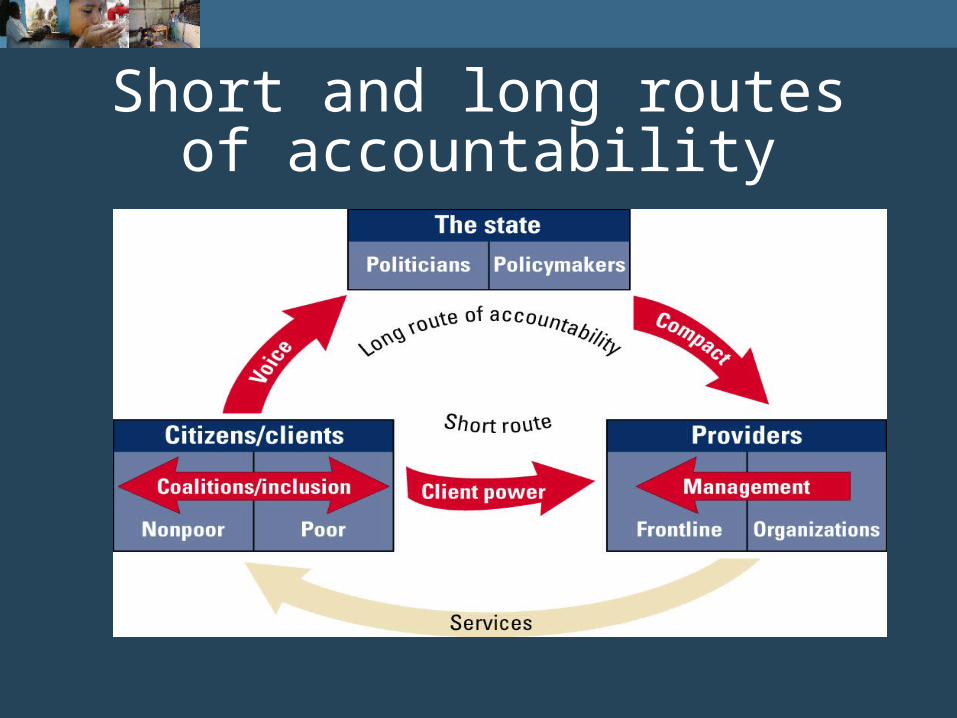
Short and long routes of accountability
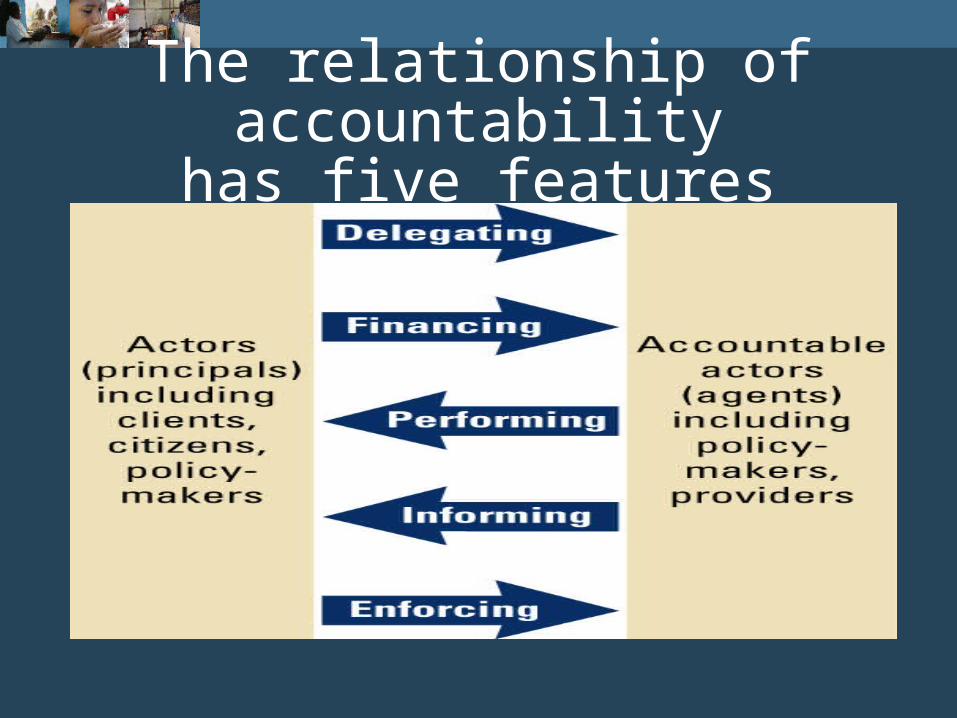
The relationship of accountabilityhas five features
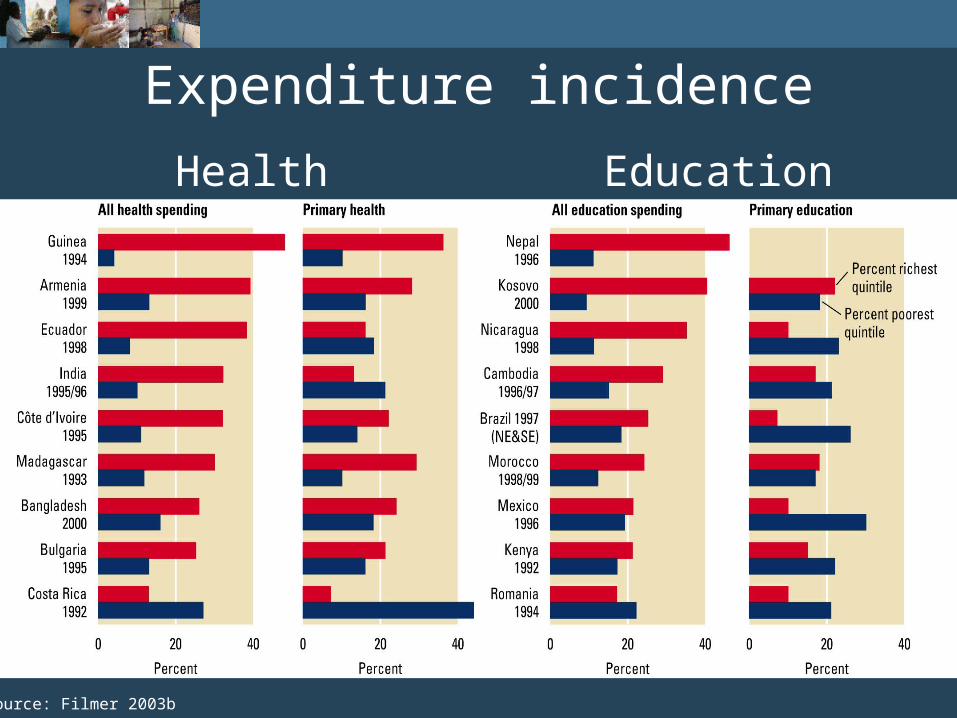
Expenditure incidence
Health Education
Source: Filmer 2003b
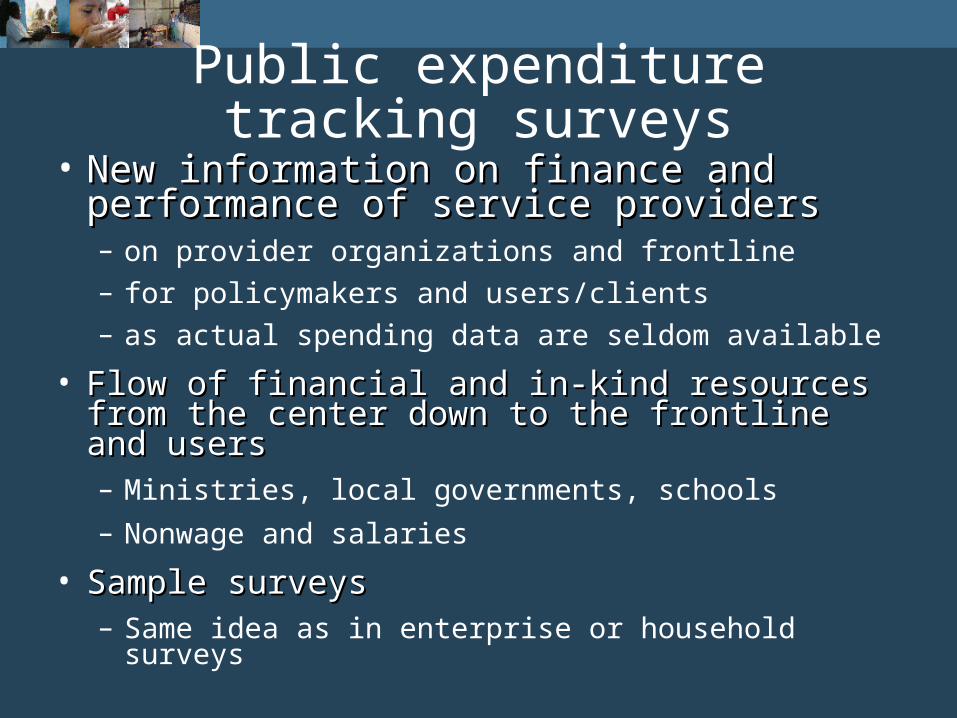
Public expenditure tracking surveys• New information on finance and performance New information on finance and performance
of service providersof service providers– on provider organizations and frontline– for policymakers and users/clients– as actual spending data are seldom available
• Flow of financial and in-kind resources from the Flow of financial and in-kind resources from the center down to the frontline and userscenter down to the frontline and users– Ministries, local governments, schools
– Nonwage and salaries
• Sample surveysSample surveys– Same idea as in enterprise or household surveys
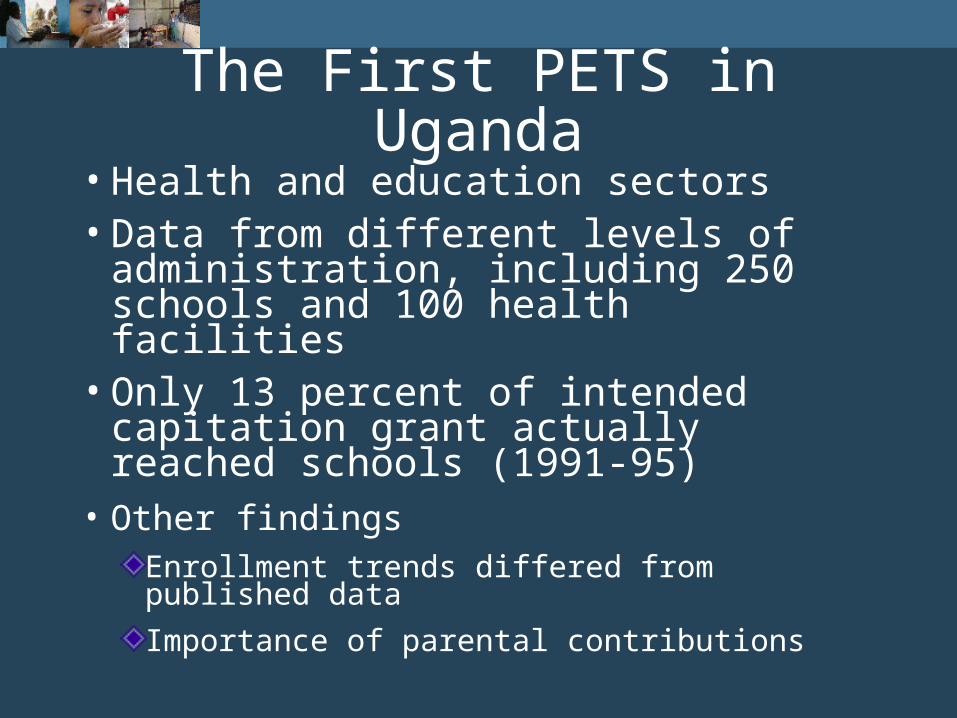
The First PETS in Uganda• Health and education sectors• Data from different levels of
administration, including 250 schools and 100 health facilities
• Only 13 percent of intended capitation grant actually reached schools (1991-95)
• Other findingsEnrollment trends differed from published data
Importance of parental contributions
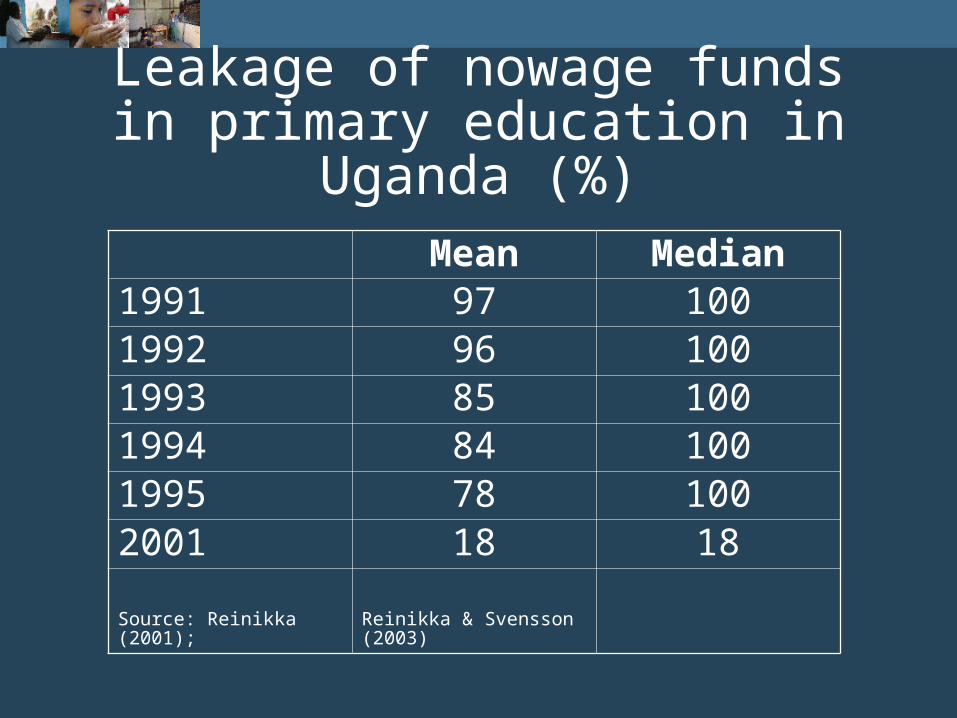
Leakage of nowage funds in primary education in Uganda (%)
Mean Median
1991 97 1001992 96 1001993 85 1001994 84 1001995 78 1002001 18 18
Source: Reinikka (2001); Reinikka & Svensson (2003)
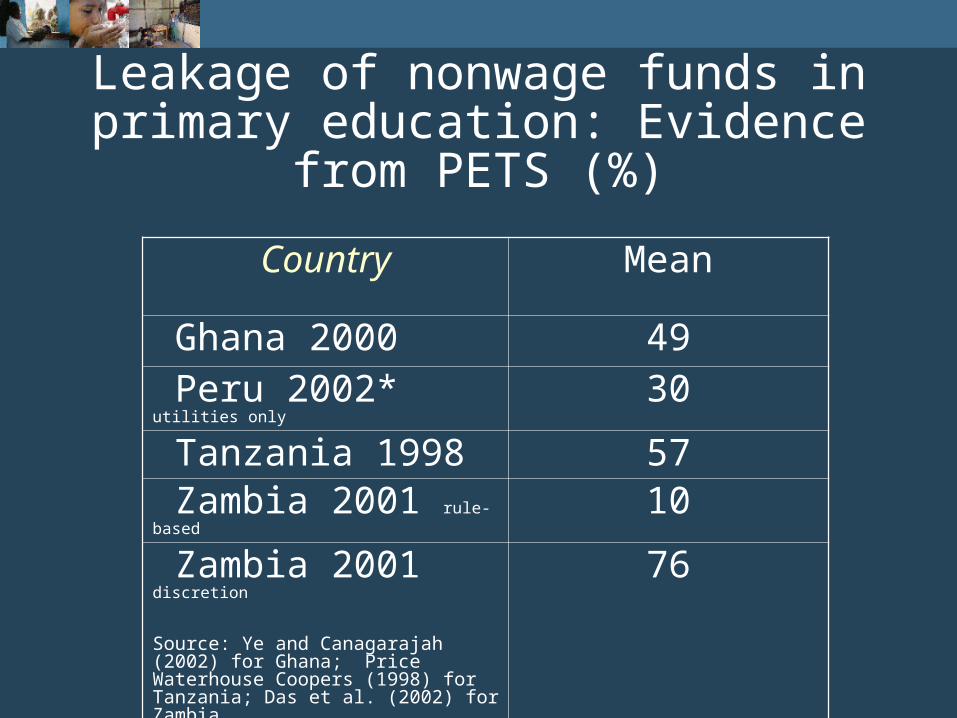
Leakage of nonwage funds in primary education: Evidence from PETS (%)
Country Mean
Ghana 2000 49 Peru 2002* utilities only 30 Tanzania 1998 57 Zambia 2001 rule-based 10 Zambia 2001 discretion
Source: Ye and Canagarajah (2002) for Ghana; Price Waterhouse Coopers (1998) for Tanzania; Das et al. (2002) for Zambia
76
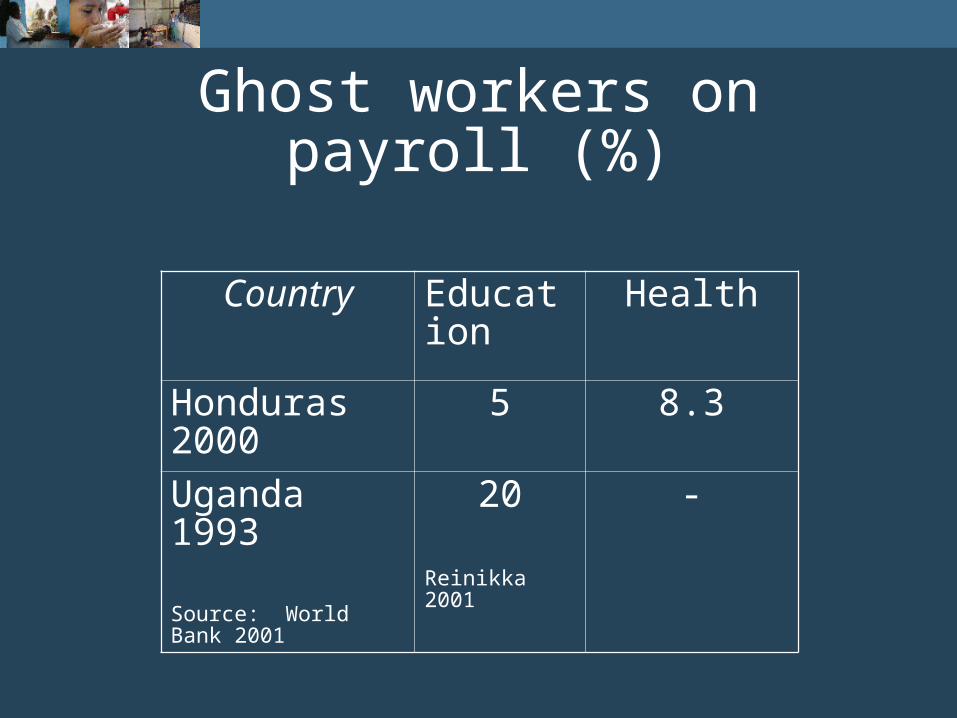
Ghost workers on payroll (%)
Country Education Health
Honduras 2000 5 8.3
Uganda 1993
Source: World Bank 2001
20
Reinikka 2001
-
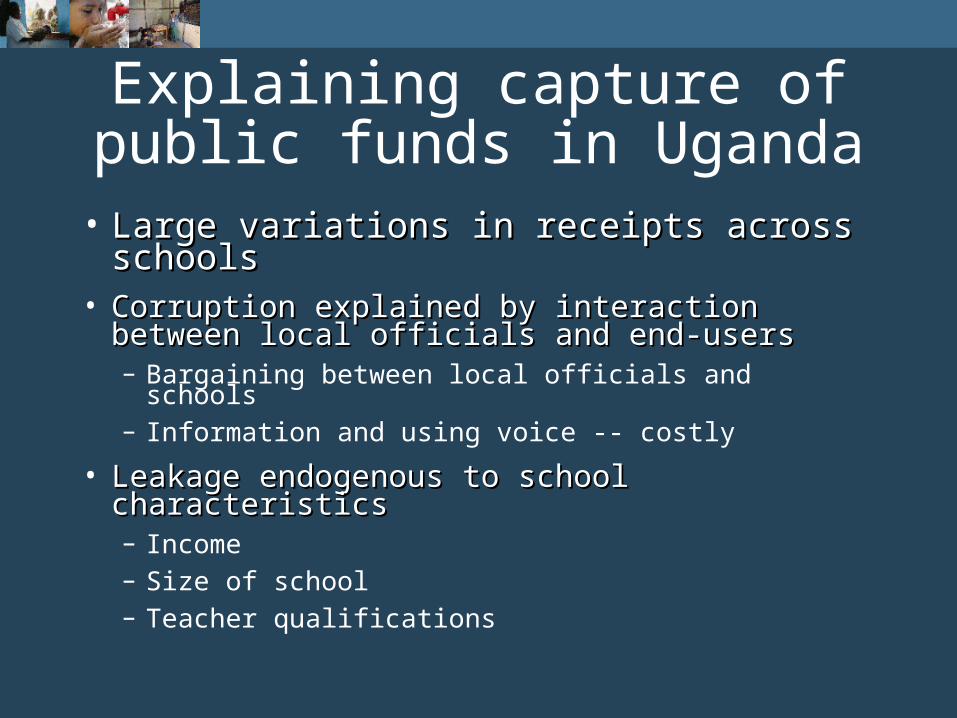
Explaining capture of public funds in Uganda
• Large variations in receipts across schoolsLarge variations in receipts across schools• Corruption explained by interaction between local Corruption explained by interaction between local
officials and end-usersofficials and end-users– Bargaining between local officials and schools– Information and using voice -- costly
• Leakage endogenous to school characteristicsLeakage endogenous to school characteristics– Income– Size of school– Teacher qualifications
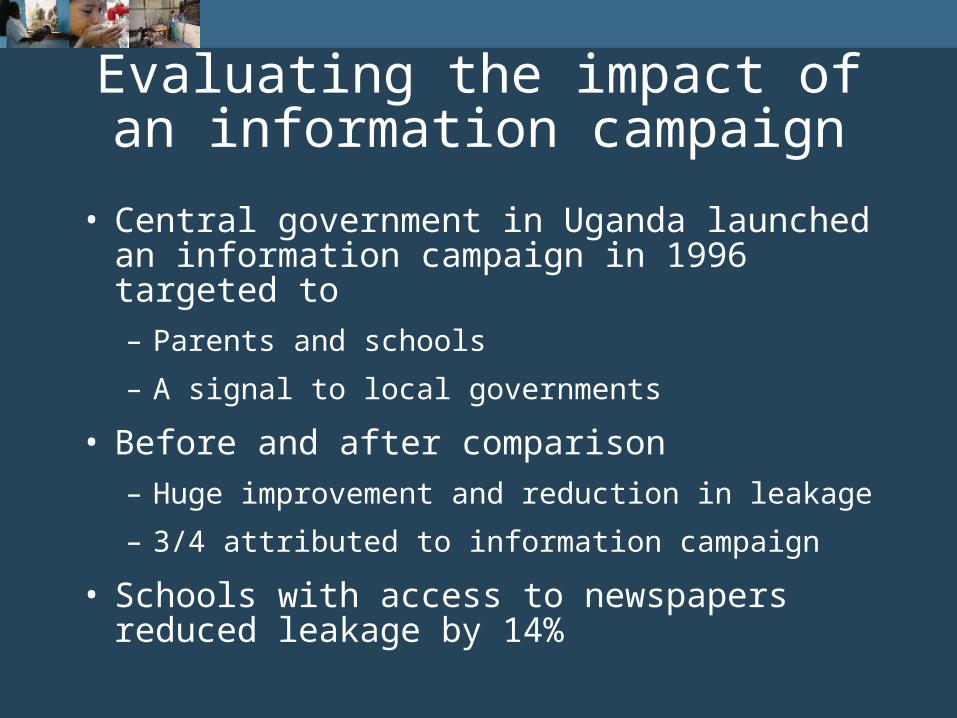
Evaluating the impact of an information campaign
• Central government in Uganda launched an information campaign in 1996 targeted to
– Parents and schools
– A signal to local governments
• Before and after comparison
– Huge improvement and reduction in leakage
– 3/4 attributed to information campaign
• Schools with access to newspapers reduced leakage by 14%
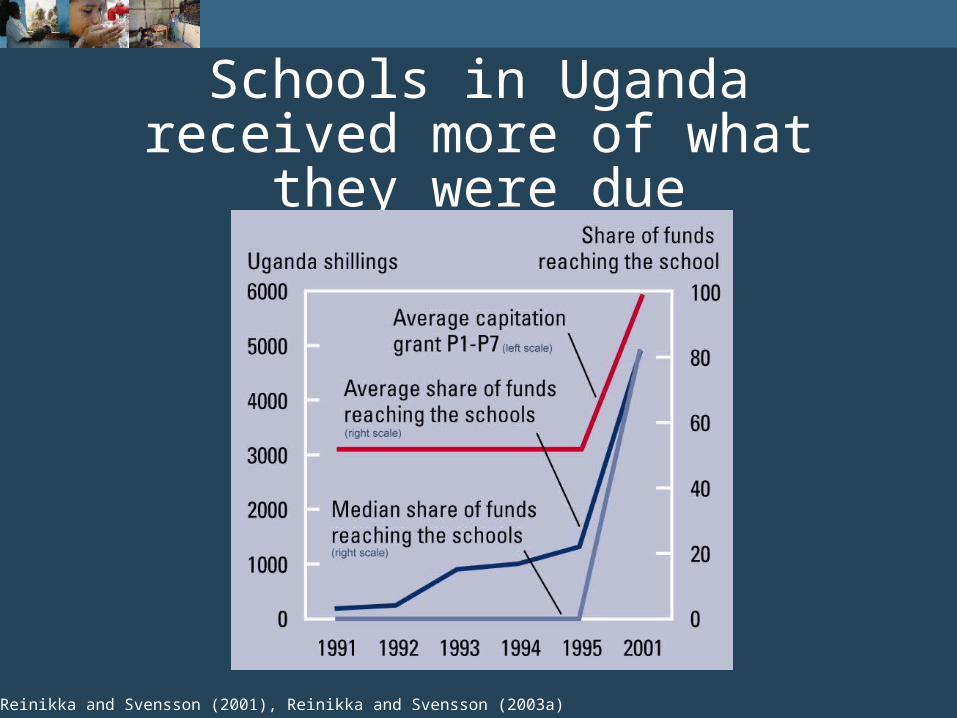
Schools in Uganda received more of what they were due
Source: Reinikka and Svensson (2001), Reinikka and Svensson (2003a)
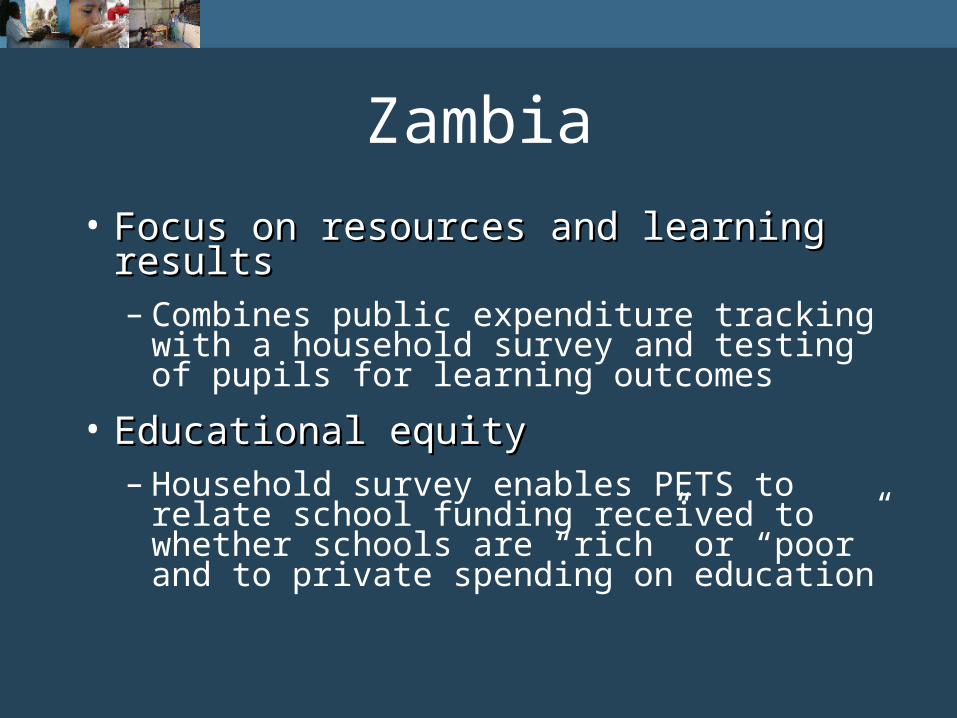
Zambia
• Focus on resources and learning resultsFocus on resources and learning results– Combines public expenditure tracking with a
household survey and testing of pupils for learning outcomes
• Educational equityEducational equity– Household survey enables PETS to relate
school funding received to whether schools are “rich” or “poor” and to private spending on education
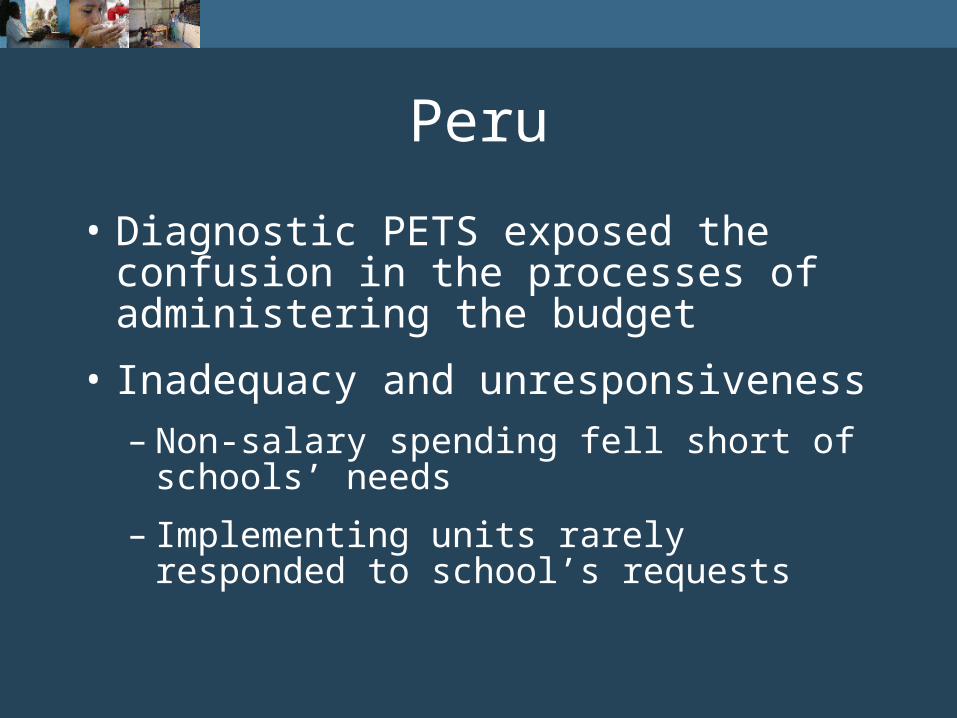
Peru
• Diagnostic PETS exposed the confusion in the processes of administering the budget
• Inadequacy and unresponsiveness
– Non-salary spending fell short of schools’ needs
– Implementing units rarely responded to school’s requests
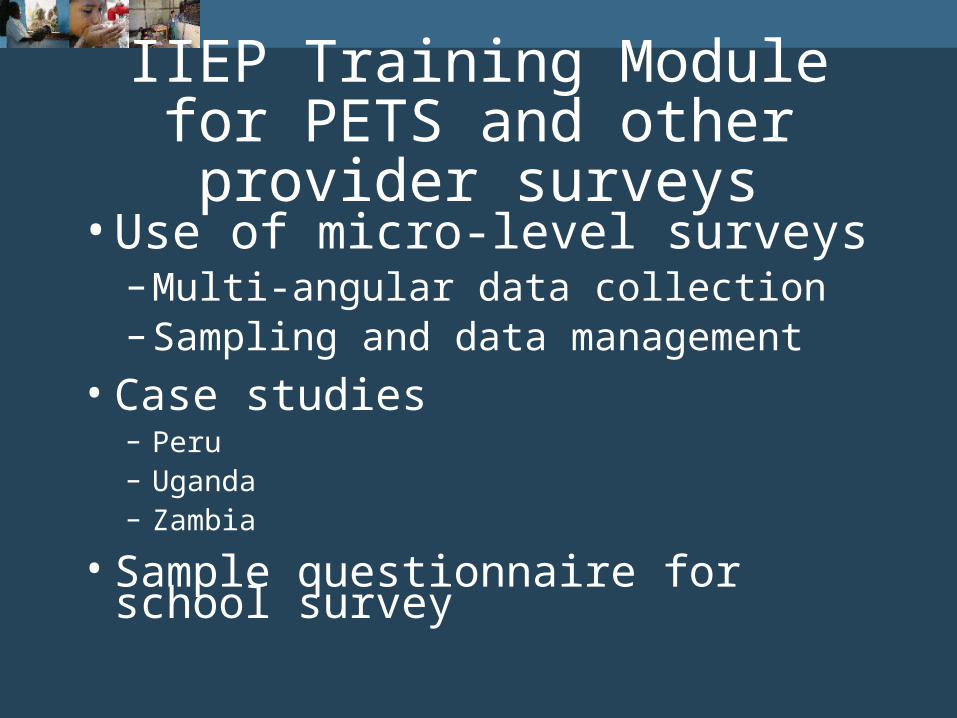
IIEP Training Module for PETS and other provider surveys
• Use of micro-level surveys– Multi-angular data collection– Sampling and data management
• Case studies– Peru– Uganda– Zambia
• Sample questionnaire for school survey
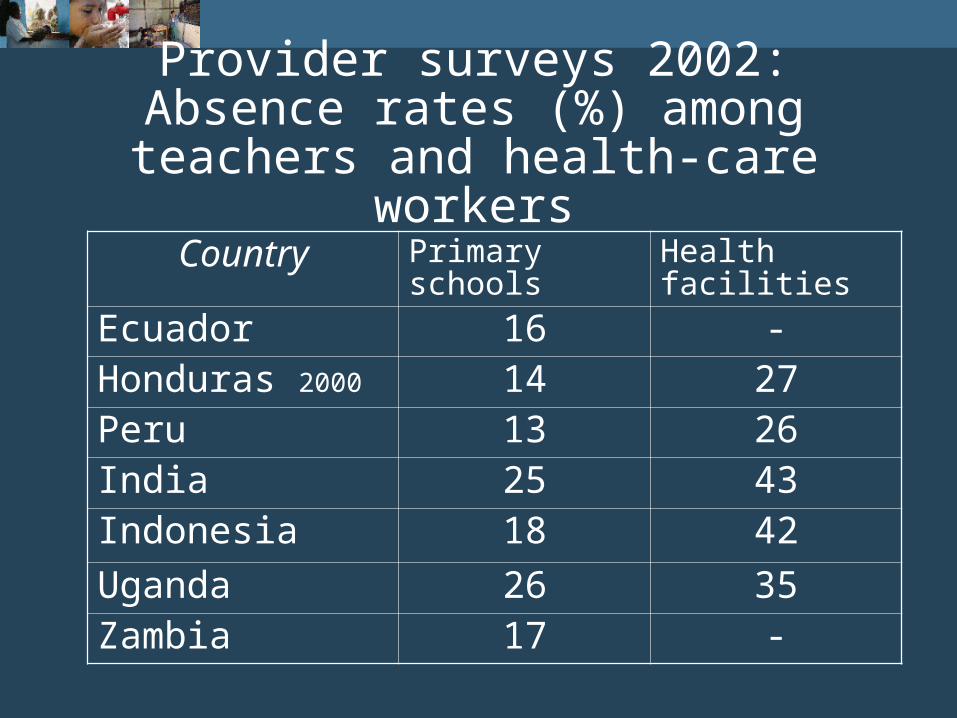
Provider surveys 2002: Absence rates (%) among teachers and health-care
workers
Country Primary schools Health facilities
Ecuador 16 -Honduras 2000 14 27Peru 13 26India 25 43Indonesia 18 42
Uganda 26 35Zambia 17 -
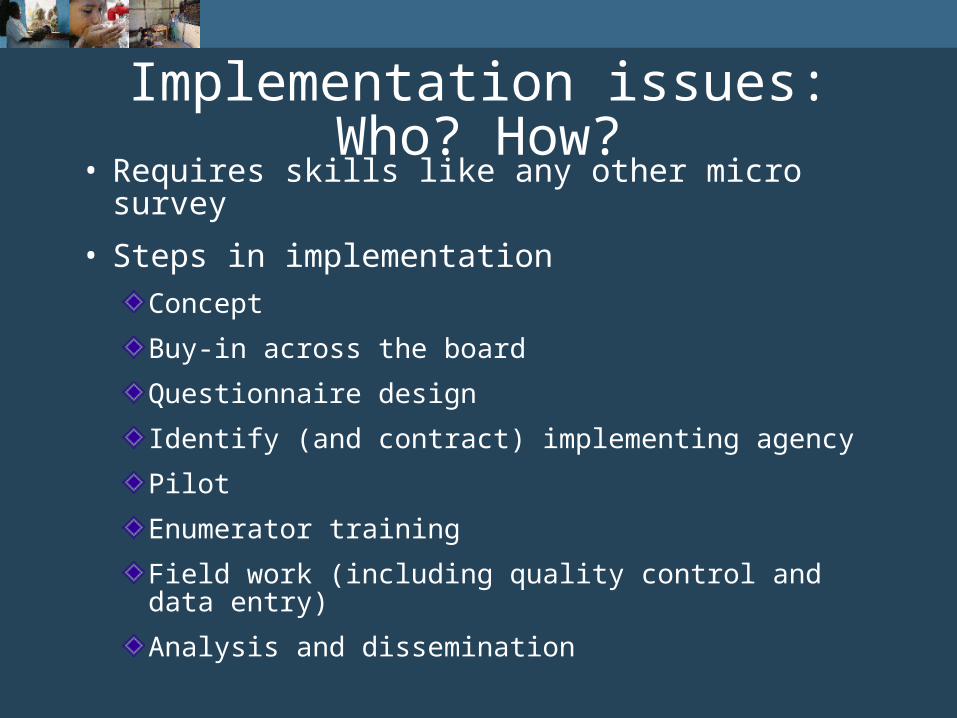
Implementation issues: Who? How?• Requires skills like any other micro survey
• Steps in implementation
Concept
Buy-in across the board
Questionnaire design
Identify (and contract) implementing agency
Pilot
Enumerator training
Field work (including quality control and data entry)
Analysis and dissemination
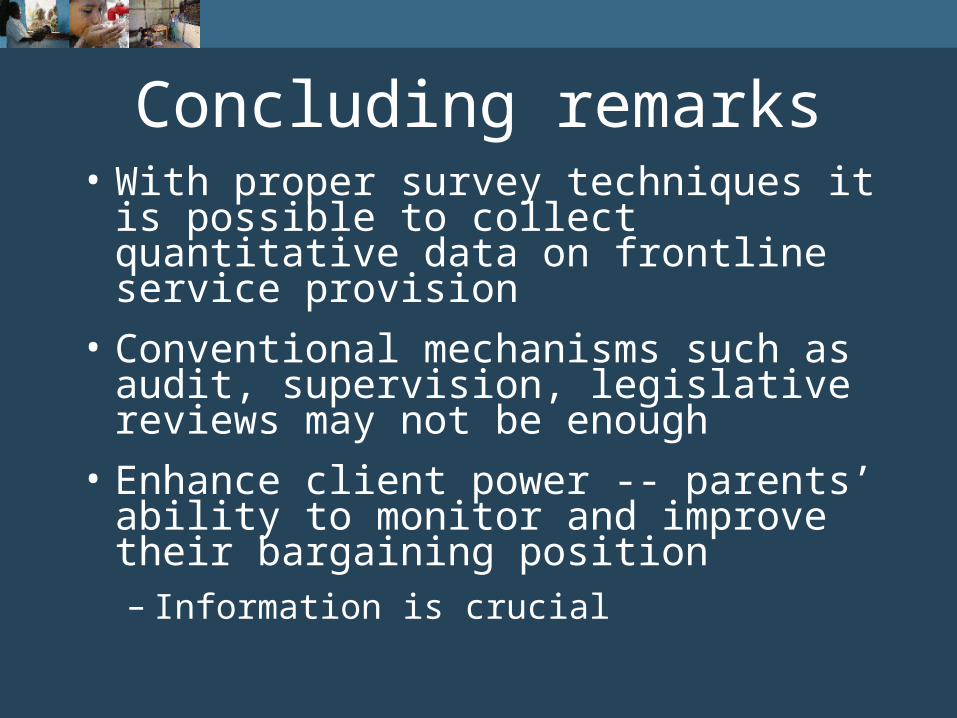
Concluding remarks• With proper survey techniques it is possible
to collect quantitative data on frontline service provision
• Conventional mechanisms such as audit, supervision, legislative reviews may not be enough
• Enhance client power -- parents’ ability to monitor and improve their bargaining position– Information is crucial
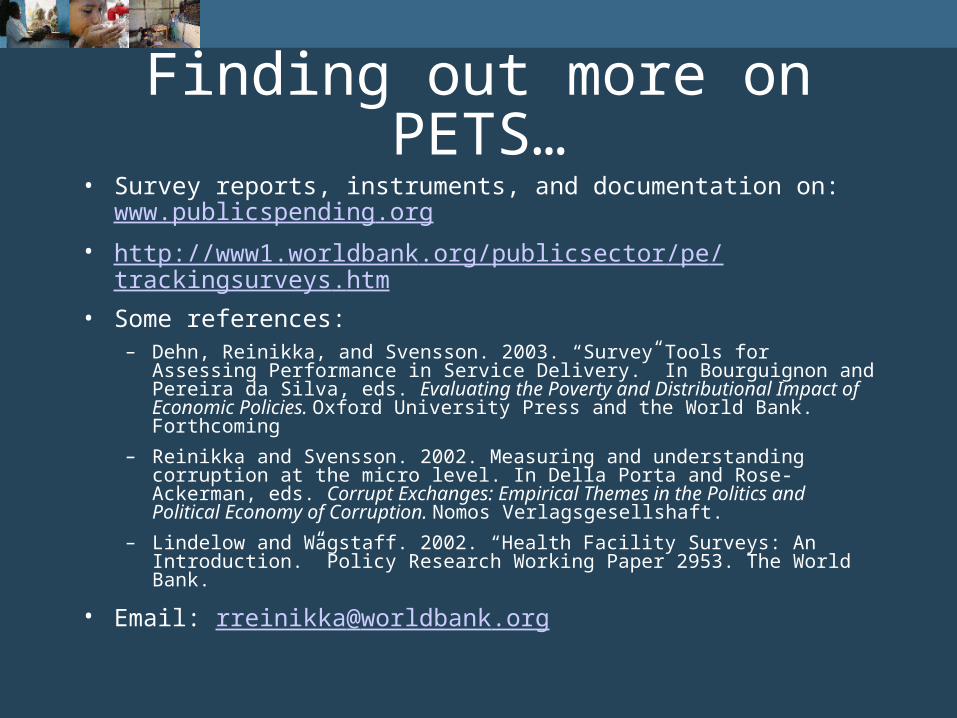
Finding out more on PETS…• Survey reports, instruments, and documentation on: www.
publicspending.org
• http://www1.worldbank.org/publicsector/pe/trackingsurveys.htm
• Some references:– Dehn, Reinikka, and Svensson. 2003. “Survey Tools for Assessing Performance in
Service Delivery.” In Bourguignon and Pereira da Silva, eds. Evaluating the Poverty and Distributional Impact of Economic Policies. Oxford University Press and the World Bank. Forthcoming
– Reinikka and Svensson. 2002. Measuring and understanding corruption at the micro level. In Della Porta and Rose-Ackerman, eds. Corrupt Exchanges: Empirical Themes in the Politics and Political Economy of Corruption. Nomos Verlagsgesellshaft.
– Lindelow and Wagstaff. 2002. “Health Facility Surveys: An Introduction.” Policy Research Working Paper 2953. The World Bank.
• Email: [email protected]