Embed Size (px)
Citation preview
How Resource Inequalities Among High SchoolsReproduce Class Advantages in College Destinations
Joshua Klugman
Received: 7 July 2011� Springer Science+Business Media, LLC 2012
Abstract Previous studies argued that high school resources play a modest role in stu-
dents’ postsecondary destinations, but they ignored schools’ programmatic resources,
which provide opportunities for marks of distinction, such as Advanced Placement courses,
and they focused on older cohorts of high school students who entered colleges before
competition over admission to selective colleges intensified in the 1980s. Analyses of data
on a cohort of students who entered college in the mid-2000s suggest that programmatic
and non-programmatic resources found in high schools influence postsecondary destina-
tions and mediates the effect of family socioeconomic status on choices among 4-year
colleges.
Keywords High school resources � School resources � College destinations � College
choice � College selectivity � Advanced placement � School effects � Stratification � Class
Introduction
There is growing stratification within higher education: some colleges are much more
selective than others (Stevens et al. 2008). Selective colleges facilitate superior occupa-
tional (Brand and Halaby 2006; Long 2008; Liu et al. 2010; Loury and Garman 1995;
Zhang 2008) and marital (Arum et al. 2008) outcomes for their graduates. These benefits of
college selectivity are not just limited to the ‘‘super-elite’’ colleges defined by Rivera
(2011), but accrue even to graduates of moderately selective colleges such as state flagship
universities (Hoekstra 2009).1
J. Klugman (&)Department of Sociology, Temple University, 1115 W. Polett Walk, Gladfelter Hall 713,Philadelphia 19122, PA, USAe-mail: [email protected]
1 Some scholars (Black and Smith 2004; Brand and Halaby 2006; Dale and Krueger 2002, 2011) argue thatthe benefits of selective colleges, or at least the certainty that there are benefits, have been overstated byprevious research. Long (2008) demonstrates that the documented benefits of selective colleges survivethese methodological challenges.
123
Res High EducDOI 10.1007/s11162-012-9261-8
Why do some high school students enroll in highly selective colleges and others do not?
While scholars have paid attention to the roles of race (Espenshade and Radford 2009;
Grodsky 2007) and to a lesser extent gender (Persell et al. 1992), they have mainly
emphasized the role of class. Families of high socioeconomic status (SES) can pay for
college (An 2010; Hearn 1991; Karen 2002; Turley et al. 2007; Davies and Guppy 1997)
but they also can also activate their social capital to access information that helps their
children (a) realize that enrolling in a selective college is feasible and (b) engage in
successful impression management during the application process (Deil-Amen and Tevis
2010; Grodsky and Riegle-Crumb 2010; Hossler et al. 1999; McDonough 1997; Davies
and Guppy 1997). Perhaps most importantly, these families have resources to invest in
their children’s educational careers (Alon 2009; Entwisle et al. 2005; Hearn 1991; Karen
2002; Lareau 1989, 2003; Wildhagen 2009). Selective colleges, acting on their own
institutional interests, define what achievements merit admission (Karabel 2005), and
social scientists generally agree that upper-class and upper-middle class parents are better
able to help their children meet these standards (Bourdieu and Passeron 1990; Lareau
1989). In other words, advantaged parents maximize their children’s ability to gain ‘‘marks
of distinction,’’ the academic and extracurricular achievements valued by gatekeepers such
as selective college admissions offices (Kilgore 2009; Stevens 2007).
Researchers disagree over whether or not high schools facilitate these class advantages.
Most high schools do not help their graduates pay for college. But the fragmented, localized
system of public and private schools in the United States produces inequalities in schools’
programmatic, pedagogical, and social resources that may increase students’ chances of
enrolling in selective colleges through other ways. Programmatic resources are particular
forms of curricular or extracurricular content that are direct opportunities to gain marks of
distinction, such as Advanced Placement (AP) or International Baccalaureate (IB) courses,
or participation in extracurricular activities or interscholastic sports. Social resources, or
social capital, refer to social relations among students, parents, and school staff members
(Coleman and Hoffer 1987), which are especially strong in high-SES schools (Wenglinsky
1997; Condron 2009). Pedagogical resources are those intended to improve learning, like
small class sizes or well-trained teachers, although they can also contribute to better social
relationships between teachers and students. Social and pedagogical resources can be
sources of encouragement and information important for navigating the college admissions
process (McDonough 1997; McDonough and Calderone 2006; Mullen 2009; Perna et al.
2008; Stevens 2007), they can facilitate students’ ability and motivation to strive for marks
of distinction (Clotfelter et al. 2010; Demareth 2009; Elliott 1998; Greenwald et al. 1996;
Grubb 2009; Rumberger and Palardy 2005), and they can help parents instill high educa-
tional aspirations in their children (Coleman and Hoffer 1987).
On the other hand, some believe that benefits of schools’ resources on college destinations
are overstated. Studies of the postsecondary enrollments of older cohorts of adolescents
(1980 or earlier) suggest that high schools’ resources have minimal influence (Alexander and
Eckland 1977; Alwin and Otto 1977; Betts 2001; Eide et al. 2004; Hauser et al. 1976; Jencks
et al. 1972; McDill et al. 1969; Meyer 1970; Strayer 2002), an argument Espenshade et al.
(2005) call the ‘‘school context hypothesis’’. Scholarship on admissions decisions for recent
cohorts (late 1990s) suggest that attending high schools dominated by high-achieving stu-
dents can actually hurt a student’s chances of obtaining admissions at elite colleges (Attewell
2001; Espenshade et al. 2005), an instance of the ‘‘frog pond’’ effect (Davis 1966). Since
these high schools are more likely to be abundant in programmatic, social, and pedagogical
resources, the implication is that attending resource-rich high schools may actually hurt
students’ chances of enrolling in a selective college.
Res High Educ
123
This study is concerned with the role of schools’ resources in mediating the effects of
family SES on students’ postsecondary destinations. It asks if high-SES students’ greater
ability to enroll in more selective colleges is attributable to their schools having more
resources. It also gauges the extent to which the benefits of school resources are mediated
by students’ marks of distinctions. Whether or not schools’ resources influence college
destinations is an important question speaking to equality of educational opportunities and
the role that school contexts play in the reproduction of class inequality from one gener-
ation to the next.
This study contributes to the sparse literature on this topic in three ways. First, it draws
attention to schools’ programmatic resources, which has not been studied as predictors of
college destinations. Second, it uses more recent data than that used by other studies. This
is important because since the 1980s competition over admission to selective colleges has
intensified (Alon 2009; Geiser and Santelices 2006; Hoxby 2009; McDonough et al. 1998;
Bound et al. 2009), raising the possibility that families rely more on schools to help their
children enroll in selective colleges. Finally, the role of high school resources as mediators
between family background and postsecondary destinations has not been examined in other
studies.
Background
Schools and the Role of Family Economic Background in College Destinations
Differences in high schools’ resources may play a role in SES inequalities in college
destinations. High-SES families and children are better equipped to seek out educational
opportunities wherever they exist (Alon 2009; Demareth 2009; Lucas 2001). The frag-
mented and localized system of education in the United States facilitates this: families sort
themselves among communities and schools based on families’ demand and ability to pay
for ‘good’ schools (Johnson 2006; Peterson 1981). School officials work to satisfy the
demands of affluent parents (Cucchiara and Horvat 2009; Demareth 2009; Eitle 2002;
Oakes et al. 1997; Wells and Serna 1996). The combination of sorting processes plus
school officials’ responsiveness to affluent parents produces inequalities between schools
in terms of their programmatic, pedagogical, and social resources available to students
(Condron and Roscigno 2003; Condron 2009; Corcoran et al. 2004; Wenglinsky 1997).
In all likelihood, school resources mediate family SES more for choices among 4-year
colleges than choices among nonselective outcomes (no college, 2-year college, or 4-year
nonselective college). The entrance barriers to 2-year colleges and less selective 4-year
colleges are lower than those for selective 4-year colleges (Manski and Wise 1983;
Rosenbaum 1998), and thus it is expected that inequalities in high school resources will not
explain SES differentials in choices among less selective colleges.
Previous Research on the Benefits of High School Resources
Few studies examining how high school resources affect postsecondary destinations focus on
the selectivity of 4-year colleges students enroll in; most examine whether or not students
enroll in college or intend to do so. These studies, most of which examine cohorts of high
school students from the 1950s through the early 1980s, document at best small benefits to
schools’ social resources (measured as average school SES) and pedagogical resources
(namely, pupil–teacher ratios, teacher salaries, and teacher education) on students’ chances
Res High Educ
123

of enrolling in college (Alwin and Otto 1977; Hauser et al. 1976; Jencks et al. 1972; Meyer
1970; McDill et al. 1969; Betts 2001; Strayer 2002; Riegle-Crumb 2010). The implication of
this school context hypothesis is that students’ postsecondary destinations are structured
mainly by immediate contexts, such as families and peers. In contrast, some studies of recent
cohorts of high school students (1990s and 2000s) indicate that attending a high school with
other affluent students can substantially increase students’ chances of enrolling in 4-year
colleges or earning baccalaureate degrees (Engberg and Wolniak 2010; Owens 2010). There
is also some evidence that attending private schools—especially Catholic ones—is beneficial
for enrolling in 4-year colleges (Kim and Schneider 2005), which could reflect the pro-
grammatic and social resources those schools possess (Coleman and Hoffer 1987; Lee et al.
1998). Additionally, some studies find that high schools’ pedagogical and social resources
are relevant for students’ college grades or persistence (Johnson 2008; Wolniak and Engberg
2010), suggesting that high school resources could be relevant in postsecondary contexts.
A handful of studies actually examine how high schools affect the selectivity of the
colleges students enroll in.2 Alexander and Eckland (1977) found small benefits of high
school SES on college selectivity and argued that the school effects they observed were
‘‘uniformly modest’’ (p. 184). In contrast, Roderick et al.’s (2008) analysis of Chicago Public
School seniors who graduated in 2005 found substantially large effects of high school’s
‘‘college-going culture’’ on students’ chances of enrolling in a ‘‘match’’ college—a college
where student’s academic qualifications are matched with the institution’s selectivity level.
Research looking at other resources of high schools has mixed findings. Eide et al.’s (2004)
analysis found no benefit of having smaller pupil–teacher ratios, but they did uncover small
benefits to having a greater number of teachers with advanced degrees. There is also evidence
of moderate benefits of attending some kind of private school on college selectivity (Eide
et al. 2004; Kim and Schneider 2005; Moller et al. 2011; Stearns et al. 2010). This is consistent
with arguments that private schools have more programmatic and social resources in the form
of more narrow college-preparatory curricula and intense academic climates (Coleman and
Hoffer 1987; Lee et al. 1998; Carbonaro and Covay 2010) as well as well-informed guidance
counselors who maintain ties to admissions officers at selective colleges (McDonough 1997;
Persell and Cookson 1985; Stevens 2007). There is also some evidence that graduates of
schools in rural areas are somewhat disadvantaged in the selectivity of colleges they attend
(Karen 2002; Kim and Schneider 2005), which could reflect the fact that schools in rural areas
have less pedagogical, programmatic, and social resources (Roscigno et al. 2006).
While these previous studies have made important contributions, they cannot fully
address the questions set out in this study. First, some of these studies use fairly old data,
such as Alexander and Eckland (1977) who used data on high school sophomores in 1955,
and Eide et al. (2004), who used data on a cohort of high school sophomores in 1980. This
is problematic because rankings of colleges have become more nationally salient (the U.S.
News and World Report rankings of colleges first appeared in 1983) and competition over
admission to selective colleges intensified in the 1980s (Bastedo and Jaquette 2011; Bound
et al. 2009), as indicated by selective colleges’ increased reliance on test scores (Alon and
Tienda 2007) and AP courses (Geiser and Santelices 2006). Given the growing importance
of marks of distinction in enrolling in selective colleges, it is possible that the effects of
schools’ social, pedagogical, and especially programmatic resources have also grown.
2 This discussion omits studies that examined the effects of school resources on students’ postsecondaryoutcomes but did not fully control for either student SES or students’ academic ability, even though theauthors of these studies may have had valid reasons for their designs (Halpern-Manners et al. 2009; Martinet al. 2005; Niu and Tienda 2008; Niu et al. 2006).
Res High Educ
123
Moreover, none of these studies gauge the exact benefits—if any exist—of program-
matic resources. This is important because research suggests that these marks of distinction
increase students’ chances of enrolling in selective colleges (Attewell and Domina 2008;
Espenshade and Radford 2009; Kaufman and Gabler 2004; but see Stearns et al. 2010).
Whether or not a student takes an AP course or participates on an interscholastic sports
team depends in large part on whether or not his or her high school offers them.
Finally, previous research in this vein has not examined the role of schools’ programmatic,
pedagogical, and social resources as a mediator of the effect of family SES on college
destinations.3 The previously cited scholarship showing minimal effects of social and ped-
agogical resources implicitly suggested that substantial mediation is not occurring. However,
it is worth revising this conclusion in a study that addresses the other two unanswered
questions—the role of programmatic resources and the role of high school resources in
general since the intensification of competition over selective college admissions.
Previous Research on the Negative Effects of High School Resources
Recent studies, looking at cohorts of high school students in the late 1990s, have shown that
because selective colleges evaluate applicants in comparison to others from the same school,
students are, ceteris paribus, less likely to gain admission to a selective college if they attend a
high school with other academically successful students (Espenshade et al. 2005; Attewell
2001). This frog pond effect, which is more likely to be found in affluent high schools, is
exacerbated even more by these high schools adopting ‘‘winner-take-all’’ organizational prac-
tices that make it harder to obtain good grades or restrict access to AP and other advanced courses
(Attewell 2001). The implication of these studies is that, while high schools’ programmatic,
pedagogical, and social resources do not have negative effects per se, they are associated with
organizational practices that hurt students’ chances of enrolling in selective colleges.
These studies have been invaluable in documenting the frog pond effect, but they have
not examined the effects of school resources in a thorough way. The study of Espenshade
et al. (2005) comes close, but their study’s strengths preclude it from addressing the matter
at hand. Confining the analysis to just applicants to selective colleges ignores the sub-
stantial self-selection among college applicants (Higher Education Research Institute 2009;
Karen 1991; Manski and Wise 1983) and thus any potential influence high schools have on
this self-selection. Moreover, since they analyze applicants at only three elite colleges,
their study cannot speak to whether or not students enroll in selective colleges in general.
Data/Methods
The data for this study comes from the Educational Longitudinal Study of 2002 (ELS),
which is a nationally-representative probability sample of tenth graders in the United States
in 2002, with follow ups conducted in 2004 and 2006. This survey was commissioned by
the National Center for Education Statistics (NCES). The sample is restricted to students
who were in the 2006 follow-up, who never dropped out of high school, who attended the
same high school in the tenth and 12th grades, who graduated from high school in 2004 or
3 Some studies have documented that track placement and course sequences mediate the effect of familybackground on enrolling in a 4-year college (Rosenbaum 1980; Schneider 2003; Schneider et al. 1998), butthese studies do not address how high schools’ advanced curricula offerings mediate the effect of familybackground on the selectivity of the colleges students enroll in.
Res High Educ
123
afterward, and who participated in the high school transcript study in 2004. This leaves a
sample of 10,070 cases in 710 schools.4 Cases with missing values on the dependent
variables were dropped, leaving a sample of 9,880 students in 710 schools.5 The school
sample sizes ranged from less than 10 to 40. Variables calculated by aggregating values
within schools (the average SES and test scores of other students in the high school) were
based on all sampled students in the school, regardless if they were included in the final
sample. These school-aggregated variables were calculated from school samples which
averaged 22 cases, and 99 % of students were in schools that provided samples of at least
10. Multiple imputation routines in Royston et al. (2009) ice package for Stata were used to
create and analyze ten imputed datasets to address missing values in predictors.6 Summary
statistics of all variables used in the analysis are presented in Table1.
Variables
Outcomes: College Destinations
In the 2006 follow-up, respondents detailed their history of postsecondary enrollments. ELS
lists the first ‘‘real’’ college respondents attended (this excludes colleges attended during
summer before attending a different college). College destinations are classified into a similar
five-category scheme used by Alon and Tienda (2007) and Alon (2009): no postsecondary
education, 2-year colleges, 4-year non-selective colleges (‘‘nonselective colleges’’), 4-year
selective colleges (‘‘selective colleges’’), and 4-year more-selective colleges (‘‘more selec-
tive colleges’’). The selectivity of the 4-year institutions is based on the ‘‘Admissions
Competitiveness Index’’ used by the 2004 edition of Barron’s Profiles of American Colleges.
Colleges coded as ‘‘more selective’’ were rated by Barron’s as being ‘‘highly’’ or ‘‘most
competitive’’ and tended to have a median SAT of at least 1240. Colleges coded as ‘‘selec-
tive’’ were rated as being ‘‘competitive’’ or ‘‘very competitive’’ with an average SAT between
1000 and 1240. Colleges coded as ‘‘non-selective’’ were rated as being ‘‘less competitive’’
(average SAT score below 1000) or ‘‘noncompetitive’’ (open admissions).
Independent Variables
Socioeconomic Status
Student SES is a composite measure, provided by NCES, of parents’ education levels,
occupations, and family income, measured when students were in the tenth grade.
4 Restricting the sample this way introduces the possibility for bias. Using sample weights minimizes biascaused by attrition (e.g., students who did not participate in the 2006 wave) and by the omission of studentswho did not participate in the transcript study. Dropping students because they changed high schoolsbetween the 2002 and 2004 waves introduces the possibility of biased results because the number is fairlylarge (1,240). In a supplemental analysis is available upon request from the author, these students wereretained and data on their high school resources were, if possible, based on the averages of the high schoolsattended (if data on multiple high schools were not available, data from one high school was used). Theresults are very similar to the main analyses presented here.5 All sample sizes reported in this study are rounded to 10s, in compliance with NCES requirements forusers of restricted-use data.6 I created ten imputations for student-level variables, and ten imputations for school-level variables, andmerged the imputations together. School-level variables were used to impute student-level variables, andstudent-level variables were aggregated at the school-level and used to impute school-level variables.
Res High Educ
123
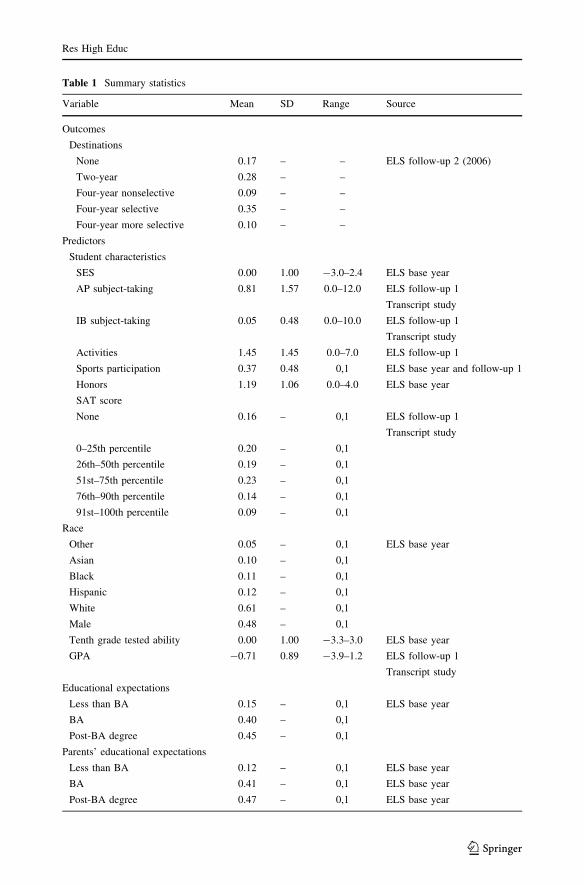
Table 1 Summary statistics
Variable Mean SD Range Source
Outcomes
Destinations
None 0.17 – – ELS follow-up 2 (2006)
Two-year 0.28 – –
Four-year nonselective 0.09 – –
Four-year selective 0.35 – –
Four-year more selective 0.10 – –
Predictors
Student characteristics
SES 0.00 1.00 -3.0–2.4 ELS base year
AP subject-taking 0.81 1.57 0.0–12.0 ELS follow-up 1
Transcript study
IB subject-taking 0.05 0.48 0.0–10.0 ELS follow-up 1
Transcript study
Activities 1.45 1.45 0.0–7.0 ELS follow-up 1
Sports participation 0.37 0.48 0,1 ELS base year and follow-up 1
Honors 1.19 1.06 0.0–4.0 ELS base year
SAT score
None 0.16 – 0,1 ELS follow-up 1
Transcript study
0–25th percentile 0.20 – 0,1
26th–50th percentile 0.19 – 0,1
51st–75th percentile 0.23 – 0,1
76th–90th percentile 0.14 – 0,1
91st–100th percentile 0.09 – 0,1
Race
Other 0.05 – 0,1 ELS base year
Asian 0.10 – 0,1
Black 0.11 – 0,1
Hispanic 0.12 – 0,1
White 0.61 – 0,1
Male 0.48 – 0,1
Tenth grade tested ability 0.00 1.00 -3.3–3.0 ELS base year
GPA -0.71 0.89 -3.9–1.2 ELS follow-up 1
Transcript study
Educational expectations
Less than BA 0.15 – 0,1 ELS base year
BA 0.40 – 0,1
Post-BA degree 0.45 – 0,1
Parents’ educational expectations
Less than BA 0.12 – 0,1 ELS base year
BA 0.41 – 0,1 ELS base year
Post-BA degree 0.47 – 0,1 ELS base year
Res High Educ
123
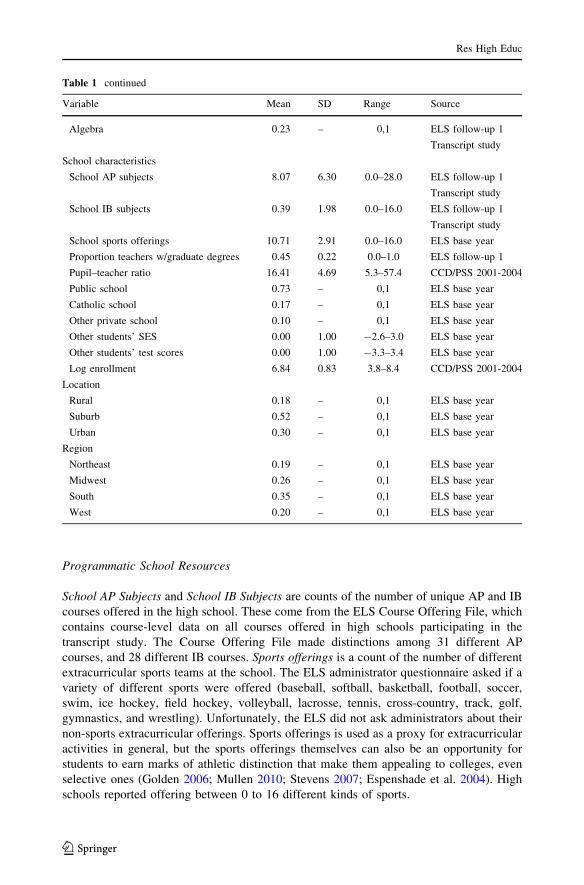
Programmatic School Resources
School AP Subjects and School IB Subjects are counts of the number of unique AP and IB
courses offered in the high school. These come from the ELS Course Offering File, which
contains course-level data on all courses offered in high schools participating in the
transcript study. The Course Offering File made distinctions among 31 different AP
courses, and 28 different IB courses. Sports offerings is a count of the number of different
extracurricular sports teams at the school. The ELS administrator questionnaire asked if a
variety of different sports were offered (baseball, softball, basketball, football, soccer,
swim, ice hockey, field hockey, volleyball, lacrosse, tennis, cross-country, track, golf,
gymnastics, and wrestling). Unfortunately, the ELS did not ask administrators about their
non-sports extracurricular offerings. Sports offerings is used as a proxy for extracurricular
activities in general, but the sports offerings themselves can also be an opportunity for
students to earn marks of athletic distinction that make them appealing to colleges, even
selective ones (Golden 2006; Mullen 2010; Stevens 2007; Espenshade et al. 2004). High
schools reported offering between 0 to 16 different kinds of sports.
Table 1 continued
Variable Mean SD Range Source
Algebra 0.23 – 0,1 ELS follow-up 1
Transcript study
School characteristics
School AP subjects 8.07 6.30 0.0–28.0 ELS follow-up 1
Transcript study
School IB subjects 0.39 1.98 0.0–16.0 ELS follow-up 1
Transcript study
School sports offerings 10.71 2.91 0.0–16.0 ELS base year
Proportion teachers w/graduate degrees 0.45 0.22 0.0–1.0 ELS follow-up 1
Pupil–teacher ratio 16.41 4.69 5.3–57.4 CCD/PSS 2001-2004
Public school 0.73 – 0,1 ELS base year
Catholic school 0.17 – 0,1 ELS base year
Other private school 0.10 – 0,1 ELS base year
Other students’ SES 0.00 1.00 -2.6–3.0 ELS base year
Other students’ test scores 0.00 1.00 -3.3–3.4 ELS base year
Log enrollment 6.84 0.83 3.8–8.4 CCD/PSS 2001-2004
Location
Rural 0.18 – 0,1 ELS base year
Suburb 0.52 – 0,1 ELS base year
Urban 0.30 – 0,1 ELS base year
Region
Northeast 0.19 – 0,1 ELS base year
Midwest 0.26 – 0,1 ELS base year
South 0.35 – 0,1 ELS base year
West 0.20 – 0,1 ELS base year
Res High Educ
123
Pedagogical School Resources
The proportion of teachers with graduate degrees was collected by the ELS researchers
and pupil–teacher ratios are the average of the pupil–teacher ratios reported in the
Common Core of Data (CCD, a census of public schools collected by the National Center
for Education Statistics) and the Private School Universe Survey (PSS, the counterpart to
the CCD for private schools) for the school years 2000–2001, 2001–2002, 2002–2003, and
2003–2004.
Social School Resources
Social resources are measured with two variables: Other students’ SES and other students’test scores is the average SES and average tenth grade standardized math and reading test
scores of all the other ELS respondents in the respondents’ high school in 2002.
School Typologies
Some aspects of schools, such as school sector (public, Catholic, other private) and
location (urban, suburban, rural), do not fit neatly in the categories of programmatic,
pedagogical, and social resources. Since there may be inequalities on all three types of
resources based on sector or location, these predictors are treated as distinct from the
others.
Marks of Distinction
AP Subject-taking and IB Subject-taking are the number of AP and IB subjects the student
enrolled in, according to the transcript file. Activities is the number of extracurricular
activities students reported doing in their senior year. Possible activities that students could
indicate are orchestra, play/musical, student government, academic honor society, news-
paper/yearbook, service club, and any kind of academic club. Sports participation is a
dummy indicator for participating in interscholastic sports in both the sophomore and
senior year. Grades is the student’s z-standardized high school grade point average.
Finally, SAT scores is the student’s SAT scores as reported on the student’s transcript. For
students who took the ACT instead of the SAT, ELS converted their scores into the SAT
metric. SAT scores were treated as a categorical variable, to deal with students who do not
have a reported ACT/SAT test score and who indicated that they did not intend to take
either of these exams (about 11 %).
Controls for Selection into High Schools
One problem with studying the effects of high schools is the possibility that students who
are predisposed to enroll in selective colleges attend resource-rich high schools, and thus
any estimated benefits of high school resources on college destinations are spurious.
Controlling for students’ early achievements and motivations will attenuate, at least par-
tially, this selection problem. Ideally, coefficients for family SES will reflect parents’
practices, behaviors, and resources that occur (or were ‘‘invested’’) during students’ high
school careers, although this rests on the assumption that the cumulative effect of SES on
pre-high school investments can be captured with observed measures of early achieve-
ments and motivations.
Res High Educ
123
Unfortunately, since the ELS data traces a cohort of tenth graders, it is impossible to
obtain good measures of the students’ abilities and predispositions prior to entering high
school. Instead, measures collected in the tenth grade are used.7 Students’ tenth grade testscores is the student’s composite IRT-scaled score on the math and reading tests admin-
istered in the tenth grade. Pre-high school track placement is measured with an indicator
for students who did not take Algebra I during high school but did take a math course that
follows Algebra I (e.g., geometry, trigonometry, Algebra II, calculus); such students in all
likelihood took eighth grade algebra. Students’ tenth grade educational expectations, are
measured with dummy indicators for less than a BA degree, BA degree, and post-BA
degree; the same measures are used for parents’ educational expectations for the student
(reported in the tenth grade).
Other Controls
Student race is measured using dummy indicators for Asians, Blacks, Hispanics, Whites,
and Other; sex is controlled for as an indicator variable for males. At the school level, I
control for logged school enrollment, which are the reports from the CCD and PSS dat-
abases averaged from 2000–2001 to 2003–2004, and for region, measured as dummy
variables for Northeast, Midwest, South, and West.
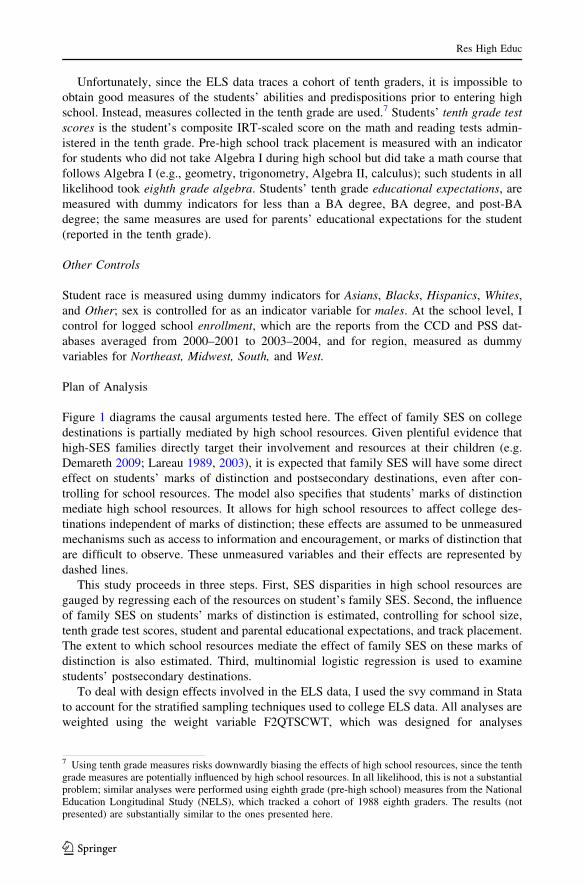
Plan of Analysis
Figure 1 diagrams the causal arguments tested here. The effect of family SES on college
destinations is partially mediated by high school resources. Given plentiful evidence that
high-SES families directly target their involvement and resources at their children (e.g.
Demareth 2009; Lareau 1989, 2003), it is expected that family SES will have some direct
effect on students’ marks of distinction and postsecondary destinations, even after con-
trolling for school resources. The model also specifies that students’ marks of distinction
mediate high school resources. It allows for high school resources to affect college des-
tinations independent of marks of distinction; these effects are assumed to be unmeasured
mechanisms such as access to information and encouragement, or marks of distinction that
are difficult to observe. These unmeasured variables and their effects are represented by
dashed lines.
This study proceeds in three steps. First, SES disparities in high school resources are
gauged by regressing each of the resources on student’s family SES. Second, the influence
of family SES on students’ marks of distinction is estimated, controlling for school size,
tenth grade test scores, student and parental educational expectations, and track placement.
The extent to which school resources mediate the effect of family SES on these marks of
distinction is also estimated. Third, multinomial logistic regression is used to examine
students’ postsecondary destinations.
To deal with design effects involved in the ELS data, I used the svy command in Stata
to account for the stratified sampling techniques used to college ELS data. All analyses are
weighted using the weight variable F2QTSCWT, which was designed for analyses
7 Using tenth grade measures risks downwardly biasing the effects of high school resources, since the tenthgrade measures are potentially influenced by high school resources. In all likelihood, this is not a substantialproblem; similar analyses were performed using eighth grade (pre-high school) measures from the NationalEducation Longitudinal Study (NELS), which tracked a cohort of 1988 eighth graders. The results (notpresented) are substantially similar to the ones presented here.
Res High Educ
123
involving the 2006 wave and the high school transcript data file. Finally, since students are
clustered in high schools, there is a possibility that there will be dependence among the
residual terms, violating the assumption that residual terms are not correlated with each
other. Consequently estimates of standard errors will be artificially suppressed leading to
inflated t-scores and hence Type I error. To deal with this assumption, standard errors are
adjusted for the clustering of the cases in high schools using the svy command in Stata.
Hierarchical linear modeling (HLM) is an alternative specification that would deal with the
clustering of cases by estimating intercepts for each high school in the data. Unfortunately,
this approach is not practical to analyze a nominal outcome with five categories, as is done
in this study. Doing so would either require that four intercepts be estimated for each
school (necessitating many more cases per school than is present in the data), or require the
analyst to arbitrarily select some comparisons to have a random intercept and others to not
have a random intercept, defeating the purpose of using HLM. Additional drawbacks to
using HLM are that doing so precludes accounting for the stratified sample design of ELS,
as well as testing for mediation.
Using multiple-imputed datasets complicates the data analysis in some minor ways.
Measures of model fit (R2s for continuous outcomes and adjusted count R2s for nominal
outcomes) are calculated for each imputation and then aggregated over all imputations.8
Tests for mediation are done by comparing the effect of family SES on marks of distinction
and college selectivity, with and without controls for school resources. A significant
decline in the effect of family SES after controlling for school resources indicates medi-
ation is occurring. Stata’s SUEST routine is used to test the null hypothesis that the effect
of family SES in a model controlling for school resources is equal to the effect of family
SES in a baseline model with no controls for school resources. These tests were done for
each imputation and the number of imputations where the null hypothesis is rejected (i.e.,
supporting claims of mediated effects) is listed as a superscript.
Family SES
High School Resources --Pedagogical --Programmatic --Social
Observed Student Marks of Distinction
Student Information Student Encouragement Unmeasured student
marks of distinction
Student Postsecondary Destinations
Fig. 1 Causal diagram (dotted lines represent unmeasured variables)
8 For analyses of continuous outcomes, I use Harel’s (2009) method for averaging R2s, which entailsconverting each imputation’s R2 into a z score, taking the average of the z’s, and then converting the averagez back into R2. Unfortunately there is no such equivalent for the adjusted count R2. The adjusted count R2’sreported here are averages of each imputation’s adjusted count R2, in unweighted analyses, since it isimpossible to calculate an adjusted count R2 when sampling weights are used in Stata.
Res High Educ
123
Results
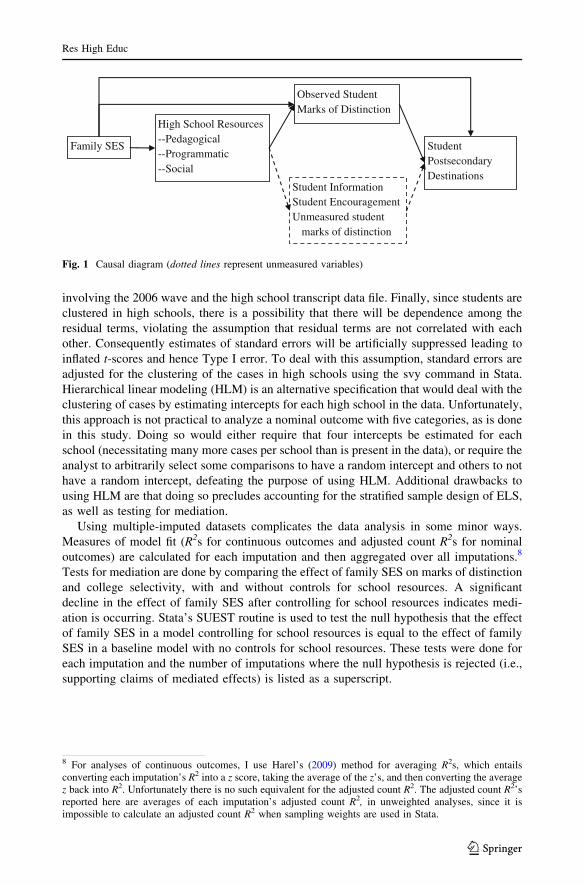
School Resources
Since the argument tested in this paper is that affluent families’ advantage in getting their
children into selective colleges works at least partially through school resources, it is
necessary to gauge the extent to which children from high-SES families attend schools that
are abundant in pedagogical, social, and programmatic resources. Table 2 presents
regressions of high school resources on family SES, controlling for race and gender.
The results show high-SES students attend high schools advantaged in programmatic
resources such as AP and IB subjects and sports offerings; the pedagogical resource of teachers
with graduate degrees; and social resources in the form of high-SES and high-ability student
bodies. In addition, family SES is positively associated with attending a private school (either
Catholic or non-Catholic) over a public one, and is negatively associated with attending a high
school in a rural area (and positively associated with attending a high school in a suburban area).
A one standard deviation increase in students’ SES increases the number of AP subjects offered
at the school by 1.40, the number of IB subjects by .12, the number of sports offerings by .61, the
percentage of teachers who have graduate degrees by 3.8 %age points, and the SES and test
scores of other students by .39 and .29 standard deviations, respectively.
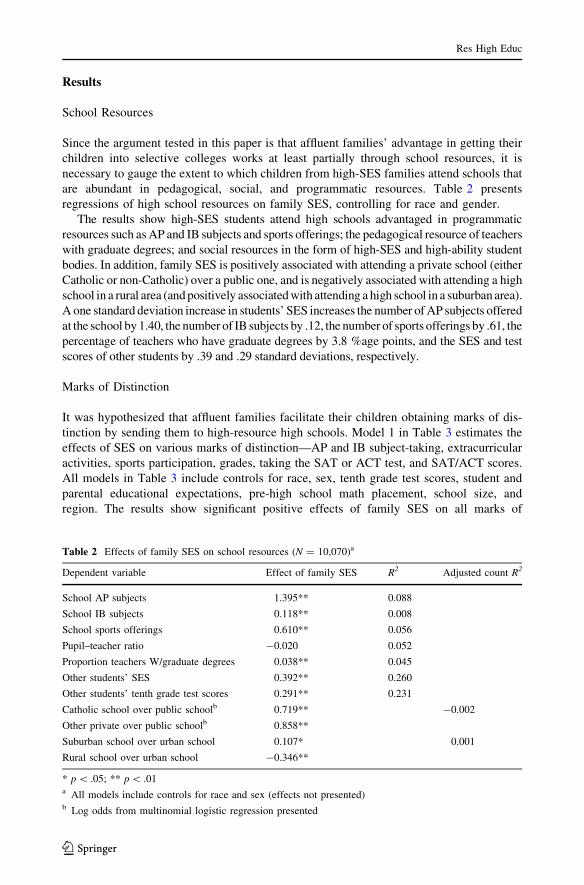
Marks of Distinction
It was hypothesized that affluent families facilitate their children obtaining marks of dis-
tinction by sending them to high-resource high schools. Model 1 in Table 3 estimates the
effects of SES on various marks of distinction—AP and IB subject-taking, extracurricular
activities, sports participation, grades, taking the SAT or ACT test, and SAT/ACT scores.
All models in Table 3 include controls for race, sex, tenth grade test scores, student and
parental educational expectations, pre-high school math placement, school size, and
region. The results show significant positive effects of family SES on all marks of
Table 2 Effects of family SES on school resources (N = 10,070)a
Dependent variable Effect of family SES R2 Adjusted count R2
School AP subjects 1.395** 0.088
School IB subjects 0.118** 0.008
School sports offerings 0.610** 0.056
Pupil–teacher ratio -0.020 0.052
Proportion teachers W/graduate degrees 0.038** 0.045
Other students’ SES 0.392** 0.260
Other students’ tenth grade test scores 0.291** 0.231
Catholic school over public schoolb 0.719** -0.002
Other private over public schoolb 0.858**
Suburban school over urban school 0.107* 0.001
Rural school over urban school -0.346**
* p \ .05; ** p \ .01a All models include controls for race and sex (effects not presented)b Log odds from multinomial logistic regression presented
Res High Educ
123
Tab
le3
Eff
ects
of
fam
ily
SE
S,
race
,gen
der
,an
dsc
hool
reso
urc
eson
mar
ks
of
dis
tinct
ion
(N=
10
,07
0)
AP
subje
ct-t
akin
gIB
subje
ct-t
akin
gA
ctiv
itie
sS
port
sG
rades
Took
SA
T/A
CT
test
SA
T/A
CT
score
a
Mo
del
1
Fam
ily
SE
S0
.16*
*0
.01
0.1
2*
*0
.27*
*0
.07*
*0
.40*
*2
3.6
5*
*
R2
0.2
90
.03
0.2
10
.10
0.4
60
.23
0.7
0
Mo
del
2
Fam
ily
SE
S0
.13*
*(1
0)
0.0
1(0
)0
.12
**
(0)
0.2
3*
*(1
0)
0.0
9*
*(1
0)
0.3
7*
*(1
0)
15
.78
**
(10)
Sch
oo
lA
Psu
bje
cts
0.0
4*
*0
.01
-0
.01
0.5
0
Sch
oo
lIB
sub
ject
s-
0.0
3*
0.0
8*
*
Sch
oo
lsp
ort
so
ffer
ing
s0
.05*
*0
.43
Pupil
–te
acher
rati
o0
.01*
-0
.03*
-0
.14
Pro
po
rtio
nte
ach
ers
w/g
rad
uat
ed
egre
es-
0.1
1?
4.5
6
Oth
erS
tud
ents
’S
ES
-0
.02
16
.15
**
Oth
erst
ud
ents
’te
stsc
ore
s-
0.0
6*
*0
.05
-0
.04?
4.1
6
Cat
ho
lic
sch
ool
-0
.02
*0
.18
**
1.1
2*
*7
.7
Oth
erp
riv
ate
-0
.01
0.2
1*
0.5
01
8.5
4?
Su
bu
rb-
0.1
8*
*-
0.4
5*
*
Rura
l-
0.2
7*
*-
0.6
0*
R2
0.3
20
.18
0.2
10
.10
0.4
60
.23
0.7
1
Note
:O
LS
regre
ssio
nuse
dfo
ral
loutc
om
es,
exce
pt
for
sport
spar
tici
pat
ion
and
AC
T/S
AT
test
-tak
ing,
wher
elo
gis
tic
regre
ssio
nis
use
d.
All
model
sin
clu
de
con
tro
lsfo
rra
ce,
sex,te
nth
gra
de
educa
tional
expec
tati
ons,
tenth
gra
de
par
enta
led
uca
tional
expec
tati
ons,
tenth
gra
de
test
score
s,ei
ghth
gra
de
algeb
raco
urs
e-ta
kin
g,lo
gsc
ho
ol
size
,an
dre
gio
n.
Sch
oo
lre
sou
rce
pre
dic
tors
wer
eex
clu
ded
fro
mth
em
od
els
ifth
eyh
adn
on
sig
nifi
can
tef
fect
sin
mod
els
test
ing
them
on
eat
ati
me.
Su
per
scri
pte
dn
um
ber
sre
fer
ton
um
ber
of
imp
uta
tio
ns
(ou
to
fte
n)
wh
ere
effe
cto
ffa
mil
yS
ES
issi
gn
ifica
ntl
yd
iffe
ren
tfr
om
that
of
mo
del
1
?p
\.1
0;
*p\
.05
;*
*p\
.01
aS
amp
leli
mit
edto
tho
sew
ho
too
kth
eS
AT
(N=
8,9
30
)
Res High Educ
123
distinction, except for IB subject-taking. A standard deviation increase in SES increases
AP subject-taking by .16 courses, extracurricular activities by .12 activities, SAT scores by
24 points, the odds of sports participation by 31 % [exp(.27) = 1.31], and the odds of
taking the SAT test by 49 % [exp(.40) = 1.49].
The associations between school resources and marks of distinction are presented in
Model 2. In results not presented, these associations (net of the control variables) were
modeled one at a time; only those resources with significant associations are presented in
Model 2. Programmatic resources tend to have benefits for specific marks of distinction
(e.g. AP subject offerings are positively associated with AP subject-takings; likewise with
IB subject offerings and sports offerings). The association between school AP subjects and
student AP subject-taking is fairly substantial—a standard deviation increase in AP subject
offerings (6.3 subjects) is associated with taking .25 more AP subjects, which is larger than
the effect for a standard deviation increase in family SES (.13).
Pedagogical resources do not have any straightforward associations with marks of
distinction. Students tend to earn lower grades in schools with smaller pupil–teacher ratios
and larger shares of teachers with graduate degrees, although smaller pupil–teacher ratios
increase the chances of taking the SAT or ACT exam.
Social resources, in the form of the socioeconomic composition of other students, are
associated with higher scores on the SAT/ACT exam (an effect which is even larger than
that of family SES), but are not associated with any other mark of distinction. The aca-
demic abilities of other students produce a frog pond effect, in that higher-achieving peers
are associated with reduced participation in extra-curricular activities and grades.
School sector and urban/rural status (representing differences in other unmeasured
programmatic, pedagogical, and social resources) are also associated with differences in
marks of distinction. Students who attend private schools have higher levels of extra-
curricular activities, and students in Catholic schools are more likely to take the SAT/ACT
exam, while students in non-Catholic private schools score higher on those exams. Stu-
dents who attend rural and (to a lesser extent) suburban schools have lower levels of AP
subject-taking and lower odds of taking the SAT/ACT exam.
School resources significantly mediate the effect of family SES on all marks of dis-
tinction, excepting IB subject-taking and extracurricular activities. The extent of the
mediation is fairly modest however. Only for SAT scores is the mediation substantial—the
effect of family SES is reduced by a third after controlling for school resources.
In short, programmatic and social resources, as well as attending private schools and
urban schools, have moderate associations with students’ measured marks of distinctions.
In some cases, these effects are comparable to those of family SES.
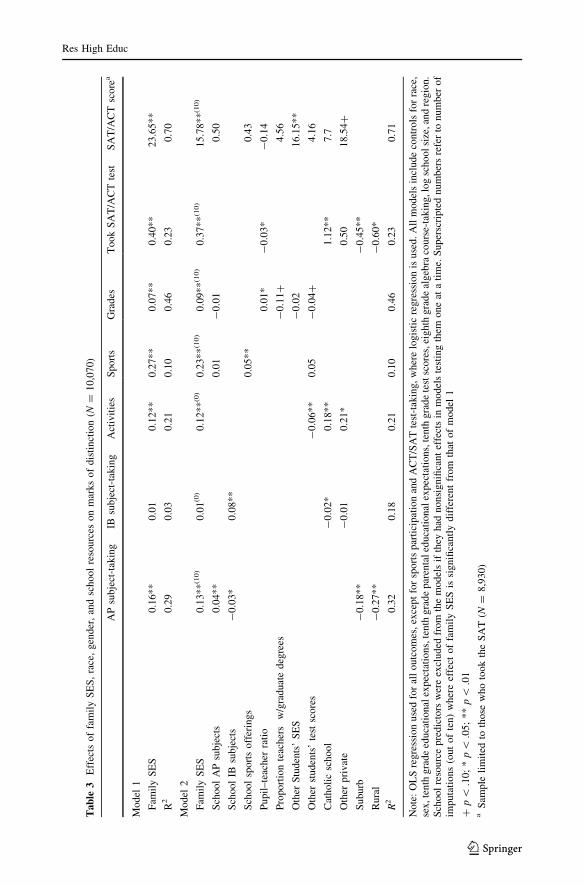
College Enrollments
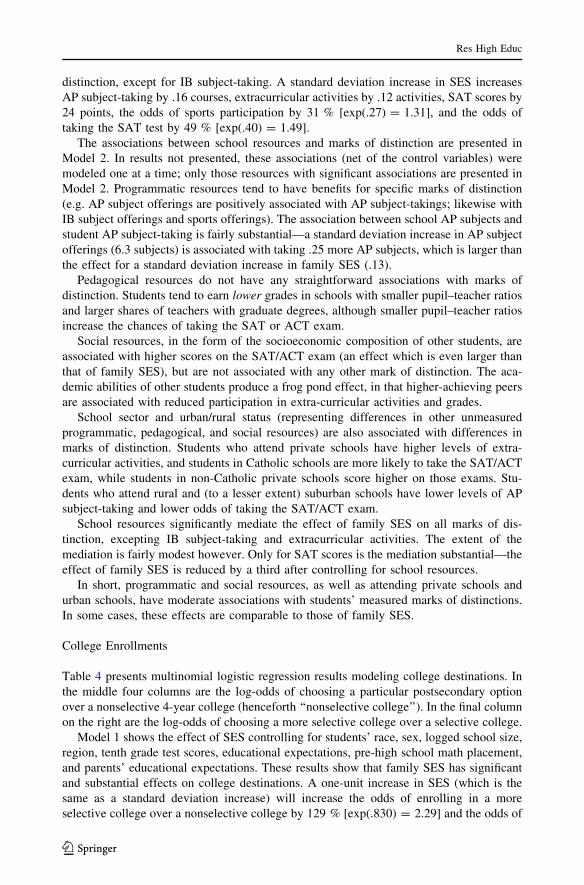
Table 4 presents multinomial logistic regression results modeling college destinations. In
the middle four columns are the log-odds of choosing a particular postsecondary option
over a nonselective 4-year college (henceforth ‘‘nonselective college’’). In the final column
on the right are the log-odds of choosing a more selective college over a selective college.
Model 1 shows the effect of SES controlling for students’ race, sex, logged school size,
region, tenth grade test scores, educational expectations, pre-high school math placement,
and parents’ educational expectations. These results show that family SES has significant
and substantial effects on college destinations. A one-unit increase in SES (which is the
same as a standard deviation increase) will increase the odds of enrolling in a more
selective college over a nonselective college by 129 % [exp(.830) = 2.29] and the odds of
Res High Educ
123
Tab
le4
Mult
inom
ial
logis
tic
regre
ssio
nan
alysi
sof
enro
llm
ents
(N=
9,8
80
)
Var
iab
leB
ase
=fo
ur-
yea
rn
on
sele
ctiv
eB
ase
=fo
ur-
yea
rse
lect
ive
No
post
seco
ndar
yed
uca
tion
Tw
o-y
ear
Fo
ur-
yea
rse
lect
ive
Fo
ur-
yea
rm
ore
sele
ctiv
eF
ou
r-y
ear
mo
rese
lect
ive
Mo
del
1(A
CR
2=
.24
7)
Fam
ily
SE
S-
0.4
78
**
-0
.086
0.3
83
**
0.8
30
**
0.4
47
**
Mo
del
2A
(AC
R2
=.2
50
)
Fam
ily
SE
S-
0.4
74
**
(0)
-0
.087
(0)
0.3
61
**
(2)
0.7
56
**
(10)
0.3
95
**
(10)
Sch
oo
lA
Psu
bje
cts
-0
.016
-0
.013
0.0
08
0.0
71
**
0.0
63
**
Sch
oo
lIB
sub
ject
s-
0.0
10
0.0
11
0.0
05
0.0
18
0.0
13
Sch
oo
lsp
ort
so
ffer
ing
s0
.017
0.0
28
0.0
59?
0.0
35
-0
.024
Mo
del
2B
(AC
R2
=.2
48)
Fam
ily
SE
S-
0.4
83
**
(0)
-0
.088
(0)
0.3
65
**
(10)
0.7
98
**
(8)
0.4
34
**
(0)
Pupil
–te
acher
rati
o-
0.0
08
-0
.012
-0
.01
8-
0.0
61?
-0
.043?
Pro
port
ion
teac
her
sw
/gra
d.
deg
rees
0.1
23
-0
.076
0.7
93
*0
.637
-0
.156
Mo
del
2C
(AC
R2
=.2
54)
Fam
ily
SE
S-
0.4
85
**
(0)
-0
.118
*(0
)0
.25
5*
*(1
0)
0.5
79
**
(10)
0.3
24
**
(10)
Oth
erst
ud
ents
’S
ES
0.0
06
0.1
09
0.4
56
**
0.7
83
**
0.3
26
**
Oth
erst
ud
ents
’te
stsc
ore
s0
.005
0.0
32
-0
.02
7-
0.0
53
-0
.026
Mo
del
2D
(AC
R2
=..
25
8)
Fam
ily
SE
S-
0.4
56
**
(10)
-0
.078
(0)
0.3
66
**
(0)
0.7
43
**
(10)
0.3
77
**
(10)
Cat
ho
lic
sch
oo
l-
1.2
51
**
-0
.282
0.2
42
0.7
79
**
0.5
37
**
Oth
erp
riv
ate
-0
.308
0.1
08
0.1
38
1.2
36
**
1.0
98
**
Su
bu
rb0
.387
*0
.574
**
0.1
35
0.2
55
0.1
20
Ru
ral
0.1
40
0.3
93?
-0
.10
8-
0.2
21
-0
.113
Res High Educ
123
Tab
le4
con
tin
ued
Var
iab
leB
ase
=fo
ur-
yea
rn
on
sele
ctiv
eB
ase
=fo
ur-
yea
rse
lect
ive
No
po
stse
con
dar
yed
uca
tion
Tw
o-y
ear
Fo
ur-
yea
rse
lect
ive
Fo
ur-
yea
rm
ore
sele
ctiv
eF
ou
r-y
ear
mo
rese
lect
ive
Mo
del
2E
(AC
R2
=.2
57)
Fam
ily
SE
S-
0.4
70
**
(0)
-0
.10
5?
(0)
0.2
60
**
(10)
0.5
74
**
(10)
0.3
14
**
(10)
Sch
oo
lA
Psu
bje
cts
-0
.014
-0
.01
2-
0.0
08
0.0
41
*0
.049
**
Pro
port
ion
teac
her
sw
/gra
d.
deg
rees
0.0
06
-0
.26
90
.40
1-
0.0
41
-0
.442
Oth
erst
ud
ents
’S
ES
0.0
95
0.1
84
*0
.46
7*
*0
.563
**
0.0
96
Cat
ho
lic
sch
oo
l-
1.3
86
**
-0
.49
2*
-0
.32
90
.117
0.4
46
*
Oth
erp
riv
ate
-0
.481
-0
.17
1-
0.5
74?
0.3
40
0.9
15
**
Su
bu
rb0
.353
*0
.52
8*
*0
.00
80
.169
0.1
61
Ru
ral
0.1
18
0.3
50
-0
.17
0-
0.2
12
-0
.043
Mo
del
3(A
CR
2=
.34
0)
Fam
ily
SE
S-
0.4
17
**
(7)
-0
.07
5(0
)0
.19
8*
*(1
0)
0.3
75
**
(10)
0.1
77
*(1
0)
Sch
oo
lA
Psu
bje
cts
-0
.016
-0
.01
2-
0.0
09
0.0
16
0.0
25
Pro
port
ion
teac
her
sw
/gra
d.
deg
rees
-0
.092
-0
.35
10
.53
20
.093
-0
.439
Oth
erst
ud
ents
’S
ES
0.0
26
0.1
46
0.5
09
**
0.6
97
**
0.1
89
*
Cat
ho
lic
sch
oo
l-
1.2
91
**
-0
.48
1*
-0
.34
00
.136
0.4
76
*
Oth
erp
riv
ate
-0
.357
-0
.14
8-
0.6
33?
0.3
65
0.9
98
**
Su
bu
rb0
.298?
0.5
03
**
-0
.01
40
.192
0.2
06
Ru
ral
-0
.046
0.2
53
-0
.15
9-
0.1
22
0.0
37
Res High Educ
123
Tab
le4
con
tin
ued
Var
iab
leB
ase
=fo
ur-
yea
rn
on
sele
ctiv
eB
ase
=fo
ur-
yea
rse
lect
ive
No
post
seco
ndar
yed
uca
tio
nT
wo
-yea
rF
ou
r-y
ear
sele
ctiv
eF
ou
r-y
ear
more
sele
ctiv
eF
ou
r-y
ear
mo
rese
lect
ive
Stu
den
tS
AT
sco
re(r
ef:
91
–10
0th
%ti
le)
Mis
sin
g0
.860
0.9
00?
-2
.598
**
-4
.025
*-
1.4
27
Fir
stq
uar
tile
-0
.884
-0
.04
6-
1.8
27
**
-2
.821
**
-0
.994
*
Sec
ond
qu
arti
le-
1.0
40
?-
0.2
13
-1
.233
**
-2
.509
**
-1
.275
**
Th
ird
qu
arti
le-
1.2
69
*-
0.5
76
-0
.995
**
-1
.962
**
-0
.967
**
76
–90
thp
erce
nti
le-
0.4
67
-0
.16
6-
0.4
64
-0
.834
*-
0.3
70
*
AP
cou
rse-
tak
ing
-0
.123
-0
.08
30
.079
0.3
08
**
0.2
29
**
IBco
urs
e-ta
kin
g-
0.2
82
0.1
33
0.3
21
0.4
41?
0.1
20
*
Act
ivit
ies
-0
.183
**
-0
.08
5?
0.0
43
0.1
45
**
0.1
03
**
Sp
ort
s-
0.3
78
**
-0
.27
3*
0.3
03
**
0.5
09
**
0.2
07?
Gra
des
-0
.599
**
-0
.29
8*
*0
.408
**
1.0
28
**
0.6
20
**
Note
:A
llm
odel
sin
clude
contr
ols
for
sex,
race
,te
nth
gra
de
test
edab
ilit
y,
eighth
gra
de
algeb
rapla
cem
ent,
tenth
gra
de
educa
tional
expec
tati
ons,
ten
thg
rad
ep
aren
ts’
edu
cati
on
alex
pec
tati
on
s,sc
ho
ol
enro
llm
ent,
and
reg
ion.S
uper
scri
pte
dn
um
ber
sre
fer
ton
um
ber
of
imp
uta
tio
ns
(ou
to
f1
0)
wh
ere
effe
cto
ffa
mil
yS
ES
issi
gn
ifica
ntl
yd
iffe
ren
tfr
om
that
of
mod
el1
.A
dju
sted
cou
nt
R2s
are
list
edfo
rea
chm
od
el
?p\
.10
;*
p\
.05
;*
*p\
.01
Res High Educ
123
enrolling in a more selective college over a selective college by 56 % [exp(.447) = 1.56].
In addition, high-SES students are more likely to enroll in a selective college over a
nonselective college and are more likely to enroll in a nonselective college over no college.
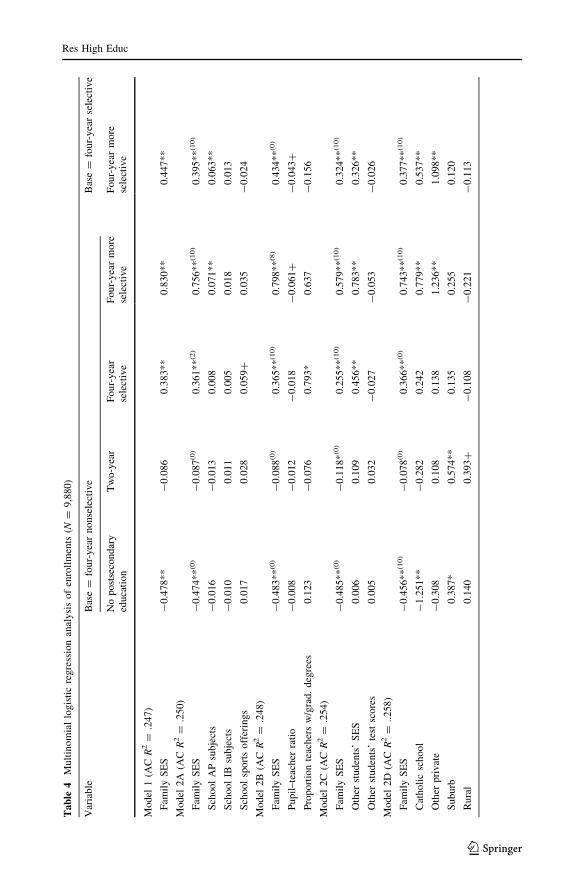
In models 2A–2D, measures of social, pedagogical, and programmatic resources are
included in separate models. In Model 2E, all of the significant school resources in the
prior models are introduced. While previous research has not considered the role of pro-
grammatic resources in student outcomes, my results show that they can matter. Schools’
AP subjects—but not IB subjects or sports offerings—have significant benefits for stu-
dents’ chances of enrolling in more selective colleges (Model 2A). A high school with a
high level of AP subjects increases its students’ odds of enrolling in a more selective
college over a nonselective and selective college. School AP subjects and the other pro-
grammatic resources also significantly mediate the effect of SES for the choices between
more selective colleges, on the one hand, and nonselective and selective colleges on the
other (by around 10 %). Moreover, the significance of the coefficient for school AP sub-
jects survives when other school resources are controlled for, in Model 2E, suggesting that
the benefits of AP subjects are not reducible to some other resource.
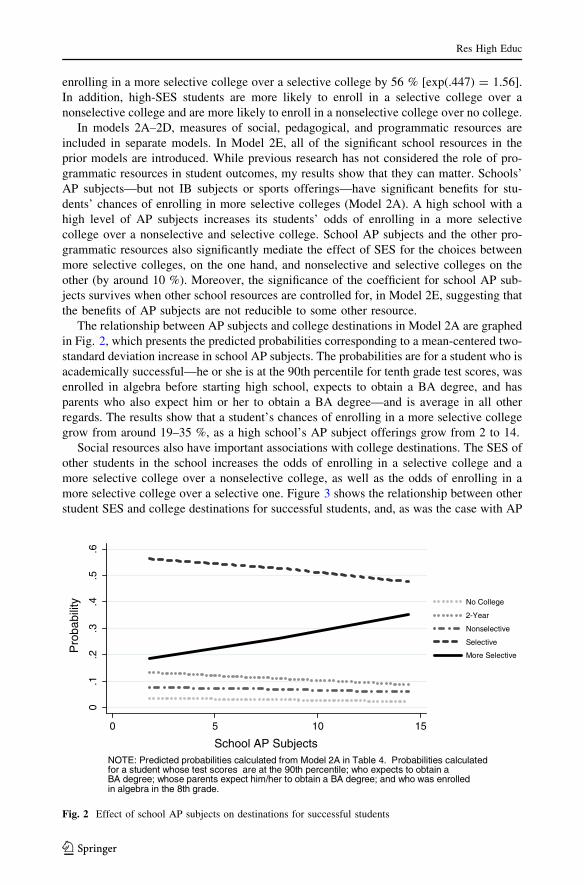
The relationship between AP subjects and college destinations in Model 2A are graphed
in Fig. 2, which presents the predicted probabilities corresponding to a mean-centered two-
standard deviation increase in school AP subjects. The probabilities are for a student who is
academically successful—he or she is at the 90th percentile for tenth grade test scores, was
enrolled in algebra before starting high school, expects to obtain a BA degree, and has
parents who also expect him or her to obtain a BA degree—and is average in all other
regards. The results show that a student’s chances of enrolling in a more selective college
grow from around 19–35 %, as a high school’s AP subject offerings grow from 2 to 14.
Social resources also have important associations with college destinations. The SES of
other students in the school increases the odds of enrolling in a selective college and a
more selective college over a nonselective college, as well as the odds of enrolling in a
more selective college over a selective one. Figure 3 shows the relationship between other
student SES and college destinations for successful students, and, as was the case with AP
0.1
.2.3
.4.5
.6
Pro
babi
lity
0 5 10 15
School AP Subjects
No College
2-Year
Nonselective
Selective
More Selective
NOTE: Predicted probabilities calculated from Model 2A in Table 4. Probabilities calculatedfor a student whose test scores are at the 90th percentile; who expects to obtain a BA degree; whose parents expect him/her to obtain a BA degree; and who was enrolledin algebra in the 8th grade.
Fig. 2 Effect of school AP subjects on destinations for successful students
Res High Educ
123
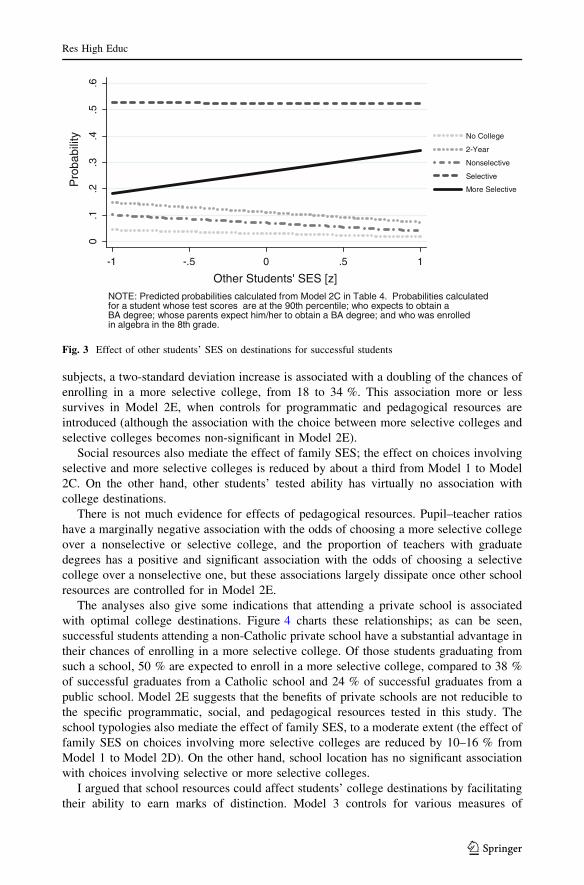
subjects, a two-standard deviation increase is associated with a doubling of the chances of
enrolling in a more selective college, from 18 to 34 %. This association more or less
survives in Model 2E, when controls for programmatic and pedagogical resources are
introduced (although the association with the choice between more selective colleges and
selective colleges becomes non-significant in Model 2E).
Social resources also mediate the effect of family SES; the effect on choices involving
selective and more selective colleges is reduced by about a third from Model 1 to Model
2C. On the other hand, other students’ tested ability has virtually no association with
college destinations.
There is not much evidence for effects of pedagogical resources. Pupil–teacher ratios
have a marginally negative association with the odds of choosing a more selective college
over a nonselective or selective college, and the proportion of teachers with graduate
degrees has a positive and significant association with the odds of choosing a selective
college over a nonselective one, but these associations largely dissipate once other school
resources are controlled for in Model 2E.
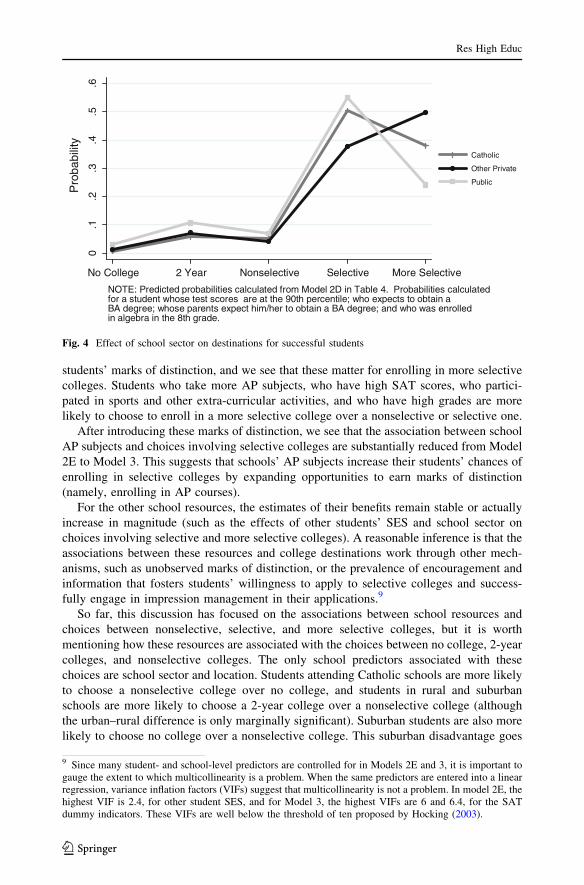
The analyses also give some indications that attending a private school is associated
with optimal college destinations. Figure 4 charts these relationships; as can be seen,
successful students attending a non-Catholic private school have a substantial advantage in
their chances of enrolling in a more selective college. Of those students graduating from
such a school, 50 % are expected to enroll in a more selective college, compared to 38 %
of successful graduates from a Catholic school and 24 % of successful graduates from a
public school. Model 2E suggests that the benefits of private schools are not reducible to
the specific programmatic, social, and pedagogical resources tested in this study. The
school typologies also mediate the effect of family SES, to a moderate extent (the effect of
family SES on choices involving more selective colleges are reduced by 10–16 % from
Model 1 to Model 2D). On the other hand, school location has no significant association
with choices involving selective or more selective colleges.
I argued that school resources could affect students’ college destinations by facilitating
their ability to earn marks of distinction. Model 3 controls for various measures of
0.1
.2.3
.4.5
.6
Pro
babi
lity
-1 -.5 0 .5 1
Other Students' SES [z]
No College
2-Year
Nonselective
Selective
More Selective
NOTE: Predicted probabilities calculated from Model 2C in Table 4. Probabilities calculatedfor a student whose test scores are at the 90th percentile; who expects to obtain a BA degree; whose parents expect him/her to obtain a BA degree; and who was enrolledin algebra in the 8th grade.
Fig. 3 Effect of other students’ SES on destinations for successful students
Res High Educ
123
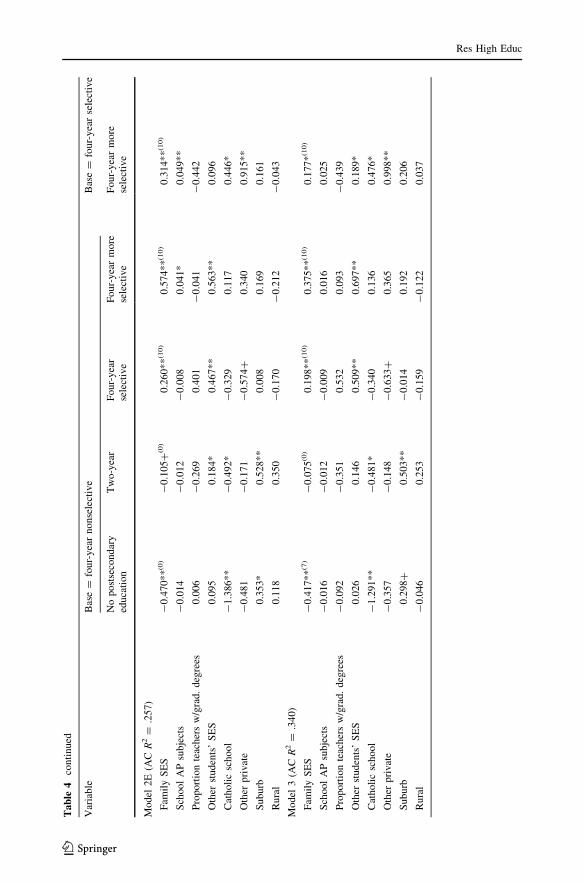
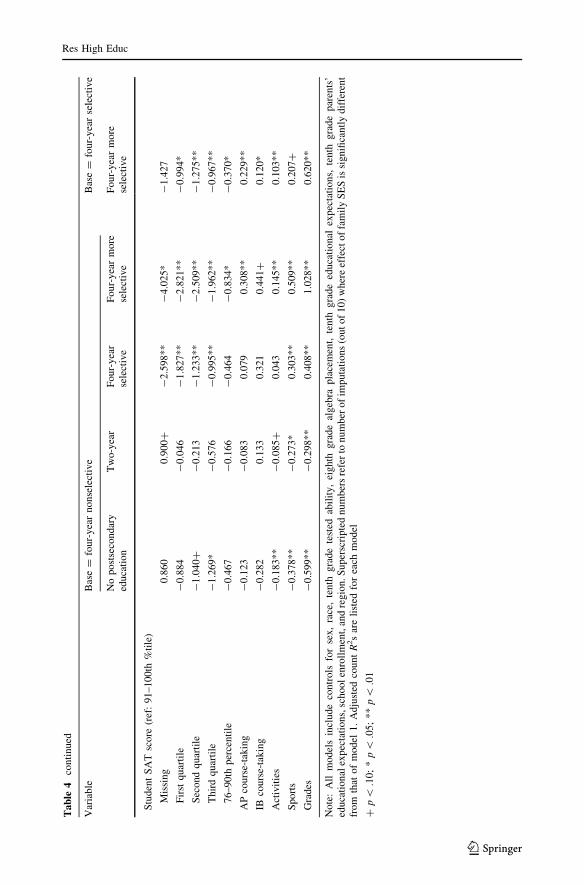
students’ marks of distinction, and we see that these matter for enrolling in more selective
colleges. Students who take more AP subjects, who have high SAT scores, who partici-
pated in sports and other extra-curricular activities, and who have high grades are more
likely to choose to enroll in a more selective college over a nonselective or selective one.
After introducing these marks of distinction, we see that the association between school
AP subjects and choices involving selective colleges are substantially reduced from Model
2E to Model 3. This suggests that schools’ AP subjects increase their students’ chances of
enrolling in selective colleges by expanding opportunities to earn marks of distinction
(namely, enrolling in AP courses).
For the other school resources, the estimates of their benefits remain stable or actually
increase in magnitude (such as the effects of other students’ SES and school sector on
choices involving selective and more selective colleges). A reasonable inference is that the
associations between these resources and college destinations work through other mech-
anisms, such as unobserved marks of distinction, or the prevalence of encouragement and
information that fosters students’ willingness to apply to selective colleges and success-
fully engage in impression management in their applications.9
So far, this discussion has focused on the associations between school resources and
choices between nonselective, selective, and more selective colleges, but it is worth
mentioning how these resources are associated with the choices between no college, 2-year
colleges, and nonselective colleges. The only school predictors associated with these
choices are school sector and location. Students attending Catholic schools are more likely
to choose a nonselective college over no college, and students in rural and suburban
schools are more likely to choose a 2-year college over a nonselective college (although
the urban–rural difference is only marginally significant). Suburban students are also more
likely to choose no college over a nonselective college. This suburban disadvantage goes
0.1
.2.3
.4.5
.6
Pro
babi
lity
No College 2 Year Nonselective Selective More Selective
Catholic
Other Private
Public
NOTE: Predicted probabilities calculated from Model 2D in Table 4. Probabilities calculatedfor a student whose test scores are at the 90th percentile; who expects to obtain a BA degree; whose parents expect him/her to obtain a BA degree; and who was enrolledin algebra in the 8th grade.
Fig. 4 Effect of school sector on destinations for successful students
9 Since many student- and school-level predictors are controlled for in Models 2E and 3, it is important togauge the extent to which multicollinearity is a problem. When the same predictors are entered into a linearregression, variance inflation factors (VIFs) suggest that multicollinearity is not a problem. In model 2E, thehighest VIF is 2.4, for other student SES, and for Model 3, the highest VIFs are 6 and 6.4, for the SATdummy indicators. These VIFs are well below the threshold of ten proposed by Hocking (2003).
Res High Educ
123
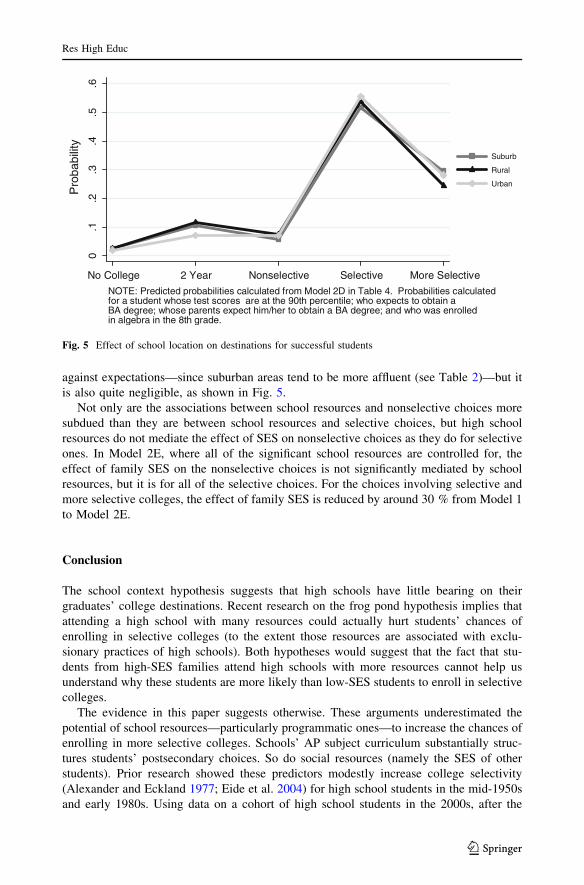
against expectations—since suburban areas tend to be more affluent (see Table 2)—but it
is also quite negligible, as shown in Fig. 5.
Not only are the associations between school resources and nonselective choices more
subdued than they are between school resources and selective choices, but high school
resources do not mediate the effect of SES on nonselective choices as they do for selective
ones. In Model 2E, where all of the significant school resources are controlled for, the
effect of family SES on the nonselective choices is not significantly mediated by school
resources, but it is for all of the selective choices. For the choices involving selective and
more selective colleges, the effect of family SES is reduced by around 30 % from Model 1
to Model 2E.
Conclusion
The school context hypothesis suggests that high schools have little bearing on their
graduates’ college destinations. Recent research on the frog pond hypothesis implies that
attending a high school with many resources could actually hurt students’ chances of
enrolling in selective colleges (to the extent those resources are associated with exclu-
sionary practices of high schools). Both hypotheses would suggest that the fact that stu-
dents from high-SES families attend high schools with more resources cannot help us
understand why these students are more likely than low-SES students to enroll in selective
colleges.
The evidence in this paper suggests otherwise. These arguments underestimated the
potential of school resources—particularly programmatic ones—to increase the chances of
enrolling in more selective colleges. Schools’ AP subject curriculum substantially struc-
tures students’ postsecondary choices. So do social resources (namely the SES of other
students). Prior research showed these predictors modestly increase college selectivity
(Alexander and Eckland 1977; Eide et al. 2004) for high school students in the mid-1950s
and early 1980s. Using data on a cohort of high school students in the 2000s, after the
0.1
.2.3
.4.5
.6
Pro
babi
lity
No College 2 Year Nonselective Selective More Selective
Suburb
Rural
Urban
NOTE: Predicted probabilities calculated from Model 2D in Table 4. Probabilities calculatedfor a student whose test scores are at the 90th percentile; who expects to obtain a BA degree; whose parents expect him/her to obtain a BA degree; and who was enrolledin algebra in the 8th grade.
Fig. 5 Effect of school location on destinations for successful students
Res High Educ
123
intensification of competition in admissions to selective colleges, I show they shape stu-
dents’ menu of postsecondary destinations.
Moreover, prior research (Espenshade et al. 2005) implies that attending high schools with
other academically successful students hurts one’s chances of admission to specific elite
colleges, but it was not clear if such frog pond effects posed substantial barriers to enrolling in
selective colleges in general. The results in this study show that they do not. To the extent that
there is a frog pond effect in being able to enroll in more selective colleges, it is canceled out
by other school resources (namely, having a large presence of high-SES peers).
I argued that high school resources can structure students’ postsecondary destinations in
several ways; one way was by facilitating their gaining marks of distinction. After con-
trolling for students’ own marks of distinction, we see that this does explain high school
resources to some extent—the association between school AP courses and selective college
choices appear to be entirely explained by students’ marks of distinction, but the other
school resources matter for other reasons. High schools serving affluent students, or private
high schools may increase students’ chances of enrolling in more selective colleges
through increasing students’ sense of their own worthiness of attending a selective college
or spreading information about how to successfully apply to these colleges. In addition,
such schools may have proactive guidance counselors who have connections with
admissions officers at selective colleges; researchers show that such guidance counselors
can influence admissions officers’ decisions (Persell and Cookson 1985; Stevens 2007).10
Contrary to the implications of previous studies, the results here show that high school
resources substantially mediate the effect of family SES on the choices between selective
colleges and nonselective colleges, between more selective colleges and nonselective
colleges, and between more selective colleges and selective colleges. School resources
mediate to a lesser extent the effect of family background on choices involving nonse-
lective options. These results suggest that high-SES families use schools with AP subjects,
schools with affluent student bodies, and private schools to help their children gain
admission to more selective colleges. Resourceful high schools are not necessary to help a
high-SES child enroll in a nonselective 4-year college.
In short, this study demonstrates that the fragmented secondary school system in the
United States is an avenue for affluent parents to seek relative advantages for their children
in terms of reportable marks of distinction (namely AP course-taking and high SAT scores)
and also in terms of social influences that lead to successful applications to selective
colleges. Inequalities between schools substantially explain inequalities in college desti-
nations based on family socioeconomic status. Affluent parents aim to get their children
into selective colleges, and in order to do so their children need marks of distinction. That
leads parents to use their resources to select high schools that provide opportunities to
cultivate such distinctiveness. One can speculate if this dynamic will expand (or has
already expanded) even further into lower levels of education.
While this study does not directly document parents’ strategizing their school choices,
the findings are in line with other accounts of affluent parents selecting their children’s
schools in order to provide them with educational advantages (Devine 2004; Holme 2002;
Johnson 2006). Admittedly, the ability to choose schools is probably limited to affluent
10 In analyses not presented here, the effects of the guidance-counselor-to-student ratio were estimated. Thisresource had no significant association with college destinations. It is entirely plausible that this non-effectowes more to the difficulty of measuring the quality of the services guidance counselors provide, as opposedto these services having no influence at all.
Res High Educ
123
parents living in urban areas; parents of limited economic means are probably more
constrained in their ability to choose schools.
One limitation of this study is that it assumes all variables influencing high school
resources and postsecondary destinations are taken into account. It is possible that this
assumption has not been met, and that the effects of high school resources are spurious. I
attempted to meet this assumption by controlling for proxies of pre-high school predis-
positions (tested ability, pre-high school algebra placement, educational expectations).
Nonetheless it is impossible to verify that all relevant predictors are observed with cer-
tainty. One possible solution is to conduct sensitivity tests gauging the strength of a
hypothetical unobserved variable that, once controlled, would render the effects of an
observed predictor insignificant, such as Frank’s (2000) impact threshold for a confounding
variable, which is only applicable to least squares regression, but no analogs have been
devised for multinomial logistic regression.
On the other hand, it is important to note that my estimates of the effects of school
resources are potentially conservative because not all relevant aspects of high schools are
measured. Prior research emphasizes the motivation and willingness of high-SES families
to obtain distinctions for their children (Lucas 2001), but an unstated corollary is that these
social processes will complicate the measurement of marks of distinction and thus prevent
a full accounting of how contexts structure opportunities for educational advancement. The
problem is that the competitiveness of the application process compels students to earn
unusual and exceptional marks of distinction; surveys such as the ones used in ELS will not
be able to capture these kinds of distinctions when they ask students about their accom-
plishments. Consequently, researchers will inevitably underestimate the importance of
unequal opportunities to earn marks of distinction in producing SES differentials in college
destinations. Despite this problem, this study has documented how opportunities for marks
of distinction vary from high school to high school, how these opportunities translate into
unequal likelihoods of enrolling in selective colleges, and furthermore how these stratified
opportunities perpetuate class differences in college choices.
The policy implications of this paper are not straight-forward. Policy-makers could
implement various interventions to smooth out school inequalities in students’ chances of
enrolling in selective colleges, such as maintaining existing efforts to expand access to the
AP curriculum (Klopfenstein and Thomas 2010). An alternative approach is suggested by
evidence that affirmative action policies in college admissions decisions promotes appli-
cations from minority students (Brown and Hirschman 2006; Long 2004). An aggressive
governmental effort to make selective colleges more affordable (either through grants to
students or through reduced tuition at selective state colleges) may have the benefit of
increasing student awareness of the feasibility of enrolling in selective colleges, which
would go some way to counteract between-school inequalities in social resources.
These efforts would probably result in improving some adolescents’ chances of
enrolling in a selective college. On the other hand, it is possible that aggressive attempts to
equalize between-school inequalities would be offset by affluent parents intensifying their
struggles within schools to obtain special advantages for their children (Oakes et al. 1997;
Wells and Serna 1996). In that case, perhaps the best way to deal with inequalities in
opportunities to enroll in selective colleges would be best addressed by modifying those
colleges’ admissions decisions. The most direct way to circumvent affluent parents from
hoarding educational opportunities would be for selective colleges to adopt explicit,
transparent standards indicating a student will be successful at their institutions. The
transparency of the standards would ideally reduce the self-selection that is responsible for
inequalities in application behaviors. Moreover, these standards should be static over time.
Res High Educ
123
When the number of applicants who meet the standards exceed the number of admissions
slots available at a particular college, the admissions office would use a lottery system to
make admissions decisions. This would, of course, be a radical departure for selective
colleges, which tend to evaluate their applicants relative to each other in ways that are not
easily quantifiable (Stevens 2007).
Since it is unlikely that selective colleges would adopt this policy, it is probable that
access to opportunities promoting access to selective colleges will be stratified, both
within- and between-schools. Identifying those disparities will be a continuing challenge
for social scientists in the future.
Acknowledgments The author appreciates the research assistance of Robert DePhillips and AubreyHilbert and the helpful comments on earlier drafts of this article from Art Alderson, Jason Beckfield, MaiaCucchiara, Judson Everitt, Kim Goyette, Erin McNamara Horvat, David James, David Kirk, Annette Lareau,Jennifer C. Lee, Tania Levey, Carolina Milesi, Josipa Roksa, Robert Toutkoushian, and Pam Walters. Thisresearch was supported by a Spencer dissertation fellowship and a dissertation grant from the AmericanEducational Research Association, the latter being funded by the National Science Foundation and theNational Center for Education Statistics under NSF grant #REC-0310268.
References
Alexander, K. L., & Eckland, B. K. (1977). High school context and college selectivity: Institutionalconstraints in educational stratification. Social Forces, 56, 166–188.
Alon, S. (2009). The evolution of class inequality in higher education: Competition, exclusion, and adap-tation. American Sociological Review, 74, 731–755.
Alon, S., & Tienda, M. (2007). Diversity, opportunity, and the shifting meritocracy in higher education.American Sociological Review, 72, 487–511.
Alwin, D. F., & Otto, L. B. (1977). High school context effects on aspirations. Sociology of Education, 50,259–273.
An, B. P. (2010). The relations between race, family characteristics, and where students apply to college.Social Science Research, 39, 310–323.
Arum, R., Roksa, J., & Budig, M. J. (2008). The romance of college attendance: Higher education strati-fication and mate selection. Research in Social Stratification and Mobility, 26, 107–121.
Attewell, P. (2001). The winner-take-all high school: Organizational adaptations to educational stratifica-tion. Sociology of Education, 74, 267–295.
Attewell, P., & Domina, T. (2008). Raising the bar: Curricular intensity and academic performance. Edu-cational Evaluation and Policy Analysis, 30, 51–71.
Bastedo, M. N., & Jaquette, O. (2011). Running in place: Low-income students and the dynamics of highereducation stratification. Educational Evaluation and Policy Analysis, 33, 318–339.
Betts, J. R. (2001). The impact of school resources on women’s earnings and educational attainment:Findings from the national longitudinal survey of young women. Journal of Labor Economics, 19,635–657.
Black, D. A., & Smith, J. A. (2004). How robust is the evidence on the effects of college quality? Evidencefrom matching. Journal of Econometrics, 121, 99–124.
Bound, J., Hershbein, B., & Long, B. T. (2009). Playing the admissions game: Student reactions toincreasing college competition. Journal of Economic Perspectives, 23, 119–146.
Bourdieu, P., & Passeron, J.-C. (1990). Reproduction in education, society, and culture. London: SAGE.Brand, J. E., & Halaby, C. N. (2006). Regression and matching estimates of the effects of elite college
attendance on educational and career achievement. Social Science Research, 35, 749–770.Brown, S. K., & Hirschman, C. (2006). The end of affirmative action in Washington State and its impact on
the transition from high school to college. Sociology of Education, 79, 106–130.Carbonaro, W., & Covay, E. (2010). School sector and student achievement in the era of standards based
reforms. Sociology of Education, 83, 160–182.Clotfelter, C. T., Ladd, H. F., & Vigdor, J. L. (2010). Teacher credentials and student achievement in high
school: A cross-subject analysis with student fixed effects. Journal of Human Resources, 45, 655–681.Coleman, J. S., & Hoffer, T. (1987). Public and private high schools: The impact of communities. New
York: Basic.
Res High Educ
123
Condron, D. J. (2009). Social class, school and non-school environments, and black/white inequalities inchildren’s learning. American Sociological Review, 74, 683–708.
Condron, D. J., & Roscigno, V. J. (2003). Disparities within: Unequal spending and achievement in an urbanschool district. Sociology of Education, 76, 18–36.
Corcoran, S., Evans, W. N., Godwin, J., Murray, S. E., & Schwab, R. M. (2004). The changing distributionof education finance: 1972–1997. In K. M. Neckerman (Ed.), Social inequality (pp. 433–465). NewYork: Russell Sage.
Cucchiara, M. B., & Horvat, E. M. (2009). Perils and promises: Middle-class parental involvement in urbanschools. American Educational Research Journal, 46, 974–1004.
Dale, S. B., & Krueger, A. B. (2002). Estimating the payoff to attending a more selective college: An appli-cation of selection on observables and unobservables. Quarterly Journal of Economics, 117, 1491–1527.
Dale, S. B., & Krueger, A. B. (2011). Estimating the return to college selectivity over the career usingadministrative earning data. Princeton University, Industrial Relations Section.
Davies, S., & Guppy, N. (1997). Fields of study, college selectivity, and student inequalities in highereducation. Social Forces, 75, 1417–1438.
Davis, J. A. (1966). The campus as a frog pond: An application to the theory of relative deprivation to careerdecisions of college men. American Journal of Sociology, 72, 17–31.
Deil-Amen, R., & LaShawn Tevis, T. (2010). Circumscribed agency: The relevance of standardized collegeentrance exams for low SES high school students. Review of Higher Education, 33, 141–175.
Demareth, P. (2009). Producing success: The culture of personal advancement in an American high school.Chicago, IL: University of Chicago Press.
Devine, F. (2004). Class practices: How parents help their children get good jobs. Cambridge, UK:Cambridge University Press.
Eide, E. R., Goldhaber, D. D., & Showalter, M. H. (2004). Does Catholic high school attendance lead toattendance at a more selective college? Social Science Quarterly, 85, 1335–1352.
Eitle, T. M. (2002). Special education or racial segregation: Understanding variation in the representation ofblack students in educable mentally handicapped programs. Sociological Quarterly, 43, 575–605.
Elliott, M. (1998). School finance and opportunities to learn: Does money well spent enhance students’achievement? Sociology of Education, 71, 223–245.
Engberg, M. E., & Wolniak, G. C. (2010). Examining the effects of high school contexts on postsecondaryenrollment. Research in Higher Education, 51, 132–153.
Entwisle, D. R., Alexander, K. L., & Olson, L. S. (2005). First grade and educational attainment by age 22:A new story. American Journal of Sociology, 110, 1458–1502.
Espenshade, T. J., & Radford, A. W. (2009). No longer separate, not yet equal: Race and class in elitecollege admission and campus life. Princeton, NJ: Princeton University Press.
Espenshade, T. J., Chung, C. Y., & Walling, J. L. (2004). Admission preferences for minority students,athletes, and legacies at elite universities. Social Science Quarterly, 85, 1422–1446.
Espenshade, T. J., Hale, L. E., & Chung, C. Y. (2005). The frog pond revisited: High school academiccontext, class rank, and elite college admission. Sociology of Education, 78, 269–293.
Frank, K. A. (2000). Impact of a confounding variable on a regression coefficient. Sociological Methods andResearch, 29, 147–194.
Geiser, S., & Santelices, V. (2006). The role of advanced placement and honors courses in collegeadmissions. In P. Gandara, G. Orfield, & C. L. Horn (Eds.), Expanding opportunity in higher edu-cation: Leveraging promise. Albany, NY: State University of New York Press.
Golden, D. (2006). The price of admission: How America’s ruling class buys its way into elite colleges–andwho gets left outside the gates. New York: Crown.
Greenwald, R., Hedges, L. V., & Laine, R. D. (1996). The effect of school resources on student achieve-ment. Review of Educational Research, 66, 361–396.
Grodsky, E. (2007). Compensatory sponsorship in higher education. American Journal of Sociology, 112,1662–1712.
Grodsky, E., & Riegle-Crumb, C. (2010). Those who choose and those who don’t: Social background andcollege orientation. ANNALS of the American Academy of Political and Social Science, 627, 14–35.
Grubb, W. N. (2009). The money myth: School resources, outcomes, and equity. New York: Russell Sage.Halpern-Manners, A., Warren, J. R., & Brand, J. E. (2009). Dynamic measures of primary and secondary
school characteristics: Implications for school effects research. Social Science Research, 38, 397–411.Harel, O. (2009). The estimation of R2 and adjusted R2 in incomplete data sets using multiple imputation.
Journal of Applied Statistics, 36, 1109–1118.Hauser, R. M., Sewell, W. H., & Alwin, D. F. (1976). High school effects on achievement. In W. H. Sewell,
R. M. Hauser, & D. L. Featherman (Eds.), Schooling and achievement in American society(pp. 309–341). New York: Academic Press.
Res High Educ
123
Hearn, J. C. (1991). Academic and nonacademic influences on the college destinations of 1980 high schoolgraduates. Sociology of Education, 64, 158–171.
Higher Education Research Institute. (2009). HERI research brief: The American freshman: National normsfor fall 2008. Los Angeles, CA: UCLA.
Hocking, R. R. (2003). Methods and applications of linear models: Regression and the analysis of variance.Hoboken, NJ: Wiley.
Hoekstra, M. (2009). The effect of attending the flagship state university on earnings: A discontinuity-basedapproach. Review of Economics and Statistics, 91, 717–724.
Holme, J. J. (2002). Buying homes, buying schools: School choice and the social construction of schoolquality. Harvard Educational Review, 72, 177–205.
Hossler, D., Schmit, J., & Vesper, N. (1999). Going to college: How social, economic, and educationalfactors influence the decisions students make. Baltimore, MD: Johns Hopkins University Press.
Hoxby, C. M. (2009). The changing selectivity of American colleges. Journal of Economic Perspectives, 23,1–25.
Jencks, C. S., Smith, M., Acland, H., Bane, M. J., Cohen, D., Gintis, H., et al. (1972). Inequality: Areassessment of the effect of family and schooling in America. New York: Basic Books.
Johnson, H. B. (2006). The American dream and the power of wealth: Choosing schools and inheritinginequality in the land of opportunity. New York: Routledge.
Johnson, I. (2008). Enrollment, persistence and graduation of in-state students at a public research uni-versity: Does high school matter? Research in Higher Education, 49, 776–793.
Karabel, J. (2005). The chosen: The hidden history of admission and exclusion at Harvard, Yale, andPrinceton. Boston: Houghton Mifflin.
Karen, D. (1991). ‘Achievement’ and ‘ascription’ in admission to an elite college: A political-organizationalanalysis. Sociological Forum, 6, 349–380.
Karen, D. (2002). Changes in access to higher education in the United States: 1980–1992. Sociology ofEducation, 75(3), 191–210.
Kaufman, J., & Gabler, J. (2004). Cultural capital and the extracurricular activities of girls and boys in thecollege attainment process. Poetics, 32, 145–168.
Kilgore, L. (2009). Merit and competition in selective college admissions. Review of Higher Education, 32,469–488.
Kim, D. H., & Schneider, B. (2005). Social capital in action: Alignment of parental support in adolescents’transition to postsecondary education. Social Forces, 84, 1181–1206.
Klopfenstein, K., & Thomas, M. K. (2010). Advanced placement participation: Evaluating the policies ofstates and colleges. In P. M. Sadler, G. Sonnert, R. H. Tai, & K. Klopfenstein (Eds.), AP: A criticalexamination of the advanced placement program (pp. 167–188). Cambridge, MA: Harvard EducationPress.
Lareau, A. (1989). Home advantage. London: Falmer.Lareau, A. (2003). Unequal childhoods: Class, race, and family life. Berkeley, CA: University of California
Press.Lee, V. E., Chow-Hoy, T. K., Burkam, D. T., Geverdt, D., & Smerdon, B. A. (1998). Sector differences in
high school course taking: A private school or Catholic school effect? Sociology of Education, 71,314–335.
Liu, X., Thomas, S., & Zhang, L. (2010). College quality, earnings, and job satisfaction: Evidence fromrecent college graduates. Journal of Labor Research, 31, 183–201.
Long, M. C. (2004). College applications and the effect of affirmative action. Journal of Econometrics, 121,319–342.
Long, M. C. (2008). College quality and early adult outcomes. Economics of Education Review, 27,588–602.
Loury, L. D., & Garman, D. (1995). College selectivity and earnings. Journal of labor Economics, 13,289–308.
Lucas, S. R. (2001). Effectively maintained inequality: Education transitions, track mobility, and socialbackground effects. American Journal of Sociology, 106, 1642–1690.
Manski, C. F., & Wise, D. A. (1983). College choice in America. Cambridge, MA: Harvard UniversityPress.
Martin, I., Karabel, J., & Jaquez, S. W. (2005). High school segregation and access to the University ofCalifornia. Educational Policy, 19, 308–330.
McDill, E. L., Rigsby, L. C., & Meyers, E. D. (1969). Educational climates of high schools: Their effectsand sources. American Journal of Sociology, 74, 567–586.
McDonough, P. M. (1997). Choosing colleges: How social class and schools structure opportunity. Albany,NY: SUNY Press.
Res High Educ
123
McDonough, P. M., & Calderone, S. (2006). The meaning of money: Perceptual differences between collegecounselors and low-income families about college costs and financial aid. American Behavioral Sci-entist, 49, 1703–1718.
McDonough, P. M., Antonio, A. L., Walpole, M. B., & Perez, L. X. (1998). College rankings: Democratizedknowledge for whom? Research in Higher Education, 39, 513–537.
Meyer, J. W. (1970). High school effects on college intentions. American Journal of Sociology, 76, 59–70.Moller, S., Stearns, E., Potochnick, S. R., & Southworth, S. (2011). Student achievement and college
selectivity: How changes in achievement during high school affect the selectivity of college attended.Youth and Society, 43, 656–680.
Mullen, A. L. (2009). Elite destinations: Pathways to attending an Ivy League university. British Journal ofSociology of Education, 30, 15–27.
Mullen, A. L. (2010). Degrees of inequality: Culture, class, and gender in American higher education.Baltimore, MD: Johns Hopkins University Press.
Niu, S. X., & Tienda, M. (2008). Choosing colleges: Identifying and modeling choice sets. Social ScienceResearch, 37, 416–433.
Niu, S. X., Tienda, M., & Cortes, K. (2006). College selectivity and the Texas top 10% law. Economics ofEducation Review, 25, 259–272.
Oakes, J., Wells, A. S., Jones, M., & Datnow, A. (1997). Detracking: The social construction of ability,cultural politics, and resistance to reform. Teachers College Record, 98, 482–510.
Owens, A. (2010). Neighborhoods and schools as competing and reinforcing contexts for educationalattainment. Sociology of Education, 83, 287–311.
Perna, L. W., Rowan-Kenyon, H. T., & Thomas, S. L. (2008). The role of college counseling in shapingcollege opportunity: Variations across high schools. Review of Higher Education, 31, 131–159.
Persell, C. H., & Cookson, P. W., Jr. (1985). Chartering and bartering: Elite education and social repro-duction. Social Problems, 33, 114–129.
Persell, C. H., Catsambis, S., & Cookson, P. W. (1992). Differential asset conversion: Class and genderedpathways to selective colleges. Sociology of Education, 65, 208–225.
Peterson, P. (1981). City limits. Chicago: University of Chicago Press.Riegle-Crumb, C. (2010). More girls go to college: Exploring the social and academic factors behind the
female postsecondary advantage among Hispanic and White students. Research in Higher Education,51, 573–593.
Rivera, L. A. (2011). Ivies, extracurriculars, and exclusion: Elite employers’ use of educational credentials.Research in Social Stratification and Mobility, 29, 71–90.
Roderick, M., Nagaoka, J., Coca, V., & Moeller, E. (2008). From high school to the future: Potholes on theroad to college. Chicago, IL: Consortium on Chicago School Research.
Roscigno, V. J., Tomaskovic-Devey, D., & Crowley, M. (2006). Education and the inequalities of place.Social Forces, 84, 2121–2145.
Rosenbaum, J. E. (1980). Track misperceptions and frustrated college plans: An analysis of the effects oftracks and track perceptions in the national longitudinal survey. Sociology of Education, 53, 74–88.
Rosenbaum, J. E. (1998). College-for-all: Do students understand what college demands?’’. Social Psy-chology of Education, 2, 55–80.
Royston, P., Carlin, J. B., & White, I. R. (2009). Multiple imputation of missing values: New features formim. Stata Journal, 9, 252–264.
Rumberger, R. W., & Palardy, G. J. (2005). Does segregation still matter? The impact of student compo-sition on academic achievement in high school. Teachers College Record, 107, 1999–2045.
Schneider, B. (2003). Strategies for success: High school and beyond. Brookings Papers on EducationPolicy, 55–85.
Schneider, B., Swanson, C. B., & Riegle-Crumb, C. (1998). Opportunities for learning: Course sequencesand positional advantages. Social Psychology of Education, 2, 25–53.
Stearns, E., Potochnick, S., Moller, S., & Southworth, S. (2010). High school course-taking and postsec-ondary institutional selectivity. Research in Higher Education, 51, 366–395.
Stevens, M. L. (2007). Creating a class: College admissions and the education of elites. Cambridge, MA:Harvard University Press.
Stevens, M. L., Armstrong, E. A., & Arum, R. (2008). Sieve, incubator, temple, hub: Empirical andtheoretical advances in the sociology of higher education. Annual Review of Sociology, 34, 127–151.
Strayer, W. (2002). The returns to school quality: College choice and earnings. Journal of Labor Economics,20, 475–503.
Turley, R. N., Lopez, M. S., & Ceja, C. (2007). Social origin and college opportunity expectations acrosscohorts. Social Science Research, 36, 1200–1218.
Res High Educ
123
Wells, A. S., & Serna, I. (1996). The politics of culture: Understanding local political resistance to de-tracking in racially mixed schools. Harvard Educational Review, 66, 93–118.
Wenglinsky, H. (1997). How money matters: The effect of school district spending on academic achieve-ment. Sociology of Education, 70, 221–237.
Wildhagen, T. (2009). Why does cultural capital matter for high school academic performance? Anempirical assessment of teacher-selection and self-selection mechanisms as explanations of the culturalcapital effect. Sociological Quarterly, 50, 173–200.
Wolniak, G. C., & Engberg, M. E. (2010). Academic achievement in the first year of college: Evidence ofthe pervasive effects of the high school context. Research in Higher Education, 51, 451–467.
Zhang, L. (2008). The way to wealth and the way to leisure: The impact of college education on graduates’earnings and hours of work. Research in Higher Education, 49, 199–213.
Res High Educ
123