Embed Size (px)
Citation preview
NECO_a_00006-Arleo neco.cls April 26, 2010 22:18
Unc
orre
cted
Proo
f
LETTER Communicated by Angus Silver
How Synaptic Release Probability Shapes NeuronalTransmission: Information-Theoretic Analysisin a Cerebellar Granule Cell
Angelo [email protected], UPMC, UMR 7102 Neurobiology of Adaptive Processes, F-75005,Paris, France, and Neuroscience Group, SONY Computer Science Laboratory,75005, Paris, France
Thierry [email protected] and Brain Technologies, Italian Institute of Technology, 16163 Genova,Italy, and Department of Physiology, University of Pavia, and IRCCS C. Mondino,Pavia 27100, Italy
Michele [email protected] Group, SONY Computer Science Laboratory, 75005, Paris, France
Anna D’[email protected] of Physiology, University of Pavia, and IRCCS C. Mondino,27100, Pavia, Italy
Egidio D’[email protected] of Physiology, University of Pavia, and IRCCS C. Mondino,27100, Pavia, Italy
Olivier J.-M. D. [email protected] Group, SONY Computer Science Laboratory, 75005, Paris, France
Note: A. A., T. N., and M. B. contributed equally to this work. M Bezzi is now at SAPResearch Center, Aophia-Antipolis, France. A. D’Errico is now at Sector of Neurobiology,International School for Advanced Studies, Trieste, Italy. O. Coenon is now at Com-putational Neuroscience Research Team, Intelligent Systems Research Center, School ofComputing and Intelligent System, University of Ulster, Londonderry, BT48 7JL, NorthernIreland.
Neural Computation 22, 1–28 (2010) c! Massachusetts Institute of Technology

NECO_a_00006-Arleo neco.cls April 26, 2010 22:18
Unc
orre
cted
Proo
f
2 A. Arleo et al.
A nerve cell receives multiple inputs from upstream neurons by way of itssynapses. Neuron processing functions are thus influenced by changes inthe biophysical properties of the synapse, such as long-term potentiation(LTP) or depression (LTD). This observation has opened new perspec-tives on the biophysical basis of learning and memory, but its quan-titative impact on the information transmission of a neuron remainspartially elucidated. One major obstacle is the high dimensionality ofthe neuronal input-output space, which makes it unfeasible to perform athorough computational analysis of a neuron with multiple synaptic in-puts. In this work, information theory was employed to characterize theinformation transmission of a cerebellar granule cell over a region of itsexcitatory input space following synaptic changes. Granule cells have asmall dendritic tree (on average, they receive only four mossy fiber affer-ents), which greatly bounds the input combinatorial space, reducing thecomplexity of information-theoretic calculations. Numerical simulationsand LTP experiments quantified how changes in neurotransmitter releaseprobability (p)-modulated information transmission of a cerebellar gran-ule cell. Numerical simulations showed that p shaped the neurotransmis-sion landscape in unexpected ways. As p increased, the optimality of theinformation transmission of most stimuli did not increase strictly mono-tonically; instead it reached a plateau at intermediate p levels. Further-more, our results showed that the spatiotemporal characteristics of theinputs determine the effect of p on neurotransmission, thus permittingthe selection of distinctive preferred stimuli for different p values. Theseselective mechanisms may have important consequences on the encod-ing of cerebellar mossy fiber inputs and the plasticity and computa-tion at the next circuit stage, including the parallel fiber–Purkinje cellsynapses.
1 Introduction
Theoretically, neurons can be considered as transmitting devices encodinginformation in terms of digital spike trains. Spikes are transmitted betweenneurons at the synapses, where they are converted into analog signals byelaborate nonlinear transformations based on the time-dependent proper-ties of neurotransmitter release and diffusion, postsynaptic receptor activa-tion, and intrinsic electroresponsiveness. Synapses undergo plasticity viaactivity-dependent modifications, such as long-term potentiation (LTP) anddepression (LTD) (Bliss & Collingridge, 1993; Bliss & Lomo, 1973; Malenka& Bear, 2004). These modifications affect the synaptic dynamics (e.g., byregulating the number of neurotransmitter quanta released or the phos-phorylation of postsynaptic receptors), and ultimately they alter the com-putational and transmitting properties of the whole postsynaptic neuron(Abbott & Regehr, 2004; Tsodyks & Markram, 1997).
NECO_a_00006-Arleo neco.cls April 26, 2010 22:18
Unc
orre
cted
Proo
f
How Synaptic Release Probability Shapes Neuronal Transmission 3
Neuronal computation can be analyzed in terms of information contentby quantifying how much information the neural responses convey aboutthe input stimuli (Bialek, Rieke, de Ruyter van Steveninck, & Warland, 1991;Borst & Theunissen, 1999; Fuhrmann, Segev, Markram, & Tsodyks, 2002;Quian Quiroga & Panzeri, 2009). In this framework, neurons are treatedas stochastic communication channels, and information theory (Cover &Thomas, 1991; Shannon, 1948) provides the mathematical tools to mea-sure their transmitting properties. Information theory has been used toanalyze neuronal computation and quantify the information transmittedby a neuron following sensory stimulation (e.g., in the cat visual cortex:Sharpee et al., 2006; in the fly visual system: Brenner, Bialek, & de Ruytervan Steveninck, 2000; Brenner, Strong, Koberle, Bialek, & de Ruyter vanSteveninck, 2000; de Ruyter van Steveninck, Lewen, Strong, Koberle, &Bialek, 1997; in the mammalian auditory system: Lu & Wang, 2004; Smith& Lewicki, 2006; in the cricket cercal sensory system: Dimitrov, Miller,Gedeon, Aldworth, & Parker, 2003; Roddey & Jacobs, 1996; Theunissen,Roddey, Stufflebeam, Clague, & Miller, 1996; Theunissen & Miller, 1991; inthe rat somatosensory system: Wan et al., 2004). It has also been used tocharacterize the relevant regions of a neuron tuning curve in relation to thevariability in its sensory encoding properties (Butts & Goldman, 2006) orto characterize the adaptation in receptive fields to visual stimuli (Sharpeeet al., 2006). Information theory has been found useful to measure the effi-ciency of information transmission at a single synapse (de la Rocha, Nevado,& Parga, 2002; Fuhrmann et al., 2002; Goldman, 2004; London, Schreib-man, Hausser, Larkum, & Segev, 2002; Manwani, Steinmetz, & Koch, 2002;Tiesinga, 2001), as well as to characterize the information transmission insimplified integrate-and-fire neurons (Manwani et al., 2002; Zador, 1998),or in more complex models, but under specific constraints, for example,in the absence of interaction among presynaptic inputs (Manwani & Koch,2001) or between inhibitory inputs and phase lags (Tiesinga, Fellous, Jose,& Sejnowski, 2002). In the current work, an information-theoretic approachwas used to characterize the processing of a neuron over a region of itsexcitatory input space and investigate how neuronal processing changesfollowing synaptic plasticity.
The mean information transmitted between the neuron responses r andits inputs s can be quantified by using Shannon’s mutual information (MI)(Cover & Thomas, 1991; Rolls & Deco, 2002; Shannon, 1948):
MI (R, S) =!
s"S
!
r"R
p(s)p(r | s) log2p(rs)p(r )
, (1.1)
where S and R are the input and output spaces, respectively; p(s) andp(r ) are the a priori probability distributions; and p(r | s) is the conditionalprobability distribution.
NECO_a_00006-Arleo neco.cls April 26, 2010 22:18
Unc
orre
cted
Proo
f
4 A. Arleo et al.
5 µm
mossy fiber inputs
granulecell
0011
1110
1001
0001
time (ms)
00100000100001000001
0 120
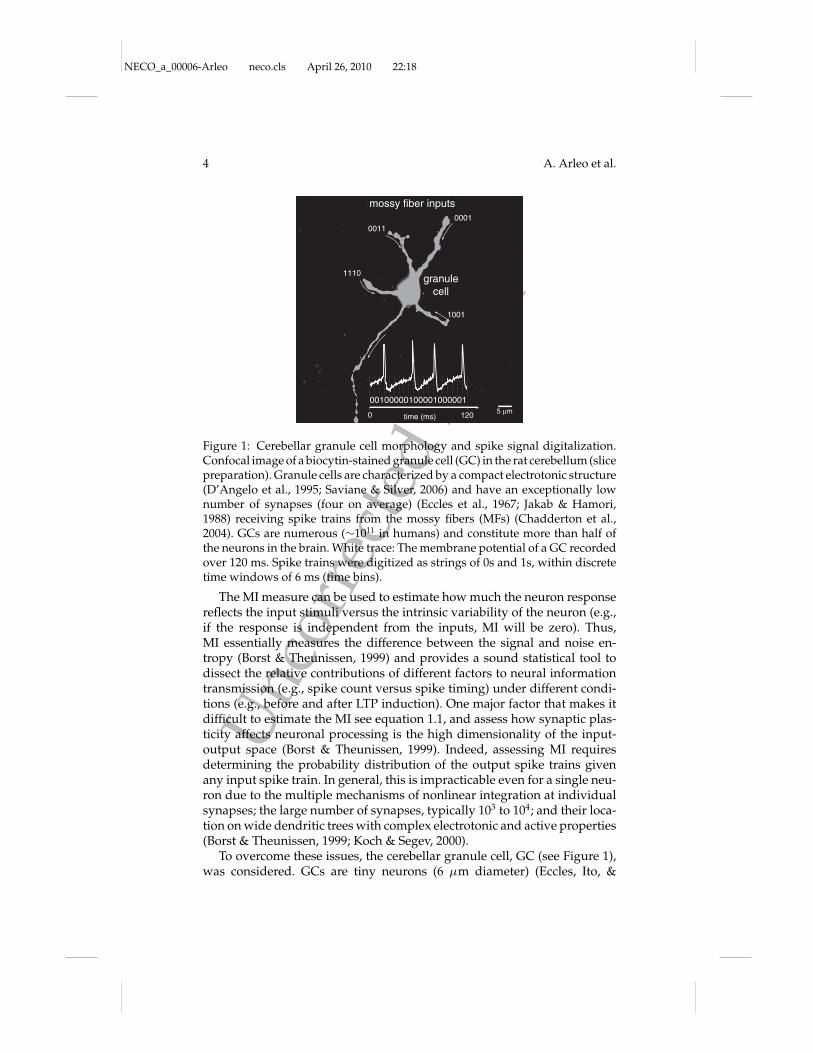
Figure 1: Cerebellar granule cell morphology and spike signal digitalization.Confocal image of a biocytin-stained granule cell (GC) in the rat cerebellum (slicepreparation). Granule cells are characterized by a compact electrotonic structure(D’Angelo et al., 1995; Saviane & Silver, 2006) and have an exceptionally lownumber of synapses (four on average) (Eccles et al., 1967; Jakab & Hamori,1988) receiving spike trains from the mossy fibers (MFs) (Chadderton et al.,2004). GCs are numerous (#1011 in humans) and constitute more than half ofthe neurons in the brain. White trace: The membrane potential of a GC recordedover 120 ms. Spike trains were digitized as strings of 0s and 1s, within discretetime windows of 6 ms (time bins).
The MI measure can be used to estimate how much the neuron responsereflects the input stimuli versus the intrinsic variability of the neuron (e.g.,if the response is independent from the inputs, MI will be zero). Thus,MI essentially measures the difference between the signal and noise en-tropy (Borst & Theunissen, 1999) and provides a sound statistical tool todissect the relative contributions of different factors to neural informationtransmission (e.g., spike count versus spike timing) under different condi-tions (e.g., before and after LTP induction). One major factor that makes itdifficult to estimate the MI see equation 1.1, and assess how synaptic plas-ticity affects neuronal processing is the high dimensionality of the input-output space (Borst & Theunissen, 1999). Indeed, assessing MI requiresdetermining the probability distribution of the output spike trains givenany input spike train. In general, this is impracticable even for a single neu-ron due to the multiple mechanisms of nonlinear integration at individualsynapses; the large number of synapses, typically 103 to 104; and their loca-tion on wide dendritic trees with complex electrotonic and active properties(Borst & Theunissen, 1999; Koch & Segev, 2000).
To overcome these issues, the cerebellar granule cell, GC (see Figure 1),was considered. GCs are tiny neurons (6 µm diameter) (Eccles, Ito, &
NECO_a_00006-Arleo neco.cls April 26, 2010 22:18
Unc
orre
cted
Proo
f
How Synaptic Release Probability Shapes Neuronal Transmission 5
Szentagothai, 1967; Jakab & Hamori, 1988) located at the major input stageof the cerebellum, the granular layer. GCs play a major role in the earlystages of cerebellar computation, and their synapses have been proposedto regulate the input-output relationship through gain modulation (Albus,1971; Mitchell & Silver, 2003; Rothman, Cathala, Steuber, & Silver, 2009) andlong-term adaptation (Hansel, Linden, & D’Angelo, 2001; Philipona &Coenen, 2004; Schweighofer, Doya, & Lay, 2001).
GCs have several remarkable properties. First, they have a compact elec-trotonic structure (D’Angelo, De Filippi, Rossi, & Taglietti, 1995; Saviane &Silver, 2006; Silver, Traynelis, & Cull-Candy, 1992), which maintains theirwhole cell membrane equipotential, eliminating spatial effects on compu-tation (Koch & Segev, 2000). Second, they have a low number of mossy fiber(MF) afferents (4.17 on average) (Eccles et al., 1967; Jakab & Hamori, 1988),which generates a tractable number of presynaptic input combinations andgreatly reduces the complexity of information-theoretic calculations. Third,they have a stereotyped synaptic and excitable behavior, which simplifiesthe implementation of models (D’Angelo et al., 1995). Fourth, MFs havebeen shown to respond with high-frequency bursts to punctuate stimu-lation (Arenz, Silver, Schaefer, & Margrie, 2008; Chadderton, Margrie, &Hausser, 2004; Jorntell & Ekerot, 2006; Rancz et al., 2007), which have beencarefully characterized. Fifth, both GC output bursts and plasticity at MF-GC synapses are controlled by input patterns and Golgi cell inhibition(Mapelli & D’Angelo, 2007). The dynamics of repetitive stimulation havebeen clarified to a considerable extent (Nieus et al., 2006; Saviane & Sil-ver, 2006; Sola, Prestori, Rossi, Taglietti, & D’Angelo, 2004). Finally, MF-GCsynaptic transmission is based on nonlinear transformations determinedby presynaptic short-term facilitation and depression, glutamate spillover,postsynaptic AMPA and NMDA receptor gating, and multiple voltage-dependent channel interactions regulating intrinsic electroresponsiveness(D’Angelo et al., 1995; Nielsen, DiGregorio, & Silver, 2004; Nieus, DiGre-gorio, & Silver, 2006; Sargent, Saviane, Nielsen, DiGregorio, & Silver, 2005;Sola et al., 2004). The mechanisms of synaptic transmission and plasticity atthe MF-GC synapses have been intensely investigated, revealing that LTPis largely determined by a raise in the presynaptic neurotransmitter releaseprobability (p) (D’Angelo et al., 2001; Nieus et al., 2006; Saviane & Silver,2006; Sola et al., 2004).
The study presented here focused on the effects of release probability(p) changes at MF-GC synapses on the overall GC information transmis-sion properties. The same information-theoretic quantification was appliedto analyze data from numerical simulations of biophysical synaptic andGC models, as well as data issued from in vitro intracellular GC record-ings. At a first level, the mutual information MI between MF inputs andGC responses was measured as a function of release probability, p. Expect-edly, MI increased significantly with p, as MI is a measure of the informationtransmission averaged over the entire input set considered for examination.

NECO_a_00006-Arleo neco.cls April 26, 2010 22:18
Unc
orre
cted
Proo
f
6 A. Arleo et al.
A second level of analysis assessed the contribution of specific stimuli toinformation transmission. For this purpose, the stimulus-specific surprisemeasure (Butts & Goldman, 2006; DeWeese & Meister, 1999; Theunissen &Miller, 1991) was used to quantify the optimality of single stimulus trans-mission (see section 4). This analysis investigated which stimulus patternswere “preferred” by the neuron under different release probability condi-tions, and it demonstrated that maximum synaptic release probability didnot constitute a necessary condition in order to achieve optimal transmis-sion. Rather, for a significant set of stimuli, the surprise values saturatedat intermediate p values (consistent with those found in brain recordingsat MF-GC synapses: Sola et al., 2004; at CA3-CA1 hippocampal synapses:Dobrunz & Stevens, 1997; and at neocortical pyramid-to-pyramid connec-tions: Koester & Johnston, 2005) with optimal information transmissionoccurring over a large range of release probabilities (from about 0.4 to themaximum value tested, i.e., 0.8). Finally, a third level of analysis concen-trated on the spatiotemporal characteristics of the stimuli and quantified,for different p values, the spike timing contribution to information trans-mission by means of the surprise-per-spike measure (see section 4). Thesurprise per spike was typically higher for either long-correlated stimuli atlow p or short-correlated stimuli at high p.
The work presented in this letter provides a set of tools to investigateneuronal coding and information transfer in the cerebellar granular layernetwork, which enables a quantitative exploration of the relative impor-tance of the coding strategies for different input patterns and synapticparameters.
2 Results
A first fundamental question is how the transmitting properties of a GCvary under different release probability conditions (e.g., LTP). To this aim,the average amount of information transmitted by the cell (i.e., the MI) wasmeasured (see section 2.1) computationally with a GC model and experi-mentally. Experimental results were obtained with a limited set of stimuli;the numerical simulations were used for corroborating the experimentalfindings and extending them to a larger region of the input space. The ques-tion of how changes in release probability shape the neurotransmission ofspecific MF inputs is addressed in section 2.2 using the stimulus-specificsurprise. Finally, section 2.3 investigates how correlations across input spiketrains affect single-stimulus transmission and assesses the informative con-tribution of single pulses in the presence of distinct spatiotemporal stimulusstructures and multiple presynaptic release probabilities.
2.1 Impact of Neurotransmitter Release Probability Changes onInformation Transmission. The average information transmitted by a sin-gle GC was quantified before and after induction of long-term synaptic
NECO_a_00006-Arleo neco.cls April 26, 2010 22:18
Unc
orre
cted
Proo
f
How Synaptic Release Probability Shapes Neuronal Transmission 7
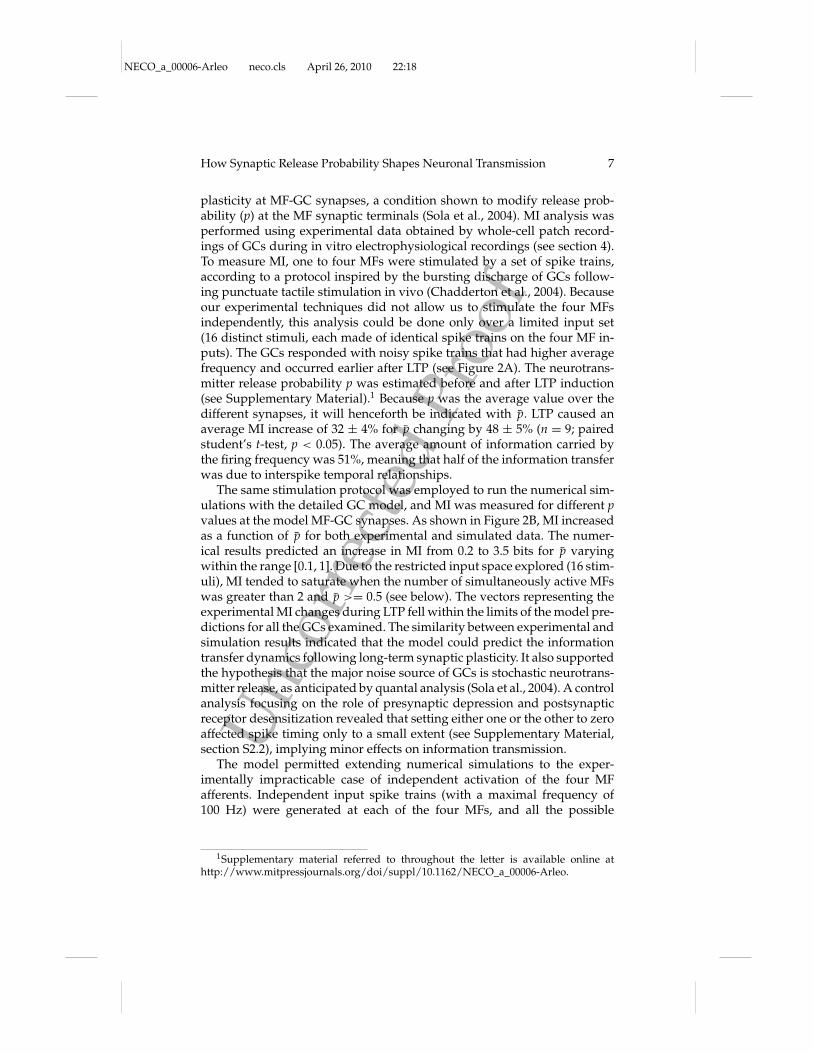
plasticity at MF-GC synapses, a condition shown to modify release prob-ability (p) at the MF synaptic terminals (Sola et al., 2004). MI analysis wasperformed using experimental data obtained by whole-cell patch record-ings of GCs during in vitro electrophysiological recordings (see section 4).To measure MI, one to four MFs were stimulated by a set of spike trains,according to a protocol inspired by the bursting discharge of GCs follow-ing punctuate tactile stimulation in vivo (Chadderton et al., 2004). Becauseour experimental techniques did not allow us to stimulate the four MFsindependently, this analysis could be done only over a limited input set(16 distinct stimuli, each made of identical spike trains on the four MF in-puts). The GCs responded with noisy spike trains that had higher averagefrequency and occurred earlier after LTP (see Figure 2A). The neurotrans-mitter release probability p was estimated before and after LTP induction(see Supplementary Material).1 Because p was the average value over thedifferent synapses, it will henceforth be indicated with p. LTP caused anaverage MI increase of 32 ± 4% for p changing by 48 ± 5% (n = 9; pairedstudent’s t-test, p < 0.05). The average amount of information carried bythe firing frequency was 51%, meaning that half of the information transferwas due to interspike temporal relationships.
The same stimulation protocol was employed to run the numerical sim-ulations with the detailed GC model, and MI was measured for different pvalues at the model MF-GC synapses. As shown in Figure 2B, MI increasedas a function of p for both experimental and simulated data. The numer-ical results predicted an increase in MI from 0.2 to 3.5 bits for p varyingwithin the range [0.1, 1]. Due to the restricted input space explored (16 stim-uli), MI tended to saturate when the number of simultaneously active MFswas greater than 2 and p >= 0.5 (see below). The vectors representing theexperimental MI changes during LTP fell within the limits of the model pre-dictions for all the GCs examined. The similarity between experimental andsimulation results indicated that the model could predict the informationtransfer dynamics following long-term synaptic plasticity. It also supportedthe hypothesis that the major noise source of GCs is stochastic neurotrans-mitter release, as anticipated by quantal analysis (Sola et al., 2004). A controlanalysis focusing on the role of presynaptic depression and postsynapticreceptor desensitization revealed that setting either one or the other to zeroaffected spike timing only to a small extent (see Supplementary Material,section S2.2), implying minor effects on information transmission.
The model permitted extending numerical simulations to the exper-imentally impracticable case of independent activation of the four MFafferents. Independent input spike trains (with a maximal frequency of100 Hz) were generated at each of the four MFs, and all the possible
1Supplementary material referred to throughout the letter is available online athttp://www.mitpressjournals.org/doi/suppl/10.1162/NECO_a_00006-Arleo.

NECO_a_00006-Arleo neco.cls April 26, 2010 22:18
Unc
orre
cted
Proo
f
8 A. Arleo et al.
A B
Mut
ual I
nfor
mat
ion
(bits
)
0.5
0
1
1.5
2
Mean probability of release (p)0.1 0.2 0.3 0.4 0.5 0.6 0.7 0.8 0.9 1
2.5
3.5
3
0 10
Time (ms)20 30 40 50 60
0 10
Time (ms)20 30 40 50 60
Ctrl
LTP
stimulus
10 (ms)
20 (
mV
)
Figure 2: Increases in neurotransmitter release probability enhance mutual in-formation in cerebellar granule cells— experiments and simulations with arestricted mossy fiber input set. (A) A GC was maintained at a membranepotential between $60 mV and $70 mV, and it was activated through MF stim-ulations at the times indicated by the arrows. This protocol was repeated 25times. The responses were recorded before and after delivering a theta-burststimulation (TBS) (Nieus et al., 2006) (five selected voltage traces are shownsuperposed). In this cell, release probability was p = 0.4 before and p = 0.65after LTP induction (see Supplementary Material for the p estimation process).Effective long-term potentiation (LTP) induction is demonstrated by earlier andmore intense spike activation (Nieus et al., 2006). (B) Mutual information (MI)changed significantly as a function of neurotransmitter release probability, p.The shaded regions show the MI values obtained with the GC model, whereasthe vectors indicate the experimental changes in MI before and after inductionof long-term synaptic plasticity in 10 GCs. The four regions (from bottom totop) correspond to different numbers of active MFs (one to four). The lower andupper borders of each computed region were obtained by setting the restingpotential of the GC model at $70 and $60 mV, the two experimental extremes,respectively. LTP, associated with a p increase, was observed in nine cases, whilein one case with very high initial p, LTD (long-term depression) was observedassociated with a p decrease. Note that a 60 ms time window was used to sampleboth experimental and simulated GC responses.
input combinations were explored (yielding an extensive set of 65536stimuli; see section 4). Neurotransmitter release probability p was alsoregulated independently at each MF-GC synapse (from p = 0.1 to 0.8,in steps of 0.1). Consequently the information transmission analysiswas performed for many different p combinations across the four MFs(e.g., pMF1 = 0.2, pMF2 = 0.8, pMF3 = 0.3, pMF4 = 0.4). Figure 3A displays a

NECO_a_00006-Arleo neco.cls April 26, 2010 22:18
Unc
orre
cted
Proo
f
How Synaptic Release Probability Shapes Neuronal Transmission 9
A
Mean probability of release (p)
Mut
ual I
nfor
mat
ion
(bits
)
0.1 0.2 0.3 0.4 0.5 0.6 0.7 0.8
0.5
0
1
1.5
2
0 10
Time (ms)20 30 40 50 60
0 10
Time (ms)20 30 40 50 60
B
Ctrl
LTP
stimulus
10 (ms)
20 (
mV
)
Figure 3: Increases in neurotransmitter release probability enhance mutual in-formation in cerebellar granule cells: simulation results with an extended mossyfiber input set. (A) Responses of the model GC increased their time locking tothe start of the input stimulation after a large increase in release probability p(five sample traces are shown superposed). (B) MI calculated by stimulatingthe MF-GC synapses with the extended input set (k = 216 = 65536 stimuli) andby varying the release probability p on the four MFs independently, within therange [0.1, 0.8] (Sola et al., 2004). Each data point indicates the MI value cor-responding to a different combination of p across the four MFs, and the x-axisprovides the p averaged over the four MFs (therefore different MI values cancoexist for any value of p). The larger p is, the larger is MI. Note that MI shows asmooth increase rather independent from the specific p combination used overthe different synapses.
sample response of the model GC to the same stimulus before and aftersimulated LTP (i.e., for two different p combinations, with p = %pMFi &i=1,4).Figure 3B shows that the MI computed over the extended stimulus set in-creased as a function of p without saturating (in contrast to the limited setcase of Figure 2B), suggesting that the information transmission averagedover a large set of MF stimuli may benefit linearly from increasing p values.
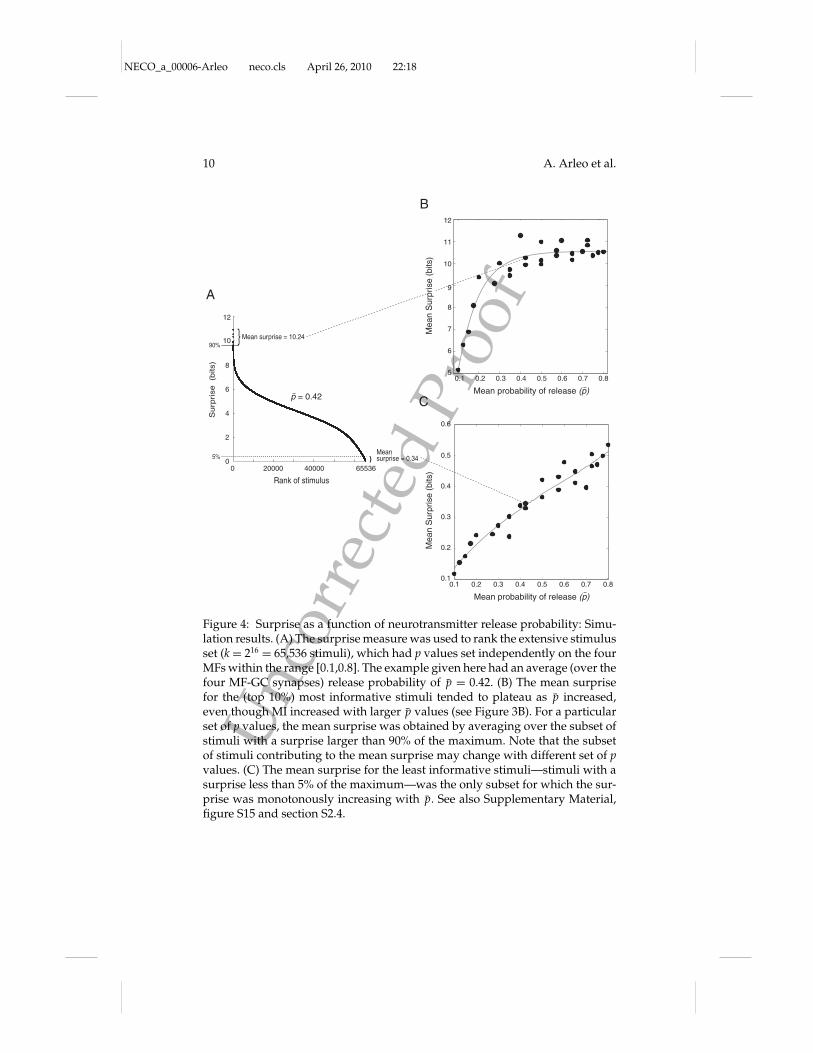
2.2 Impact of Release Probability Changes on Single Stimulus Trans-mission. The surprise measure (see section 4) was used to study the in-fluence of release probability changes on the transmission of specific MFinputs. For each p value, all stimuli were ranked according to their surprisevalue (e.g., in Figure 4A for p = 0.42), and then different subsets of stimuliwere considered. In the subset of stimuli with surprise larger than 90% ofthe maximum (see Figure 4B), after an initial rapid growth for 0.1 ' p ' 0.5,
NECO_a_00006-Arleo neco.cls April 26, 2010 22:18
Unc
orre
cted
Proo
f
10 A. Arleo et al.
B
Mean probability of release (p)0.1 0.2 0.3 0.4 0.5 0.6 0.7 0.8
6
5
7
8
9
10
11
12
Mean probability of release (p)0.1 0.2 0.3 0.4 0.5 0.6 0.7 0.8
0.1
0.2
0.3
0.4
0.5
0.6
A
C
90%
5%
Mean surprise = 10.24
surprise = 0.34
}
}
Rank of stimulus
Su
rpri
se
(bits
)
0 200000
2
4
6
8
10
12
40000 65536
p = 0.42
Mea
n S
urpr
ise
(bits
)M
ean
Sur
pris
e (b
its)
Mean
Figure 4: Surprise as a function of neurotransmitter release probability: Simu-lation results. (A) The surprise measure was used to rank the extensive stimulusset (k = 216 = 65,536 stimuli), which had p values set independently on the fourMFs within the range [0.1,0.8]. The example given here had an average (over thefour MF-GC synapses) release probability of p = 0.42. (B) The mean surprisefor the (top 10%) most informative stimuli tended to plateau as p increased,even though MI increased with larger p values (see Figure 3B). For a particularset of p values, the mean surprise was obtained by averaging over the subset ofstimuli with a surprise larger than 90% of the maximum. Note that the subsetof stimuli contributing to the mean surprise may change with different set of pvalues. (C) The mean surprise for the least informative stimuli—stimuli with asurprise less than 5% of the maximum—was the only subset for which the sur-prise was monotonously increasing with p. See also Supplementary Material,figure S15 and section S2.4.
NECO_a_00006-Arleo neco.cls April 26, 2010 22:18
Unc
orre
cted
Proo
f
How Synaptic Release Probability Shapes Neuronal Transmission 11
the average surprise tended to plateau around 10.5 bits. This saturationeffect was observed for most of the stimuli (see Supplementary Material,Figure S15 and section S2.4). Only the surprise averaged over the subsetof stimuli having a surprise smaller than 5% of the maximum showed aquasi-linear increase with p (see Figure 4C), suggesting that only thesestimuli continued to benefit from increasing p values. Although on aver-age the information transmitted by the GC increased monotonically with p(see Figure 3B), optimal single-stimulus transmission had already occurredat intermediate release probability values for most MF inputs, and furtherincreases in p did not result in larger surprise values.
This finding suggests that transmission of specific inputs was differ-entially affected by changes in presynaptic release probability. To begincharacterizing the properties of stimuli with optimal transmission at dif-ferent p, simple features such as low versus high firing rate were firstconsidered. Low-rate stimuli tended to benefit the most from p increases(see Figure S16). The hypothesis that high-frequency stimuli (as opposed tolow-rate stimuli) had less to gain from an increasing release probability pwas confirmed by quantitative analysis (see Figure S17). But how does thespatiotemporal structure of MF inputs affect neurotransmission in GCs?
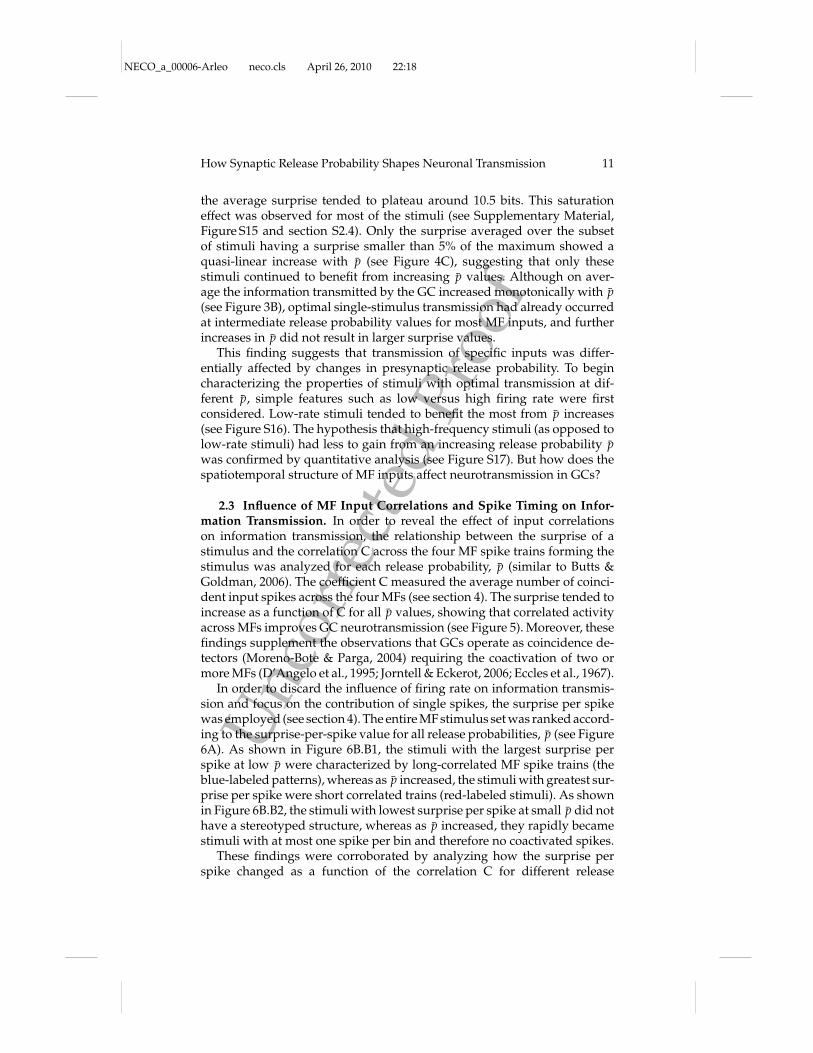
2.3 Influence of MF Input Correlations and Spike Timing on Infor-mation Transmission. In order to reveal the effect of input correlationson information transmission, the relationship between the surprise of astimulus and the correlation C across the four MF spike trains forming thestimulus was analyzed for each release probability, p (similar to Butts &Goldman, 2006). The coefficient C measured the average number of coinci-dent input spikes across the four MFs (see section 4). The surprise tended toincrease as a function of C for all p values, showing that correlated activityacross MFs improves GC neurotransmission (see Figure 5). Moreover, thesefindings supplement the observations that GCs operate as coincidence de-tectors (Moreno-Bote & Parga, 2004) requiring the coactivation of two ormore MFs (D’Angelo et al., 1995; Jorntell & Eckerot, 2006; Eccles et al., 1967).
In order to discard the influence of firing rate on information transmis-sion and focus on the contribution of single spikes, the surprise per spikewas employed (see section 4). The entire MF stimulus set was ranked accord-ing to the surprise-per-spike value for all release probabilities, p (see Figure6A). As shown in Figure 6B.B1, the stimuli with the largest surprise perspike at low p were characterized by long-correlated MF spike trains (theblue-labeled patterns), whereas as p increased, the stimuli with greatest sur-prise per spike were short correlated trains (red-labeled stimuli). As shownin Figure 6B.B2, the stimuli with lowest surprise per spike at small p did nothave a stereotyped structure, whereas as p increased, they rapidly becamestimuli with at most one spike per bin and therefore no coactivated spikes.
These findings were corroborated by analyzing how the surprise perspike changed as a function of the correlation C for different release
NECO_a_00006-Arleo neco.cls April 26, 2010 22:18
Unc
orre
cted
Proo
f
12 A. Arleo et al.
0 0.5 10
Correlation C
4
8
12
Sur
pris
e (b
its)
p = 0.1
p = 0.4
p = 0.8
Figure 5: Surprise as a function of the correlation across the four mossy fiberinputs: simulation results. The larger the correlation coefficient C of the stimulusbecame, the larger was the information transmitted by the stimulus. C measuresthe average number of coincident spikes across the four MF afferents and overthe four time bins (see section 4). This result holds for all release probabilityvalues p " [0.1,0.8]. Nevertheless, the larger the p value was, the more thesurprise saturated with higher C values.
probability values (see Figure 6C). At low p, the surprise per spike in-creased quasi-linearly with the MF spike correlation C, with the peak ofthe distribution occurring for long-correlated inputs (blue-labeled stimuliin Figure 6C, left). By contrast, as p increased, the distribution of the sur-prise per spike as a function of C became non linear, and the peak of thedistribution increased and occurred for shorter correlated stimuli (red dotsin Figure 6C, center and right). Thus, an increase in p enhanced the surpriseper spike of short correlated stimuli, whereas it favored only partially thatof long highly correlated stimuli, whose surprise per spike saturated andeven decreased at high p.
2.4 Influence of Specific Patterns on Information Transmission.Why did long correlated stimuli benefit less, in terms of information perspike, from p increases than short correlated ones? A possible explanationemerged by examining at different p values the GC responses to distinctMF stimuli. Figure 7A shows both the spikegram and the poststimulus timehistogram (PSTH) of the GC response to a long correlated stimulus (withfour bins with coactivated spikes). For p > 0.5, spike doublets were elicitedby the second set of input spikes (second arrow, p = 0.6 and p = 0.8). The

NECO_a_00006-Arleo neco.cls April 26, 2010 22:18
Unc
orre
cted
Proo
f
How Synaptic Release Probability Shapes Neuronal Transmission 13
A
C
B
0 1Correlation C
0
1
2
Sur
pris
e pe
r sp
ike
(bits
/spi
ke)
B1
time
MF1MF2MF3MF4
1111111111111111
1110111111111111
1011111111111111
0110111111111111
1000100010001000
1000100011001100
1100110011001100
0000100010001000
0001000100010001
1000100010001000
0000000010001000
0000100010001000
B20100010001001001
0001000100010001
0100100110011010
0000000101001101
0000000000001111
0000000001101001
0000000000000111
0000000000011110
p = 0.1time
p = 0.4 time
p = 0.8 time
p = 0.1 p = 0.4 p = 0.8
ranking 1 2 3 4
ranking 3873 3874 3875 3876
1.5
0.5
0.5 0 1Correlation C
1
2
1.5
0.5
0.50
0 1Correlation C
1
2
1.5
0.5
0.50
0000000000001111
0000000000001011
0000000000000111
0000000000011110
0 1000 2000 3000
Rank of stimulus
Sur
pris
e pe
r sp
ike
(bits
/spi
ke)
1.5
2.0
1.0
0.5
38760
p = 0.8
p = 0.4
p = 0.1
Correlationacross MFs
high
low
Length of the stimulus2 bins1100110011001100
0000000000011000
3 bins
0000000101001000
1110111011101110
4 bins
0001001001001000
1111111111111111
1000100010001000
1 bin
0000000000000100
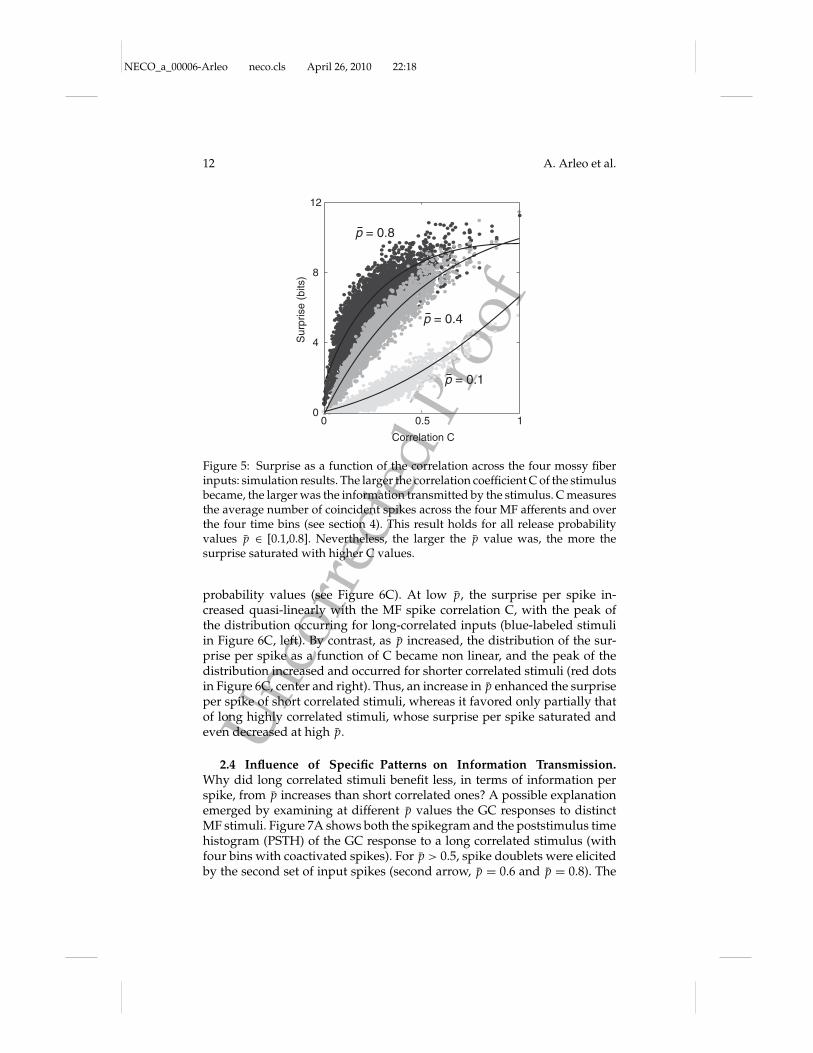
Figure 6: Surprise per spike as a function of release probability: simulationresults. (A) The stimuli were ranked as a function of their surprise per spikefor every p value [0.1, 0.8, step of 0.1]. Here, the release probability was equalfor all four MF synapses at the GC; that is, any permutation of the four inputspike trains was equivalent. This reduced the number of different stimuli to3876 from the initial 216 = 65,536. (B) The sets providing the largest (B1) andthe smallest (B2) contribution to the surprise per spike were selected for threedifferent p values. A different color map was chosen to identify the number ofbins occupied (blue, green, pink, red for 4, 3, 2, 1 bins, respectively). The numberof spikes per bin modulated the color map (e.g., red to orange for four to onespikes per bin, within the red color map). At low p, the stimuli with the largestsurprise per spike are long-correlated spike trains: four bins with coactivatedspikes at p = 0.1 (e.g., the blue-labeled stimuli in B1). As p increases, the stimuliwith largest surprise per spike are short correlated trains with two or three binsof coactivated spikes at p = 0.2–0.3, one to two bins at p = 0.4–0.5 (red and pink-labeled stimuli), and one bin for p > 0.5 (red and orange-labeled stimuli). Thestimuli with the smallest surprise per spike have no stereotyped structure at lowp, whereas they are long noncorrelated patterns at high p (e.g., the cyan-labeledstimuli in B2). (C) Whereas the surprise per spike increased almost linearly withcorrelation at the lowest p value ( p = 0.1), the peak of the distribution increasedand moved back as p increases: starting with the highest correlated stimuli atp = 0.1 with four coactivated spikes in all four bins (blue dots), the peak at p = 0.8is found for a stimulus with a smaller correlation value, with four coactivatedspikes in only one bin (red dot and red-labeled stimuli). The distribution ofpoints at p = 0.4 already shows saturation for the long correlated stimuli whilefor the shorter correlated stimuli, the distribution starts to peak.
NECO_a_00006-Arleo neco.cls April 26, 2010 22:18
Unc
orre
cted
Proo
f
14 A. Arleo et al.
0
200
400
Tria
ls
0
150
300
PS
TH
0
200
400
Tria
ls
0
150
300
PS
TH
0
200
400
0
150
300
p = 0.3
p = 0.6
p = 0.8
Tria
ls
60 80 100 120 140 16050 70
60 80 100 120 140 16050 70
Time (ms)
60 80 100 120 140 16050 70
PS
TH
60 80 100 120 140 16050 70
60 80 100 120 140 16050 70
60 80 100 120 140 16050 70
Time (ms)
MF1MF2MF3MF4
time
0111011111101111
0.1 0.2 0.3 0.4 0.5 0.6 0.7 0.80
0.2
0.4
0.6
0.8
Mean release probability
Sur
pris
e pe
r sp
ike
(bits
/spi
ke)
(p)
B
A
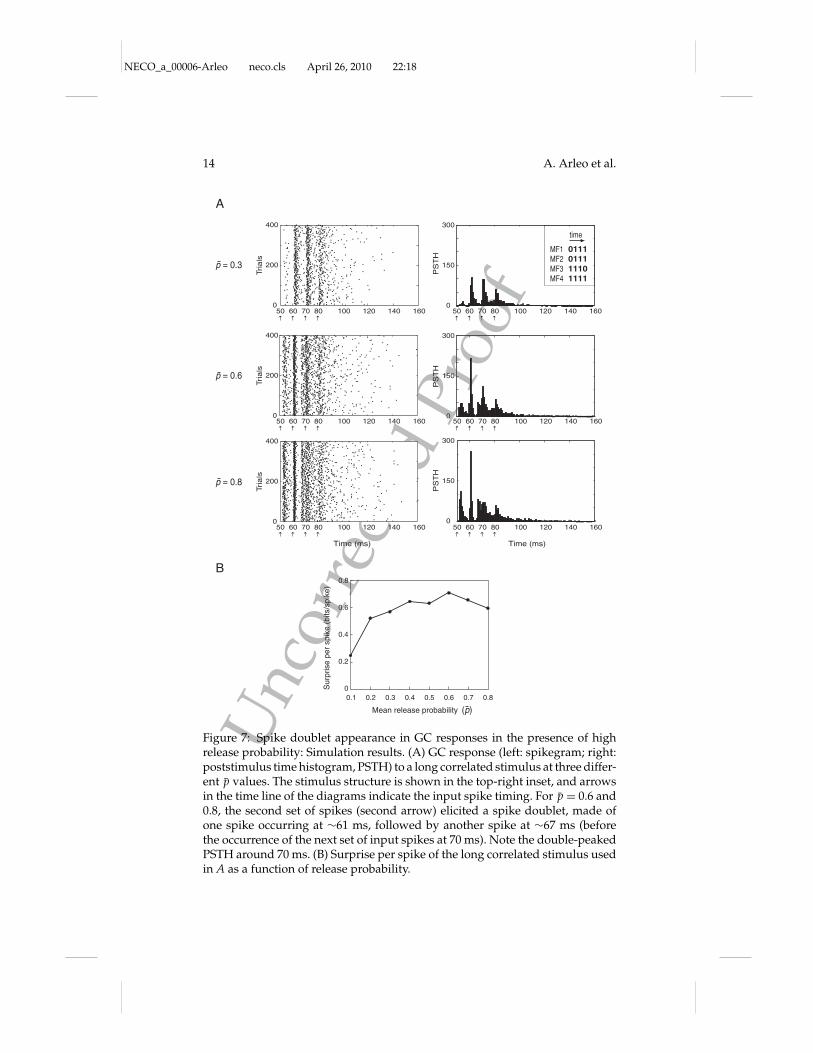
Figure 7: Spike doublet appearance in GC responses in the presence of highrelease probability: Simulation results. (A) GC response (left: spikegram; right:poststimulus time histogram, PSTH) to a long correlated stimulus at three differ-ent p values. The stimulus structure is shown in the top-right inset, and arrowsin the time line of the diagrams indicate the input spike timing. For p = 0.6 and0.8, the second set of spikes (second arrow) elicited a spike doublet, made ofone spike occurring at #61 ms, followed by another spike at #67 ms (beforethe occurrence of the next set of input spikes at 70 ms). Note the double-peakedPSTH around 70 ms. (B) Surprise per spike of the long correlated stimulus usedin A as a function of release probability.
NECO_a_00006-Arleo neco.cls April 26, 2010 22:18
Unc
orre
cted
Proo
f
How Synaptic Release Probability Shapes Neuronal Transmission 15
doublets disrupted the precise spike timing of the response (evident in thePSTH after the second response spike), limiting the surprise per spike ofthe stimulus despite the improved timing of the first response spike withrespect to the p < 0.5 case (see Figure 7B). The longer the stimulus (i.e.,the larger the number of bins with spikes), the higher was the probabil-ity of eliciting spike doublet responses at high p values (see Figure 8C forother spike doublet examples). This behavior was probably determinedby the engagement of smoothly varying currents, such as the NMDA cur-rent and the persistent and resurgent Na+ currents (D’Angelo et al., 2001;Magistretti, Castelli, Forti, & D’Angelo, 2006; Nieus et al., 2006), with in-creasing p. These currents drive repetitive firing and decrease the probabil-ity of having precise stimulus-locked response spikes.
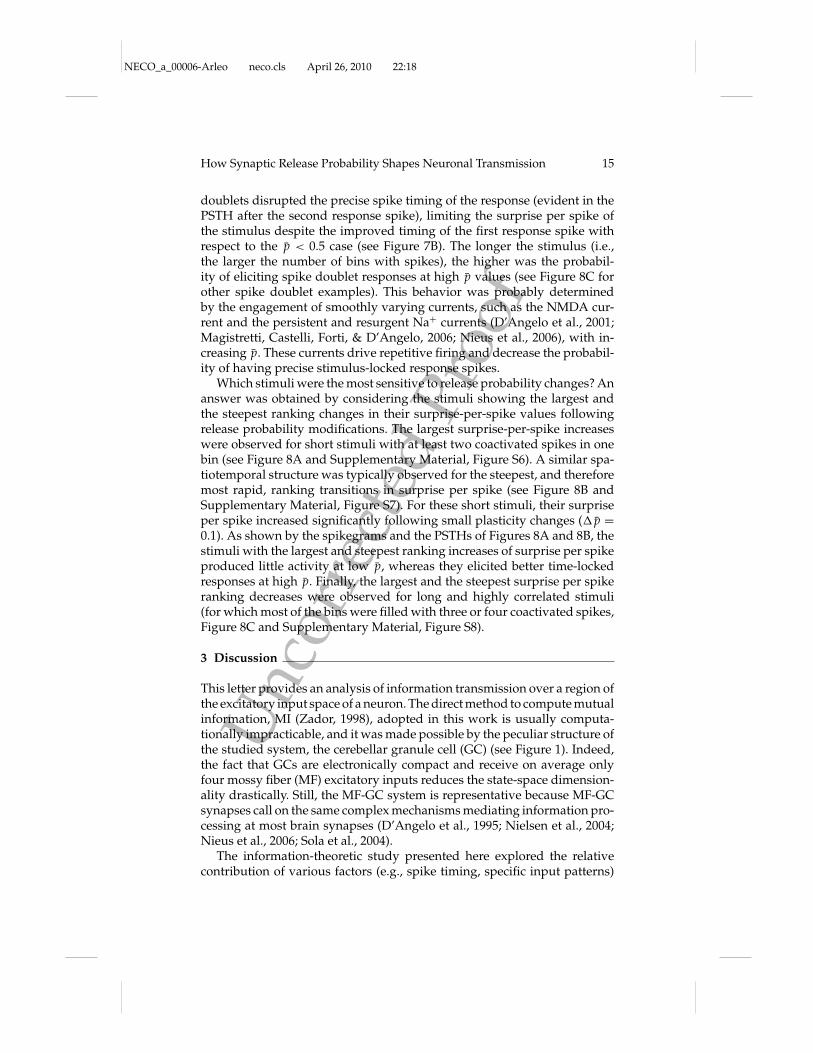
Which stimuli were the most sensitive to release probability changes? Ananswer was obtained by considering the stimuli showing the largest andthe steepest ranking changes in their surprise-per-spike values followingrelease probability modifications. The largest surprise-per-spike increaseswere observed for short stimuli with at least two coactivated spikes in onebin (see Figure 8A and Supplementary Material, Figure S6). A similar spa-tiotemporal structure was typically observed for the steepest, and thereforemost rapid, ranking transitions in surprise per spike (see Figure 8B andSupplementary Material, Figure S7). For these short stimuli, their surpriseper spike increased significantly following small plasticity changes (! p =0.1). As shown by the spikegrams and the PSTHs of Figures 8A and 8B, thestimuli with the largest and steepest ranking increases of surprise per spikeproduced little activity at low p, whereas they elicited better time-lockedresponses at high p. Finally, the largest and the steepest surprise per spikeranking decreases were observed for long and highly correlated stimuli(for which most of the bins were filled with three or four coactivated spikes,Figure 8C and Supplementary Material, Figure S8).
3 Discussion
This letter provides an analysis of information transmission over a region ofthe excitatory input space of a neuron. The direct method to compute mutualinformation, MI (Zador, 1998), adopted in this work is usually computa-tionally impracticable, and it was made possible by the peculiar structure ofthe studied system, the cerebellar granule cell (GC) (see Figure 1). Indeed,the fact that GCs are electronically compact and receive on average onlyfour mossy fiber (MF) excitatory inputs reduces the state-space dimension-ality drastically. Still, the MF-GC system is representative because MF-GCsynapses call on the same complex mechanisms mediating information pro-cessing at most brain synapses (D’Angelo et al., 1995; Nielsen et al., 2004;Nieus et al., 2006; Sola et al., 2004).
The information-theoretic study presented here explored the relativecontribution of various factors (e.g., spike timing, specific input patterns)
NECO_a_00006-Arleo neco.cls April 26, 2010 22:18
Unc
orre
cted
Proo
f
16 A. Arleo et al.
to neurotransmission and investigated how their interrelations changedfollowing long-term plasticity. The analysis showed that the MF-GC relaytransmitted information via firing rate, spike timing, and spike correla-tion of MF discharge. Along with its ability to regulate spike frequencyand timing (Nieus et al., 2006), the increase of release probability (p) ac-companying LTP regulated the amount of transmitted information (Zador,1998). The main observation is that, on average, information was carriedalmost equally by spike frequency and spike timing, and it increased quasi-linearly with p. On the other hand, it was shown that maximizing release
B
A
C
0
Mean probability of release (p)
0.1 0.2 0.3 0.4 0.5 0.6 0.7 0.8
Supr
ise
per s
pike
rank
500
1000
1500
2000
2500
3000
3500
0001000101000100
p = 0.4
p = 0.2
p = 0.7
Mean probability of release (p)
0.1 0.2 0.3 0.4 0.5 0.6 0.7 0.8
Supr
ise
per s
pike
rank
0
500
1000
1500
2000
2500
3000
3500
0001000100010010
p = 0.5
p = 0.2
p = 0.8
0
Mean probability of release (p)
0.1 0.2 0.3 0.4 0.5 0.6 0.7 0.8
Supr
ise
per s
pike
rank
500
1000
1500
2000
2500
3000
3500
0111011111111111
Time (ms)
50 160
Spik
e co
unt
0
300
Spik
e co
unt
0
300
Spik
e co
unt
0
300
Time (ms)
0
400
Tria
ls
50 160
0
400
Tria
ls
0
400
Tria
ls
Time (ms)
50 160
Spik
e co
unt
0
300
Spik
e co
unt
0
300
Spik
e co
unt
0
300
Time (ms)
0
400
Tria
ls
50 160
0
400
Tria
ls
0
400
Tria
ls
Time (ms)
50 160
Spik
e co
unt
0
300
Spik
e co
unt
0
300
Spik
e co
unt
0
300
Time (ms)
0
400
Tria
ls
50 160
400
Tria
ls
0
400
Tria
ls
0
p = 0.6
p = 0.3
p = 0.8
Surp
rise
per s
pike
(bits
/spi
ke)
0.2
0.4
0.6
0.8
1
1.2
1.4
1.6
0
Surp
rise
per s
pike
(bits
/spi
ke)
0.2
0.4
0.6
0.8
1
1.2
1.4
1.6
0
Surp
rise
per s
pike
(bits
/spi
ke)
0.2
0.4
0.6
0.8
1
1.2
1.4
1.6
0

NECO_a_00006-Arleo neco.cls April 26, 2010 22:18
Unc
orre
cted
Proo
f
How Synaptic Release Probability Shapes Neuronal Transmission 17
probability is not a necessary condition to optimize stimulus-specific in-formation for most stimuli. Indeed, single-stimulus transmission reacheda plateau at intermediate p values for most MF inputs, with optimal trans-mission taking place over a large p range (from intermediate values to themaximum). Interestingly, in this range, the preferred stimulus patterns werevery sensitive to p variations; in other words, small variations of p changedthe subset of stimuli that are best transmitted by the cell. Such intermediaterelease probability values reflect the values observed experimentally in thecerebellar granular layer (Saviane & Silver, 2006; Sola et al., 2004), as wellas in other brain areas (e.g., neocortical pyramid-to-pyramid connections:Koester & Johnston, 2005; CA3-CA1 hippocampal synapses: Dobrunz &Stevens, 1997).
Figure 8: Surprise-per-spike changes for exemplar stimuli with highest in-formation transmission modifications following release probability increases:Simulation results. (A–C) Information transmission for stimuli with the fourthlargest increase (A), the fourth steepest increase (B), and the fourth largest de-crease (C) in the rank of the surprise per spike as a function of p (left panels: thecontinuous lines indicate the changes in the rank, whereas the dashed curvesdenote the absolute values of the surprise per spike). The middle and rightpanels show the GC responses to the stimulus as spikegrams and PSTHs, re-spectively, for three different p. The steepest increases and decreases typicallyoccurred between 0.4–0.6 and 0.3–0.4, respectively. In C, at p = 0.6 and 0.8, notethe spike doublets in response to the second set of input spikes at #62 and #68ms before the third set of input spikes at 70 ms. This doublet perturbed the tim-ing of the following spikes as seen by the wider spread in the PSTH. This spreadis largely responsible for the decline in rank for this stimulus at high p. In B,note the persistent high rank for this stimulus after the rank increase at p = 0.5(left panel). A doublet to the three-spike bin (second arrow) starts appearing atp = 0.6 (not shown) and is clear at p = 0.8 with spikes at #82 and #88 ms inresponse to the second set of input spikes (middle and right panels). Hence,the doublet appearance at p = 0.6 is not the cause of the rank increase at p =0.5 or of a transmission decrease as for the stimuli in C since its rank remainshigh beyond p = 0.6. Thus, when B is compared with A and C, the effect ofthe appearance of doublets on surprise per spike is highly stimulus dependent.For the left panels, the 3876 different stimuli obtained with the same p over thefour synapses ( p = p) were ranked according to the surprise per spike obtainedat a specific p between 0.1 and 0.8. The 10 largest and steepest increases anddecreases in rank were analyzed. In general, it was found that in short notation(number of spikes per bin with implicit permutation), the largest increases werefor stimuli of the form x2xx or x202 with x = 0, 1; whereas the steepest increaseswere for x2xx or x3xx, x = 0, 1, 2; and the largest decreases were for xyy4, x =1,2,3,4; y = 3,4.
NECO_a_00006-Arleo neco.cls April 26, 2010 22:18
Unc
orre
cted
Proo
f
18 A. Arleo et al.
In this study, the influence of the Golgi cells (GoCs) was omitted to fo-cus on the GC encoding of its excitatory inputs only. In fact, the series ofanalyses presented here did not aim at providing a comprehensive char-acterization of the information transmission process in the granular layer;rather, it was meant to set forth an information-theoretic framework suit-able for studying the efficacy of GC information processing quantitatively.At this stage, GoC inhibition was not included because a thorough under-standing of the synaptic transmission at the MF-GoC relay is still missing(Forti, Cesana, Isope, Dieudonne, & D’Angelo, 2008). In addition, the studyof quantal release properties of GoC-GC synapses has been addressed onlyvery recently (Mapelli, Rossi, Nieus, & D’Angelo, 2009). Further analyseswill be carried out to quantify the effects of Golgi inhibition onto GC neu-rotransmission by means of a cerebellar GABA synaptic model accountingfor recent experimental evidence (Mapelli et al., 2009) at this synapse (seealso Bezzi, Nieus, Arleo, D’Angelo, & Coenon, 2004, for preliminary workin this direction). GoCs fire autorhythmically at 2 to 4 Hz in vitro (Forti,Cesana, Mapelli, & D’Angelo, 2006) and at around 10 Hz in vivo (Vos,Wijnants, Taeymans, & de Schutter, 1999), and their discharge frequencycan be raised up to 300 Hz on stimulation. It is worth mentioning thateven under such strong inhibitory conditions, GCs are still able to displayshort-burst activity (D’Angelo & De Zeeuw, 2009). Following stimulationof the whisker pad, GoCs in anesthetized rats follow a stereotyped firingpattern characterized by bursts of two or three spikes, followed by pausesof around 100 ms. Moreover, the cerebellum displays oscillatory activity attheta frequency (Hartmann & Bower, 1998), and a cerebellar network modelsuggested that these oscillations are characterized by a highly synchronousactivity of GoCs and GCs (Maex & Schutter, 1998). In all these studies, theGoCs appear to regulate the narrow time window during which GCs mayfire (D’Angelo & De Zeeuw, 2009; Kistler & De Zeeuw, 2003; Solinas et al.,2007a, 2007b).
The synaptic model used here was stochastic (see section 4; see alsoSun, Lyons, & Dobrunz, 2005). It presented both facilitation and depres-sion depending on the release probability p and spike activity (Nieus et al.,2006; Tsodyks & Markram, 1997). Hence, the calculations of informationpresented here extend those that have thus far been investigated using de-pressing synapse (de la Rocha & Parga, 2005; Goldman, 2004), and constant-transmission-probability models (Manwani & Koch, 2001; Zador, 1998).Recently an information-theoretic measure, namely, the synaptic informa-tion efficacy (SIE) (London et al., 2002), has been introduced to quantifythe transmitting properties of a single synapse. SIE is actually the mutualinformation (MI) between the presynaptic input spike trains and the post-synaptic responses. In this study, MI was measured across only a singlesynapse, while considering the rest of the dendritic input as backgroundnoise (London et al., 2002). Similarly, other studies using different analyticalapproaches have focused on the transmitting properties of single synapses
NECO_a_00006-Arleo neco.cls April 26, 2010 22:18
Unc
orre
cted
Proo
f
How Synaptic Release Probability Shapes Neuronal Transmission 19
(de la Rocha et al., 2002; Goldman, 2004; Manwani et al., 2002; Tiesinga,2001). In addition, although input correlations have been shown to be rel-evant to neuronal computation (de la Rocha & Parga, 2005; Schreiber, Fel-lous, Tiesinga, & Sejnowski, 2004; Tiesinga & Toups, 2005), many studieshave investigated conditions in which they are absent (London et al., 2002;Manwani & Koch, 2001; Zador, 1998). This study complements these previ-ous works by presenting a quantitative characterization of how the corre-lation across multiple synaptic inputs of a neuron may contribute to infor-mation transmission.
Our results corroborate the hypothesis that the correlation among the in-puts plays a crucial role in affecting neurotransmission at all levels of releaseprobability p. Our analysis strengthened this observation by showing howthe spatiotemporal structure of MF inputs affected GC neurotransmissionas a function of p. The most sensitive stimuli to release probability changeswere identified in terms of both surprise and surprise per spike. Shortcorrelated MF bursts resulted to benefit the most from p increases. Longcorrelated stimuli caused changes in neurotransmission and excitation dy-namics at high p, which bounded their transmission reliability. These resultsare consistent with previous findings suggesting that when the synapses aretuned toward specific input stimuli, one of the roles of LTP and LTD maybe that of generating spike train–specific nonlinear detectors (Natschlager& Maass, 2001; Sharpee et al., 2006), which would regulate the transmis-sion of specific spatiotemporal input patterns at the level of the neuron.The preferential recoding of the information contained in certain patternsmay be of biological relevance for computation at subsequent stages in thecerebellar cortex. For instance, two spikes in close succession lead to theopening of presynaptic NMDA channels and start a cascade of events lead-ing to long-term plasticity at the synapses between the Purkinje cells (PCs)(Casado, Isope, & Ascher, 2002) and the parallel fibers (PFs), which are theaxons of the GCs. Recoding following granular layer plasticity could alsohave the effect of reducing the length of PF spike trains, thereby increasingthe timing accuracy of the PC responses.
Naturally, to provide definite answers beyond the neuronal level, cod-ing strategies need to be evaluated within a cerebellar network (Coenen,Arnold, Sejnowski, & Jabri, 2001; Philipona & Coenen, 2004) by meansof large-scale simulations, where plasticity may also regulate the averageGC population firing and the duration of multiple PF activation neces-sary to elicit a PC response. Therefore, the information-theoretic approachpresented here constitutes a step forward in the investigation of neural in-formation transfer in the granular layer network of the cerebellum. Scalingfrom elementary cellular mechanisms such as synaptic release probabil-ity to network computation is fundamental to understanding how MF-GClong-term plasticity, by being instrumental in the control of informationtransmission, may regulate the operations to which the cerebellum partici-pates (Dum, Li, & Strick, 2002).
NECO_a_00006-Arleo neco.cls April 26, 2010 22:18
Unc
orre
cted
Proo
f
20 A. Arleo et al.
4 Materials and Methods
4.1 Biophysical Model of the MF-GC Synaptic Relay. A stochasticversion of our previous models (D’Angelo et al., 2001; Nieus et al., 2006)was developed for this study (see also Sun et al., 2005). The GC model wasprovided with four independent MF-GC synaptic contacts endowed withstochastic neurotransmitter release mechanisms. Each synaptic contact con-sisted of three independent releasing sites (RS) (Saviane & Silver, 2006; Solaet al., 2004), each governed by a three-state presynaptic model (Tsodyks &Markram, 1997). Neurotransmitter release was modeled as a system of fourfirst-order differential equations relating the probability of release (p) to theavailable (X), released (Y), and recovered (Z) neurotransmitter resources(Nieus et al., 2006; Tsodyks & Markram, 1997) (see Supplementary Mate-rial). The release was made probabilistic and modeled as an all-or-noneprocess by comparing a random number (") drawn from a uniform [0, 1]probability distribution with the released resources Y. Hence, a wave ofglutamate (Nieus et al., 2006) was released from the RS whenever " was lessthan Y, so that averaging over numerous independent Ys led to recovery ofthe behavior of the deterministic release model (Nieus et al., 2006; Saviane& Silver, 2006; Sola et al., 2004). Each RS activated an independent post-synaptic site endowed with AMPA and NMDA receptors. Because threeRS/contact (Saviane & Silver, 2006) were introduced, each postsynapticsite was calibrated to contribute one-third of the total conductance (Nieuset al., 2006). Since no evidence for p heterogeneity was reported (Sola et al.,2004), p was set at the same value for all releasing sites at the same synapse.(Further details on the biophysical model can be found in SupplementaryMaterial, section S1.1.)
First, a series of simulations was run by adopting the same stimulationprotocol used for the patch clamp experiments (see section 2 and Figure 2).Then the input space was extended by considering the four MF afferents asfour independent spike trains and regulating the neurotransmitter releaseprobability p at each MF-GC synapse independently (e.g., see Figure 3).All possible combinations of input spike trains lasting up to 40 ms, asbinary words of 10 ms bins (i.e. with a maximum rate of 100 Hz), were thencreated. Thus, each MF spike train was encoded as a four-bit binary word,and the cell input was a 4 (number of MFs) ( 4 (number of bits for eachMF) = 16 bit binary word. Accordingly, the entire input space consistedof 216 = 65536 stimuli. GC responses were digitalized using temporal binsof 6 ms over a period of 120 ms (see Supplementary Material, section S2.1,for a discussion on the dependence of the results upon the bin size usedto sample GC responses). Each stimulus was presented 400 times, and theeffect of limited sampling on MI computation was taken into account (seeSupplementary Material, section S1.3).
To simulate natural firing activity in MFs, all 65,536 stimuli occur-ring with different probabilities, p(s), were considered. The actual firing
NECO_a_00006-Arleo neco.cls April 26, 2010 22:18
Unc
orre
cted
Proo
f
How Synaptic Release Probability Shapes Neuronal Transmission 21
distribution of MFs is not known, but following Treves, Panzeri, Rolls,Booth, and Wakeman (1999), a continuous unimodal distribution (with asingle peak close to the spontaneous activity, i.e., close to zero in our case)with an exponential tail was assumed. This distribution has been observedin other brain areas, among them, the frontal cortex (Abeles, Vaadia, &Bergman, 1990), hippocampus and close structures (Barnes, McNaughton,Mizumori, Leonard, & Lin, 1990), visual cortex (Baddeley et al., 1997;Franco, Rolls, Aggelopoulos, & Jerez, 2007), as well as used in previous neu-ral network models (Treves & Rolls, 1991). For this study, a decreasing expo-nential distribution of firing rate with a mean of 10 Hz was chosen. Anotherdistribution with similar features (i.e., Poisson) was also tested, and com-patible results were obtained (see Supplementary Material, section S2.3).
The model was implemented with NEURON 5.4. The most demandingnumerical simulations were run on a cluster of 20 CPUs (1.7 GHz each).
4.2 Electrophysiological Recordings. Whole-cell patch clamp record-ings of GCs were performed from acute cerebellar slices of P18-P23 Wistarrats according to published procedures (D’Angelo et al., 1995; Sola et al.,2004) (see Supplementary Material, section S1.2). Varying the intensity ofMF stimulation permitted generating simultaneous activity in one to fourMFs. The core experiment was carried out in current-clamp mode. MFswere stimulated by a set of spike trains lasting 40 ms and with a frequencyup to 100 Hz. To investigate the effect of long-term synaptic plasticity onMI, the same set of stimuli was presented before and after LTP inductionby theta-burst stimulation (TBS: 8 100 Hz bursts lasting 100 ms every 250ms) (Nieus et al., 2006; Sola et al., 2004) (see Supplementary Material, Fig-ure S2). The mean MF-GC release probability p was estimated in voltageclamp, at the beginning and at the end of each experiment, by analyz-ing the excitatory postsynaptic currents (EPSCs) elicited by four stimuli at100 Hz (Nieus et al., 2006; see Supplementary Material, Figure S3).
GC responses were spike-sorted via a threshold crossing procedure (Igor;WaveMetrics Inc.). To compute MI, both input (MF) and output (GC) spiketrains were transformed into binary words (see Figure 1). MF spike trainswere digitized by using a temporal bin of 10 ms. Because each stimuluslasted 40 ms and all MFs received the same spike train, the input set con-sisted of 24 = 16 stimuli. Each stimulus was presented 25 times. The GCresponses were digitized by using a 6 ms bin width. A 60 ms time windowwas used for sampling the GC output; the spikes occurring beyond thistime window (less than 1% of all spikes) were not taken into account toreduce the dimensionality of the sampling space. The significance of MImeasurements was assessed by a bootstrapping procedure (Lu & Wang,2004) of 1000 repetitions). MI proved to be statistically significant (p < 0.05)for MI > 0.4 bits.
All experiments were carried out according to the guidelines and regu-lations laid down by the institution’s animal welfare committee.

NECO_a_00006-Arleo neco.cls April 26, 2010 22:18
Unc
orre
cted
Proo
f
22 A. Arleo et al.
4.3 Theoretical Analysis
4.3.1 Mutual Information and “Surprise.” The mean information trans-mitted between the GC responses r and the MF inputs s was calculatedby using Shannon’s mutual information (MI), equation 1.1, where both thestimuli s and the responses r were represented as either binary words (seeFigure 1) or spike counts. The binary word coding preserves the informa-tion about spike timing, up to a certain precision, whereas the spike countcoding simply assesses the information transmitted by the neuron averagefiring. The data processing inequality (Cover & Thomas, 1991) ensures thatMI obtained using spike counts is always not greater than the MI obtainedusing binary words.
To isolate the specific contribution of a single stimulus s to MI, thestimulus specific surprise (called simply surprise here) was used (Butts &Goldman, 2006; DeWeese & Meister, 1999):
I1(s) =!
r"R
p(r | s) log2p(r | s)
p(r ). (4.1)
The surprise measures how much the conditional distribution p(r | s)differs from the prior probability distributionp(r ), corresponding to the so-called Kullback-Leibler distance. The surprise per spike was then computedby dividing the surprise by the spike count of the input stimulus. Normal-izing by the number of input spikes essentially removes the linear part ofthe contribution of MF firing rates to information transmission.
Both MI and the surprise measure have a systematic bias due to thelimited data samples available (Nemenman, Bialek, & de Ruyter vanSteveninck, 2004; Paninski, 2003; Strong, Koberle, de Ruyter van Steveninck,& Bialek, 1998; Treves & Panzeri, 1995). This issue is treated in the Supple-mentary Material, section S1.3.
4.3.2 Correlation Measure. To estimate the number of coincident spikesacross the four MF inputs, the normalized average of the pair-wise cor-relation over all the different pairs of MFs was computed. Let s " S be astimulus constituted by four MF patterns, and let xi and xj denote the inputspike trains representing the activity on the ith and the jth MF, respectively.The correlation coefficient C(s) was taken as
C(s) = 1N
· %(K (xi ) $ x) · (K (xj ) $ x))&i> j ,
where x represents the average firing rate, N is the normalization factorequal to the number of input bins, and K (x) denotes a smoothing function(i.e., an exponential kernel with # equal to the input bin width) that takesinto account the effects of the short-time integration over the membrane
NECO_a_00006-Arleo neco.cls April 26, 2010 22:18
Unc
orre
cted
Proo
f
How Synaptic Release Probability Shapes Neuronal Transmission 23
time constant. The C(s) vector, for all s " S, was then rescaled into the range
[0, 1]. For example, C(s) = 0.4039 for s =
"""#1 1 0 01 1 0 01 1 0 01 1 0 0
$$$%, whereas C(s) = 0.1561
for s =
"""#0 0 0 00 0 0 01 1 1 11 1 1 1
$$$%.
Acknowledgments
We kindly acknowledge the contribution of David Gall (Universite Libre deBruxelles) for the confocal image in Figure 1. This work was supportedby European projects SENSOPAC IST-2005–028056 (www.sensopac.org)and SpikeFORCE IST-2001-35271 (www.spikeforce.org), both created byO.J.-M.D.C., by Sony CSL-Paris, and by the Italian MIUR project PRIN-2004053317 and CNR-INFM project FIRB-RBNE01AAS7 to E.D’A.
References
Abbott, L. F., & Regehr, W. G. (2004). Synaptic computation. Nature, 431, 796–803.
Abeles, M., Vaadia, E., & Bergman, H. (1990). Firing patterns of single units in theprefrontal cortex and neural network models. Network, 1, 13–25.
Albus, J. S. (1971). A theory of cerebellar function. Math. Biosc., 10, 25–61.Arenz, A., Silver, R. A., Schaefer, A. T., & Margrie, T. W. (2008). The contribution of
single synapses to sensory representation in vivo. Science, 321, 977–980.Baddeley, R., Abbott, L. F., Booth, M. C., Sengpiel, F., Freeman, T., Wakeman, E.
A., et al. (1997). Responses of neurons in primary and inferior temporal visualcortices to natural scenes. Proc. Biol. Sci., 264, 1775–1783.
Barnes, C. A., McNaughton, B. L., Mizumori, S. J., Leonard, B. W., & Lin, L. H.(1990). Comparison of spatial and temporal characteristics of neuronal activ-ity in sequential stages of hippocampal processing. Prog. Brain Res., 83, 287–300.
Bezzi, M., Nieus, T., Arleo, A., D’Angelo, E., & Coenon, O. J. M. (2004). Informationtransfer at the mossy fiber-granule cell synapse of the cerebellum. Society for Neuro-science Abstracts No. 827.5, San Diego.
Bialek, W., Rieke, F., de Ruyter van Steveninck, R. R., & Warland, D. (1991). Readinga neural code. Science, 252, 1854–1857.
Bliss, T. V., & Collingridge, G. L. (1993). A synaptic model of memory: Long-termpotentiation in the hippocampus. Nature, 361, 31–39.
Bliss, T. V., & Lomo, T. (1973). Long-lasting potentiation of synaptic transmission inthe dentate area of the anaesthetized rabbit following stimulation of the perforantpath. J. Physiol., 232, 331–356.
Borst, A., & Theunissen, F. E. (1999). Information theory and neural coding. Nat.Neurosci., 2, 947–957.
NECO_a_00006-Arleo neco.cls April 26, 2010 22:18
Unc
orre
cted
Proo
f
24 A. Arleo et al.
Brenner, N., Bialek, W., & de Ruyter van Steveninck, R. (2000). Adaptive rescalingmaximizes information transmission. Neuron, 26, 695–702.
Brenner, N., Strong, S. P., Koberle, R., Bialek, W., & de Ruyter van Steveninck, R. R.(2000). Synergy in a neural code. Neural. Comput., 12, 1531–1552.
Butts, D. A., & Goldman, M. S. (2006). Tuning curves, neuronal variability, andsensory coding. PLoS Biol., 4, e92.
Casado, M., Isope, P., & Ascher, P. (2002). Involvement of presynaptic N-methyl-D-aspartate receptors in cerebellar long-term depression. Neuron, 33, 123–130.
Chadderton, P., Margrie, T. W., & Hausser, M. (2004). Integration of quanta in cere-bellar granule cells during sensory processing. Nature, 428, 856–860.
Coenen, O. J.-M. D., Arnold, M. P., Sejnowski, T. J., & Jabri, M. A. (2001). Parallelfiber coding in the cerebellum for life-long learning. Autonomous Robots, 11, 291–297.
Cover, T. M., & Thomas, J. A. (1991). Elements of information theory. New York: Wiley.D’Angelo, E., De Filippi, G., Rossi, P., & Taglietti, V. (1995). Synaptic excitation of
individual rat cerebellar granule cells in situ: Evidence for the role of NMDAreceptors. J. Physiol., 484, 397–413.
D’Angelo, E., & De Zeeuw, C. I. (2009). Timing and plasticity in the cerebellum:Focus on the granular layer. Trends Neurosci., 32, 30–40.
D’Angelo, E., Nieus, T., Maffei, A., Armano, S., Rossi, P., Taglietti, V., et al. (2001).Theta-frequency bursting and resonance in cerebellar granule cells: Experimentalevidence and modeling of a slow k+-dependent mechanism. J. Neurosci., 21, 759–770.
de la Rocha, J., Nevado, A., & Parga, N. (2002). Information transmission by stochas-tic synapses with short-term depression: Neural coding and optimization. Neu-rocomputing, 44–46, 85–90.
de la Rocha, J., & Parga, N. (2005). Short-term synaptic depression causes a non-monotonic response to correlated stimuli. J. Neurosci., 25, 8416–8431.
de Ruyter van Steveninck, R. R., Lewen, G. D., Strong, S. P., Koberle, R., & Bialek,W. (1997). Reproducibility and variability in neural spike trains. Science, 275,1805–1808.
DeWeese, M. R., & Meister, M. (1999). How to measure the information gained fromone symbol. Network, 10, 325–340.
Dimitrov, A. G., Miller, J. P., Gedeon, T., Aldworth, Z., & Parker, A. E. (2003). Anal-ysis of neural coding through quantization with an information-based distortionmeasure. Network, 14, 151–176.
Dobrunz, L. E., & Stevens, C. F. (1997). Heterogeneity of release probability, facilita-tion, and depletion at central synapses. Neuron, 18, 995–1008.
Dum, R. P., Li, C., & Strick, P. L. (2002). Motor and nonmotor domains in the monkeydentate. Ann. N. Y. Acad. Sci., 978, 289–301.
Eccles, J. C., Ito, M., & Szentagothai, J. (1967). The cerebellum as a neuronal machine.Berlin: Springer Verlag.
Forti, L., Cesana, E., Isope, P., Dieudonne, & D’Angelo, E. (2008). The mossy fiberinput to Golgi cells in the cerebellum. FENS Abst., vol. 4, 221.5.
Forti, L., Cesana, E., Mapelli, J., & D’Angelo, E. (2006). Ionic mechanisms of au-torhythmic firing in rat cerebellar Golgi cells. J. Physiol., 574, 711–729.
NECO_a_00006-Arleo neco.cls April 26, 2010 22:18
Unc
orre
cted
Proo
f
How Synaptic Release Probability Shapes Neuronal Transmission 25
Franco, L., Rolls, E. T., Aggelopoulos, N. C., & Jerez, J. M. (2007). Neuronal selectivity,population sparseness, and ergodicity in the inferior temporal visual cortex. Biol.Cybern., 96, 547–560.
Fuhrmann, G., Segev, I., Markram, H., & Tsodyks, M. (2002). Coding of temporalinformation by activity-dependent synapses. J. Neurophysiol., 87, 140–148.
Goldman, M. S. (2004). Enhancement of information transmission efficiency bysynaptic failures. Neural Comput., 16, 1137–1162.
Hansel, C., Linden, D. J., & D’Angelo, E. (2001). Beyond parallel fiber LTD: Thediversity of synaptic and non-synaptic plasticity in the cerebellum. Nat. Neurosci.,4, 467–475.
Hartmann, M. J., & Bower, J. M. (1998). Oscillatory activity in the cerebellar hemi-spheres of unrestrained rats. J. Neurophysiol., 80, 1598–1604.
Jakab, R. L., & Hamori, J. (1988). Quantitative morphology and synaptology ofcerebellar glomeruli in the rat. Anat. Embryol. (Berl.), 179, 81–88.
Jorntell, H., & Ekerot, C. F. (2006). Properties of somatosensory synaptic integrationin cerebellar granule cells in vivo. J. Neurosci., 26, 11786–11797.
Kistler, W. M., & De Zeeuw, C. I. (2003). Time windows and reverberating loops: Areverse-engineering approach to cerebellar function. Cerebellum, 2, 44–54.
Koch, C., & Segev, I. (2000). The role of single neurons in information processing.Nat. Neurosci., 3 (Suppl.), 1171–1177.
Koester, H. J., & Johnston, D. (2005). Target cell–dependent normalization of trans-mitter release at neocortical synapses. Science, 308, 863–866.
London, M., Schreibman, A., Hausser, M., Larkum, M. E., & Segev, I. (2002). Theinformation efficacy of a synapse. Nat. Neurosci., 5, 332–340.
Lu, T., & Wang, X. (2004). Information content of auditory cortical responses totime-varying acoustic stimuli. J. Neurophysiol., 91, 301–313.
Maex, R., & Schutter, E. D. (1998). Synchronization of Golgi and granule cell firingin a detailed network model of the cerebellar granule cell layer. J. Neurophysiol.,80, 2521–2537.
Magistretti, J., Castelli, L., Forti, L., & D’Angelo, E. (2006). Kinetic and functionalanalysis of transient, persistent, and resurgent sodium currents in rat cerebellargranule cells in situ: An electrophysiological and modelling study. J. Physiol., 573,83–106.
Malenka, R. C., & Bear, M. F. (2004). LTP and LTD: An embarrassment of riches.Neuron, 44, 5–21.
Manwani, A., & Koch, C. (2001). Detecting and estimating signals over noisy andunreliable synapses: Information-theoretic analysis. Neural Comput., 13, 1–33.
Manwani, A., Steinmetz, P. N., & Koch, C. (2002). The impact of spike timing variabil-ity on the signal-encoding performance of neural spiking models. Neural Comput.,14, 347–367.
Mapelli, J., & D’Angelo, E. (2007). The spatial organization of long-term synapticplasticity at the input stage of cerebellum. J. Neurosci., 27, 1285–1296.
Mapelli, L., Rossi, P., Nieus, T., & D’Angelo, E. (2009). Tonic activation of GABA-Breceptors reduces release probability at inhibitory connections in the cerebellarglomerulus. J. Neurophysiol., 101(6), 3089–3099.
Mitchell, S. J., & Silver, R. A. (2003). Shunting inhibition modulates neuronal gainduring synaptic excitation. Neuron, 38(3), 433–445.

NECO_a_00006-Arleo neco.cls April 26, 2010 22:18
Unc
orre
cted
Proo
f
26 A. Arleo et al.
Moreno-Bote, R., & Parga, N. (2004). Role of synaptic filtering on the firing responseof simple model neurons. Phys. Rev. Lett., 92, 028102.
Natschlager, T., & Maass, W. (2001). Computing the optimally fitted spike train fora synapse. Neural Comput., 13, 2477–2494.
Nemenman, I., Bialek, W., & de Ruyter van Steveninck, R. R. (2004). Entropy andinformation in neural spike trains: Progress on the sampling problem. Phys. Rev.E, 69, 056111.
Nielsen, T. A., DiGregorio, D. A., & Silver, R. A. (2004). Modulation of glutamatemobility reveals the mechanism underlying slow-rising AMPAR EPSCs and thediffusion coefficient in the synaptic cleft. Neuron, 42, 757–771.
Nieus, T., Sola, E., Mapelli, J., Saftenku, E., Rossi, P., & D’Angelo, E. (2006). LTPregulates burst initiation and frequency at mossy fiber–granule cell synapses ofrat cerebellum: Experimental observations and theoretical predictions. J. Neuro-physiol., 95, 686–699.
Paninski, L. (2003). Estimation of entropy and mutual information. Neural Comput.,15, 1191–1254.
Philipona, D., & Coenen, O. J.-M. D. (2004). Model of granular layer encoding of thecerebellum. Neurocomputing, 58–60, 575–580.
Quian Quiroga, R., & Panzeri, S. (2009). Extracting information from neuronal pop-ulations: Information theory and decoding approaches. Nat. Rev Neurosci., 10,173–185.
Rancz, E. A., Ishikawa, T., Duguid, I., Chadderton, P., Mahon, S., & Hausser, M.(2007). High-fidelity transmission of sensory information by single cerebellarmossy fibre boutons. Nature, 450, 1245–1248.
Roddey, J. C., & Jacobs, G. A. (1996). Information theoretic analysis of dynamical en-coding by filiform mechanoreceptors in the cricket cercal system. J. Neurophysiol.,75, 1365–1376.
Rolls, E. T., & Deco, G. (2002). Computational neuroscience of vision. Oxford: OxfordUniversity Press.
Rothman, J. S., Cathala, L., Steuber, V., & Silver, R. A. (2009). Synaptic depressionenables neuronal gain control. Nature, 457, 1015–1018.
Sargent, P. B., Saviane, C., Nielsen, T. A., DiGregorio, D. A., & Silver, R. A. (2005).Rapid vesicular release, quantal variability, and spillover contribute to the pre-cision and reliability of transmission at a glomerular synapse. J. Neurosci., 25,8173–8187.
Saviane, C., & Silver, R. A. (2006). Fast vesicle reloading and a large pool sustainhigh bandwidth transmission at a central synapse. Nature, 439, 983–987.
Schreiber, S., Fellous, J. M., Tiesinga, P., & Sejnowski, T. J. (2004). Influence of ionicconductances on spike timing reliability of cortical neurons for suprathresholdrhythmic inputs. J. Neurophysiol., 91, 194–205.
Schweighofer, N., Doya, K., & Lay, F. (2001). Unsupervised learning of granule cellsparse codes enhances cerebellar adaptive control. Neuroscience, 103, 35–50.
Shannon, C. E. (1948). The mathematical theory of communication. Bell Syst. Tech. J.,27, 379–423.
Sharpee, T. O., Sugihara, H., Kurgansky, A. V., Rebrik, S. P., Stryker, M. P., & Miller, K.D. (2006). Adaptive filtering enhances information transmission in visual cortex.Nature, 439, 936–942.

NECO_a_00006-Arleo neco.cls April 26, 2010 22:18
Unc
orre
cted
Proo
f
How Synaptic Release Probability Shapes Neuronal Transmission 27
Silver, R. A., Traynelis, S. F., & Cull-Candy, S. G. (1992). Rapid-time-course miniatureand evoked excitatory currents at cerebellar synapses in situ. Nature, 355, 163–166.
Smith, E. C., & Lewicki, M. S. (2006). Efficient auditory coding. Nature, 439, 978–982.
Sola, E., Prestori, F., Rossi, P., Taglietti, V., & D’Angelo, E. (2004). Increased neu-rotransmitter release during long-term potentiation at mossy fibre-granule cellsynapses in rat cerebellum. J. Physiol., 557, 843–861.
Solinas, S., Forti, L., Cesana, E., Mapelli, J., De Schutter, E., & D’Angelo, E. (2007a).Computational reconstruction of pacemaking and intrinsic electroresponsivenessin cerebellar Golgi cells. Front Cell Neurosci., 1, 2.
Solinas, S., Forti, L., Cesana, E., Mapelli, J., De Schutter, E., & D’Angelo, E. (2007b).Fast-reset of pacemaking and theta-frequency resonance patterns in cerebellarGolgi cells: Simulations of their impact in vivo. Front Cell Neurosci., 1, 4.
Strong, S. P., Koberle, R., de Ruyter van Steveninck, R. R., & Bialek, W. (1998).Entropy and information in neural spike trains. Phys. Rev. Lett., 80(1), 197–200.
Sun, H. Y., Lyons, S. A., & Dobrunz, L. E. (2005). Mechanisms of target-cell specificshort-term plasticity at Schaffer collateral synapses onto interneurones versuspyramidal cells in juvenile rats. J. Physiol., 568, 815–840.
Theunissen, F. E., & Miller, J. P. (1991). Representation of sensory information inthe cricket cercal sensory system. II. Information theoretic calculation of sys-tem accuracy and optimal tuning-curve widths of four primary interneurons. J.Neurophysiol., 66, 1690–1703.
Theunissen, F., Roddey, J. C., Stufflebeam, S., Clague, H., & Miller, J. P. (1996).Information theoretic analysis of dynamical encoding by four identified pri-mary sensory interneurons in the cricket cercal system. J. Neurophysiol., 75, 1345–1364.
Tiesinga, P. H. (2001). Information transmission and recovery in neural communica-tion channels revisited. Phys. Rev. E Stat. Nonlin. Soft Matter Phys., 64, 012901.
Tiesinga, P. H., Fellous, J. M., Jose, J. V., & Sejnowski, T. J. (2002). Information transferin entrained cortical neurons. Network, 13, 41–66.
Tiesinga, P. H., & Toups, J. V. (2005). The possible role of spike patterns in corticalinformation processing. J. Comput. Neurosci., 18, 275–286.
Treves, A., & Panzeri, S. (1995). The upward bias in measures of information derivedfrom limited data samples. Neural Comput., 7, 399–407.
Treves, A., Panzeri, S., Rolls, E. T., Booth, M., & Wakeman, E. A. (1999). Firingrate distributions and efficiency of information transmission of inferior temporalcortex neurons to natural visual stimuli. Neural Comput., 11, 601–632.
Treves, A., & Rolls, E. T. (1991). What determines the capacity of autoassociativememories in the brain? Network, 2, 371–398
Tsodyks, M. V., & Markram, H. (1997). The neural code between neocortical pyra-midal neurons depends on neurotransmitter release probability. Proc. Natl. Acad.Sci. USA, 94, 719–723.
Vos, B. P., Wijnants, M., Taeymans, S., & de Schutter, E. (1999). Miniature carrier withsix independently moveable electrodes for recording of multiple single-units inthe cerebellar cortex of awake rats. J. Neurosci. Methods, 94, 19–26.
NECO_a_00006-Arleo neco.cls April 26, 2010 22:18
Unc
orre
cted
Proo
f
28 A. Arleo et al.
Wan, Y. H., Jian, Z., Wen, Z. H., Wang, Y. Y., Han, S., Duan, Y. B., et al. (2004).Synaptic transmission of chaotic spike trains between primary afferent fiber andspinal dorsal horn neuron in the rat. Neuroscience, 125, 1051–1060.
Zador, A. (1998). Impact of synaptic unreliability on the information transmitted byspiking neurons. J. Neurophysiol., 79, 1219–1229.
Received September 18, 2007; accepted February 16, 2010.