Embed Size (px)
Citation preview
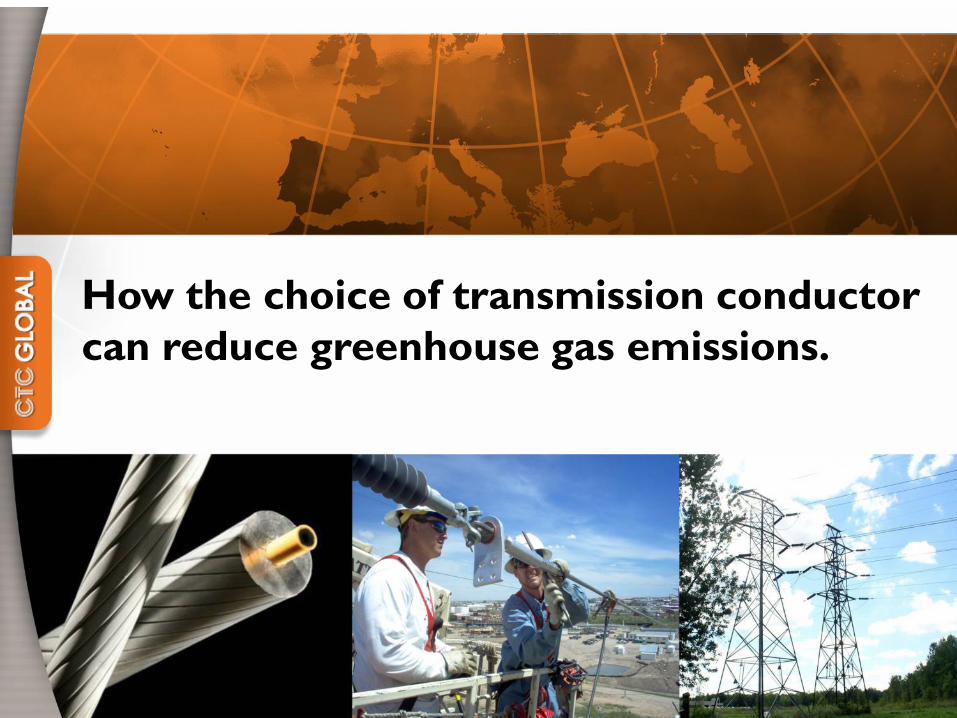
How the choice of transmission conductor
can reduce greenhouse gas emissions.
What is the scope of the impact?
ctcglobal.com | 1.800.555.12122
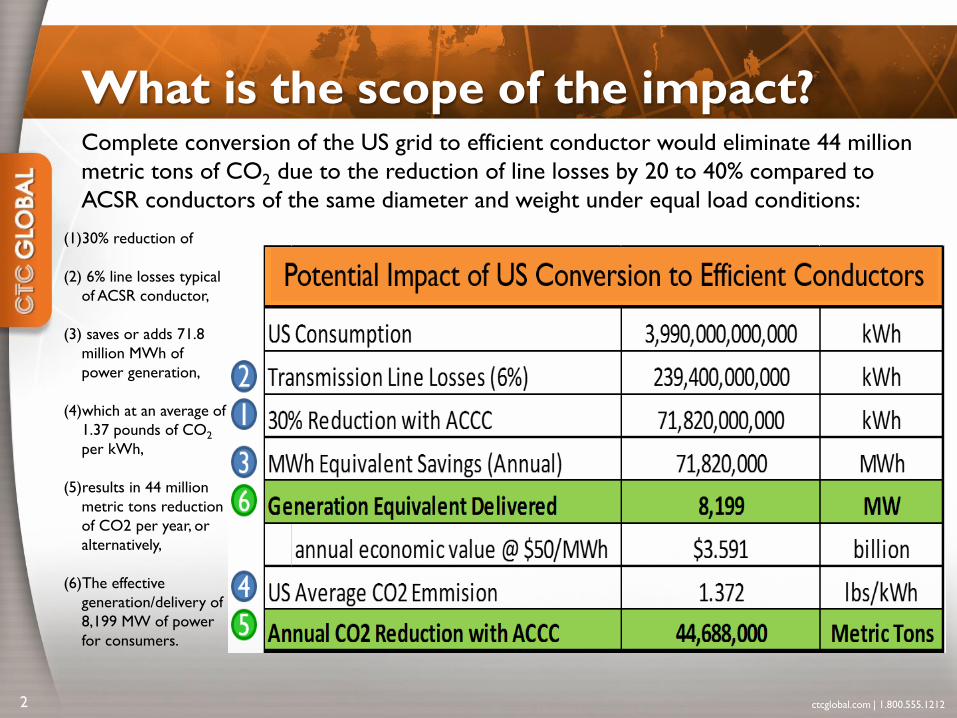
Complete conversion of the US grid to efficient conductor would eliminate 44 million
metric tons of CO2 due to the reduction of line losses by 20 to 40% compared to
ACSR conductors of the same diameter and weight under equal load conditions:
1
2
3
4
5
(1)30% reduction of
(2) 6% line losses typical
of ACSR conductor,
(3) saves or adds 71.8
million MWh of
power generation,
(4)which at an average of
1.37 pounds of CO2
per kWh,
(5)results in 44 million
metric tons reduction
of CO2 per year, or
alternatively,
(6)The effective
generation/delivery of
8,199 MW of power
for consumers.
6
US Consumption 3,990,000,000,000 kWh
Transmission Line Losses (6%) 239,400,000,000 kWh
30% Reduction with ACCC 71,820,000,000 kWh
MWh Equivalent Savings (Annual) 71,820,000 MWh
Generation Equivalent Delivered 8,199 MW
annual economic value @ $50/MWh $3.591 billion
US Average CO2 Emmision 1.372 lbs/kWh
Annual CO2 Reduction with ACCC 44,688,000 Metric Tons
equivalent cars removed 8,593,846 cars
equivalent houses powered 7,378,767 houses
equivalent oil saved (annual) 294,883,129 barrels
Potential Impact of US Conversion to ACCC® ConductorPotential Impact of US Conversion to Efficient Conductors
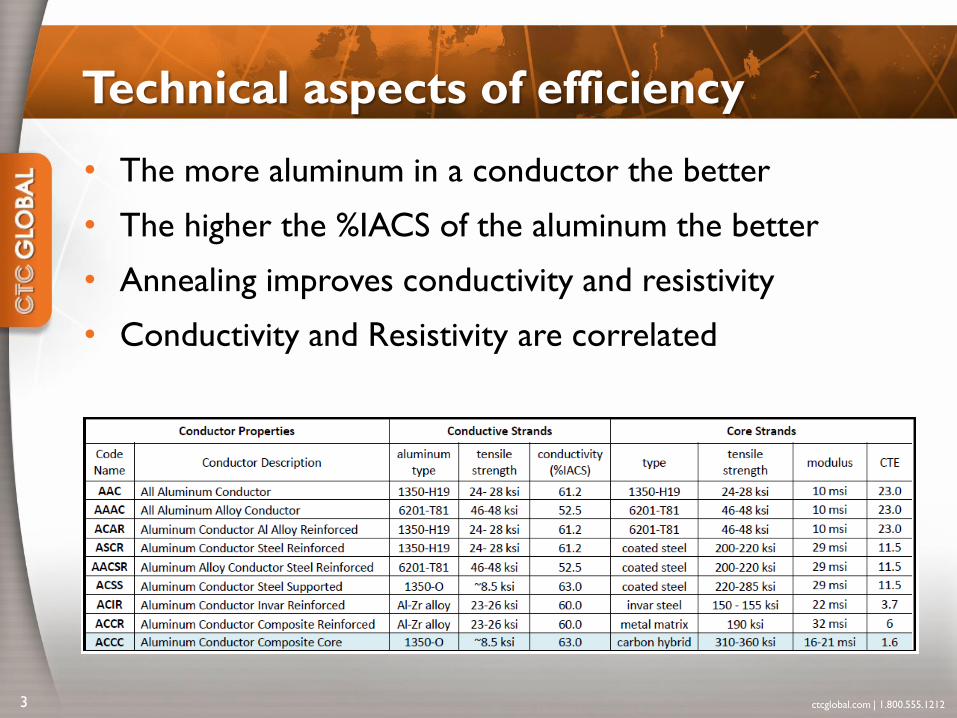
Technical aspects of efficiency
• The more aluminum in a conductor the better
• The higher the %IACS of the aluminum the better
• Annealing improves conductivity and resistivity
• Conductivity and Resistivity are correlated
ctcglobal.com | 1.800.555.12123
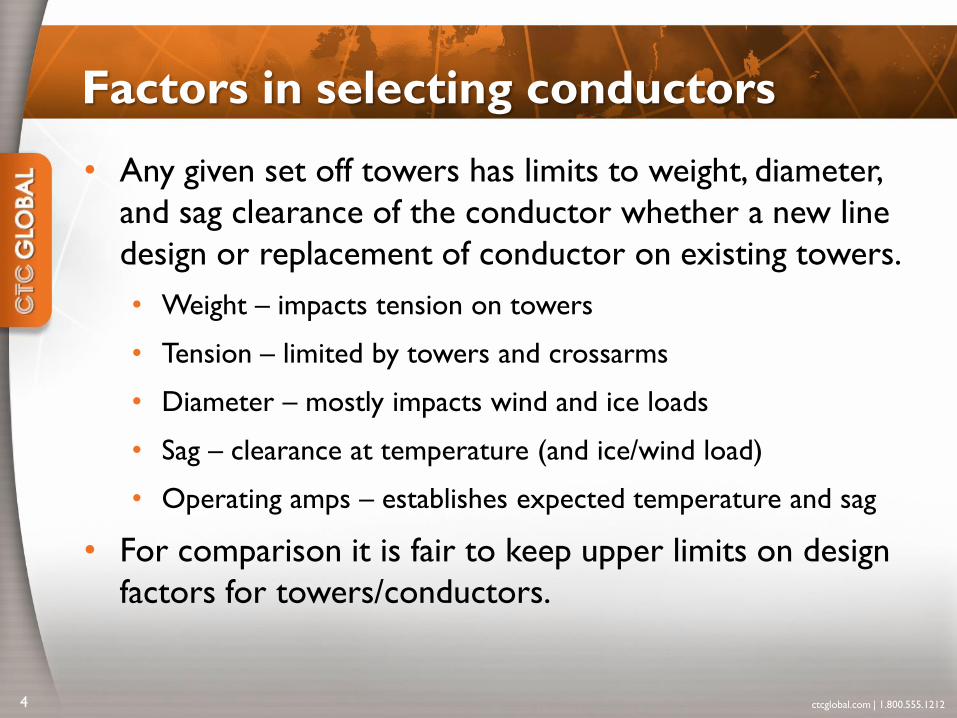
Factors in selecting conductors
• Any given set off towers has limits to weight, diameter,
and sag clearance of the conductor whether a new line
design or replacement of conductor on existing towers.
• Weight – impacts tension on towers
• Tension – limited by towers and crossarms
• Diameter – mostly impacts wind and ice loads
• Sag – clearance at temperature (and ice/wind load)
• Operating amps – establishes expected temperature and sag
• For comparison it is fair to keep upper limits on design
factors for towers/conductors.
ctcglobal.com | 1.800.555.12124
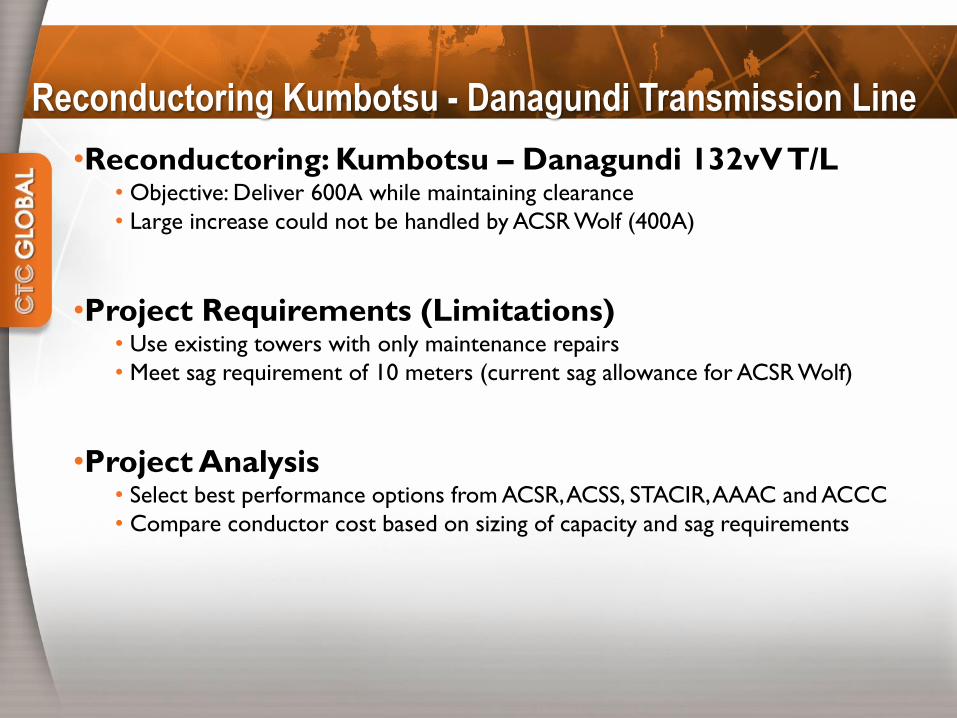
Reconductoring Kumbotsu - Danagundi Transmission Line
•Reconductoring: Kumbotsu – Danagundi 132vV T/L• Objective: Deliver 600A while maintaining clearance
• Large increase could not be handled by ACSR Wolf (400A)
•Project Requirements (Limitations)• Use existing towers with only maintenance repairs
• Meet sag requirement of 10 meters (current sag allowance for ACSR Wolf)
•Project Analysis• Select best performance options from ACSR, ACSS, STACIR, AAAC and ACCC
• Compare conductor cost based on sizing of capacity and sag requirements
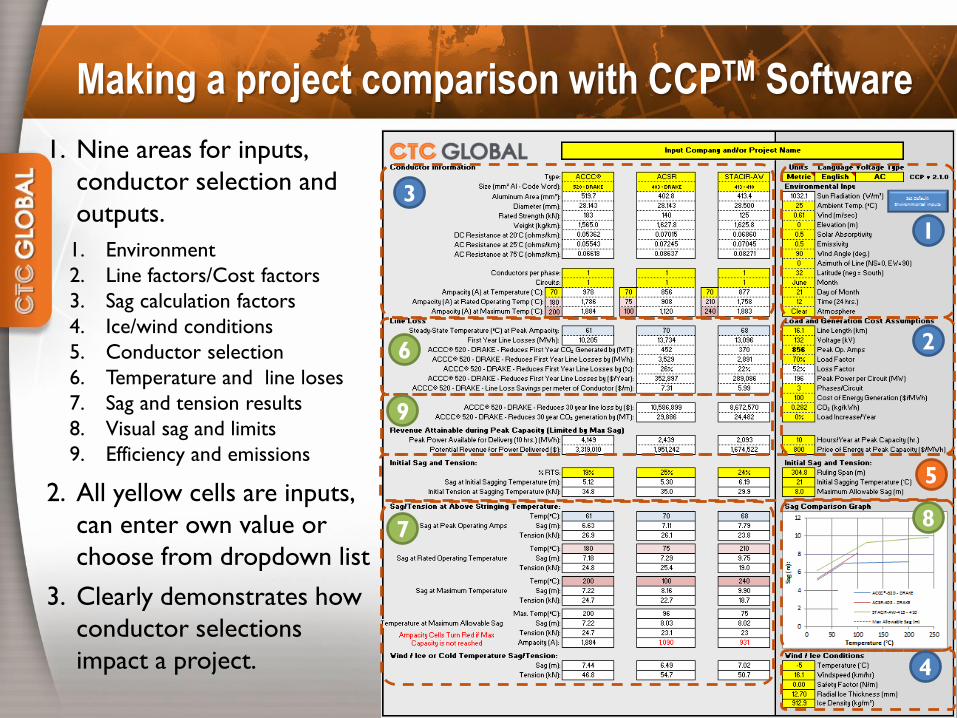
Making a project comparison with CCPTM Software
1. Nine areas for inputs,
conductor selection and
outputs.
1. Environment
2. Line factors/Cost factors
3. Sag calculation factors
4. Ice/wind conditions
5. Conductor selection
6. Temperature and line loses
7. Sag and tension results
8. Visual sag and limits
9. Efficiency and emissions
2. All yellow cells are inputs,
can enter own value or
choose from dropdown list
3. Clearly demonstrates how
conductor selections
impact a project.
1
2
5
6
78
4
9
3
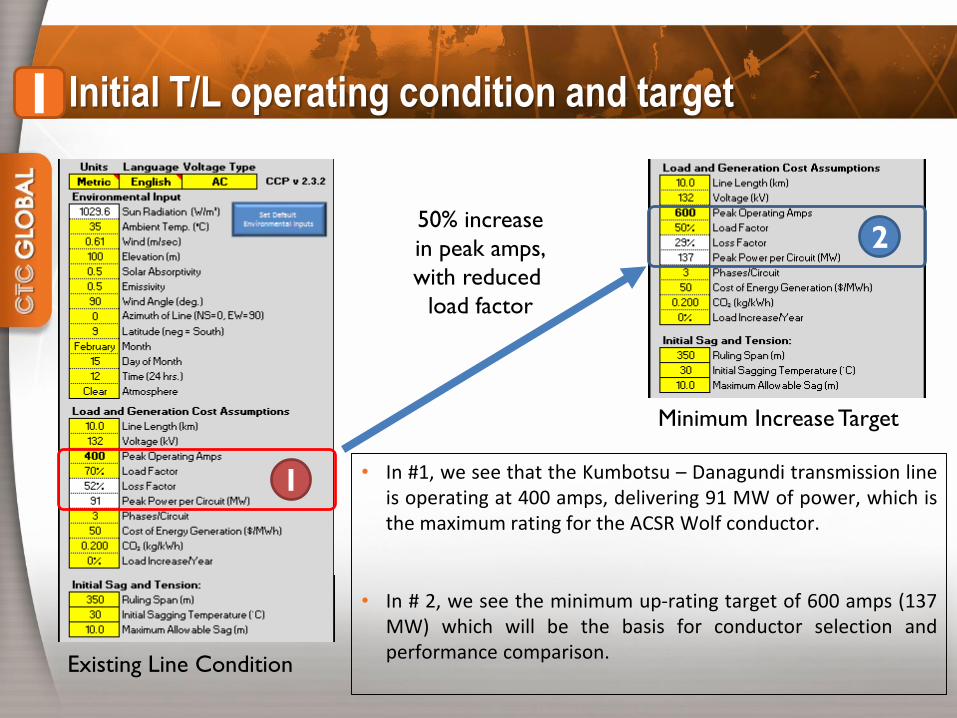
Initial T/L operating condition and target1
• In #1, we see that the Kumbotsu – Danagundi transmission lineis operating at 400 amps, delivering 91 MW of power, which isthe maximum rating for the ACSR Wolf conductor.
• In # 2, we see the minimum up-rating target of 600 amps (137MW) which will be the basis for conductor selection andperformance comparison.
Existing Line Condition
Minimum Increase Target
2
1
50% increase
in peak amps,
with reduced
load factor
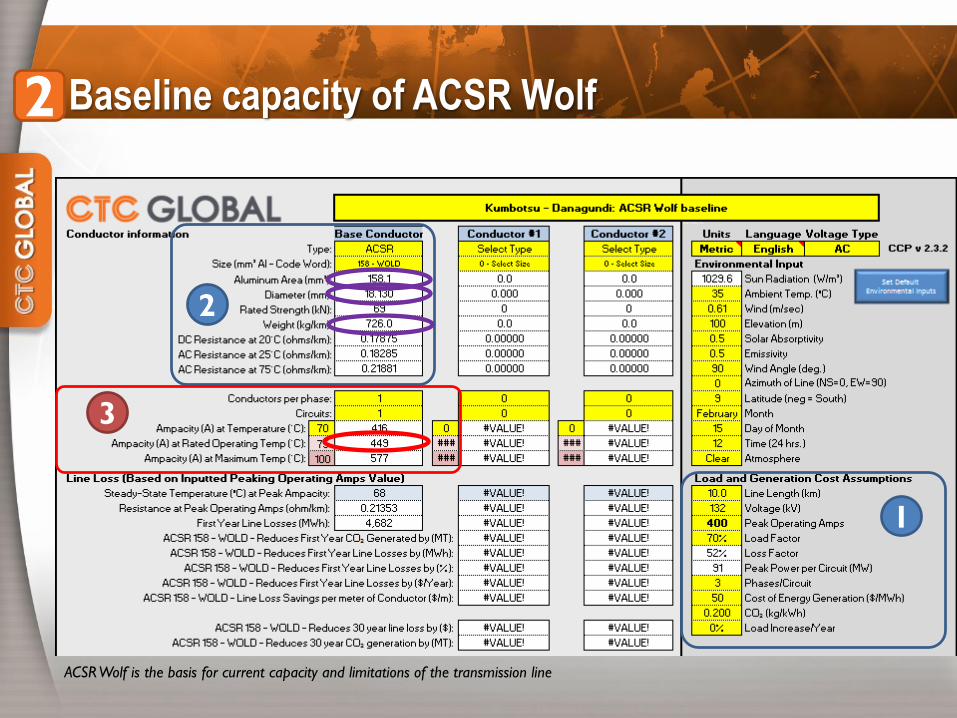
Baseline capacity of ACSR Wolf2
1
3
2
ACSR Wolf is the basis for current capacity and limitations of the transmission line
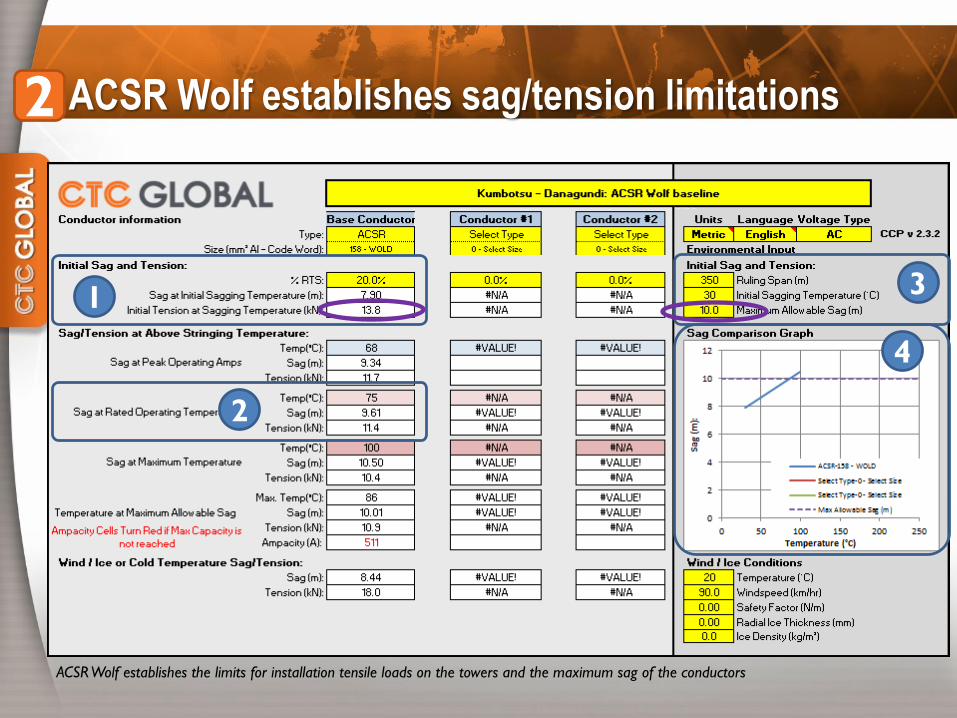
ACSR Wolf establishes sag/tension limitations2
1
2
4
3
ACSR Wolf establishes the limits for installation tensile loads on the towers and the maximum sag of the conductors
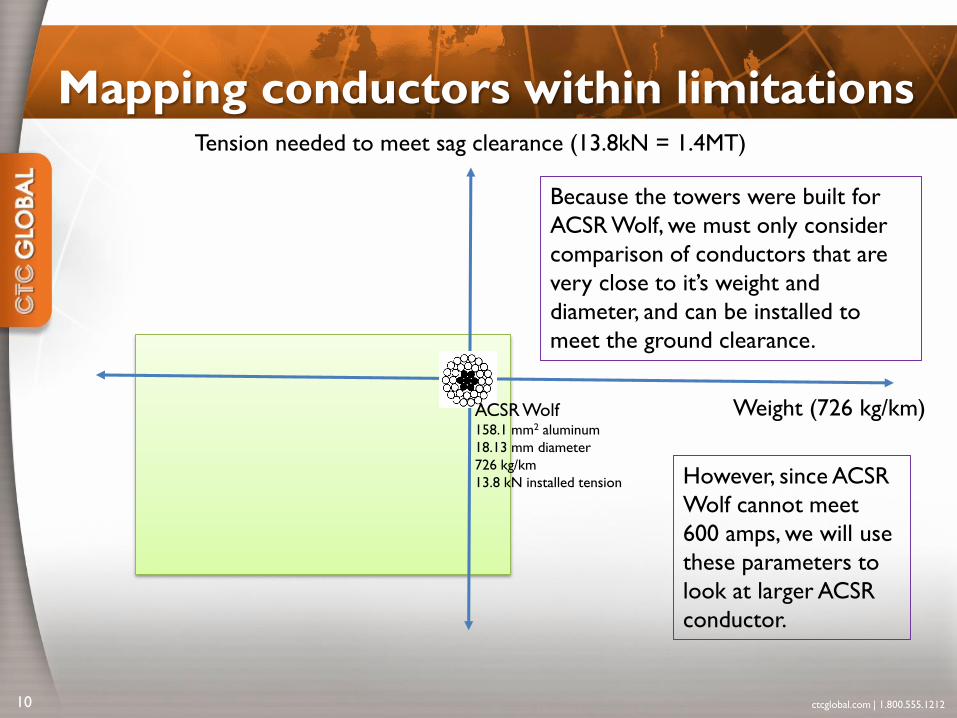
Mapping conductors within limitations
ctcglobal.com | 1.800.555.121210
Tension needed to meet sag clearance (13.8kN = 1.4MT)
Weight (726 kg/km) ACSR Wolf158.1 mm2 aluminum
18.13 mm diameter
726 kg/km
13.8 kN installed tension
Because the towers were built for
ACSR Wolf, we must only consider
comparison of conductors that are
very close to it’s weight and
diameter, and can be installed to
meet the ground clearance.
However, since ACSR
Wolf cannot meet
600 amps, we will use
these parameters to
look at larger ACSR
conductor.
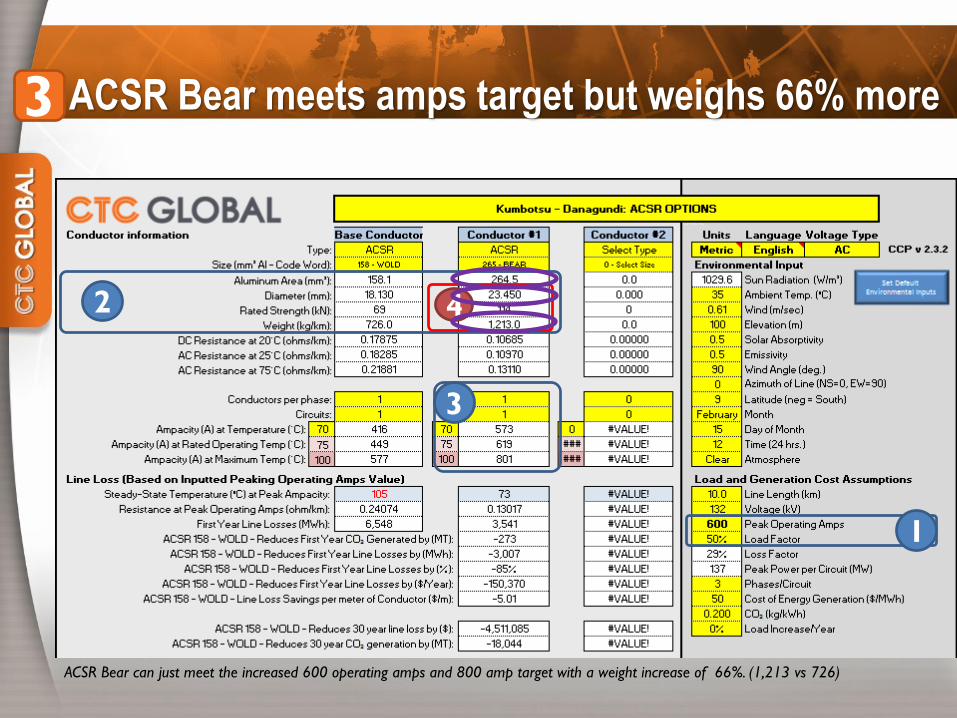
ACSR Bear meets amps target but weighs 66% more3
ACSR Bear can just meet the increased 600 operating amps and 800 amp target with a weight increase of 66%. (1,213 vs 726)
2
3
4
1
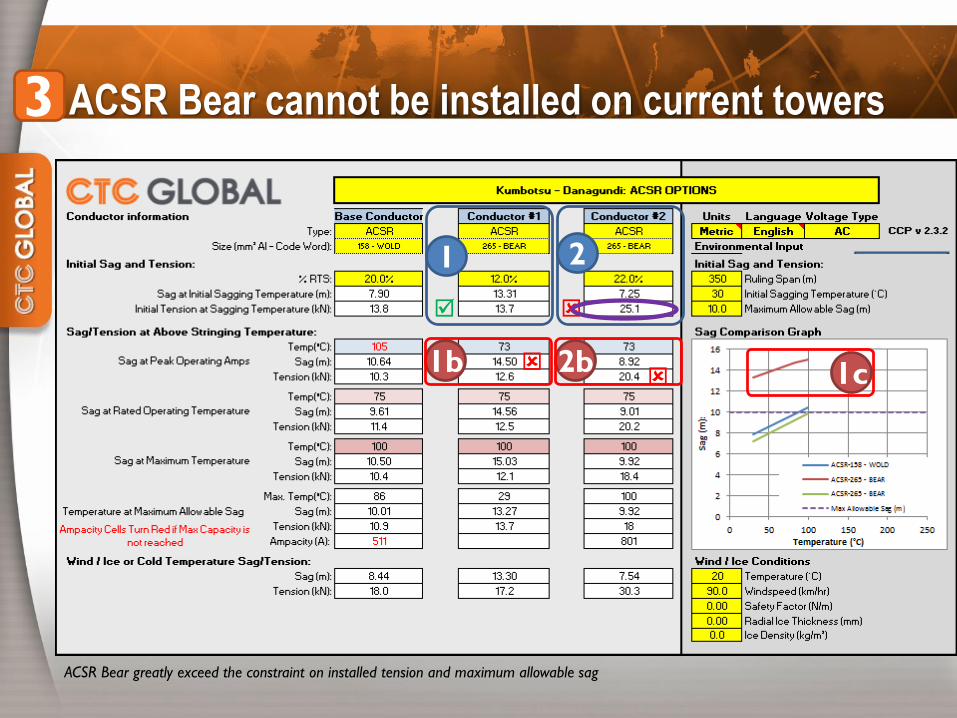
ACSR Bear cannot be installed on current towers3
ACSR Bear greatly exceed the constraint on installed tension and maximum allowable sag
1 2
1b 2b 1c
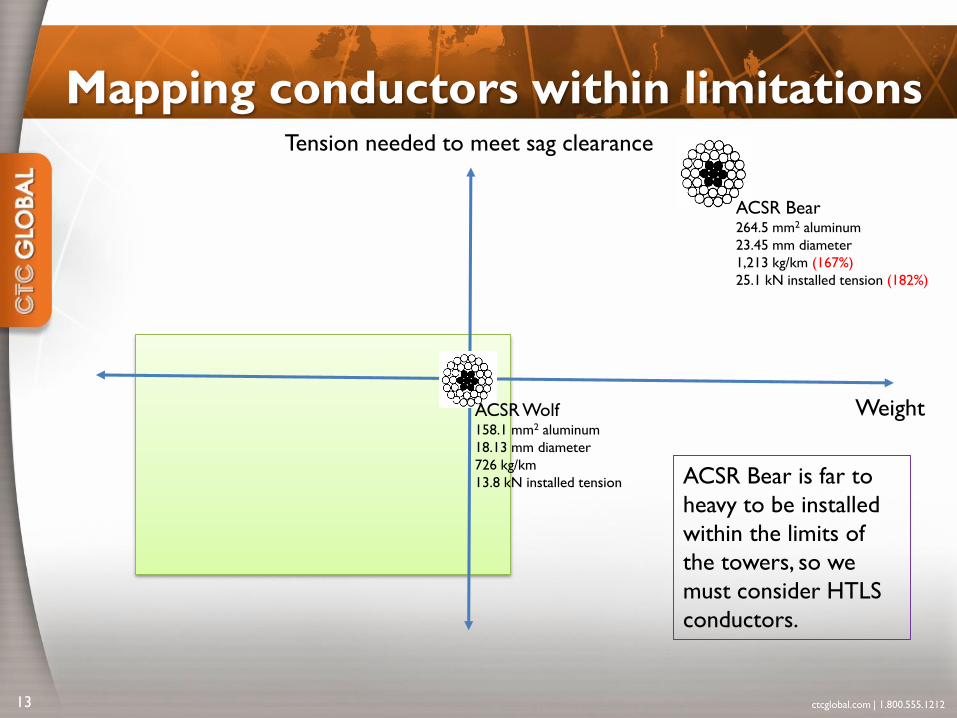
Mapping conductors within limitations
ctcglobal.com | 1.800.555.121213
Tension needed to meet sag clearance
Weight ACSR Wolf158.1 mm2 aluminum
18.13 mm diameter
726 kg/km
13.8 kN installed tension
ACSR Bear264.5 mm2 aluminum
23.45 mm diameter
1,213 kg/km (167%)
25.1 kN installed tension (182%)
ACSR Bear is far to
heavy to be installed
within the limits of
the towers, so we
must consider HTLS
conductors.
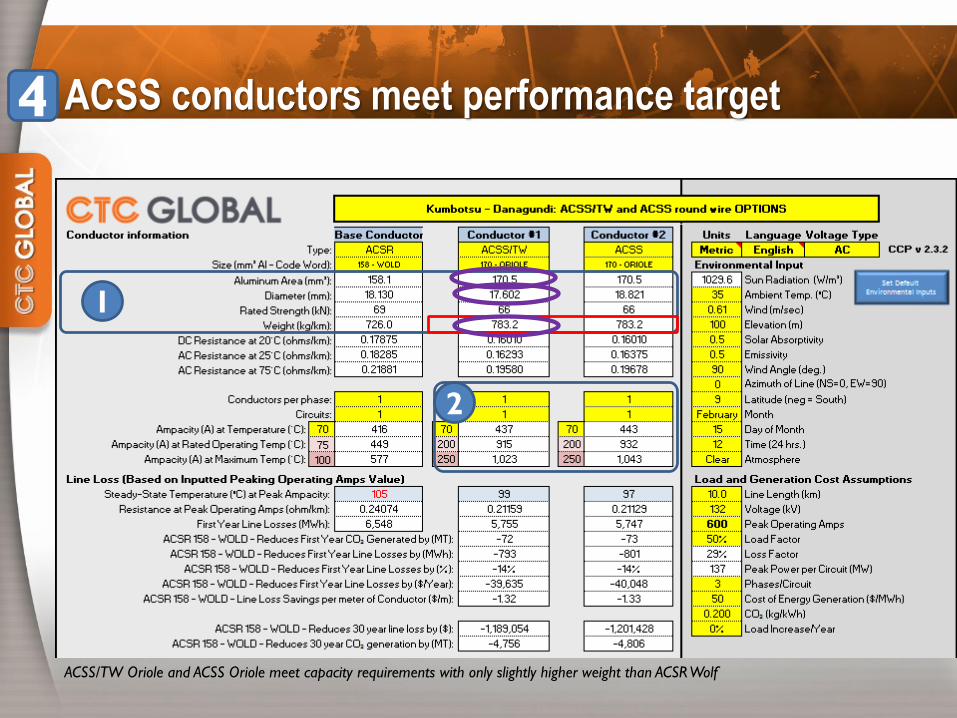
ACSS conductors meet performance target4
ACSS/TW Oriole and ACSS Oriole meet capacity requirements with only slightly higher weight than ACSR Wolf
1
2
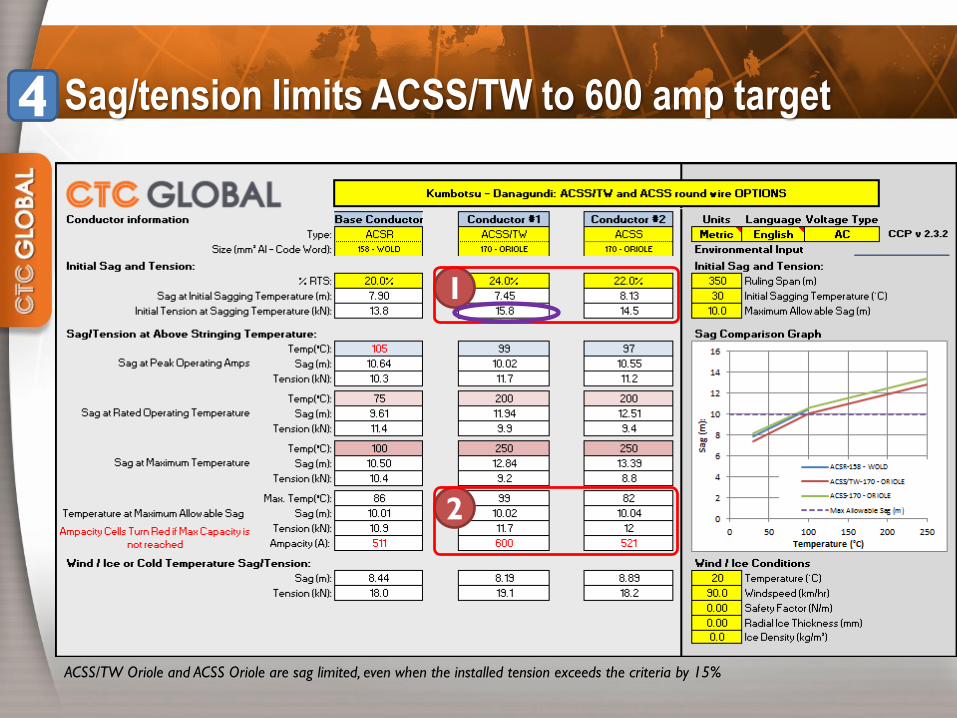
Sag/tension limits ACSS/TW to 600 amp target4
ACSS/TW Oriole and ACSS Oriole are sag limited, even when the installed tension exceeds the criteria by 15%
2
1
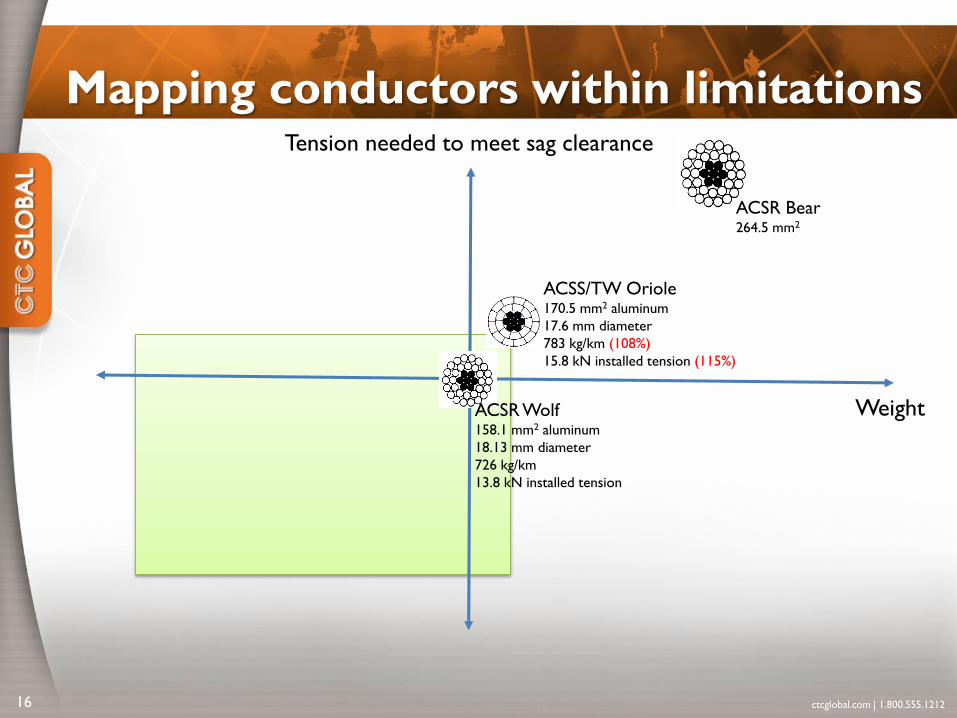
Mapping conductors within limitations
ctcglobal.com | 1.800.555.121216
Tension needed to meet sag clearance
Weight ACSR Wolf158.1 mm2 aluminum
18.13 mm diameter
726 kg/km
13.8 kN installed tension
ACSR Bear264.5 mm2
ACSS/TW Oriole170.5 mm2 aluminum
17.6 mm diameter
783 kg/km (108%)
15.8 kN installed tension (115%)
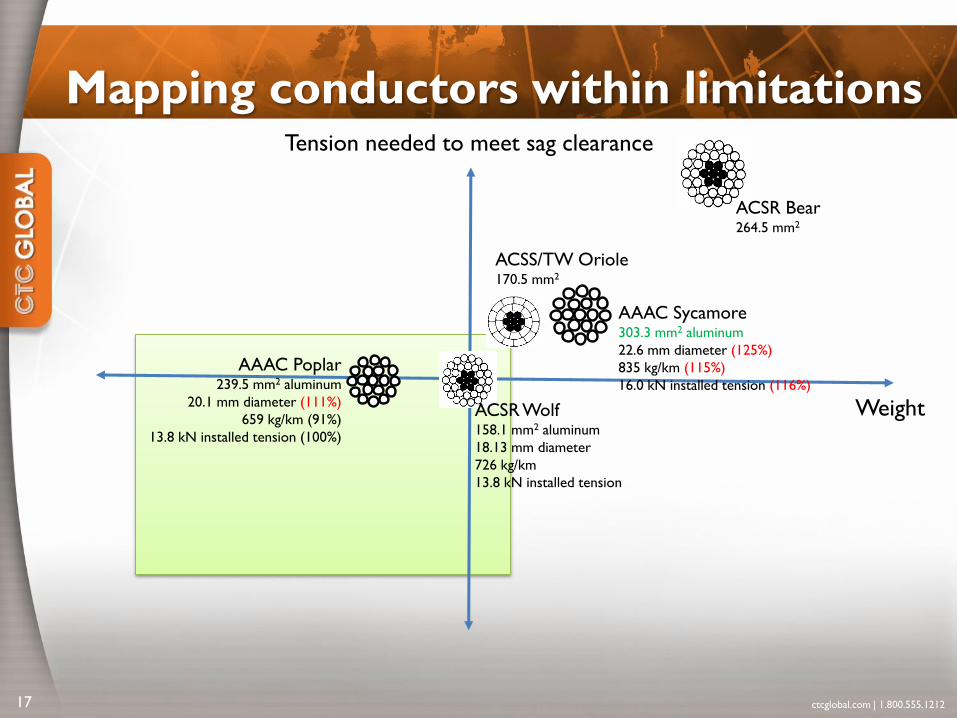
Mapping conductors within limitations
ctcglobal.com | 1.800.555.121217
Tension needed to meet sag clearance
Weight ACSR Wolf158.1 mm2 aluminum
18.13 mm diameter
726 kg/km
13.8 kN installed tension
ACSR Bear264.5 mm2
ACSS/TW Oriole170.5 mm2
AAAC Sycamore303.3 mm2 aluminum
22.6 mm diameter (125%)
835 kg/km (115%)
16.0 kN installed tension (116%)
AAAC Poplar239.5 mm2 aluminum
20.1 mm diameter (111%)
659 kg/km (91%)
13.8 kN installed tension (100%)
Mapping conductors within limitations
ctcglobal.com | 1.800.555.121218
Tension needed to meet sag clearance
Weight ACSR Wolf158.1 mm2 aluminum
18.13 mm diameter
726 kg/km
13.8 kN installed tension
ACSR Bear264.5 mm2
ACSS/TW Oriole170.5 mm2
STACIR (invar) 160159.3 mm2 aluminum
18.2 mm diameter
706.8 kg/km (97%)
14.0 kN installed tension (101%)
AAAC Sycamore303.3 mm2
AAAC Poplar239.5 mm2
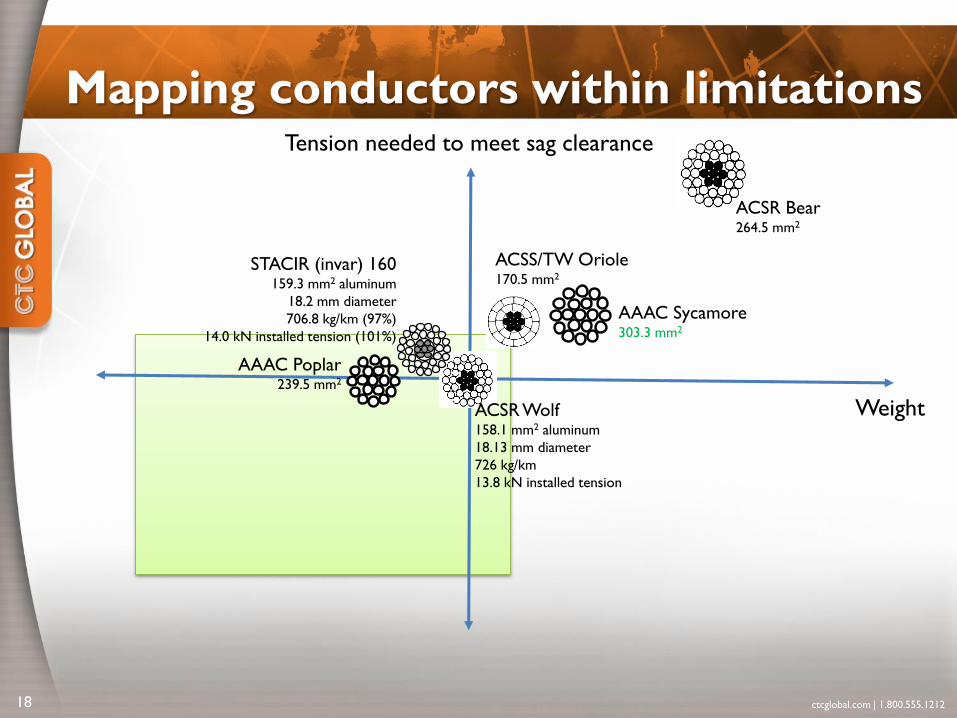
Mapping conductors within limitations
ctcglobal.com | 1.800.555.121219
Tension needed to meet sag clearance
Weight ACSR Wolf158.1 mm2 aluminum
18.13 mm diameter
726 kg/km
13.8 kN installed tension
ACSR Bear264.5 mm2
ACSS/TW Oriole170.5 mm2
STACIR (invar) 160159.3 mm2
AAAC Sycamore303.3 mm2
AAAC Poplar239.5 mm2
ACCC® Oriole222.3 mm2 aluminum
18.8 mm diameter (104%)
689 kg/km (95%)
13.8 kN installed tension (100%)
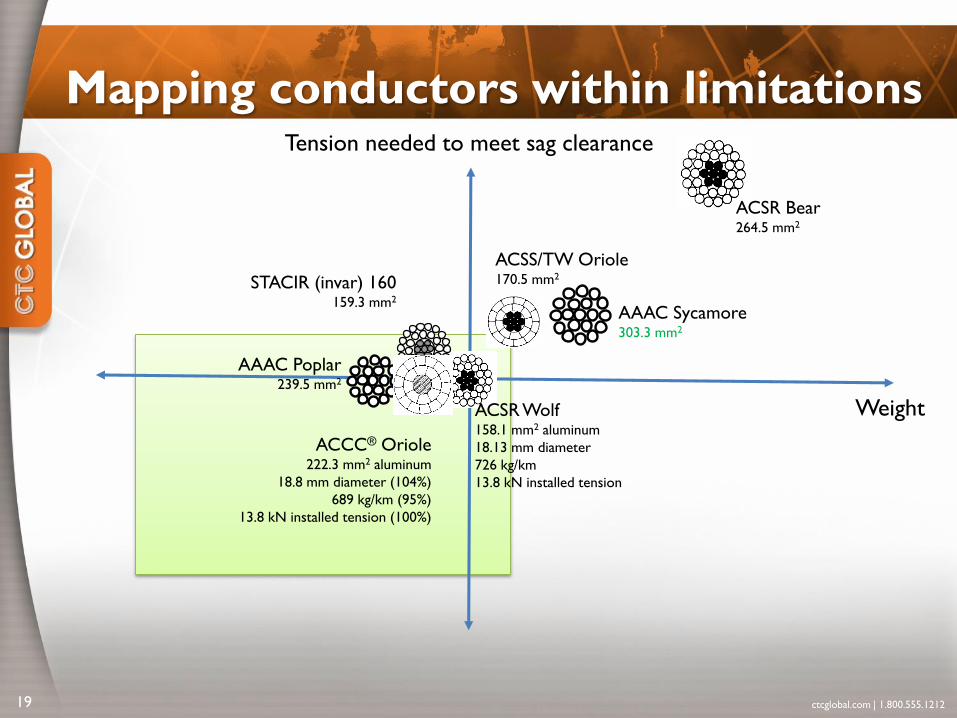
Mapping conductors within limitations
ctcglobal.com | 1.800.555.121220
Tension needed to meet sag clearance
Weight ACSR Wolf158.1 mm2 aluminum
18.13 mm diameter
726 kg/km
13.8 kN installed tension
ACSR Bear264.5 mm2
ACSS/TW Oriole170.5 mm2
STACIR (invar) 160159.3 mm2
AAAC Sycamore303.3 mm2
AAAC Poplar239.5 mm2
ACCC® Oriole222.3 mm2 aluminum
18.8 mm diameter (104%)
689 kg/km (95%)
13.8 kN installed tension (100%)
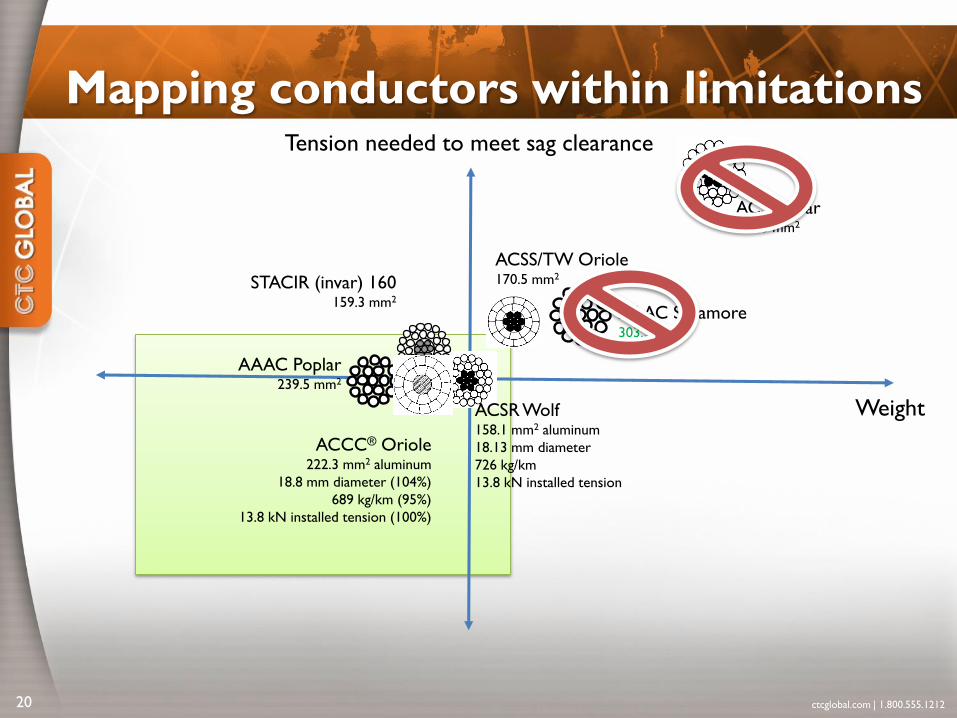
Mapping conductors within limitations
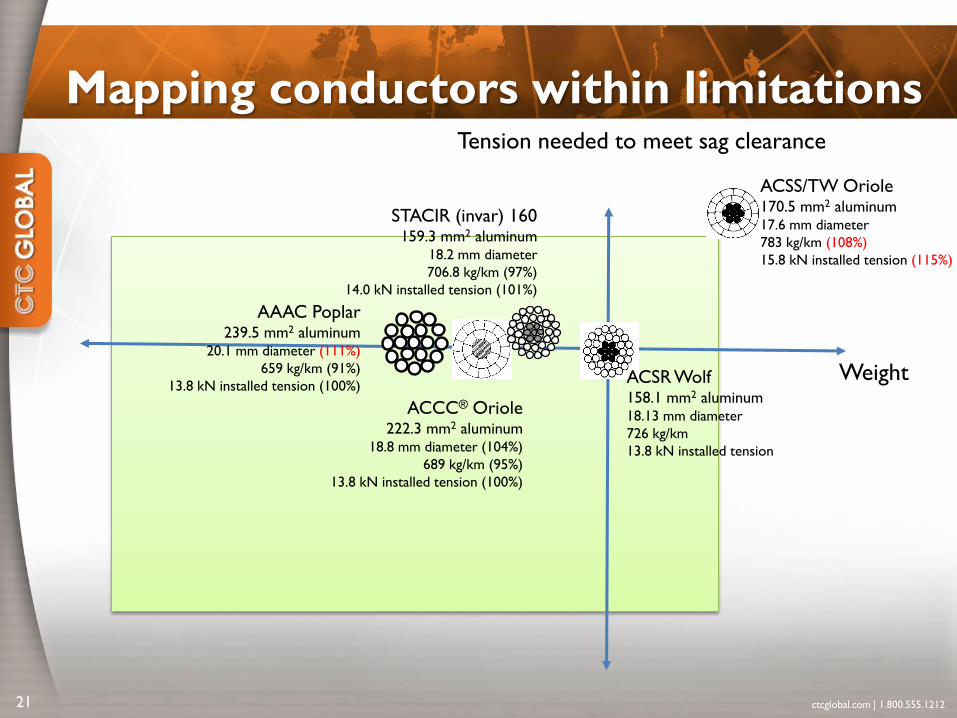
ctcglobal.com | 1.800.555.121221
Tension needed to meet sag clearance
Weight ACSR Wolf158.1 mm2 aluminum18.13 mm diameter
726 kg/km
13.8 kN installed tension
ACCC® Oriole222.3 mm2 aluminum
18.8 mm diameter (104%)
689 kg/km (95%)
13.8 kN installed tension (100%)
ACSS/TW Oriole170.5 mm2 aluminum17.6 mm diameter
783 kg/km (108%)
15.8 kN installed tension (115%)
STACIR (invar) 160159.3 mm2 aluminum
18.2 mm diameter
706.8 kg/km (97%)
14.0 kN installed tension (101%)
AAAC Poplar239.5 mm2 aluminum
20.1 mm diameter (111%)
659 kg/km (91%)
13.8 kN installed tension (100%)
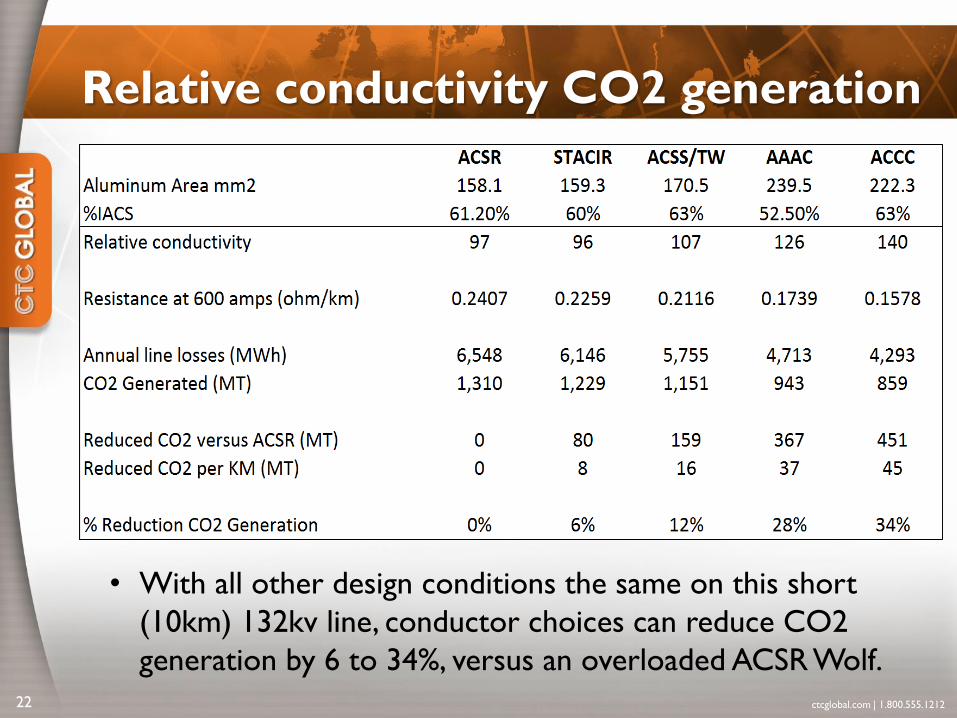
Relative conductivity CO2 generation
ctcglobal.com | 1.800.555.121222
• With all other design conditions the same on this short
(10km) 132kv line, conductor choices can reduce CO2
generation by 6 to 34%, versus an overloaded ACSR Wolf.
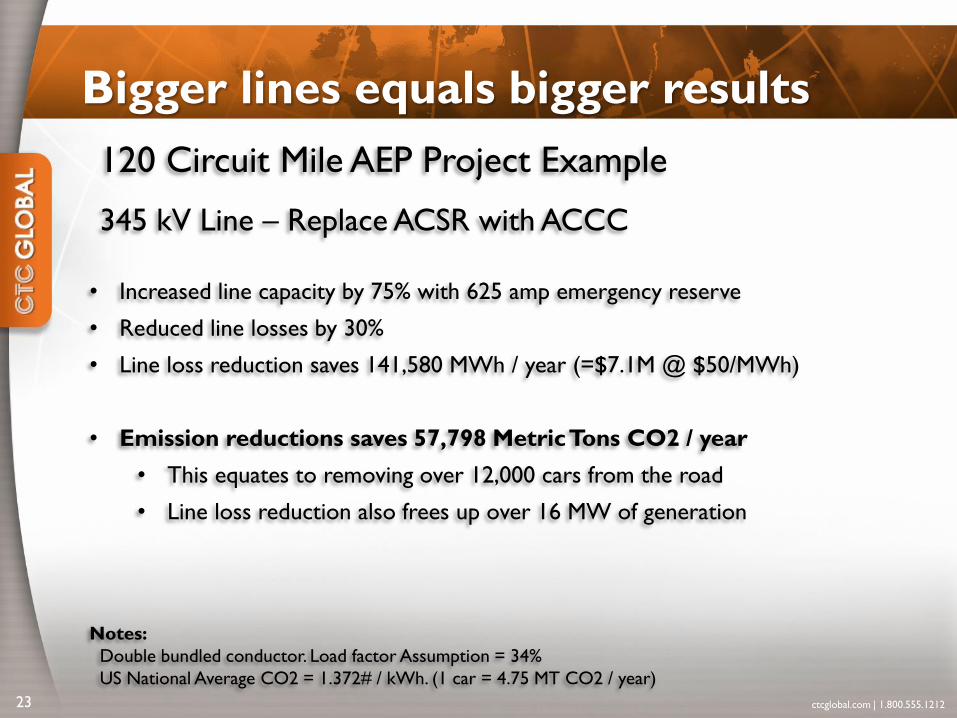
Bigger lines equals bigger results
ctcglobal.com | 1.800.555.121223
• Increased line capacity by 75% with 625 amp emergency reserve
• Reduced line losses by 30%
• Line loss reduction saves 141,580 MWh / year (=$7.1M @ $50/MWh)
• Emission reductions saves 57,798 Metric Tons CO2 / year
• This equates to removing over 12,000 cars from the road
• Line loss reduction also frees up over 16 MW of generation
Notes:
Double bundled conductor. Load factor Assumption = 34%
US National Average CO2 = 1.372# / kWh. (1 car = 4.75 MT CO2 / year)
345 kV Line – Replace ACSR with ACCC
120 Circuit Mile AEP Project Example
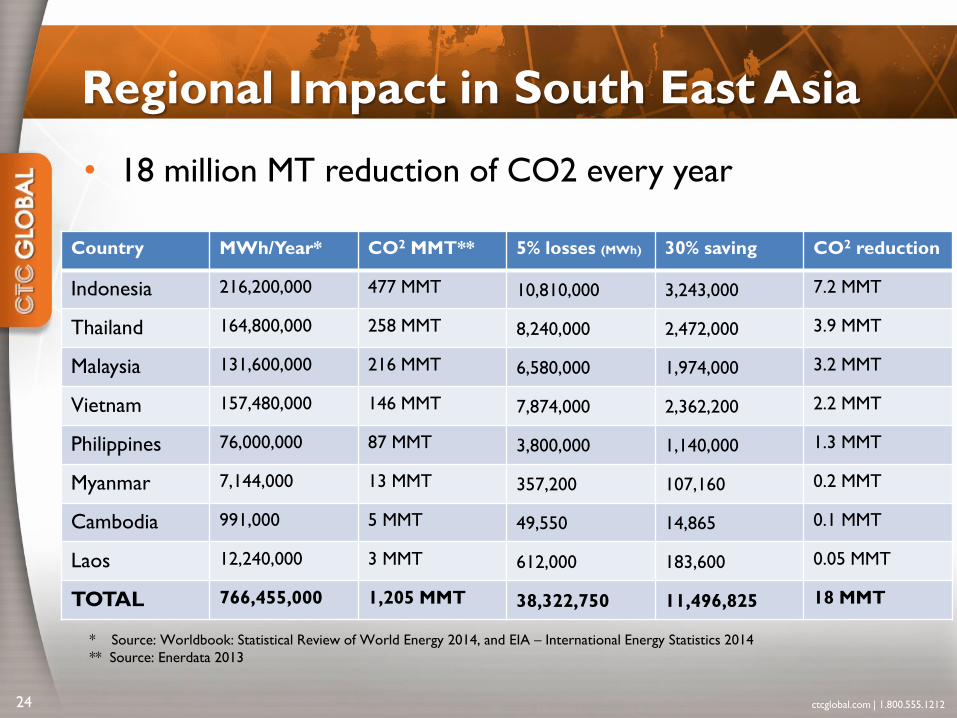
Regional Impact in South East Asia
ctcglobal.com | 1.800.555.121224
Country MWh/Year* CO2 MMT** 5% losses (MWh) 30% saving CO2 reduction
Indonesia 216,200,000 477 MMT 10,810,000 3,243,000 7.2 MMT
Thailand 164,800,000 258 MMT 8,240,000 2,472,000 3.9 MMT
Malaysia 131,600,000 216 MMT 6,580,000 1,974,000 3.2 MMT
Vietnam 157,480,000 146 MMT 7,874,000 2,362,200 2.2 MMT
Philippines 76,000,000 87 MMT 3,800,000 1,140,000 1.3 MMT
Myanmar 7,144,000 13 MMT 357,200 107,160 0.2 MMT
Cambodia 991,000 5 MMT 49,550 14,865 0.1 MMT
Laos 12,240,000 3 MMT 612,000 183,600 0.05 MMT
TOTAL 766,455,000 1,205 MMT 38,322,750 11,496,825 18 MMT
* Source: Worldbook: Statistical Review of World Energy 2014, and EIA – International Energy Statistics 2014
** Source: Enerdata 2013
• 18 million MT reduction of CO2 every year
1-2% lower GHG generation
• Using or changing to efficient conductors reduces line
losses by 1 – 2 % and CO2 generation by the same
amount.
• Renewable generation benefits through 1-2% more
delivered power.
• Better efficiency and better return on capital projects
go hand in hand (it is not double counting), so efficiency
also generates more profitability for minimal capital cost
increase.
ctcglobal.com | 1.800.555.121225