Embed Size (px)
Citation preview
How the Global Oilseed and Grain Trade Works
Prepared for:
Prepared by:
The United Soybean Board (USB) is a farmer-led organization comprised of 68 farmer-directors who oversee the investments of the soybean checkoff for all U.S. soybean farmers. Soybean farmers are united by a commitment to produce wholesome, nutritious foods that can help sustain and nourish an ever-increasing population. And, soybean growers take pride in their role in producing one of the healthiest food crops in the world. USB has invested millions of dollars into health and nutrition research related to soy. For more information, please visit www.soyconnection.com.
United Soybean Board 16640 Chesterfield Grove Road, Suite 130 Chesterfield MO 63005-1422 Tel: 800 989 USB1 (8721) Fax: 636 530 1560 http://www.unitedsoybean.com
The U.S. Soybean Export Council (USSEC) is a dynamic partnership of key stakeholders representing soybean producers, commodity shippers, identity preserved value-added merchandisers, allied agribusinesses and agricultural organizations. Through its global network of international offices, operating overseas as the American Soybean Association-International Marketing, activities are carried out that will create and sustain demand for U.S. soybeans and soybean products. For more information, please visit www.ussec.org.
U.S. Soybean Export Council 12125 Woodcrest Executive Drive, Ste 140 St. Louis MO 63141 Tel: 314 985 0988 Main: 800 408 4993 Fax: 314 754 1351 www.ussec.org
HighQuest Partners is a strategic advisors and management consulting firm that helps executives and managers at global companies to make decisions about strategy development, M&A support & diligence, and corporate governance initiatives. Since 2000, we have completed over 220 consulting and research assignments for strategic and financial industry players and their subsidiaries in the food, agribusiness, agriculture, oilseed, biofuels, and industrial industries.
HighQuest Partners LLC 458 Boston Street, Suite 2-6 Topsfield MA 01983 Tel: 978 887 8800 Fax: 978 887 8839
Soyatech, LLC is an internationally recognized publishing, media and event firm devoted to sustainable development in the soybean, oilseed , agribusiness, food, and biofuels industries. For 25 years, Soyatech’s products and services for the global soybean and oilseed industry have fostered growth in food, feed and renewable energy markets. Drawing on its deep industry knowledge, Soyatech pro-duces the well known “Soya & Oilseed Bluebook,” an industry leading information directory, news services, industry conferences and webinars, and syndicated and custom research & consulting trusted by prominent clients including Fortune 500 companies, research institutions, financial institutions, and the media.
Soyatech, LLC PO Box 1307 Southwest Harbor ME 04679 Tel: 207 288 4969
Prepared for:
Prepared by:
© 2008 U. S. Soybean Export Council
�
Introduction . . . . . . . . . . . . . . . . . . . . .5History of the Soybean Trade . . . . . . . . . . 5
Modern Uses of Soybeans . . . . . . . . . . . . 5
Trends and Developments Affecting the Use of Soybeans . . . . . . . . . . . . . . . 6
Recent Trends in Trade . . . . . . . . . . . . . . 6
Overview of Major Origination and Consumption Countries . . . . . . . . . . . . . . . . . . 8
Section 1 Competitiveness of Soybeans and Other Oilseeds . . . 10
Competitive Oilseeds . . . . . . . . . . . . . . 10
Protein and Oil Content . . . . . . . . . . . . . 11
Section 2 Seed Technology . . . . . . . . . . . . . . . . . . 12
Major Players in Seed Technology: Monsanto, DuPont and Syngenta . . . . . . . 12
Research and Development in Seeds . . . . . . . 12
Relationships with Major Soybean Processors . . 13
Persuading Farmers to Use New Seeds . . . . . . 14
Profits and Premiums . . . . . . . . . . . . . . 14
Impact of Traits on Production Techniques and Sustainability . . . . . . . . . . . . . . 15
Successes and Barriers to Entry. . . . . . . . . . 15
Section � Production-Growers. . . . . . . . . . . . . . . . . 17
World Soybean Growing Regions . . . . . . . . 17
Factors That Explain the Ongoing Shift in World Production to Brazil and Argentina . . . 17
U.S. Soybean Growing Regions . . . . . . . . . 19
The Grower’s Role in the Global Soybean Trade 19
Planting Decisions . . . . . . . . . . . . . . . . 20
Seeds and Crop Inputs . . . . . . . . . . . . . . 20
How and Where Growers Sell Their Crops . . . . 21
Section 4 Quality . . . . . . . . . . . . . . . . . . . . . . . 23
Soybean Quality. . . . . . . . . . . . . . . . . 23
Cleaning in Brazil and the U.S. . . . . . . . . . . 24
Soybean Meal Quality . . . . . . . . . . . . . . 25
Section 5 Grain Elevators . . . . . . . . . . . . . . . . . . . 27
Purchasing the Crop . . . . . . . . . . . . . . . 27
Elevator Marketing Options . . . . . . . . . . . 27
How Elevators Sell Their Crops . . . . . . . . . . 27
Blending . . . . . . . . . . . . . . . . . . . . 28
Interior Elevators, River Elevators and Export Terminals . . . . . . . . . . . . . . . 28
Section 6 Processor Soybean Crusher . . . . . . . . . . . . . 30
How a Soybean Processing Facility Operates . . . 30
5 Steps of Hexane Extraction. . . . . . . . . . . 30
Handling and Elevator Operations . . . . 30
Preparation and Conditioning . . . . . . 30
Solvent Extraction and Oil Desolventizing . 30
Flake Desolventizing . . . . . . . . . 30
Oil Refining . . . . . . . . . . . . . 31
Further Oil Processing . . . . . . . . . . . . . . 31
Crush Margin Review . . . . . . . . . . . . . . 31
Decision of When to Crush . . . . . . . . . . . 33
Selling End Products. . . . . . . . . . . . . . . 33
Pricing Each Leg of the Soybean Complex . . . . 34
Incidental Input Costs . . . . . . . . . . . . . . 35
Section 7 Transportation Logistics . . . . . . . . . . . . . . . 36
Transportation . . . . . . . . . . . . . . . . . 36
Growers. . . . . . . . . . . . . . . . . . . . . 36
Elevators . . . . . . . . . . . . . . . . . . . . 37
Soybean Processors . . . . . . . . . . . . . . . 38
International Sales . . . . . . . . . . . . . . . . 40
Section 8 Risk Management Tools . . . . . . . . . . . . . . . 42
Risk and Markets . . . . . . . . . . . . . . . . 42
Brief History of Agricultural Futures and Options 42
Brief Description of Each Financial Instrument . . 43
Futures . . . . . . . . . . . . . . . 43
Options on Futures . . . . . . . . . . 45
Commodity Swaps . . . . . . . . . . 46
Spreads / Straddles . . . . . . . . . . 46
Basis . . . . . . . . . . . . . . . . . . . . . . 47
Chicago Board of Trade Price. . . . . . . . . . . 47
Basis Impacting Trade Volumes . . . . . . . . . 49
Risk Management Tools . . . . . . . . . . . . . 49
How Commodity Funds and Indexes Affect Chicago Board of Trade Prices . . . . . . . . . 49
■
■
■
■
■
■
■
■
■
Table of Contents
© 2008 U. S. Soybean Export Council
4 How the Global Oilseed & Grain Trade Works
Section 9 End Customers and Users Soybeans, Soybean Meal and Soybean Oil . . . . . . 51
First-Tier Customers in Domestic Markets. . . . . 51
First-Tier Customers in the International Markets 52
Soybeans . . . . . . . . . . . . . . 52
Soybean Meal . . . . . . . . . . . . 52
Soybean Oil . . . . . . . . . . . . . 54
Major Grain Trading Companies . . . . . . . . . 56
ADM . . . . . . . . . . . . . . . 56
Bunge . . . . . . . . . . . . . . . 57
Cargill . . . . . . . . . . . . . . . 58
Louis Dreyfus . . . . . . . . . . . . 59
How International Sales Work . . . . . . . . . . 59
Competitiveness of U.S. Soybeans and Products in the Export Market . . . . . . . . . . . . . 60
Section 10 Conclusions . . . . . . . . . . . . . . . . . . . . 63
■
■
■
■
■
■
■
Trade Flows . . . . . . . . . . . . . . . . . . . 63
Soybeans . . . . . . . . . . . . . . 63
Soybean Meal . . . . . . . . . . . . 64
Soybean Oil . . . . . . . . . . . . 66
Description of the U.S. as Residual Supplier for International Market . . . . . . . . . . . . . 68
Soybeans and Soybean Products Originated in South America are Cheaper than Those Originated in the U.S. . . . . . . . . . . . . . 70
How Can the U.S. Become the Dominant Supplier of Soybeans, Meal and Oil . . . . . . 70
AppendixCountries in Each Region of Trade Matrix . . . . . 73
International Trade Flow Chart . . . . . . . . . . 74
World and U.S. Soybean Supply & Demand 2002/03 - 2006/07 Tables . . . . . . . . . . . 75
Major Import Regions for Global Soybean Supply 78
Index of Maps, Tables and Graphs . . . . . . . . 80
■
■
■
Introduction 5
IntroductionHistory of the Soybean Trade
Soybeans have been cultivated in China for over 5,000 years for food and as a source of drugs. In 2853 B.C., the Emperor Shen-nung named soybeans as one of five sacred plants, with rice, wheat, barley and millet. Before soybeans were used for a variety of modern food products – soy sauce, tempeh, natto and miso – they were used as a natural nitrogen-fixing, soil-enriching ground cover that could be plowed under when it was time to plant other crops.
Soybeans were introduced to the wider world as trade between Europe and Asia increased. They arrived in Europe in the early 18th century and the American colonies in 1765, where they were initially cultivated for hay.
Not until the early 20th century did American researchers and farmers realize the potential soybeans held for food, industrial products and other uses. In 1904, George Washington Carver discovered that soybeans were an efficient source of oil and protein. Carver also encouraged farmers to plant soybeans, which are a legume crop as they fix or add nitrogen in the soil. By putting soybeans into their crop rotation, farmers found they could boost their yields of corn and other commodity crops. By the 1940s, soybeans had begun to realize their potential as a cash crop across many agricultural regions of the United States.
Over the last two decades, soybeans have contributed significantly to U.S. farmers’ incomes. In 2006/07, the total value of U.S. soybean production was $26.9 billion, which has increased from $12.4 billion in 1982/83. While production has see-sawed over the last quarter century, it is expected to reach 70.4 million MT in 2007/08, compared to 59.6 million MT in 1982/83. The peak production year for U.S. soybean farmers was crop year 2006/07, when 86.77 million MT were harvested. (Source: USDA PSD Online Statistics)
It is worth noting that Brazil and Argentina combined are expected to account for 49.4% of global production, or 108 million metric tons (MT) in 2007/08. Combined with Paraguay
and Bolivia, total South American production comes to 116.45 million MT, approximately 1.65 times U.S. production.
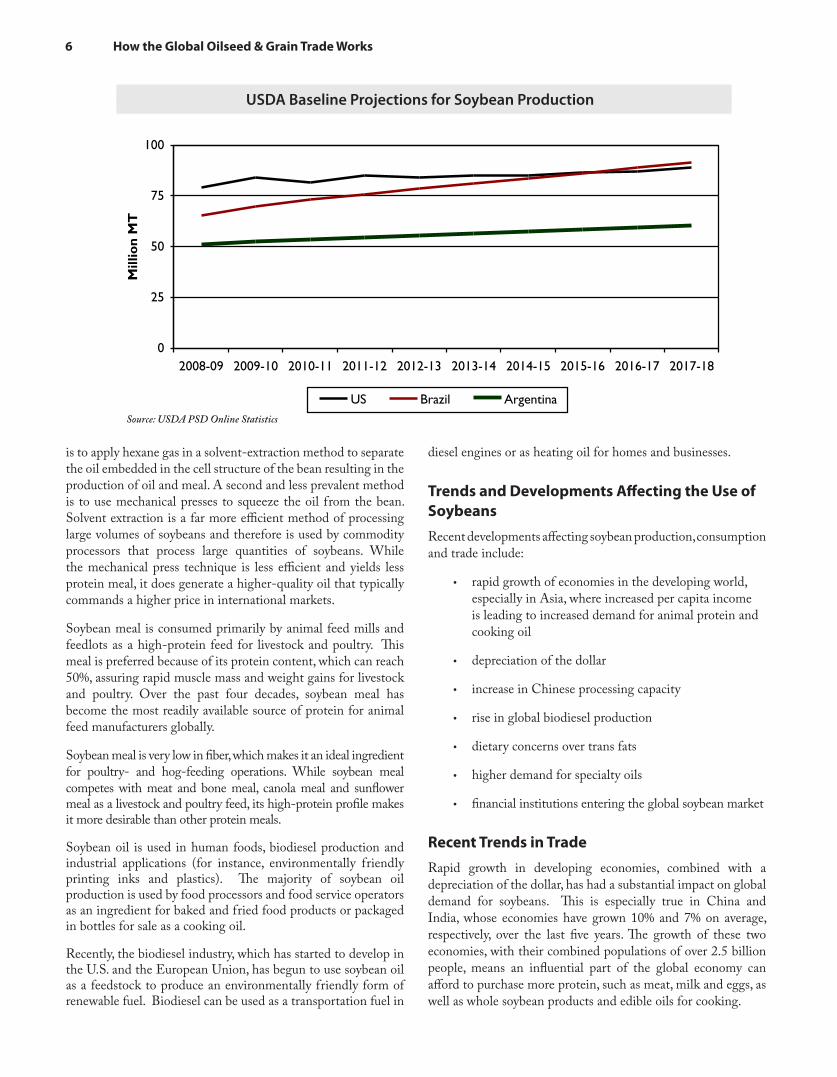
The dynamics of the soybean industry have changed dramatically over the last three decades. Before 1986/87, the U.S. produced approximately 77% of the world’s soybeans while China was the second leading producer at 15% (Source: USDA PSD Online Statistics). In the 1980s, farmers in Brazil and Argentina began to recognize the value of planting soybeans over corn, due to the wide range of products derived from soybeans, and they started to make a concentrated effort to plant more soybeans. By 2002/03, South America eclipsed the U.S. as the dominant producer on a global scale. According to the USDA Baseline Projections, Brazil is expected to surpass the U.S. as the world’s single dominant producer of soybeans by 2016/17 (Brazil 88.9 million MT vs. U.S. 87.3 million MT).
Modern Uses of Soybeans Soybeans are consumed in two ways. They can be consumed directly as human food products, or they can be crushed into meal and oil which are used both for human food and animal feed. Beans grown for direct human consumption are generally consumed in Asia, particularly China, Japan and Indonesia, and are either used directly as a whole seed or are processed and incorporated as a high protein ingredient into food like tofu, tempeh, soy milk, soy cheese or other products. These soybeans are shipped from the farmer to a processing facility where they are dehulled, cleaned, sifted and packaged (either in bags or in “bulk”) prior to being sold to food manufacturers or supermarkets in Asia. These soybeans account for a very small percentage of the demand market.
The vast majority of soybeans are processed by crushers in origination countries such as the U.S., Brazil, Argentina and China, which produce the seed, or destination markets such as China which imports the majority of beans it consumes. A crushed soybean produces about 79% meal, 18.5% oil and 2.5% waste and hulls.
Two types of oilseed-processing techniques are employed to extract meal and oil from the bean. The most common technique
Projected Soybean Production, 2007/08
CountryHarvested Hectares
(000)
Yield (MT/hectare)
Production (000 MT)
Percentage of Global
Harvested Acreage
Percentage of Global
Production
U.S. 25,422 2.77 70,358 28.08 32.16Brazil 21,300 2.86 61,000 23.53 27.88Argentina 16,800 2.80 47,000 18.56 21.48China 8,700 1.55 13,500 9.61 6.17Rest of World 18,108 1.47 26,938 20.22 12.31World Total 90,530 2.42 218,796 100 100
Source: USDA PSD Online Statistics
6 How the Global Oilseed & Grain Trade Works
is to apply hexane gas in a solvent-extraction method to separate the oil embedded in the cell structure of the bean resulting in the production of oil and meal. A second and less prevalent method is to use mechanical presses to squeeze the oil from the bean. Solvent extraction is a far more efficient method of processing large volumes of soybeans and therefore is used by commodity processors that process large quantities of soybeans. While the mechanical press technique is less efficient and yields less protein meal, it does generate a higher-quality oil that typically commands a higher price in international markets.
Soybean meal is consumed primarily by animal feed mills and feedlots as a high-protein feed for livestock and poultry. This meal is preferred because of its protein content, which can reach 50%, assuring rapid muscle mass and weight gains for livestock and poultry. Over the past four decades, soybean meal has become the most readily available source of protein for animal feed manufacturers globally.
Soybean meal is very low in fiber, which makes it an ideal ingredient for poultry- and hog-feeding operations. While soybean meal competes with meat and bone meal, canola meal and sunflower meal as a livestock and poultry feed, its high-protein profile makes it more desirable than other protein meals.
Soybean oil is used in human foods, biodiesel production and industrial applications (for instance, environmentally friendly printing inks and plastics). The majority of soybean oil production is used by food processors and food service operators as an ingredient for baked and fried food products or packaged in bottles for sale as a cooking oil.
Recently, the biodiesel industry, which has started to develop in the U.S. and the European Union, has begun to use soybean oil as a feedstock to produce an environmentally friendly form of renewable fuel. Biodiesel can be used as a transportation fuel in
diesel engines or as heating oil for homes and businesses.
Trends and Developments Affecting the Use of Soybeans Recent developments affecting soybean production, consumption and trade include:
rapid growth of economies in the developing world, especially in Asia, where increased per capita income is leading to increased demand for animal protein and cooking oil
depreciation of the dollar
increase in Chinese processing capacity
rise in global biodiesel production
dietary concerns over trans fats
higher demand for specialty oils
financial institutions entering the global soybean market
Recent Trends in TradeRapid growth in developing economies, combined with a depreciation of the dollar, has had a substantial impact on global demand for soybeans. This is especially true in China and India, whose economies have grown 10% and 7% on average, respectively, over the last five years. The growth of these two economies, with their combined populations of over 2.5 billion people, means an influential part of the global economy can afford to purchase more protein, such as meat, milk and eggs, as well as whole soybean products and edible oils for cooking.
•
•
•
•
•
•
•
USDA Baseline Projections for Soybean Production
0
25
50
75
100
2008-09 2009-10 2010-11 2011-12 2012-13 2013-14 2014-15 2015-16 2016-17 2017-18
Mill
ion
MT
US Brazil ArgentinaSource: USDA PSD Online Statistics
Introduction 7
The result has led to a tremendous increase in global demand for poultry, pork and beef, which are fed typically with soybean meal, and for cooking oils. Recently, as soybean production has not been able to keep up with global demand, there has been a sharp increase in soybean prices. As recently as Sept. 29, 2006, the average price of a bushel of soybeans at the Chicago Board of Trade was $5.475 compared to July 28, 2008, when the spot price was $13.96. (Source: Chicago Board of Trade)
At the same time, a decline in the U.S. dollar means that soybeans are cheaper to export. Historically, the Argentine peso and the Brazilian real have been valued below the dollar resulting in their soybeans costing less than U.S. soybeans in the international marketplace, as soybeans are generally priced in U.S. dollars. Trading companies in export countries that purchase their soybeans in the domestic currency and sell them in U.S. dollars can offer soybeans at a lower price due to the margin they are making on the difference in currencies. U.S. dollar depreciation has led to a decline in the market value of soybeans and soybean products in international markets. Therefore, buyers can now purchase larger quantities of soybeans and soybean products from the U.S., Argentina and Brazil than previously, placing pressure on the market.
The rapid rise in Chinese crushing capacity has led to a huge shift in the international soybean trade on two levels. Chinese processing capacity has increased from 8.4 million MT in 1997 to 40.6 million MT in 2007. In 1997, the EU was the largest importer of soybeans. Today China imports more than 2 times the volume of soybeans purchased by the EU, which is now the world’s second largest importer. China’s rapid rise in crushing capacity has led to Brazil becoming the major exporter to China and the global market after the U.S.
As mentioned above, increased biodiesel production capacity has had an impact on global demand for vegetable oils. The EU, the world’s largest biodiesel producer in terms of installed capacity and annual production, uses rapeseed oil as its primary and preferred feedstock. Rapeseed oil poses fewer obstacles in terms of cold-pour issues (i.e., flowability during winter weather). The U.S. biodiesel industry is starting to catch up with the EU in terms of production capacity.
U.S. biodiesel producers prefer to use soybean oil as a feedstock as biodiesel produced from soybean oil provides a higher BTU value and burns more efficiently and cleanly. The U.S. government provides a subsidy of $1 per gallon to biodiesel blenders that produce biodiesel from virgin vegetable oil feedstocks as an incentive to ensure supply of biodiesel fuel from renewable feedstocks.
While certain national governments in the EU provide subsidies to support biodiesel production, as a whole the EU does not subsidize biodiesel production. Instead, in 2003, the EU issued a mandate targeting that by 2005 at least 2% of all petrol and diesel used in transport come from biofuels with an increase to 5.75% by 2010. As of 2005, only Germany and Sweden reached the targeted mandate of 2% consumption of
biofuels. It is unlikely that the EU will reach the target of 5.75% in 2010, unless the targets become requirements.
At the same time, the Brazilian government requires that 2% of diesel used domestically come from biodiesel. As more crushers process soybeans for oil to meet biodiesel and global demand, more meal will be produced. There is concern that these mandates will result in an over-supply of protein meal that will drive down meal prices.
Dietary concerns, especially related to trans fats, are also having an impact. The U.S. Food and Drug Administration has published guidelines calling for a reduction of trans fats due to the cardiovascular health risks those oils pose and new labeling requirements on food packaging. These regulations have led to a number of trends.
Increased adoption of more shelf-stable competitive oils such as sunseed and canola
Re-introduction of palm oil (in spite of its higher saturated fat levels) in baking
The development of specialty trait seeds such as low-linolenic soybeans
A reduction in the use of hydrogenation (the source of trans fats) to stabilize soybean oil and render it more solid for certain food applications
Another development has had a significant and controversial impact on prices. For the first time, institutional money has found its way into the international commodities markets. This phenomenon has been driven by the recent decline in the U.S. stock market and sub-prime mortgage debacle. Since global commodities have been outperforming almost all other markets, institutional investors have created commodity index funds and have invested billions of dollars in the commodity markets.
This trend of investing in commodities started with petroleum and has spread across all commodities, including agricultural
•
•
•
•
Major Soybean Exporters (Million MT)
Country 2002/03 2003/04 2004/05 2005/06 2006/07
U.S. 28.423 24.128 29.860 25.579 30.428
Argentina 8.624 6.741 9.568 7.249 9.559
Brazil 19.629 20.417 20.137 25.911 23.485World (Total Consumption) 60.982 56.204 64.774 63.583 71.266
Percent of World ConsumptionU.S. 46.61 42.93 46.10 40.23 42.70
Argentina 14.14 11.99 14.77 11.40 13.41
Brazil 32.19 36.33 31.09 40.75 32.95Source: USDA PSD Online Statistics
8 How the Global Oilseed & Grain Trade Works
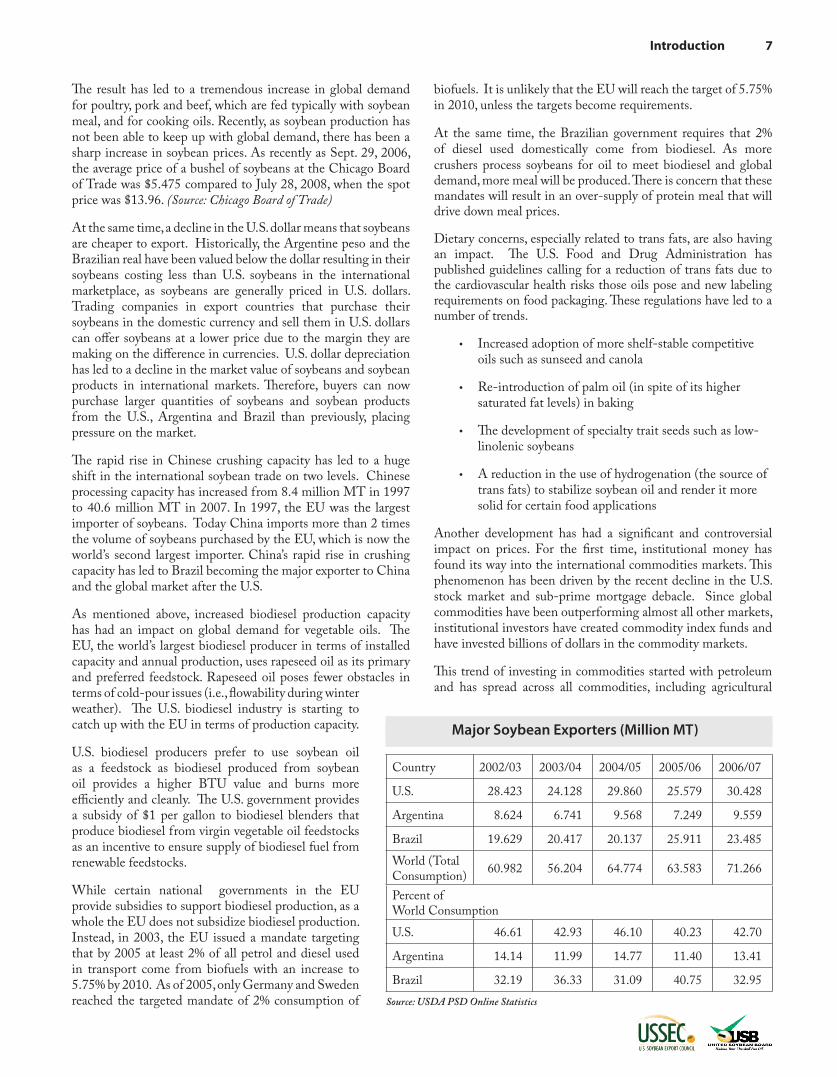
Primary Global Soybean Producer Countries
Global Consumption of Soybeans by Region, 2007/08
Source: USDA PSD Online Statistics
Source: USDA PSD Online Statistics
Overview of Major Origination and Consumption Countries
Introduction 9
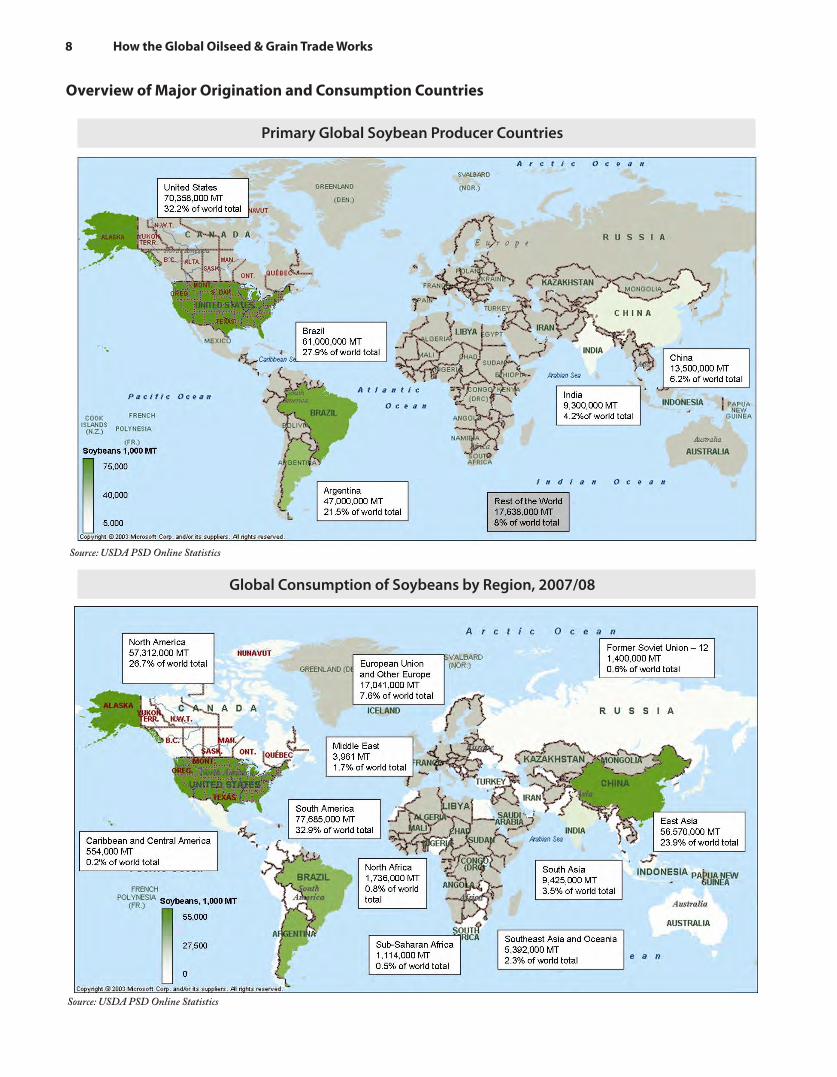
Global Consumption of Soybean Meal by Region, 2007/08
Global Consumption of Soybean Oil by Region, 2007/08
Source: USDA PSD Online Statistics
Source: USDA PSD Online Statistics
10 How the Global Oilseed & Grain Trade Works
markets. The result has been a sharp rise in prices for soybean and soybean products despite no major change in supply-and-demand market fundamentals.
Section 1 Competitiveness of Soybeans and Other OilseedsCompetitive OilseedsSoybeans compete for acreage on a global scale with canola/rapeseed, sunflower, corn and wheat. Soybeans produce their best yields in hot, wet and humid climates where the land is fertile. However, climate and terrain cannot be too wet and humid or the crop will suffer a reduction in yields and protein and oil levels.
Canola/rapeseed, sunflower and wheat tend to succeed in regions where the soil is arid. Since these crops do not require a lot of water and irrigation to grow well, they are usually grown in the drier agricultural regions of the U.S. (North Dakota, South Dakota, Minnesota, western Kansas, Oklahoma and Texas). Typically, these crops do not compete for acreage with soybeans in the U.S. because they require different climates. There is limited infrastructure established for canola/rapeseed and sunflower seed crushing in the U.S. (Wheat has the infrastructure, but does not compete directly with soybeans in the U.S. due to the difference in price received for each crop and the optimal agronomic requirements for production.)
Canola/rapeseed is the primary oilseed produced in Australia, Canada, China, the EU and India. Climates in these countries are drier than the U.S. and have the infrastructure to support canola/rapeseed crush. The primary sunflower seed production areas include Argentina, Eastern Europe, Russia and Ukraine. While wheat is produced virtually everywhere in the world, the major exporting regions include Argentina, Australia, Canada, the EU, Russia, Ukraine, and the U.S.
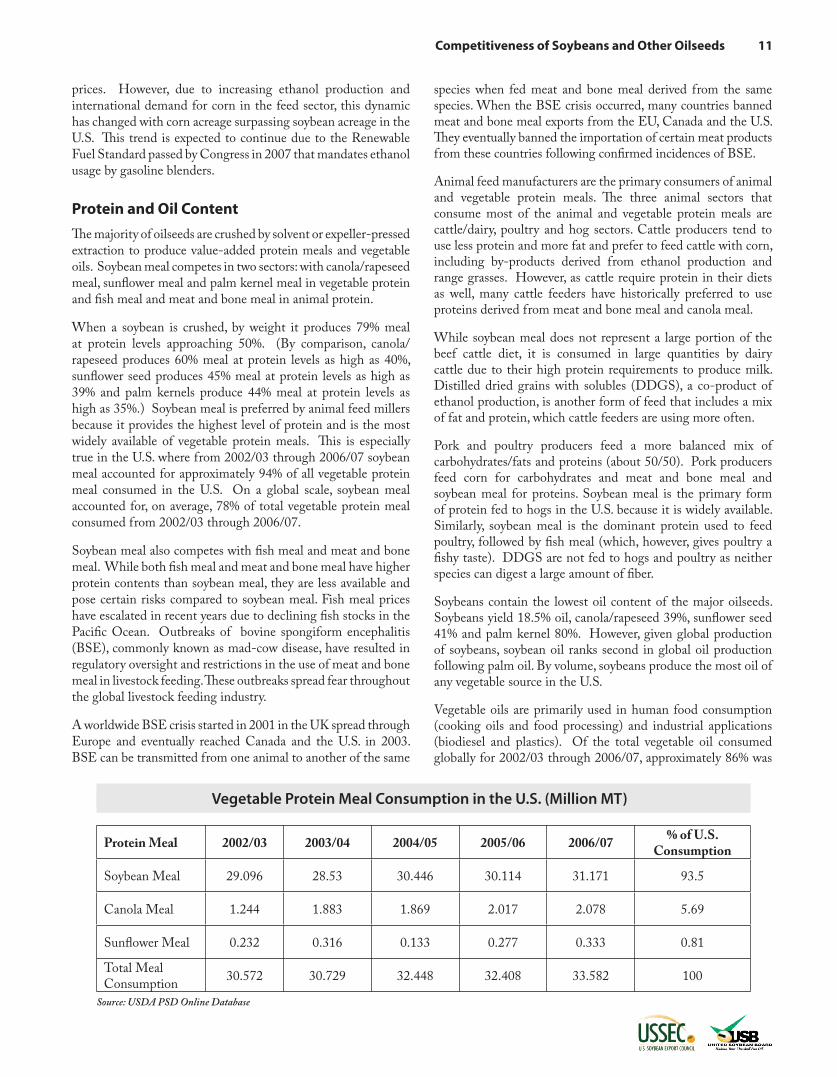
Palm production also does not compete directly with soybeans for acreage. However, palm oil and palm kernel meal do compete directly with soybean oil and meal. Palm oil is the only vegetable oil in the world that is regularly priced at a discount to soybean oil (see chart below). Palm production is primarily located in Southeast Asia, Latin America and Africa, all tropical regions that are hot, humid and wet. Malaysia and Indonesia produce approximately 90% of the world’s palm oil, followed by Colombia, Brazil, Ecuador, Costa Rica and Nigeria.
Corn is the crop that competes most heavily for acreage with soybeans. Corn requires basically the same growing conditions as soybeans to produce high yields. Corn and soybeans compete especially hard for acreage in Argentina and the U.S. where growers typically make planting decisions based on the amount of income each crop produced the previous year.
As corn requires more crop inputs (fertilizer, insecticides, fungicides, etc.) than soybeans, the grower must factor these production costs into his profitability analysis. From 2002/03 to 2006/07, more acreage was planted in soybeans in the U.S. in each year except 2005/06, when corn prices exceeded soybean
20
25
30
35
40
2002/03 2003/04 2004/05 2005/06 2006/07
Mill
ion
MT
Palm Oil Soybean Oil
Palm and Soybean Oil Production
Source: USDA PSD Online Statistics
Phot
o: U
SDA
ARS
Competitiveness of Soybeans and Other Oilseeds 11
prices. However, due to increasing ethanol production and international demand for corn in the feed sector, this dynamic has changed with corn acreage surpassing soybean acreage in the U.S. This trend is expected to continue due to the Renewable Fuel Standard passed by Congress in 2007 that mandates ethanol usage by gasoline blenders.
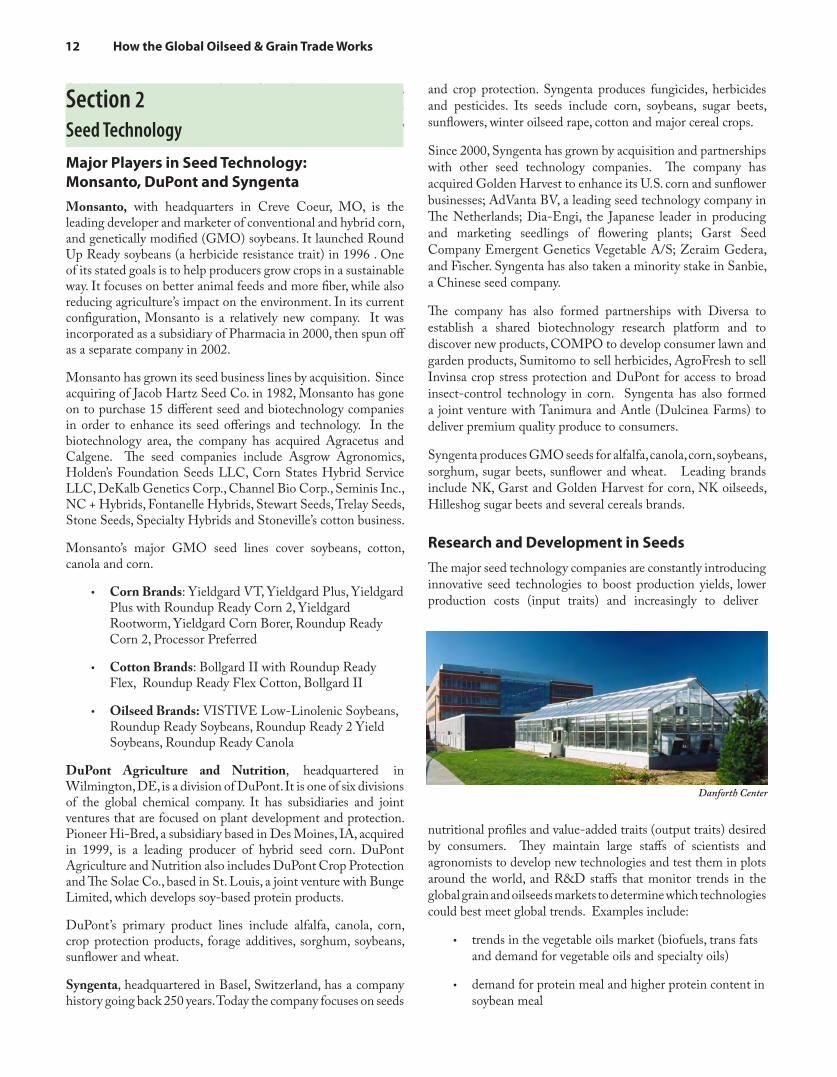
Protein and Oil ContentThe majority of oilseeds are crushed by solvent or expeller-pressed extraction to produce value-added protein meals and vegetable oils. Soybean meal competes in two sectors: with canola/rapeseed meal, sunflower meal and palm kernel meal in vegetable protein and fish meal and meat and bone meal in animal protein.
When a soybean is crushed, by weight it produces 79% meal at protein levels approaching 50%. (By comparison, canola/rapeseed produces 60% meal at protein levels as high as 40%, sunflower seed produces 45% meal at protein levels as high as 39% and palm kernels produce 44% meal at protein levels as high as 35%.) Soybean meal is preferred by animal feed millers because it provides the highest level of protein and is the most widely available of vegetable protein meals. This is especially true in the U.S. where from 2002/03 through 2006/07 soybean meal accounted for approximately 94% of all vegetable protein meal consumed in the U.S. On a global scale, soybean meal accounted for, on average, 78% of total vegetable protein meal consumed from 2002/03 through 2006/07.
Soybean meal also competes with fish meal and meat and bone meal. While both fish meal and meat and bone meal have higher protein contents than soybean meal, they are less available and pose certain risks compared to soybean meal. Fish meal prices have escalated in recent years due to declining fish stocks in the Pacific Ocean. Outbreaks of bovine spongiform encephalitis (BSE), commonly known as mad-cow disease, have resulted in regulatory oversight and restrictions in the use of meat and bone meal in livestock feeding. These outbreaks spread fear throughout the global livestock feeding industry.
A worldwide BSE crisis started in 2001 in the UK spread through Europe and eventually reached Canada and the U.S. in 2003. BSE can be transmitted from one animal to another of the same
species when fed meat and bone meal derived from the same species. When the BSE crisis occurred, many countries banned meat and bone meal exports from the EU, Canada and the U.S. They eventually banned the importation of certain meat products from these countries following confirmed incidences of BSE.
Animal feed manufacturers are the primary consumers of animal and vegetable protein meals. The three animal sectors that consume most of the animal and vegetable protein meals are cattle/dairy, poultry and hog sectors. Cattle producers tend to use less protein and more fat and prefer to feed cattle with corn, including by-products derived from ethanol production and range grasses. However, as cattle require protein in their diets as well, many cattle feeders have historically preferred to use proteins derived from meat and bone meal and canola meal.
While soybean meal does not represent a large portion of the beef cattle diet, it is consumed in large quantities by dairy cattle due to their high protein requirements to produce milk. Distilled dried grains with solubles (DDGS), a co-product of ethanol production, is another form of feed that includes a mix of fat and protein, which cattle feeders are using more often.
Pork and poultry producers feed a more balanced mix of carbohydrates/fats and proteins (about 50/50). Pork producers feed corn for carbohydrates and meat and bone meal and soybean meal for proteins. Soybean meal is the primary form of protein fed to hogs in the U.S. because it is widely available. Similarly, soybean meal is the dominant protein used to feed poultry, followed by fish meal (which, however, gives poultry a fishy taste). DDGS are not fed to hogs and poultry as neither species can digest a large amount of fiber.
Soybeans contain the lowest oil content of the major oilseeds. Soybeans yield 18.5% oil, canola/rapeseed 39%, sunflower seed 41% and palm kernel 80%. However, given global production of soybeans, soybean oil ranks second in global oil production following palm oil. By volume, soybeans produce the most oil of any vegetable source in the U.S.
Vegetable oils are primarily used in human food consumption (cooking oils and food processing) and industrial applications (biodiesel and plastics). Of the total vegetable oil consumed globally for 2002/03 through 2006/07, approximately 86% was
Vegetable Protein Meal Consumption in the U.S. (Million MT)
Protein Meal 2002/03 2003/04 2004/05 2005/06 2006/07 % of U.S. Consumption
Soybean Meal 29.096 28.53 30.446 30.114 31.171 93.5
Canola Meal 1.244 1.883 1.869 2.017 2.078 5.69
Sunflower Meal 0.232 0.316 0.133 0.277 0.333 0.81
Total Meal Consumption 30.572 30.729 32.448 32.408 33.582 100
Source: USDA PSD Online Database
12 How the Global Oilseed & Grain Trade Works
for human consumption and 13% for industrial consumption. Palm oil accounted for 36.4% of total vegetable oil/consumption during the same period while soybean oil accounted for 36.3%, canola/rapeseed oil 17.2% and sunflower oil 10.1%.
Section 2 Seed TechnologyMajor Players in Seed Technology: Monsanto, DuPont and SyngentaMonsanto, with headquarters in Creve Coeur, MO, is the leading developer and marketer of conventional and hybrid corn, and genetically modified (GMO) soybeans. It launched Round Up Ready soybeans (a herbicide resistance trait) in 1996 . One of its stated goals is to help producers grow crops in a sustainable way. It focuses on better animal feeds and more fiber, while also reducing agriculture’s impact on the environment. In its current configuration, Monsanto is a relatively new company. It was incorporated as a subsidiary of Pharmacia in 2000, then spun off as a separate company in 2002.
Monsanto has grown its seed business lines by acquisition. Since acquiring of Jacob Hartz Seed Co. in 1982, Monsanto has gone on to purchase 15 different seed and biotechnology companies in order to enhance its seed offerings and technology. In the biotechnology area, the company has acquired Agracetus and Calgene. The seed companies include Asgrow Agronomics, Holden’s Foundation Seeds LLC, Corn States Hybrid Service LLC, DeKalb Genetics Corp., Channel Bio Corp., Seminis Inc., NC + Hybrids, Fontanelle Hybrids, Stewart Seeds, Trelay Seeds, Stone Seeds, Specialty Hybrids and Stoneville’s cotton business.
Monsanto’s major GMO seed lines cover soybeans, cotton, canola and corn.
Corn Brands: Yieldgard VT, Yieldgard Plus, Yieldgard Plus with Roundup Ready Corn 2, Yieldgard Rootworm, Yieldgard Corn Borer, Roundup Ready Corn 2, Processor Preferred
Cotton Brands: Bollgard II with Roundup Ready Flex, Roundup Ready Flex Cotton, Bollgard II
Oilseed Brands: VISTIVE Low-Linolenic Soybeans, Roundup Ready Soybeans, Roundup Ready 2 Yield Soybeans, Roundup Ready Canola
DuPont Agriculture and Nutrition, headquartered in Wilmington, DE, is a division of DuPont. It is one of six divisions of the global chemical company. It has subsidiaries and joint ventures that are focused on plant development and protection. Pioneer Hi-Bred, a subsidiary based in Des Moines, IA, acquired in 1999, is a leading producer of hybrid seed corn. DuPont Agriculture and Nutrition also includes DuPont Crop Protection and The Solae Co., based in St. Louis, a joint venture with Bunge Limited, which develops soy-based protein products.
DuPont’s primary product lines include alfalfa, canola, corn, crop protection products, forage additives, sorghum, soybeans, sunflower and wheat.
Syngenta, headquartered in Basel, Switzerland, has a company history going back 250 years. Today the company focuses on seeds
•
•
•
and crop protection. Syngenta produces fungicides, herbicides and pesticides. Its seeds include corn, soybeans, sugar beets, sunflowers, winter oilseed rape, cotton and major cereal crops.
Since 2000, Syngenta has grown by acquisition and partnerships with other seed technology companies. The company has acquired Golden Harvest to enhance its U.S. corn and sunflower businesses; AdVanta BV, a leading seed technology company in The Netherlands; Dia-Engi, the Japanese leader in producing and marketing seedlings of flowering plants; Garst Seed Company Emergent Genetics Vegetable A/S; Zeraim Gedera, and Fischer. Syngenta has also taken a minority stake in Sanbie, a Chinese seed company.
The company has also formed partnerships with Diversa to establish a shared biotechnology research platform and to discover new products, COMPO to develop consumer lawn and garden products, Sumitomo to sell herbicides, AgroFresh to sell Invinsa crop stress protection and DuPont for access to broad insect-control technology in corn. Syngenta has also formed a joint venture with Tanimura and Antle (Dulcinea Farms) to deliver premium quality produce to consumers.
Syngenta produces GMO seeds for alfalfa, canola, corn, soybeans, sorghum, sugar beets, sunflower and wheat. Leading brands include NK, Garst and Golden Harvest for corn, NK oilseeds, Hilleshog sugar beets and several cereals brands.
Research and Development in SeedsThe major seed technology companies are constantly introducing innovative seed technologies to boost production yields, lower production costs (input traits) and increasingly to deliver
nutritional profiles and value-added traits (output traits) desired by consumers. They maintain large staffs of scientists and agronomists to develop new technologies and test them in plots around the world, and R&D staffs that monitor trends in the global grain and oilseeds markets to determine which technologies could best meet global trends. Examples include:
trends in the vegetable oils market (biofuels, trans fats and demand for vegetable oils and specialty oils)
demand for protein meal and higher protein content in soybean meal
•
•
Danforth Center
Seed Technology 1�
events and diseases affecting crop yields (droughts, Asian soybean rust and pests)
demand for corn from animal feed, ethanol and international markets
consumer trends in major markets
R&D teams research these trends to determine which seeds can be most profitable for companies. They interview oilseed processors, elevators and farmers to determine what seeds they want, if the seeds have potential market demand and whether farmers will pay a premium to acquire the seed price for planting. Examples of questions such teams ask include:
Can a premium be justified for seeds that generate higher oil or meal contents and at what level can the premium be set?
What market trends would lead to improved margins?
Do currently available seeds meet market needs or should they be improved and, if so, how?
Once research is completed, scientists develop a seed in the company’s laboratories that matches the criteria the R&D team has designed to meet a particular market trend or need. The seed is field-tested around the world to determine the best locations and soils for planting and marketing the seed. The company patents the seed for sale in domestic and international markets.
•
•
•
•
•
•
Relationships with Major Soybean ProcessorsA key relationship in the soybean value chain is that developed between the seed technology companies and the major soybean processors. In the U.S. and South America, processors control soybean purchases from growers as well as the majority of export sales of soybeans and co-products. These companies control a large share of elevators that purchase soybeans, canola/rapeseed, sunflower seed, corn and wheat directly from farmers. If a soybean processor partners with a seed technology company to pay growers a premium for new seed-trait soybeans, the seed company can charge growers a premium for the new trait seeds. Growers recover their higher input costs for the seed from the processor when they deliver the soybeans to the processor after harvest. They often have negotiated contracts with processors who want to process these new seed-trait soybeans. They have secured contracts to supply food manufacturers and food service operators seeking the benefits provided by the new traits.
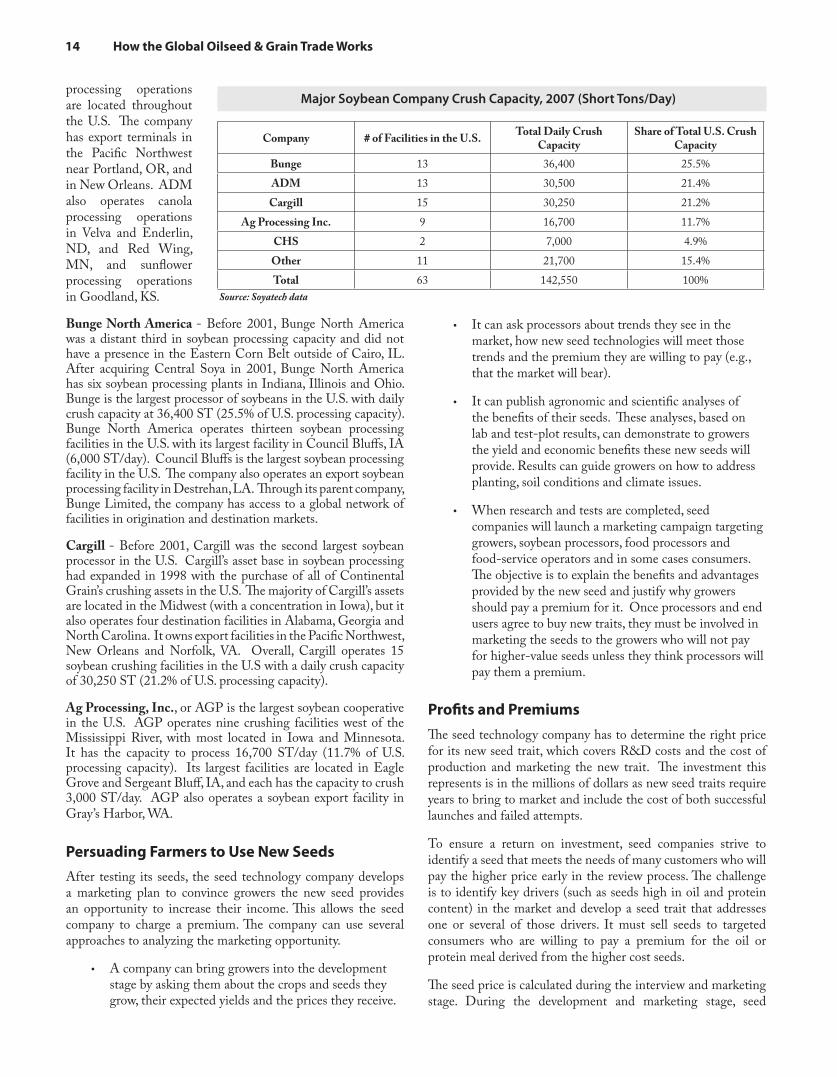
The four largest soybean processors in the U.S. are ADM, Bunge North America, Cargill and Ag Processing Inc., which combined account for over 80% of soybean processing capacity.
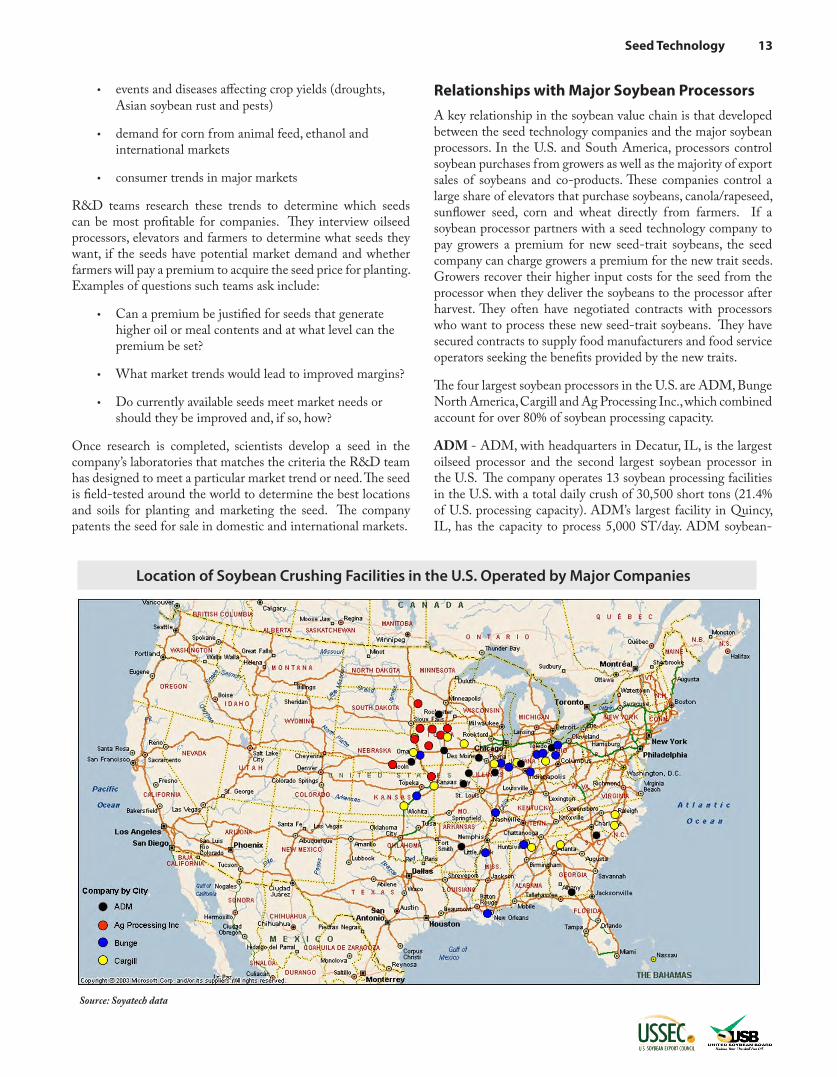
ADM - ADM, with headquarters in Decatur, IL, is the largest oilseed processor and the second largest soybean processor in the U.S. The company operates 13 soybean processing facilities in the U.S. with a total daily crush of 30,500 short tons (21.4% of U.S. processing capacity). ADM’s largest facility in Quincy, IL, has the capacity to process 5,000 ST/day. ADM soybean-
Location of Soybean Crushing Facilities in the U.S. Operated by Major Companies
Source: Soyatech data
Danforth Center
14 How the Global Oilseed & Grain Trade Works
processing operations are located throughout the U.S. The company has export terminals in the Pacific Northwest near Portland, OR, and in New Orleans. ADM also operates canola processing operations in Velva and Enderlin, ND, and Red Wing, MN, and sunflower processing operations in Goodland, KS.
Bunge North America - Before 2001, Bunge North America was a distant third in soybean processing capacity and did not have a presence in the Eastern Corn Belt outside of Cairo, IL. After acquiring Central Soya in 2001, Bunge North America has six soybean processing plants in Indiana, Illinois and Ohio. Bunge is the largest processor of soybeans in the U.S. with daily crush capacity at 36,400 ST (25.5% of U.S. processing capacity). Bunge North America operates thirteen soybean processing facilities in the U.S. with its largest facility in Council Bluffs, IA (6,000 ST/day). Council Bluffs is the largest soybean processing facility in the U.S. The company also operates an export soybean processing facility in Destrehan, LA. Through its parent company, Bunge Limited, the company has access to a global network of facilities in origination and destination markets.
Cargill - Before 2001, Cargill was the second largest soybean processor in the U.S. Cargill’s asset base in soybean processing had expanded in 1998 with the purchase of all of Continental Grain’s crushing assets in the U.S. The majority of Cargill’s assets are located in the Midwest (with a concentration in Iowa), but it also operates four destination facilities in Alabama, Georgia and North Carolina. It owns export facilities in the Pacific Northwest, New Orleans and Norfolk, VA. Overall, Cargill operates 15 soybean crushing facilities in the U.S with a daily crush capacity of 30,250 ST (21.2% of U.S. processing capacity).
Ag Processing, Inc., or AGP is the largest soybean cooperative in the U.S. AGP operates nine crushing facilities west of the Mississippi River, with most located in Iowa and Minnesota. It has the capacity to process 16,700 ST/day (11.7% of U.S. processing capacity). Its largest facilities are located in Eagle Grove and Sergeant Bluff, IA, and each has the capacity to crush 3,000 ST/day. AGP also operates a soybean export facility in Gray’s Harbor, WA.
Persuading Farmers to Use New SeedsAfter testing its seeds, the seed technology company develops a marketing plan to convince growers the new seed provides an opportunity to increase their income. This allows the seed company to charge a premium. The company can use several approaches to analyzing the marketing opportunity.
A company can bring growers into the development stage by asking them about the crops and seeds they grow, their expected yields and the prices they receive.
•
It can ask processors about trends they see in the market, how new seed technologies will meet those trends and the premium they are willing to pay (e.g., that the market will bear).
It can publish agronomic and scientific analyses of the benefits of their seeds. These analyses, based on lab and test-plot results, can demonstrate to growers the yield and economic benefits these new seeds will provide. Results can guide growers on how to address planting, soil conditions and climate issues.
When research and tests are completed, seed companies will launch a marketing campaign targeting growers, soybean processors, food processors and food-service operators and in some cases consumers. The objective is to explain the benefits and advantages provided by the new seed and justify why growers should pay a premium for it. Once processors and end users agree to buy new traits, they must be involved in marketing the seeds to the growers who will not pay for higher-value seeds unless they think processors will pay them a premium.
Profits and PremiumsThe seed technology company has to determine the right price for its new seed trait, which covers R&D costs and the cost of production and marketing the new trait. The investment this represents is in the millions of dollars as new seed traits require years to bring to market and include the cost of both successful launches and failed attempts.
To ensure a return on investment, seed companies strive to identify a seed that meets the needs of many customers who will pay the higher price early in the review process. The challenge is to identify key drivers (such as seeds high in oil and protein content) in the market and develop a seed trait that addresses one or several of those drivers. It must sell seeds to targeted consumers who are willing to pay a premium for the oil or protein meal derived from the higher cost seeds.
The seed price is calculated during the interview and marketing stage. During the development and marketing stage, seed
•
•
•
Major Soybean Company Crush Capacity, 2007 (Short Tons/Day)
Company # of Facilities in the U.S. Total Daily Crush Capacity
Share of Total U.S. Crush Capacity
Bunge 13 36,400 25.5%ADM 13 30,500 21.4%
Cargill 15 30,250 21.2%Ag Processing Inc. 9 16,700 11.7%
CHS 2 7,000 4.9%Other 11 21,700 15.4%Total 63 142,550 100%
Source: Soyatech data
Seed Technology 15
companies use interviews with growers, soybean processors and end users to determine what the market will bear for their seeds. They enter into long-term marketing agreements with soybean processors and long-term contracts with growers to establish a market for the new seed traits.
The seed company must decide whether a new seed should be marketed as a commodity or a specialty seed trait. While a commodity seed can have quick mass appeal and will affect a large part of the market, they are typically lower-priced seeds.
If the company opts to sell the seed to a smaller segment of the market that is willing to pay a premium for the seed, it will market the seed as a specialty/identity protected (IP) product. This approach assures the company a higher profit.
Seed companies employ both approaches.
An example of a specialty/IP seed is Monsanto’s low-linolenic soybean seed, which produces an oil that is more shelf-stable than oil derived from genetically-modified or commodity soybeans and does not require hydrogenation that results in trans fats. Growers who have contracted to supply low-linolenic soybeans to crushers that supply the food processing industry are willing to purchase these seeds at a higher price.
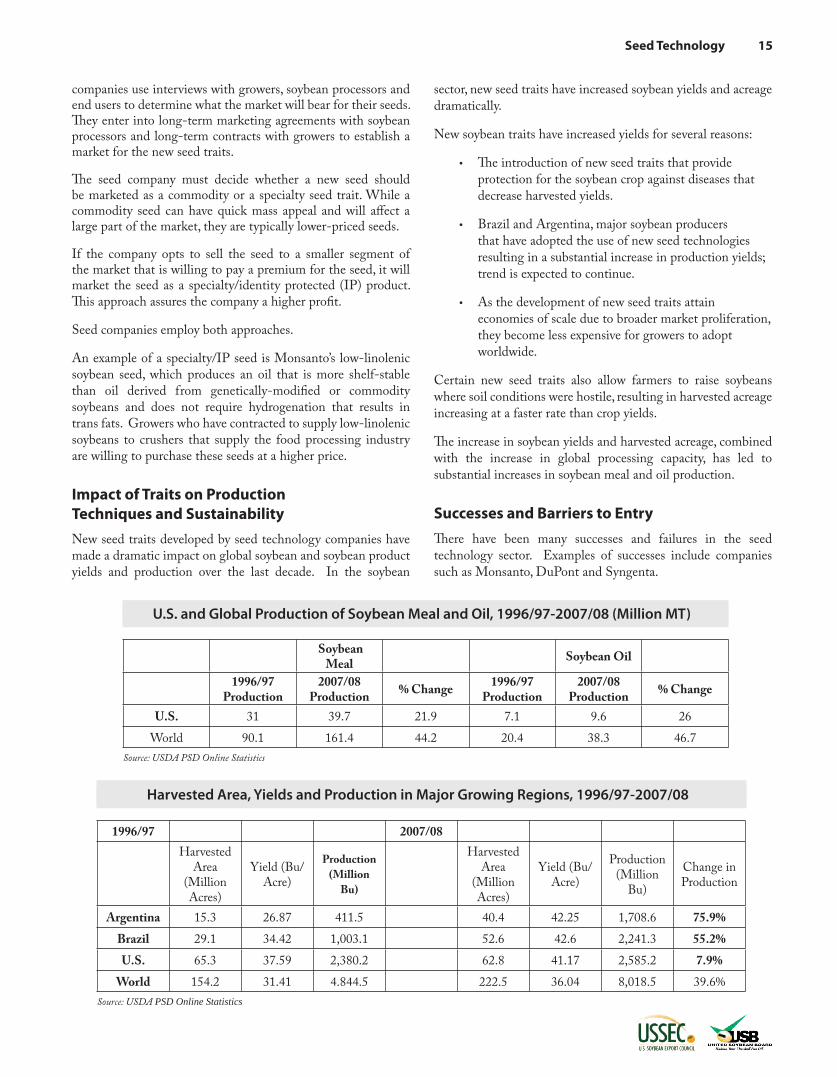
Impact of Traits on Production Techniques and SustainabilityNew seed traits developed by seed technology companies have made a dramatic impact on global soybean and soybean product yields and production over the last decade. In the soybean
Harvested Area, Yields and Production in Major Growing Regions, 1996/97-2007/08
1996/97 2007/08Harvested
Area (Million Acres)
Yield (Bu/Acre)
Production (Million
Bu)
Harvested Area
(Million Acres)
Yield (Bu/Acre)
Production (Million
Bu)
Change in Production
Argentina 15.3 26.87 411.5 40.4 42.25 1,708.6 75.9%Brazil 29.1 34.42 1,003.1 52.6 42.6 2,241.3 55.2%U.S. 65.3 37.59 2,380.2 62.8 41.17 2,585.2 7.9%
World 154.2 31.41 4.844.5 222.5 36.04 8,018.5 39.6%Source: USDA PSD Online Statistics
U.S. and Global Production of Soybean Meal and Oil, 1996/97-2007/08 (Million MT)
Soybean Meal Soybean Oil
1996/97 Production
2007/08 Production % Change 1996/97
Production2007/08
Production % Change
U.S. 31 39.7 21.9 7.1 9.6 26World 90.1 161.4 44.2 20.4 38.3 46.7
Source: USDA PSD Online Statistics
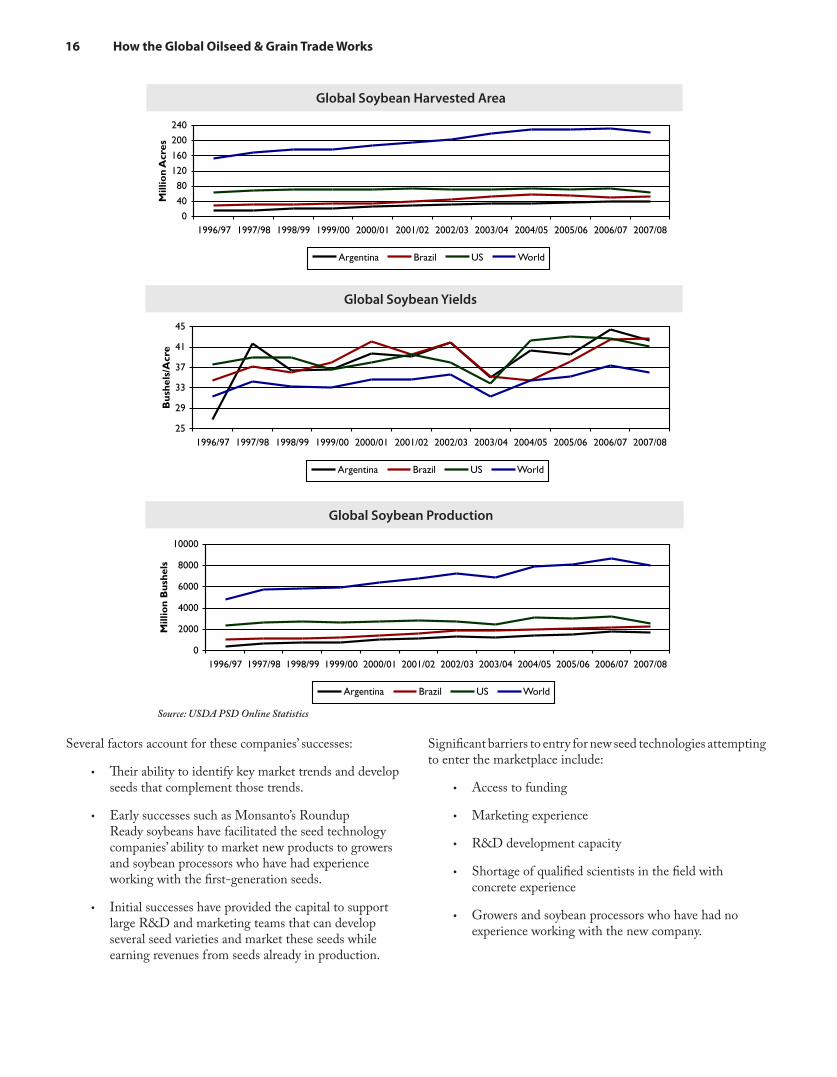
sector, new seed traits have increased soybean yields and acreage dramatically.
New soybean traits have increased yields for several reasons:
The introduction of new seed traits that provide protection for the soybean crop against diseases that decrease harvested yields.
Brazil and Argentina, major soybean producers that have adopted the use of new seed technologies resulting in a substantial increase in production yields; trend is expected to continue.
As the development of new seed traits attain economies of scale due to broader market proliferation, they become less expensive for growers to adopt worldwide.
Certain new seed traits also allow farmers to raise soybeans where soil conditions were hostile, resulting in harvested acreage increasing at a faster rate than crop yields.
The increase in soybean yields and harvested acreage, combined with the increase in global processing capacity, has led to substantial increases in soybean meal and oil production.
Successes and Barriers to EntryThere have been many successes and failures in the seed technology sector. Examples of successes include companies such as Monsanto, DuPont and Syngenta.
•
•
•
16 How the Global Oilseed & Grain Trade Works
Several factors account for these companies’ successes:
Their ability to identify key market trends and develop seeds that complement those trends.
Early successes such as Monsanto’s Roundup Ready soybeans have facilitated the seed technology companies’ ability to market new products to growers and soybean processors who have had experience working with the first-generation seeds.
Initial successes have provided the capital to support large R&D and marketing teams that can develop several seed varieties and market these seeds while earning revenues from seeds already in production.
•
•
•
25
29
33
37
41
45
1996/97 1997/98 1998/99 1999/00 2000/01 2001/02 2002/03 2003/04 2004/05 2005/06 2006/07 2007/08
Bu
shel
s/A
cre
Argentina Brazil US World
Global Soybean Yields
0
40
80
120
160
200
240
1996/97 1997/98 1998/99 1999/00 2000/01 2001/02 2002/03 2003/04 2004/05 2005/06 2006/07 2007/08
Mill
ion
Acr
es
Argentina Brazil US World
Global Soybean Harvested Area
0
2000
4000
6000
8000
10000
1996/97 1997/98 1998/99 1999/00 2000/01 2001/02 2002/03 2003/04 2004/05 2005/06 2006/07 2007/08
Mill
ion
Bu
shel
s
Argentina Brazil US World
Global Soybean Production
Significant barriers to entry for new seed technologies attempting to enter the marketplace include:
Access to funding
Marketing experience
R&D development capacity
Shortage of qualified scientists in the field with concrete experience
Growers and soybean processors who have had no experience working with the new company.
•
•
•
•
•
Source: USDA PSD Online Statistics
Production-Growers 17
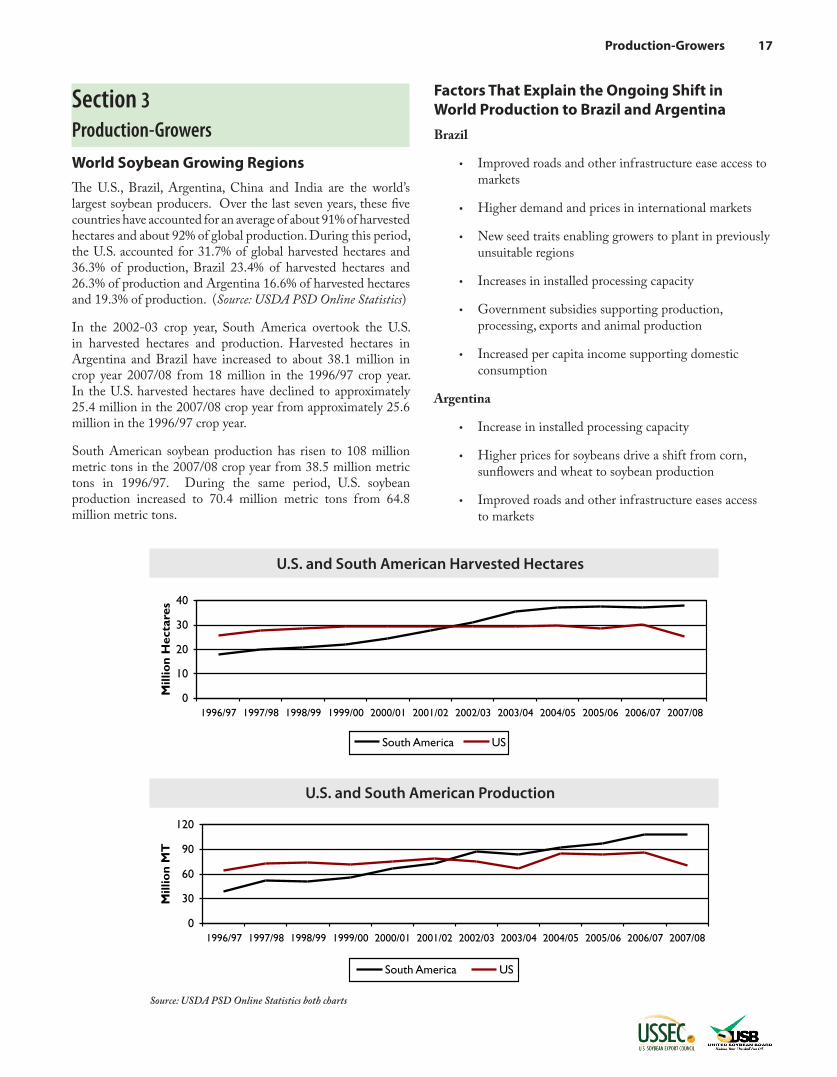
Section 3 Production-GrowersWorld Soybean Growing RegionsThe U.S., Brazil, Argentina, China and India are the world’s largest soybean producers. Over the last seven years, these five countries have accounted for an average of about 91% of harvested hectares and about 92% of global production. During this period, the U.S. accounted for 31.7% of global harvested hectares and 36.3% of production, Brazil 23.4% of harvested hectares and 26.3% of production and Argentina 16.6% of harvested hectares and 19.3% of production. (Source: USDA PSD Online Statistics)
In the 2002-03 crop year, South America overtook the U.S. in harvested hectares and production. Harvested hectares in Argentina and Brazil have increased to about 38.1 million in crop year 2007/08 from 18 million in the 1996/97 crop year. In the U.S. harvested hectares have declined to approximately 25.4 million in the 2007/08 crop year from approximately 25.6 million in the 1996/97 crop year.
South American soybean production has risen to 108 million metric tons in the 2007/08 crop year from 38.5 million metric tons in 1996/97. During the same period, U.S. soybean production increased to 70.4 million metric tons from 64.8 million metric tons.
0
10
20
30
40
1996/97 1997/98 1998/99 1999/00 2000/01 2001/02 2002/03 2003/04 2004/05 2005/06 2006/07 2007/08
Mill
ion
Hec
tare
s
South America US
U.S. and South American Harvested Hectares
0
30
60
90
120
1996/97 1997/98 1998/99 1999/00 2000/01 2001/02 2002/03 2003/04 2004/05 2005/06 2006/07 2007/08
Mill
ion
MT
South America US
U.S. and South American Production
Source: USDA PSD Online Statistics both charts
Factors That Explain the Ongoing Shift in World Production to Brazil and ArgentinaBrazil
Improved roads and other infrastructure ease access to markets
Higher demand and prices in international markets
New seed traits enabling growers to plant in previously unsuitable regions
Increases in installed processing capacity
Government subsidies supporting production, processing, exports and animal production
Increased per capita income supporting domestic consumption
Argentina
Increase in installed processing capacity
Higher prices for soybeans drive a shift from corn, sunflowers and wheat to soybean production
Improved roads and other infrastructure eases access to markets
•
•
•
•
•
•
•
•
•
18 How the Global Oilseed & Grain Trade Works
Higher demand and prices in international markets
New seed traits enable growers to plant in previously unsuitable regions
In the U.S., harvested acres have dropped recently while production has risen due to increased crop yields. Competition for acreage between corn and soybeans is stronger than in South America. Both crops require fertile soil and a hot, humid growing season to produce high yields, which means they compete for acreage in the same growing areas. Growers typically rotate the two crops on their fields, with a three-year rotation for corn because it depletes nitrogen in the soil. Growers decide which crop to plant based on price and expected margins, which may vary substantially from year to year, as was the case in 2008.
Despite yearly fluctuations in planted acreage, soybean production has increased from 2002-03 to 2008-09 due to higher yields in the major production regions of the country. These increases are the result of improved production practices and new seed-trait technologies that protect soybeans from insects, diseases and drought.
In China and India, crop yields are lower because the soybeans planted are susceptible to drought. Most farmers are small-scale subsistence operators who do not use irrigation. Poor roads and an inadequate infrastructure pose challenges for moving crops to market for sale. Production in China is concentrated between the Yellow and Yangtze rivers and in the northeastern section
•
•
of the country. In India, production is in Andhra Pradesh and Maharashtra. Both China and India produce non-GMO soybeans.
For the seven crop years starting Sept. 1, 2002, through Aug. 31, 2009, China accounted for 10.2% of the world’s harvested acres and 7.3% of world production. India’s share of harvested acres was 8.4% and 3.2% of world production.
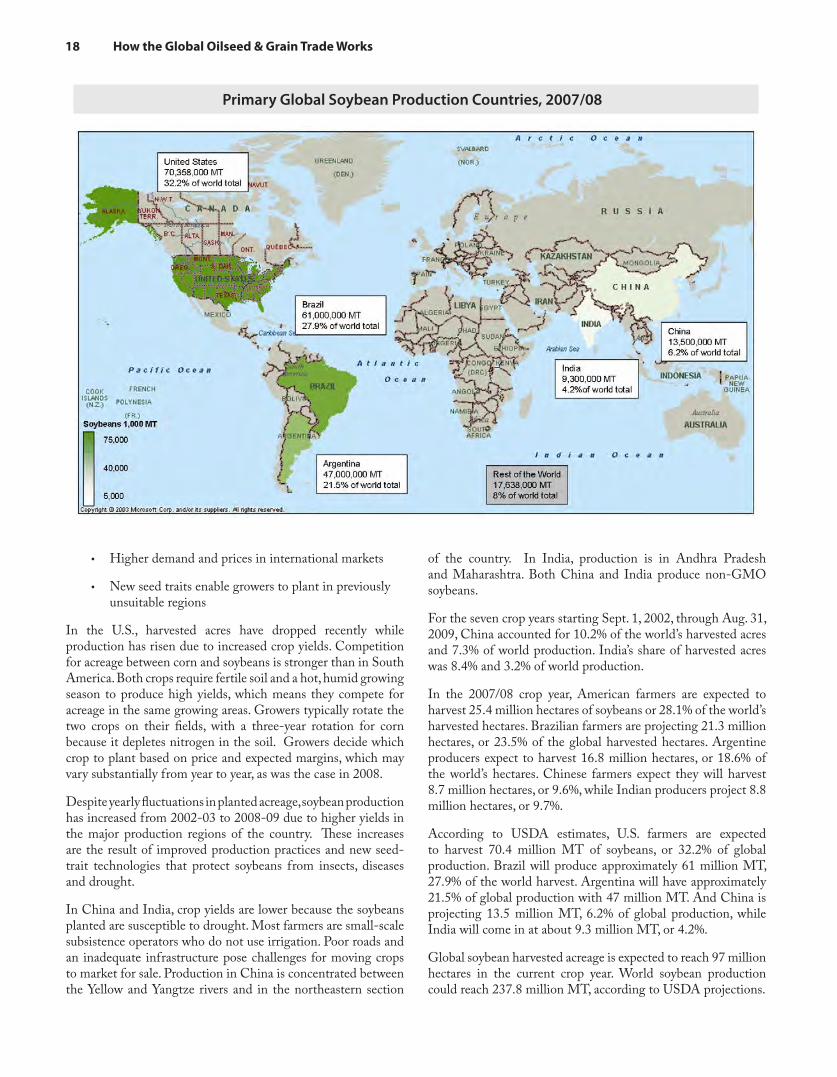
In the 2007/08 crop year, American farmers are expected to harvest 25.4 million hectares of soybeans or 28.1% of the world’s harvested hectares. Brazilian farmers are projecting 21.3 million hectares, or 23.5% of the global harvested hectares. Argentine producers expect to harvest 16.8 million hectares, or 18.6% of the world’s hectares. Chinese farmers expect they will harvest 8.7 million hectares, or 9.6%, while Indian producers project 8.8 million hectares, or 9.7%.
According to USDA estimates, U.S. farmers are expected to harvest 70.4 million MT of soybeans, or 32.2% of global production. Brazil will produce approximately 61 million MT, 27.9% of the world harvest. Argentina will have approximately 21.5% of global production with 47 million MT. And China is projecting 13.5 million MT, 6.2% of global production, while India will come in at about 9.3 million MT, or 4.2%.
Global soybean harvested acreage is expected to reach 97 million hectares in the current crop year. World soybean production could reach 237.8 million MT, according to USDA projections.
Primary Global Soybean Production Countries, 2007/08
Production-Growers 19
U.S. Soybean Growing Regions The primary growing regions for soybeans in the U.S. are located along the major waterways: Mississippi, Missouri, Illinois and Ohio rivers. USDA divides the major growing regions into six regions:
Eastern Corn Belt - Illinois, Indiana, Kentucky, Michigan, Ohio and Wisconsin
Western Corn Belt - Iowa, Kansas, Minnesota, Nebraska, North Dakota and South Dakota
Delta - Arkansas, Louisiana, Mississippi, Missouri and Tennessee
Southeast - Alabama, Florida, Georgia, North Carolina, South Carolina and Virginia
Northeast - Delaware, Maryland, New Jersey, New York, Pennsylvania and West Virginia
Southwest - Oklahoma and Texas
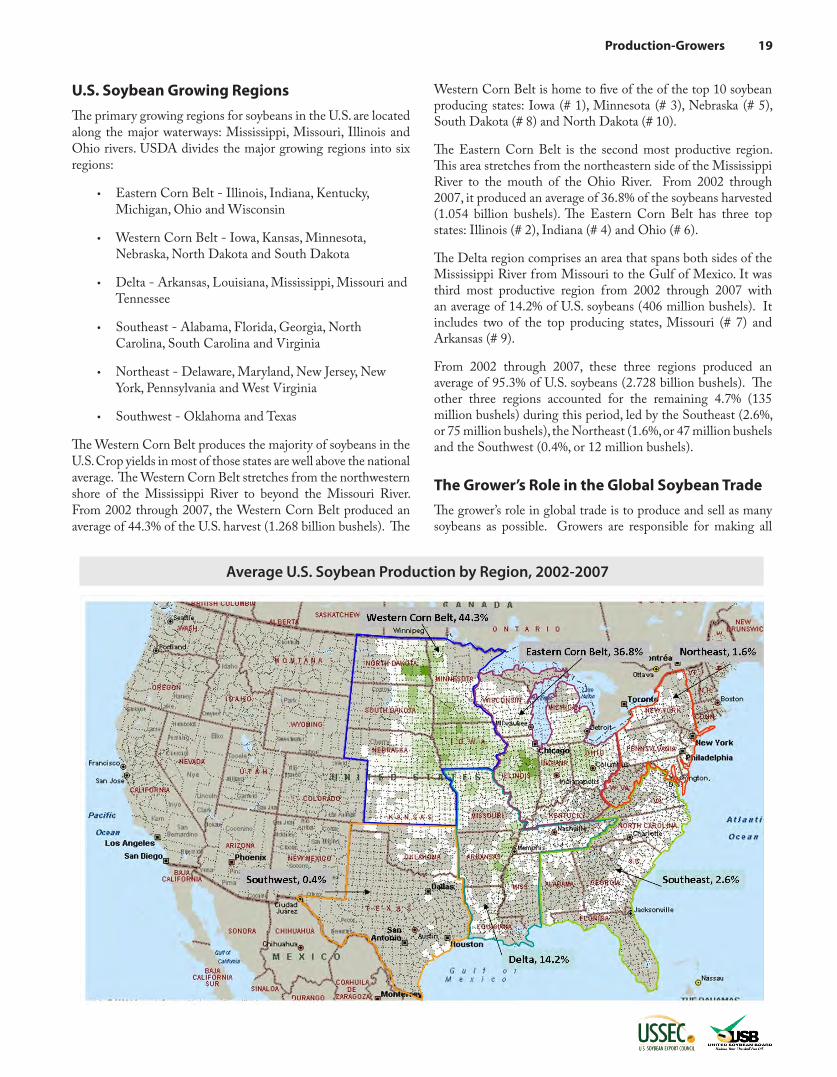
The Western Corn Belt produces the majority of soybeans in the U.S. Crop yields in most of those states are well above the national average. The Western Corn Belt stretches from the northwestern shore of the Mississippi River to beyond the Missouri River. From 2002 through 2007, the Western Corn Belt produced an average of 44.3% of the U.S. harvest (1.268 billion bushels). The
•
•
•
•
•
•
Western Corn Belt is home to five of the of the top 10 soybean producing states: Iowa (# 1), Minnesota (# 3), Nebraska (# 5), South Dakota (# 8) and North Dakota (# 10).
The Eastern Corn Belt is the second most productive region. This area stretches from the northeastern side of the Mississippi River to the mouth of the Ohio River. From 2002 through 2007, it produced an average of 36.8% of the soybeans harvested (1.054 billion bushels). The Eastern Corn Belt has three top states: Illinois (# 2), Indiana (# 4) and Ohio (# 6).
The Delta region comprises an area that spans both sides of the Mississippi River from Missouri to the Gulf of Mexico. It was third most productive region from 2002 through 2007 with an average of 14.2% of U.S. soybeans (406 million bushels). It includes two of the top producing states, Missouri (# 7) and Arkansas (# 9).
From 2002 through 2007, these three regions produced an average of 95.3% of U.S. soybeans (2.728 billion bushels). The other three regions accounted for the remaining 4.7% (135 million bushels) during this period, led by the Southeast (2.6%, or 75 million bushels), the Northeast (1.6%, or 47 million bushels and the Southwest (0.4%, or 12 million bushels).
The Grower’s Role in the Global Soybean Trade The grower’s role in global trade is to produce and sell as many soybeans as possible. Growers are responsible for making all
Average U.S. Soybean Production by Region, 2002-2007
20 How the Global Oilseed & Grain Trade Works
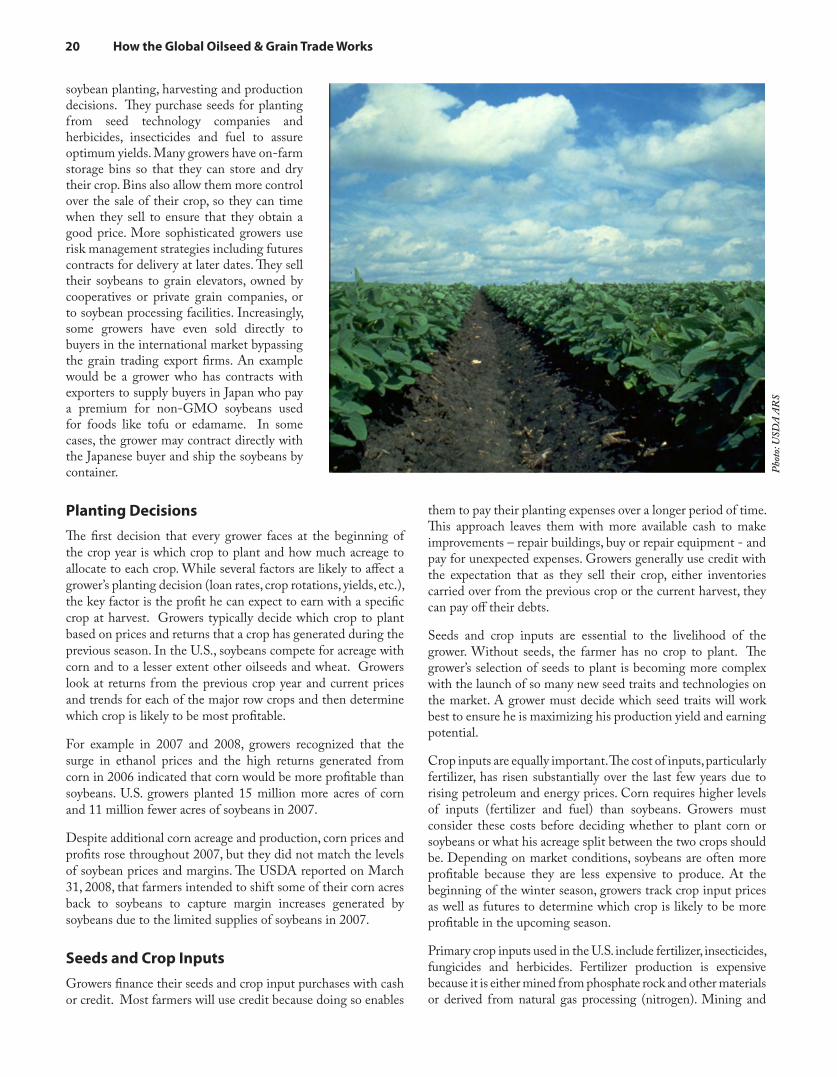
soybean planting, harvesting and production decisions. They purchase seeds for planting from seed technology companies and herbicides, insecticides and fuel to assure optimum yields. Many growers have on-farm storage bins so that they can store and dry their crop. Bins also allow them more control over the sale of their crop, so they can time when they sell to ensure that they obtain a good price. More sophisticated growers use risk management strategies including futures contracts for delivery at later dates. They sell their soybeans to grain elevators, owned by cooperatives or private grain companies, or to soybean processing facilities. Increasingly, some growers have even sold directly to buyers in the international market bypassing the grain trading export firms. An example would be a grower who has contracts with exporters to supply buyers in Japan who pay a premium for non-GMO soybeans used for foods like tofu or edamame. In some cases, the grower may contract directly with the Japanese buyer and ship the soybeans by container.
Planting DecisionsThe first decision that every grower faces at the beginning of the crop year is which crop to plant and how much acreage to allocate to each crop. While several factors are likely to affect a grower’s planting decision (loan rates, crop rotations, yields, etc.), the key factor is the profit he can expect to earn with a specific crop at harvest. Growers typically decide which crop to plant based on prices and returns that a crop has generated during the previous season. In the U.S., soybeans compete for acreage with corn and to a lesser extent other oilseeds and wheat. Growers look at returns from the previous crop year and current prices and trends for each of the major row crops and then determine which crop is likely to be most profitable.
For example in 2007 and 2008, growers recognized that the surge in ethanol prices and the high returns generated from corn in 2006 indicated that corn would be more profitable than soybeans. U.S. growers planted 15 million more acres of corn and 11 million fewer acres of soybeans in 2007.
Despite additional corn acreage and production, corn prices and profits rose throughout 2007, but they did not match the levels of soybean prices and margins. The USDA reported on March 31, 2008, that farmers intended to shift some of their corn acres back to soybeans to capture margin increases generated by soybeans due to the limited supplies of soybeans in 2007.
Seeds and Crop InputsGrowers finance their seeds and crop input purchases with cash or credit. Most farmers will use credit because doing so enables
them to pay their planting expenses over a longer period of time. This approach leaves them with more available cash to make improvements – repair buildings, buy or repair equipment - and pay for unexpected expenses. Growers generally use credit with the expectation that as they sell their crop, either inventories carried over from the previous crop or the current harvest, they can pay off their debts.
Seeds and crop inputs are essential to the livelihood of the grower. Without seeds, the farmer has no crop to plant. The grower’s selection of seeds to plant is becoming more complex with the launch of so many new seed traits and technologies on the market. A grower must decide which seed traits will work best to ensure he is maximizing his production yield and earning potential.
Crop inputs are equally important. The cost of inputs, particularly fertilizer, has risen substantially over the last few years due to rising petroleum and energy prices. Corn requires higher levels of inputs (fertilizer and fuel) than soybeans. Growers must consider these costs before deciding whether to plant corn or soybeans or what his acreage split between the two crops should be. Depending on market conditions, soybeans are often more profitable because they are less expensive to produce. At the beginning of the winter season, growers track crop input prices as well as futures to determine which crop is likely to be more profitable in the upcoming season.
Primary crop inputs used in the U.S. include fertilizer, insecticides, fungicides and herbicides. Fertilizer production is expensive because it is either mined from phosphate rock and other materials or derived from natural gas processing (nitrogen). Mining and
Phot
o: U
SDA
ARS
Production-Growers 21
producing raw materials for fertilizer from natural gas are very energy intensive. Fertilizer is applied before, during and after planting to improve soil conditions and yields.
Insecticides are used to protect crops in the field against insects that can consume a crop or create diseases that can damage the crop and reduce yields. Fungicides protect the crop from harmful fungi (mold) that reduce yields. Herbicides protect the crop against weeds that rob moisture from the crop.
Advanced seeds have stacked traits that provide combined crop protection against insects, weeds, and mold. While these new seeds with stacked traits are more expensive than conventional seeds, they enable the grower to reduce or eliminate synthetic inputs to protect their crops from disease and pests, and thus reduce costs.
How and Where Growers Sell Their Crops Soybean growers generally sell their crops to elevators, soybean processors, food processors or directly to the export market. Key decisions that farmers face when they are selling their soybeans include:
When should the crop be sold or stored?
Where should the crop be sold?
Which market should it be sold to?
The question of whether and when to store or sell a crop is critical for any grower. Sometimes a portion of the harvest must be sold immediately to raise funds to pay off loans or the grower does not have sufficient on-farm storage to store the entire crop.
•
•
•
The daily price at the local elevator and prices at the Chicago Board of Trade also influence a grower’s decisions.
When soybean futures prices are higher than the cash market - a situation called a carry - a grower may opt to sell only enough of his crop to pay off debts and provide cash flow for his family. He may store the balance of his crop on-farm or in a local elevator with the expectation that he can obtain a better price for his beans in the future. When the current cash price of soybeans is higher than the futures price, the market is not in a carry and the grower has an incentive to sell as much of his crop as possible to maximize his return.
The grower must look at prices in the local cash market and futures prices at the Chicago Board of Trade to determine if they will remain in a carry. The grower must also decipher market trends such as future demand from soybean processors, animal feed millers, food processors, biodiesel producers and the international market, to decide whether the market will be in a carry during the crop year.
Decisions of which market a grower should sell his crop into are complex and generally determined by location, the size of the operation and the prices being paid by each market outlet. Growers in the Western Corn Belt, Eastern Corn Belt and Delta regions have many options for markets. These range from interior and river elevators and soybean processors to direct sales to food processors and export grain terminals.
Each of these market outlets spends considerable time and money advertising their facilities to growers and listing daily soybean prices. These outlets send representatives out in the field to promote themselves to growers in an effort keep their handling and storage operations filled. Elevators and soybean
22 How the Global Oilseed & Grain Trade Works
processors that do not maximize their capacity are not operating efficiently. It is essential that they stay in constant touch with growers to ensure a steady supply of soybeans.
Once the grower has pulled together all relevant information, he must decide which market offers the best chance to maximize returns for his soybeans. If the grower is located in a region where several elevators are nearby, he must decide which elevator will offer the best price for his crop. This allows the grower to play the elevators against each other and gives the grower some leverage in pricing. If located in a region where there is only one elevator, the grower will have limited options for selling his crop and thus limited negotiation opportunities. He may have to pay increased transportation costs to haul his crop to a market where he can receive a higher price.
A key factor in deciding where to sell a crop is the cost of delivering the crop to a market outlet. A farmer in Louisiana is more likely to sell his soybeans directly to the export market because he is located nearer to the major export terminals than upstream elevators and soybean processors serving the domestic market. A farmer located close to a soybean processor or a food processor that sifts and cleans soybeans and sells them to the tofu markets is more likely to sell directly to them, particularly as his hauling costs may be less than selling to an elevator.
With rising costs for diesel and gasoline over the past five years, transportation costs and location are becoming ever more important factors in the selling decisions of growers. Transportation and handling costs negatively affect operating
margins and the amount of time it takes to deliver their soybeans to the market. As transportation costs continue to increase, growers have come under more pressure to sell their crops to the closest available market outlet. This trend is expected to continue as long as fuel prices remain high.
Most U.S. soybeans are sold to elevators and soybean processors because these two markets are well established and located in areas where the majority of the soybean crop is grown. Many elevators in the U.S. have been intentionally located to ensure easy access to the major soybean-producing regions.
Many soybean processing plants are located in major soybean origination areas as well. Beans exported to the international market usually are sold to elevators and soybean processing facilities first and then moved by rail, barge or truck to export grain terminals located in the Pacific Northwest, the Gulf of Mexico or the East Coast.
Large-scale soybean farmers outside the U.S. often sell their soybeans directly to the international market. This is usually not the case in the U.S. where even the large-scale farmers sell to elevators or soybean processors. For example, Blairo Maggi, based in the Brazilian state of Mato Grosso, produces approximately 3 million MT of non-GMO soybeans a year that he sells directly to international buyers, mainly from Europe and China. Maggi has built his own grain terminal in Itacoiatara that can handle 2 million MT of soybeans a year and a soybean crushing facility that produces meal and oil for domestic and international markets.
Quality 2�
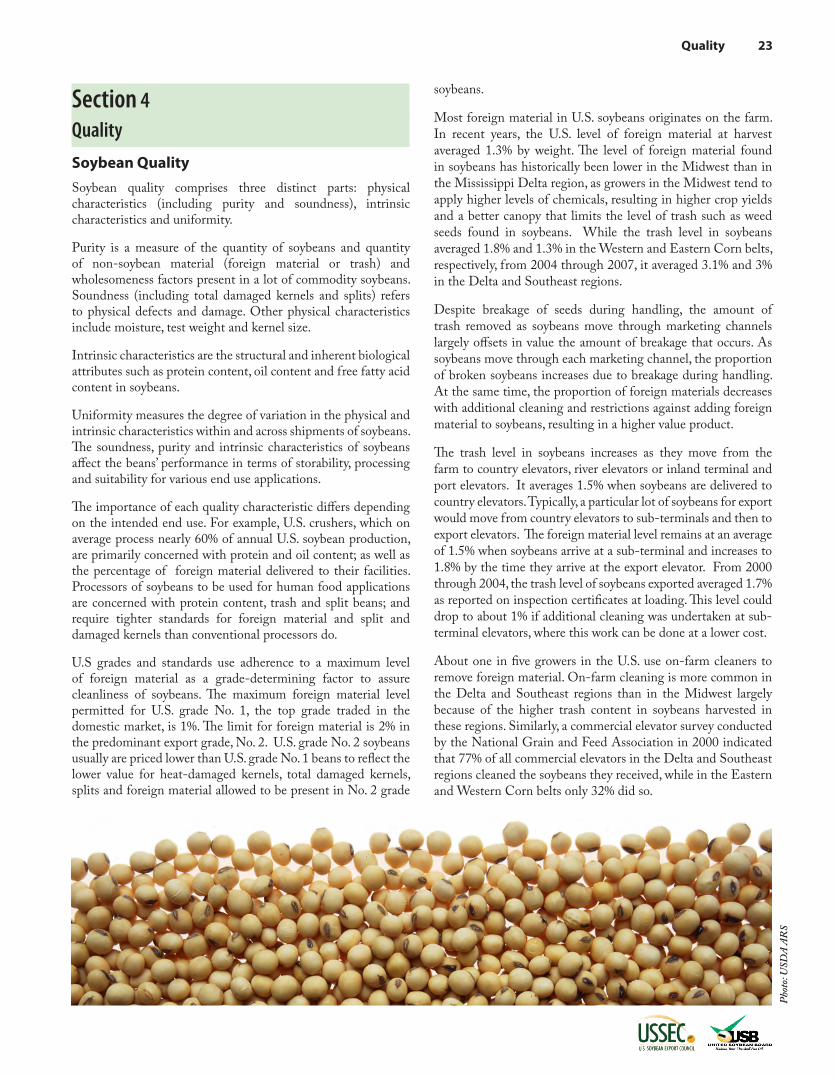
Section 4 QualitySoybean QualitySoybean quality comprises three distinct parts: physical characteristics (including purity and soundness), intrinsic characteristics and uniformity.
Purity is a measure of the quantity of soybeans and quantity of non-soybean material (foreign material or trash) and wholesomeness factors present in a lot of commodity soybeans. Soundness (including total damaged kernels and splits) refers to physical defects and damage. Other physical characteristics include moisture, test weight and kernel size.
Intrinsic characteristics are the structural and inherent biological attributes such as protein content, oil content and free fatty acid content in soybeans.
Uniformity measures the degree of variation in the physical and intrinsic characteristics within and across shipments of soybeans. The soundness, purity and intrinsic characteristics of soybeans affect the beans’ performance in terms of storability, processing and suitability for various end use applications.
The importance of each quality characteristic differs depending on the intended end use. For example, U.S. crushers, which on average process nearly 60% of annual U.S. soybean production, are primarily concerned with protein and oil content; as well as the percentage of foreign material delivered to their facilities. Processors of soybeans to be used for human food applications are concerned with protein content, trash and split beans; and require tighter standards for foreign material and split and damaged kernels than conventional processors do.
U.S grades and standards use adherence to a maximum level of foreign material as a grade-determining factor to assure cleanliness of soybeans. The maximum foreign material level permitted for U.S. grade No. 1, the top grade traded in the domestic market, is 1%. The limit for foreign material is 2% in the predominant export grade, No. 2. U.S. grade No. 2 soybeans usually are priced lower than U.S. grade No. 1 beans to reflect the lower value for heat-damaged kernels, total damaged kernels, splits and foreign material allowed to be present in No. 2 grade
soybeans.
Most foreign material in U.S. soybeans originates on the farm. In recent years, the U.S. level of foreign material at harvest averaged 1.3% by weight. The level of foreign material found in soybeans has historically been lower in the Midwest than in the Mississippi Delta region, as growers in the Midwest tend to apply higher levels of chemicals, resulting in higher crop yields and a better canopy that limits the level of trash such as weed seeds found in soybeans. While the trash level in soybeans averaged 1.8% and 1.3% in the Western and Eastern Corn belts, respectively, from 2004 through 2007, it averaged 3.1% and 3% in the Delta and Southeast regions.
Despite breakage of seeds during handling, the amount of trash removed as soybeans move through marketing channels largely offsets in value the amount of breakage that occurs. As soybeans move through each marketing channel, the proportion of broken soybeans increases due to breakage during handling. At the same time, the proportion of foreign materials decreases with additional cleaning and restrictions against adding foreign material to soybeans, resulting in a higher value product.
The trash level in soybeans increases as they move from the farm to country elevators, river elevators or inland terminal and port elevators. It averages 1.5% when soybeans are delivered to country elevators. Typically, a particular lot of soybeans for export would move from country elevators to sub-terminals and then to export elevators. The foreign material level remains at an average of 1.5% when soybeans arrive at a sub-terminal and increases to 1.8% by the time they arrive at the export elevator. From 2000 through 2004, the trash level of soybeans exported averaged 1.7% as reported on inspection certificates at loading. This level could drop to about 1% if additional cleaning was undertaken at sub-terminal elevators, where this work can be done at a lower cost.
About one in five growers in the U.S. use on-farm cleaners to remove foreign material. On-farm cleaning is more common in the Delta and Southeast regions than in the Midwest largely because of the higher trash content in soybeans harvested in these regions. Similarly, a commercial elevator survey conducted by the National Grain and Feed Association in 2000 indicated that 77% of all commercial elevators in the Delta and Southeast regions cleaned the soybeans they received, while in the Eastern and Western Corn belts only 32% did so.
Phot
o: U
SDA
ARS
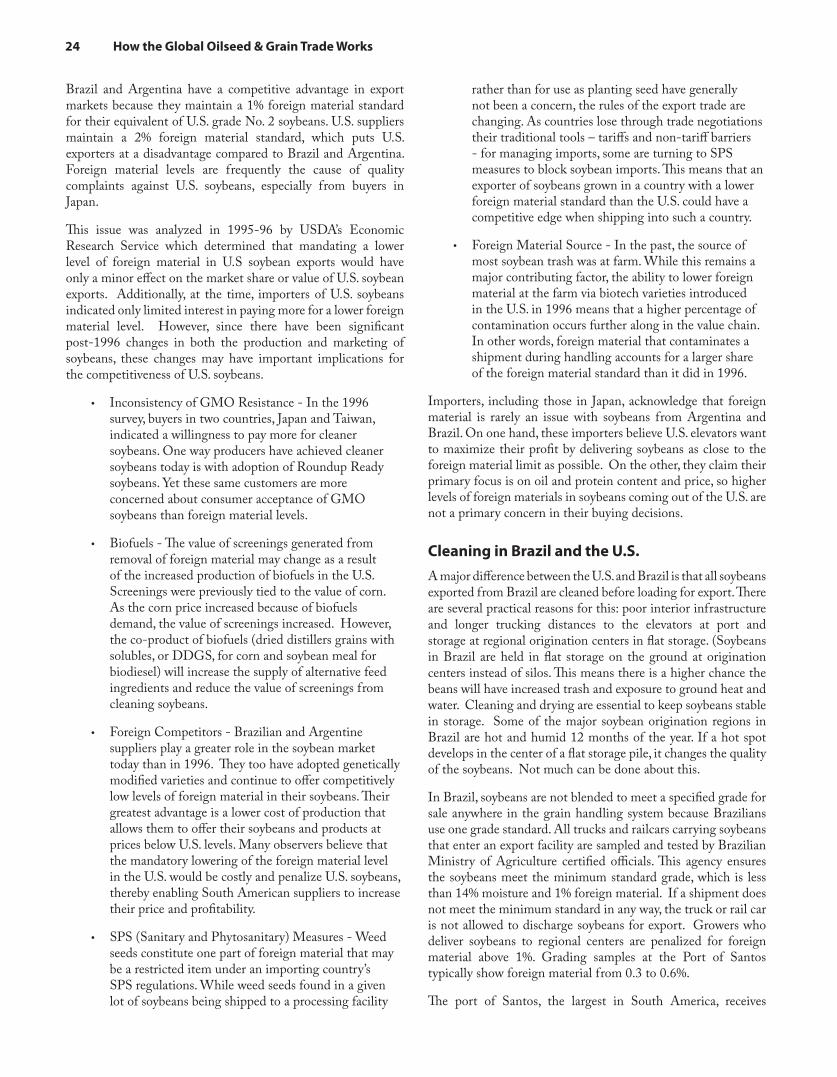
24 How the Global Oilseed & Grain Trade Works
Brazil and Argentina have a competitive advantage in export markets because they maintain a 1% foreign material standard for their equivalent of U.S. grade No. 2 soybeans. U.S. suppliers maintain a 2% foreign material standard, which puts U.S. exporters at a disadvantage compared to Brazil and Argentina. Foreign material levels are frequently the cause of quality complaints against U.S. soybeans, especially from buyers in Japan.
This issue was analyzed in 1995-96 by USDA’s Economic Research Service which determined that mandating a lower level of foreign material in U.S soybean exports would have only a minor effect on the market share or value of U.S. soybean exports. Additionally, at the time, importers of U.S. soybeans indicated only limited interest in paying more for a lower foreign material level. However, since there have been significant post-1996 changes in both the production and marketing of soybeans, these changes may have important implications for the competitiveness of U.S. soybeans.
Inconsistency of GMO Resistance - In the 1996 survey, buyers in two countries, Japan and Taiwan, indicated a willingness to pay more for cleaner soybeans. One way producers have achieved cleaner soybeans today is with adoption of Roundup Ready soybeans. Yet these same customers are more concerned about consumer acceptance of GMO soybeans than foreign material levels.
Biofuels - The value of screenings generated from removal of foreign material may change as a result of the increased production of biofuels in the U.S. Screenings were previously tied to the value of corn. As the corn price increased because of biofuels demand, the value of screenings increased. However, the co-product of biofuels (dried distillers grains with solubles, or DDGS, for corn and soybean meal for biodiesel) will increase the supply of alternative feed ingredients and reduce the value of screenings from cleaning soybeans.
Foreign Competitors - Brazilian and Argentine suppliers play a greater role in the soybean market today than in 1996. They too have adopted genetically modified varieties and continue to offer competitively low levels of foreign material in their soybeans. Their greatest advantage is a lower cost of production that allows them to offer their soybeans and products at prices below U.S. levels. Many observers believe that the mandatory lowering of the foreign material level in the U.S. would be costly and penalize U.S. soybeans, thereby enabling South American suppliers to increase their price and profitability.
SPS (Sanitary and Phytosanitary) Measures - Weed seeds constitute one part of foreign material that may be a restricted item under an importing country’s SPS regulations. While weed seeds found in a given lot of soybeans being shipped to a processing facility
•
•
•
•
rather than for use as planting seed have generally not been a concern, the rules of the export trade are changing. As countries lose through trade negotiations their traditional tools – tariffs and non-tariff barriers - for managing imports, some are turning to SPS measures to block soybean imports. This means that an exporter of soybeans grown in a country with a lower foreign material standard than the U.S. could have a competitive edge when shipping into such a country.
Foreign Material Source - In the past, the source of most soybean trash was at farm. While this remains a major contributing factor, the ability to lower foreign material at the farm via biotech varieties introduced in the U.S. in 1996 means that a higher percentage of contamination occurs further along in the value chain. In other words, foreign material that contaminates a shipment during handling accounts for a larger share of the foreign material standard than it did in 1996.
Importers, including those in Japan, acknowledge that foreign material is rarely an issue with soybeans from Argentina and Brazil. On one hand, these importers believe U.S. elevators want to maximize their profit by delivering soybeans as close to the foreign material limit as possible. On the other, they claim their primary focus is on oil and protein content and price, so higher levels of foreign materials in soybeans coming out of the U.S. are not a primary concern in their buying decisions.
Cleaning in Brazil and the U.S.A major difference between the U.S. and Brazil is that all soybeans exported from Brazil are cleaned before loading for export. There are several practical reasons for this: poor interior infrastructure and longer trucking distances to the elevators at port and storage at regional origination centers in flat storage. (Soybeans in Brazil are held in flat storage on the ground at origination centers instead of silos. This means there is a higher chance the beans will have increased trash and exposure to ground heat and water. Cleaning and drying are essential to keep soybeans stable in storage. Some of the major soybean origination regions in Brazil are hot and humid 12 months of the year. If a hot spot develops in the center of a flat storage pile, it changes the quality of the soybeans. Not much can be done about this.
In Brazil, soybeans are not blended to meet a specified grade for sale anywhere in the grain handling system because Brazilians use one grade standard. All trucks and railcars carrying soybeans that enter an export facility are sampled and tested by Brazilian Ministry of Agriculture certified officials. This agency ensures the soybeans meet the minimum standard grade, which is less than 14% moisture and 1% foreign material. If a shipment does not meet the minimum standard in any way, the truck or rail car is not allowed to discharge soybeans for export. Growers who deliver soybeans to regional centers are penalized for foreign material above 1%. Grading samples at the Port of Santos typically show foreign material from 0.3 to 0.6%.
The port of Santos, the largest in South America, receives
•
Quality 25
soybeans for export from the states of Sao Paulo, northern Parana, Mato Grosso, Mato Grosso do Sul, Goias and Minas Gerais. Santos differs from other ports in that several companies have their own loading facilities and operate their own sampling and testing, usually through an independent testing company certified by the Brazilian Ministry of Agriculture. This can result in different outcomes in quality and foreign material compared to other ports in Brazil.
At the port of Paranagua, soybeans are tested by port-authorized and ministry-certified personnel. If the soybeans fail to meet export quality standards, the truck or railcar load is returned to its origin without being unloaded at the port. The same procedures are followed at Punta Grossa, one of many facilities that receive soybeans directly from the field. Punta Grossa also has a crushing plant on-site.
This is one of the many plants in Brazil that receive soybeans from farms, the initial entry point into system. The plants receive soybeans by truck and rail. They test, clean and dry the soybeans before processing, storage or shipping to Paranagua for export. Each railcar is sampled and tested for moisture content, foreign material and dry weight. All soybeans are cleaned at the processing plants. The material removed by the cleaning process is used as fuel for the plant’s power generation.
Informal surveys in Brazil indicate that foreign material averages 1.8% from the field for non-GMO soybeans. Foreign material in soybeans from GMO fields averages around 1%. The industry pays a lower price to growers for soybeans which contain trash above 1%. But a difference with the U.S. is that in Brazil soybeans are likely to move directly to the port after first handling.
The primary difference between the U.S. and the Brazilian handling systems is that soybeans in Brazil typically have never been handled by an elevator until they reach the port. They are
handled by a front-end loader no more than three times prior to being loaded onto a ship hold. In the U.S. soybeans are elevated at least four or more times before loading onto a vessel for export. Soybean breakage is more likely in the U.S. than in Brazil because of the way beans are handled. The degree of breakage will depend on the quality and moisture of the beans.
Unlike Brazil, in the U.S. marketing system soybeans pass through at least three or four steps before entering the export market. Soybeans rarely go directly from the farm to the export market because there is a more complex marketing structure in the U.S. Many growers are located close to country elevators that are willing to buy their soybeans at a much lower cost to the grower than if he were to ship directly to the export market. Growers sell to country elevators, which sell to larger country elevators or river elevators. These elevators sell to the export market. This means much more handling is involved in moving soybeans to the export market in the U.S. than in Brazil. There is a higher probability that the physical characteristics of the soybeans will be damaged by handling at several elevators.
One positive aspect for U.S. growers is that this level of handling does not decrease the protein and oil content of the soybeans. These characteristics, along with price, are the primary concerns of buyers in the export market. In fact, USDA surveys show that protein, oil content and price are still the major factors that international buyers take into consideration when deciding where to source soybeans. The major challenge for U.S. soybeans is not quality but the lower cost of Argentine and Brazilian soybeans resulting from lower production costs (land and labor). The argument can be made that it makes little sense to invest resources in lowering the level of foreign material in U.S. soybeans. Rather, the focus should be on how U.S. growers can reduce production costs.
Soybean Meal QualityWhile the majority of soybean crushers in the U.S. deliver meal according to National Oilseed Processor Association (NOPA) specifications, there are a few who have focused on delivering higher quality meal. For example, Owensboro Grain is credited with offering the market a consistently high-quality product. The company rationalizes this extra effort by claiming that it often leaves them with the right of last refusal. This means it has the option to make any sale meeting a competitor’s price because Owensboro’s quality will be higher. Owensboro Grain has been able to consistently deliver a higher quality meal by making changes to its processing
Soybean storage Brazil
26 How the Global Oilseed & Grain Trade Works
conditions and parameters, resulting in a better amino acid profile. Owensboro Grain calculates that based on the quality difference it should receive a $10/MT premium from the marketplace for its high-quality meal, but it has only found that this difference confers a marketing advantage and not a direct margin benefit.
The primary argument against investing resources to become a quality-focused soybean processing firm is that the performance of meal buyers at feed compounder firms is judged on the basis of their ability to acquire soybean meal at the lowest possible cost. Bonuses are determined on the basis of benchmarks issued by the industry performance evaluation firm Agrimetrics Associates, Inc., which compares costs and profitability among various firms. Customer satisfaction is not a consideration. In the end, feed compounder firms do not specify what they consider to be an optimal meal profile beyond the NOPA specifications under which they purchase meal.
Unless otherwise specified by the client, all U.S. soybean processors meet NOPA contract standards for meal and oil.
Slight variations in the tolerances are permitted. For example, protein content can be 0.5% less. Hexane extraction results in a meal that is 0.5 to 0.7% fat, meeting the minimum requirement referenced in the NOPA sample contract. However, processors
Content PercentProtein Minimum 48
Fat Minimum 0.5Fiber Maximum 7
Moisture Maximum 12
NOPA Soybean Meal Specifications
Content PercentProtein Minimum 48
Fat Minimum 0.5Fiber Maximum 7
Moisture Maximum 12
NOPA Soybean Meal Specifications
may add back soapstock to the meal and arrive at a fat content of 1.2 to 1.8%, though this affects moisture level and the protein share of the meal. NOPA staff has stated that it will not reassess the contract standard specifications to better match the higher quality soybean being produced. Its member companies fear that changes in the specifications of premium contracts utilized to deliver higher quality meal will decrease their value. They argue that if all processors were compelled to deliver to a higher quality meal, this would reduce the incentive on the part of the buyer to pay an additional premium for the extra effort required.
Soybean meal must be off 0.5% or more from NOPA meal specifications for protein, fat, fiber or moisture before a customer can file a claim. The rate of out-of-spec material runs higher than the number of claims, which is a ratio the processor relies upon to make money. This out-of-spec material is delivered less frequently to regular buyers. Repeat customers are the most important to the processor and more consistent delivery of good product means that a slight premium may be earned by the regular supplier. However, too many claims against the processor add to costs and can result in disciplinary action against the plant manager.
A rule of thumb is that about 3% of shipments do not meet specifications. Any higher and the processor’s costs rise. Any lower and profits are given away. A processor purchasing soybeans with 37 to 38% protein content can be assured of obtaining 48% protein meal, which provides some room to adjust other attributes and fall within overall acceptable contract terms. Since the components are specified on a percentage basis and there are thresholds for variance, a lot of meal is not necessarily out-of-spec even though one component may exceed the spec and the threshold. For example, a meal measuring 48% protein, a half percent above the out-of-spec threshold, enables the processor to raise the fiber level of the meal above spec. By
Grain Elevators 27
Section 5 Grain Elevators Purchasing the CropElevators purchase crops directly from growers or other elevators. Depending upon their location, elevators may have to market aggressively to growers to assure ample supply of soybeans at harvest. If an elevator is located in the Western Corn Belt, Eastern Corn Belt or Delta region, it will have to market its facility more aggressively to growers because of competition from the other elevators located within these regions.
However, if an elevator is located in a region with little competition (primarily due to a lack of concentration in grain production), the elevator has more of a buyer’s market permitting it to offer lower prices because growers have fewer options for selling their crops. Marketing an elevator involves listing competitive bids on a daily basis and staying in close contact with growers.
Growers should know the capabilities, storage capacity, logistics and prices an elevator can provide before they decide to sell their soybeans. Once the grower feels comfortable with an elevator, he will haul his soybeans (usually by truck) to the elevator and sell at the daily price or deliver his crop as agreed to previously in a futures contract. Such a contract will state the delivery date, the quantity, quality (allowed moisture and trash content) and the price of the soybeans.
Soybeans are tested at the elevator to ensure they meet contract specifications. If they do, they are moved into a storage bin at the elevator. If the soybeans do not meet the contract, they can be returned to the farmer or the farmer is penalized.
Elevators purchase soybeans from other elevators. In the Western Corn Belt and Eastern Corn Belt, this practice is less common than in the Delta region. An elevator in the Western and Eastern Corn Belts will buy soybeans from other elevators only if they are unable to find enough soybeans from nearby farmers to operate at capacity, or if they need some “too dry” soybeans to mix-in with some “too wet” soybeans that the elevator purchased locally (e.g., because its county/region experienced continual rainy or foggy weather during its harvest season) in order to get the mixed soybeans to the proper moisture content.
In the Delta region, where not as many soybeans are produced, beans are shipped down river to reach export markets. Delta region elevators tend to purchase more soybeans from elevators located upriver from the Eastern and Western Corn Belt to assure they can run at capacity.
Elevator Marketing OptionsElevators have several choices when selling their soybeans. Most of an elevator’s soybeans are sold to processors that crush them to produce meal to sell to livestock feeders and oil to sell to refiners, biodiesel producers and the food processing and food service operators. Elevators also can also sell soybeans directly
to the food processors to be processed into tofu, tempeh and other soy products, to cattle feed lots, other elevators, soybean commodity brokers or export terminals that sell to the international market.
Brokerage firms also can be attractive buyers for elevators. These firms buy soybeans from the elevator and sell them on the open market. Although they compete for soybean sales with the elevator, brokers also will purchase soybeans when the elevator needs to sell to move its inventory. Brokers allow elevators to maintain margins and provide liquidity to the industry, despite being competitors to the elevators.
How Elevators Sell Their CropsPrimary domestic customers for elevators include processors, feedlots and export terminals. Primary international customers include soybean processors, feedlots and food processors. In both the domestic and international markets, processors are U.S. elevators’ primary customers. Over a five-year period (9/1/2002 to 8/31/2007) U.S. processors accounted for 57% of soybean sales. Export terminals purchased 35% of soybeans and cattle feeders purchased 5%. The remaining 3% was held as elevator carryover. Internationally, processors accounted for 84% of sales, feedlots purchased 7% and food processors 6%, with 3% as carryover.
The pricing mechanism helps elevator operators decide when and to whom to sell their soybeans. Like growers, elevators follow current market prices to decide when to sell their commodities. If the market is in a carry, an elevator may buy as many soybeans as possible and store them to take advantage of higher prices later. In a carry, the elevator will sell only what it needs to cover operational costs. When the market is not in a carry, spot prices are higher than in later months. In this situation, the elevator will buy as few soybeans as possible to operate at capacity while selling soybeans to maximize earnings.
Two factors determine an elevator operator’s decision as to whom and how to sell soybeans: the buyer’s location and the logistics costs for delivering soybeans to that buyer.
Once again, location is a key factor for an elevator when it comes to sales. The best location for an elevator as regards both purchases and sales is to be as close as possible to the major growing regions with access to rivers, major highways or major rail lines. This enables an elevator to purchase soybeans that are grown nearby while having easy access to transportation to ship to buyers located far away. Soybeans can be sold either FOB (free on board) or CIF (cost in freight). Most elevators in the U.S. interior sell soybeans FOB, which means the customer is responsible for the cost of moving the soybeans. As most inland elevators are small operations with a limited number of employees and resources, they want to focus on their core competency (buying and selling soybeans) and not worry about transportation bookings or changes in transportation costs.
Export elevators located near the coasts also sell FOB to their own international marketing teams or to third party customers
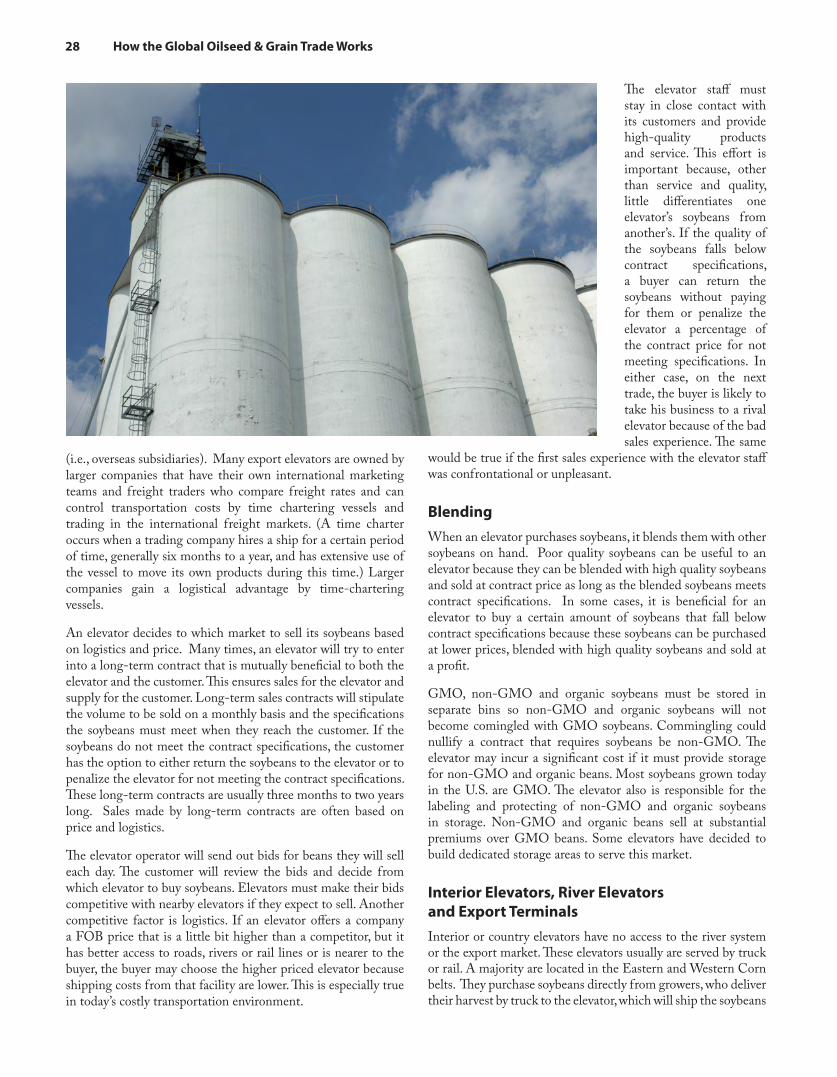
28 How the Global Oilseed & Grain Trade Works
(i.e., overseas subsidiaries). Many export elevators are owned by larger companies that have their own international marketing teams and freight traders who compare freight rates and can control transportation costs by time chartering vessels and trading in the international freight markets. (A time charter occurs when a trading company hires a ship for a certain period of time, generally six months to a year, and has extensive use of the vessel to move its own products during this time.) Larger companies gain a logistical advantage by time-chartering vessels.
An elevator decides to which market to sell its soybeans based on logistics and price. Many times, an elevator will try to enter into a long-term contract that is mutually beneficial to both the elevator and the customer. This ensures sales for the elevator and supply for the customer. Long-term sales contracts will stipulate the volume to be sold on a monthly basis and the specifications the soybeans must meet when they reach the customer. If the soybeans do not meet the contract specifications, the customer has the option to either return the soybeans to the elevator or to penalize the elevator for not meeting the contract specifications. These long-term contracts are usually three months to two years long. Sales made by long-term contracts are often based on price and logistics.
The elevator operator will send out bids for beans they will sell each day. The customer will review the bids and decide from which elevator to buy soybeans. Elevators must make their bids competitive with nearby elevators if they expect to sell. Another competitive factor is logistics. If an elevator offers a company a FOB price that is a little bit higher than a competitor, but it has better access to roads, rivers or rail lines or is nearer to the buyer, the buyer may choose the higher priced elevator because shipping costs from that facility are lower. This is especially true in today’s costly transportation environment.
The elevator staff must stay in close contact with its customers and provide high-quality products and service. This effort is important because, other than service and quality, little differentiates one elevator’s soybeans from another’s. If the quality of the soybeans falls below contract specifications, a buyer can return the soybeans without paying for them or penalize the elevator a percentage of the contract price for not meeting specifications. In either case, on the next trade, the buyer is likely to take his business to a rival elevator because of the bad sales experience. The same
would be true if the first sales experience with the elevator staff was confrontational or unpleasant.
BlendingWhen an elevator purchases soybeans, it blends them with other soybeans on hand. Poor quality soybeans can be useful to an elevator because they can be blended with high quality soybeans and sold at contract price as long as the blended soybeans meets contract specifications. In some cases, it is beneficial for an elevator to buy a certain amount of soybeans that fall below contract specifications because these soybeans can be purchased at lower prices, blended with high quality soybeans and sold at a profit.
GMO, non-GMO and organic soybeans must be stored in separate bins so non-GMO and organic soybeans will not become comingled with GMO soybeans. Commingling could nullify a contract that requires soybeans be non-GMO. The elevator may incur a significant cost if it must provide storage for non-GMO and organic beans. Most soybeans grown today in the U.S. are GMO. The elevator also is responsible for the labeling and protecting of non-GMO and organic soybeans in storage. Non-GMO and organic beans sell at substantial premiums over GMO beans. Some elevators have decided to build dedicated storage areas to serve this market.
Interior Elevators, River Elevators and Export TerminalsInterior or country elevators have no access to the river system or the export market. These elevators usually are served by truck or rail. A majority are located in the Eastern and Western Corn belts. They purchase soybeans directly from growers, who deliver their harvest by truck to the elevator, which will ship the soybeans
Grain Elevators 29
to processors and other market outlets by truck or rail. Most of these facilities have access to rail lines which enable them to ship their products to markets outside their immediate area.
The scale of interior elevators is determined by the growing area they serve. Larger elevators can store up to 1 million bushels. These elevators are often located on or near major rail lines that can load unit shuttle trains of up to 110 hopper cars destined for shipping to export elevators on any of the three coasts. Larger elevators located in major growing regions that can load unit shuttle trains enjoy a competitive advantage over the smaller elevators due to economies of scale. They can buy and sell larger amounts of soybeans at any given time, which improves their margins and turnaround times. Turnaround times are essential to an elevator’s profitability because the more inventory is turned over in a year, the more profit the elevator will generate. These elevators can support larger sales and marketing teams as they need to buy and sell more soybeans to remain profitable and risk management teams to control volatility in prices.
Smaller interior elevators usually are located in regions where fewer soybeans are grown. While the competition for buying and selling is not as great, these elevators cannot load unit shuttle trains, which limits their sales and inventory turnover. However, if they are located in a region with limited competition and an ample soybean supply from growers, they can remain profitable.
Interior elevators tend to sell their products FOB to soybean processors, feedlots, livestock and poultry producers and the export market with the customer responsible for transportation costs. A majority of their soybeans are sold to processors or to river elevators that sell to the domestic or international markets. These elevators mix GMO beans with any conventional soybeans they happen to also purchase and sell them to customers in their region or across state lines.
River elevators are located on the U.S. river system, which is served by barge, rail or truck. They purchase soybeans from farmers or interior elevators that wish to sell their crops down river. River elevators typically can ship by three modes of transportation - barge, truck or rail. This provides them with better access to international markets than most inland elevators. They tend to be larger than interior elevators and are located near some of the best farmland in the U.S.
The Chicago Board of Trade considers many river elevators to be delivery elevators. When soybeans are being delivered to honor a contract, these elevators can handle more volumes than other elevators. River elevators can have higher inventory turnover
every other month. They must empty some of their storage bins to accept new contracted soybeans. This change in inventory can lead to higher profits. For the larger grain-handling firms, river elevators represent profitable assets. Many U.S. river elevators are owned by the large processing companies because it is easier to move larger quantities of soybeans to their plants on the river system. River elevators usually sell their soybeans to processing facilities down river, to export facilities in the Gulf of Mexico or to processing plants.
Export grain terminals are the largest elevators and the most valuable assets for many large grain companies. Very little of their inventory needs are delivered by truck by growers. Export terminals move their soybeans by rail, barge and ocean-going vessel. These terminals have facilities that allow them to receive soybeans by barge or rail and berths that enable them to load soybeans onto a Panamax vessel with a capacity of 55,000 MT for the international market. These terminals typically can move up to 8 million metric tons of soybeans a year. Their inventory turnover is much larger than interior or river elevators as they purchase and sell in larger volumes.
The majority of export terminals are owned and operated by major soybean origination companies, such as ADM, Bunge, Cargill, Louis Dreyfus and AGP. They require a strong network of interior origination assets to assure operation at full capacity and are more expensive to operate than interior elevators because of size. While soybeans can be sold FOB or CIF to domestic and international customers, most are sold to the international market. Domestic sales are made to local processors, feedlots and livestock and poultry producers. These sales are made by rail or barge and usually sold FOB so the buyer can control barge and rail freight schedules and costs.
International sales are exported to international processors, livestock and poultry producers, food processors that use soybeans for direct human food consumption and feed millers. These shipments, most commonly made in an ocean-going vessel known as a Panamax (55,000 MT) are sold FOB. Most of the larger soybean export terminals prefer to sell FOB to international marketing companies so that they don’t have to concern themselves with freight trading. The international marketing companies will sell their products CIF destination port to the customer because they have freight trading capabilities and can control their freight rates and logistics.
The major markets for international shipments from the U.S. include China, Mexico, which is primarily served by rail, and the EU.
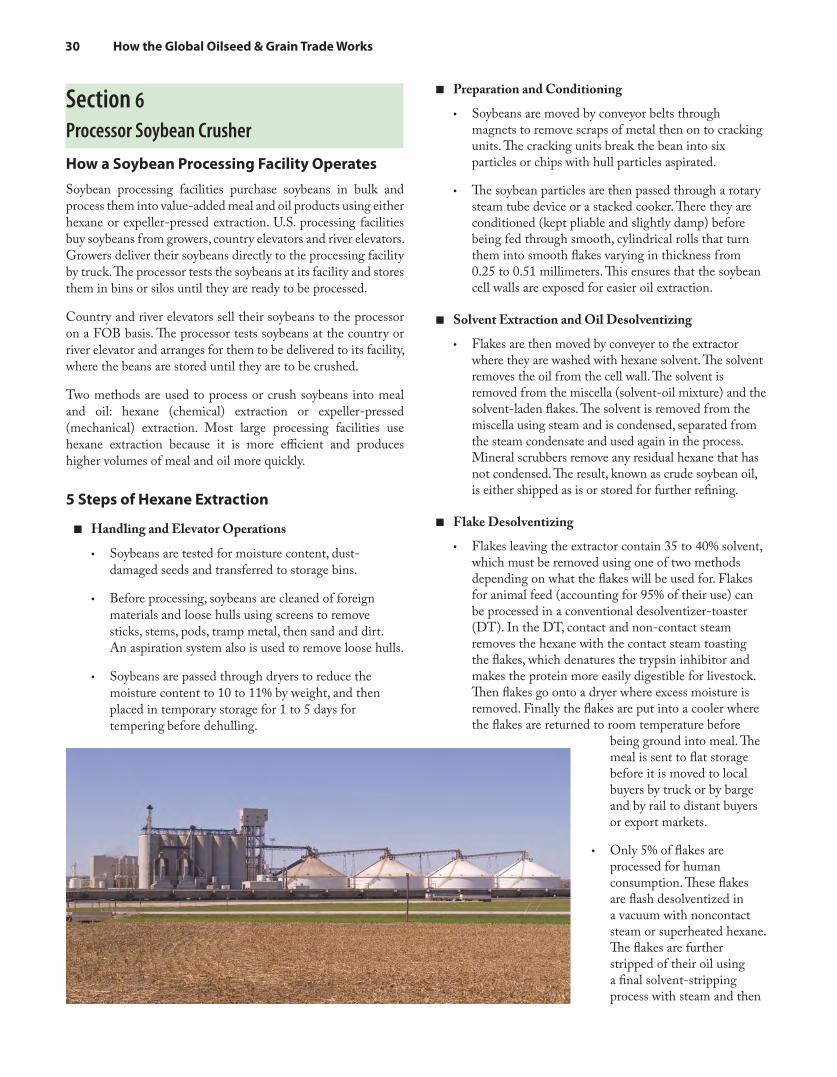
�0 How the Global Oilseed & Grain Trade Works
Section 6 Processor Soybean CrusherHow a Soybean Processing Facility OperatesSoybean processing facilities purchase soybeans in bulk and process them into value-added meal and oil products using either hexane or expeller-pressed extraction. U.S. processing facilities buy soybeans from growers, country elevators and river elevators. Growers deliver their soybeans directly to the processing facility by truck. The processor tests the soybeans at its facility and stores them in bins or silos until they are ready to be processed.
Country and river elevators sell their soybeans to the processor on a FOB basis. The processor tests soybeans at the country or river elevator and arranges for them to be delivered to its facility, where the beans are stored until they are to be crushed.
Two methods are used to process or crush soybeans into meal and oil: hexane (chemical) extraction or expeller-pressed (mechanical) extraction. Most large processing facilities use hexane extraction because it is more efficient and produces higher volumes of meal and oil more quickly.
5 Steps of Hexane Extraction
Handling and Elevator Operations
Soybeans are tested for moisture content, dust-damaged seeds and transferred to storage bins.
Before processing, soybeans are cleaned of foreign materials and loose hulls using screens to remove sticks, stems, pods, tramp metal, then sand and dirt. An aspiration system also is used to remove loose hulls.
Soybeans are passed through dryers to reduce the moisture content to 10 to 11% by weight, and then placed in temporary storage for 1 to 5 days for tempering before dehulling.
■
•
•
•
Preparation and Conditioning
Soybeans are moved by conveyor belts through magnets to remove scraps of metal then on to cracking units. The cracking units break the bean into six particles or chips with hull particles aspirated.
The soybean particles are then passed through a rotary steam tube device or a stacked cooker. There they are conditioned (kept pliable and slightly damp) before being fed through smooth, cylindrical rolls that turn them into smooth flakes varying in thickness from 0.25 to 0.51 millimeters. This ensures that the soybean cell walls are exposed for easier oil extraction.
Solvent Extraction and Oil Desolventizing
Flakes are then moved by conveyer to the extractor where they are washed with hexane solvent. The solvent removes the oil from the cell wall. The solvent is removed from the miscella (solvent-oil mixture) and the solvent-laden flakes. The solvent is removed from the miscella using steam and is condensed, separated from the steam condensate and used again in the process. Mineral scrubbers remove any residual hexane that has not condensed. The result, known as crude soybean oil, is either shipped as is or stored for further refining.
Flake Desolventizing
Flakes leaving the extractor contain 35 to 40% solvent, which must be removed using one of two methods depending on what the flakes will be used for. Flakes for animal feed (accounting for 95% of their use) can be processed in a conventional desolventizer-toaster (DT). In the DT, contact and non-contact steam removes the hexane with the contact steam toasting the flakes, which denatures the trypsin inhibitor and makes the protein more easily digestible for livestock. Then flakes go onto a dryer where excess moisture is removed. Finally the flakes are put into a cooler where the flakes are returned to room temperature before
being ground into meal. The meal is sent to flat storage before it is moved to local buyers by truck or by barge and by rail to distant buyers or export markets.
Only 5% of flakes are processed for human consumption. These flakes are flash desolventized in a vacuum with noncontact steam or superheated hexane. The flakes are further stripped of their oil using a final solvent-stripping process with steam and then
■
•
•
■
•
■
•
•
Processor Soybean Crusher �1
passes through a condenser that collects the hexane to be used again. This process produces white flakes that are passed through a cooker and cooler. Flash desolventizing is far less efficient than conventional desolventizing in hexane recovery and in saving energy.
Oil Refining
Crude soybean oil is shipped to a customer for further processing for food or industrial uses or is refined on-site at an integrated crusher-refiner facility. Crude soybean oil contains naturally occurring proteins - free fatty acids and gums - that must be removed before they can be used in foods. Gums must be removed for lecithin recovery or before export of the oil as crude degummed oil. All exported oil is traded as degummed.
An alkali solution is used to react with the free fatty acids and gums and enable their subsequent removal using a centrifuge. The oil is then washed with water to remove residual soap (resulting from saponification of small amounts of triglycerides) and a bleaching process is used to remove color producing elements within the oil (carotenoids and chlorophyll) using adsorbent acid-activated clays. A deodorization process employs steam injection under high pressure to remove any volatile compounds. Then the oil is filtered and stored for use or transport.
Further Oil Processing Some food applications such as baked products require a fat that has a certain stiffness (plasticity or solidity) at room temperature. Naturally occurring stearic oils derived from tropical oils such as palm can meet this need for baking, but those oils also are high in saturated fat. Soybean oil, which has a lower saturated fat level, does not provide the same level of stiffness unless it is hydrogenated. This process gives the oil a complete or partial stiffness at room temperature. Therefore it is able to compete with tropical oils.
During hydrogenation, heat is combined with a metal catalyst (nickel, zinc, copper or other reactive metals) and hydrogen to catalyze the hydrogen and carbon atoms in the refined oil. This converts the fatty acids by adding hydrogen atoms to their molecular carbon chain. The result is a stiffer shape of the molecule. The substance becomes semi-solid or solid, which enables the soybean oil to mimic a tropical oil such as coconut fat, a 92% saturated fat. Hydrogenation increases the melting point of the oil and its stability for advanced shelf life.
Hydrogenation creates a synthetic trans fat that increases the risk of cardiovascular problems in humans and must be declared on food products. Food processors are shifting away from hydrogenation and searching for other solutions, including increased use of tropical oils and biotechnology to develop soybean traits to increase oil stability.
Hexane extraction is used by most large-scale crushers since it
■
•
•
assures about a 40% higher oil yield over expeller press extraction. This gives the process economy of scale.
Expeller pressed extraction is used by smaller facilities serving specialty markets. Those specialty customers will pay a premium for non-solvent extracted soybean meal and oil. In this process, heat and high pressure are applied in an expeller to extract oil from the soybean. While less efficient than hexane extraction, expeller-pressed extraction does produce “natural” oil. This extraction method is typically used to process organic and non-GMO soybeans, since large-scale processing facilities don’t want to invest time and money in segregating and processing low-volume specialty soybeans.
When a soybean is processed, it produces two value-added products: meal and oil. Soybean meal is a high protein vegetable product that is used by animal feed millers and the soy protein industry. These millers mix soybean meal, corn and other commodities into feed formulations for the livestock and poultry sector. Soybean meal provides the protein for these animals and is fed mostly to hogs and poultry. The soy protein industry uses meal to produce protein concentrates and soy protein isolates used for human consumption. Processors can sell their meal directly to these markets. They can store the meal to sell it at a higher price. Or they can sell their meal to elevators. Generally, processors will sell meal to these market outlets FOB so they don’t have to worry about transportation costs. The buyer will come to the facility, test the product to ensure it meets contract specifications and arrange transportation to deliver the meal to the buyer.
Soybean oil, the other processing by-product, is a vegetable oil used in cooking, biodiesel production and making of biodegradable plastics and adhesives. Processed soybean oil is called crude soybean oil. This oil is used by biodiesel and industrial-plastics makers, but it must be refined before being sold to food processors and the food service industry. Food processors will use the oil directly or blended in their products. Many processing plants have refineries on site so they can sell directly into the food processing industry. These processors can refine the oil at their facility and sell it to processors at a higher price. Or they can sell crude oil at a lower price to biodiesel and industrial-plastics makers. Generally, they will only sell to the biodiesel and industrial markets if refining margins are low or they have a surplus on hand. Processors that do not have refineries on site sell their crude to refiners and the biodiesel and industrial markets. Processors can sell their crude oil FOB in rail car tankers, trucks or barges to refiners and biodiesel and industrial markets. They are not responsible for transportation. They may store the oil in hopes of future higher prices. They may refine the oil onsite and sell it to processors or sell the oil to other tank storage facilities closer to the export market.
Crush Margin ReviewThe relationship between the soybean and its products, meal and oil, is operational, physiological and economic in nature. The value of the three components is tightly interlinked and often
�2 How the Global Oilseed & Grain Trade Works
dynamic. U.S. growers plant approximately 70 million acres of soybeans each year. Yet few of the 3 billion bushels soybeans harvested are directly digestible. About one-third of annual U.S. production is exported, and two-thirds are processed to obtain protein feed for animals, vegetable oil and high-value food products. The variable margin that processors derive from crushing soybeans to create these products is one of the most intriguing and challenging aspects of the entire soybean and product-value chain.
Soybean crush refers to both the physical processing of soybeans and the margin calculation of the process. The margin is derived by subtracting the cost of one bushel of soybeans from the combined value of meal and oil produced from that single bushel. The three commodities (raw soybeans, meal and crude oil) are traded as separate futures contracts on the Chicago Board of Trade, making a three-way spread trade possible and providing a financial mechanism for valuing the process.
The Board of Trade’s contract for soybeans is 5,000 bushels. Meal is contracted at 100 short tons and oil at 60,000 pounds. Soybeans are priced by the bushel, meal by the short ton (2,000 pounds) and oil by the pound. This variety in pricing units means there must be a common denominator to make the calculation understandable. The margin is in dollars per bushel.
This computed value for futures contracts is known as the board crush, a valuation of futures prices that does not necessarily reflect prevailing prices in the cash market. At times there may be a substantial difference in value between futures prices and cash prices in one or all of these products. At any time, the board crush margin may not accurately reflect what is going on financially in the processing industry at the plant level.
A modern hexane extraction processing facility will efficiently produce output streams in the following approximate ratios:
1 bushel soybeans (60 lbs.) =
44 lbs. high protein (48%) meal (73% yield). Yield is the amount of meal, oil and hulls that a soybean produces.
11 lbs. soybean oil (18% yield)
3.5 lbs. hulls-fiber (6% yield)
1.5 lbs. of shrink (3% loss)
Because of the different contract sizes and yield factors, the Board of Trade’s crush spread must be balanced to reflect real output streams. Traders have addressed this need by standardizing the spread into 50,000 bushel packages: 10 soybean contracts (50,000 bushels), 11 soybean meal contracts (50,000 bushels x 44 lbs. = 2,200,000 pounds/100 short tons = 11), and 9 soybean oil contracts (50,000 bushels x 11 lbs. = 550,000 pounds/60,000 pounds = approximately 9). The margin calculation of the product outputs are converted in the following manner:
•
•
•
•
Soybean meal price x .022 (44 lbs. of 48% protein meal per bushel/2,000 lbs. = .022)
+ soybean oil price x 11 (11 lbs. of oil per bushel)
- soybean price per bushel
= crush margin
Using prices from July 22, 2008, the following board crush can be calculated, using the August Board of Trade futures:
Soybean meal = $8.34 ($379.20 x .022)
+ soybean oil = $6.61 ($.6013 x 11)
- soybeans = $14.16 ¾
= crush margin of $.78 ¼ per bushel
The board crush does not include factoring for hulls and shrink and is therefore commonly referred to as the gross processing margin. The board crush spread is actively traded by processors as a bona fide hedge against the risk of margin variation, and by speculators seeking to profit from correctly anticipating the forthcoming price direction of the spread.
The trade initially can be transacted as a spread trade by member brokers on the Board of Trade’s trading floor. Or it can be legged, with each component individually executed to gain potential advantage by correctly trading one contract before the others. The choices are available when liquating the trade. The processing industry uses both methods of trading the crush margin. After identifying a favorable crush margin trade and establishing a futures position, the individual components of the futures trade are eventually liquidated as the cash commodity is purchased or sold. For example, if an August crush margin trade was executed in March by the ABC Soybean Crushing Company, the short soybean oil position would be purchased and liquidated in April when the company contracted to sell cash soybean oil to XYZ Salad Dressing Company for August shipment.
ABC bought a quantity of soybeans from farm producers that equaled the crush spread, so the soybean leg of the crush margin futures trade was sold, liquidating that leg. Finally, a large hog feeding operation contracted with ABC for delivery of soybean meal in August, and the remaining short futures position in soybean meal was liquidated. The original trade established an August operating margin for the firm by locking in the value differential between ABC’s raw material and primary output products. This was an effective way for the company to manage its risk in the volatile world of agricultural product pricing.
The crush margin is a primary-decision metric used by processors to determine the present value of their crushing capabilities and to helping them make operational “go” or “no go” decisions. Processors find the board crush margin to be a vital tool as they continually assess the profitability of their plants and their levels of relative competitiveness in the industry.
The geographic location of a plant may affect its unique processing margin dramatically. Regional price variations may
Processor Soybean Crusher ��
result from differing levels of local soybean availability and access to storage, freight and logistical issues, local feed demand and the availability of competing feed products, and the presence of downstream food manufacturing facilities.
An efficient soybean processing plant operating in Illinois is likely to have an advantage over a similar plant in Utah. The Illinois facility has a much better chance of tapping into an abundant supply of locally grown raw soybeans with minimal incoming freight costs. It may have a superior logistical advantage for exports of product. And the Midwestern location is probably much closer to food manufacturers and livestock feed opportunities. All of these factors will be reflected in the prices of the respective products, affecting the cash crushing margin and resulting in potentially superior returns for the Illinois plant.
Decision of When to Crush Soybean processing has a significant advantage over other industries, with its transparency of supply-and-demand information for raw materials and output products, publicly available pricing information and access to effective risk-management tools. However, the market is typically volatile and can pose a serious threat to the long-term future of any oilseed processing enterprise. As we have already seen, market uncertainty and variability exists in both the futures market and the cash markets, but the two are not always in lockstep.
This divergence is called basis. For processors, basis represents additional risks, since the relative value of each cash market component may move in different directions. An example of basis risk is found in the previous section - where the Illinois processing plant is compared to the plant in Utah. Every processor in the industry faces many of the same sourcing, logistical and marketing challenges as those two firms. However, the impact of those factors differs from location to location, assuring a unique set of pricing variables for each operation and area. Managers must make decisions every day on how to best use their capital investment - plant and equipment - and establish a positive cash flow to support the enterprise.
Generally speaking, processing firms are in the business of converting soybeans into products of higher value. The entry cost is a firm’s invested capital and fixed operating costs. Margins are not constant. They can be unpredictable and not always positive. The most difficult question asked by an investor could be: “Why do negative margins sometimes exist, and how can I best protect my investment under those circumstances?”
Much has been written on how processors make their decisions about plant utilization rates and fixing their margins through hedging versus waiting, all to get better returns. Some studies have likened processing returns to the potential for gains from a call option - the call option being the processor’s operational resource – the plant. Some theoreticians argue that once the crush margin for the plant has been hedged, the option has been exercised and the decision to process the soybeans is irreversible.
The oilseed processing industry has attracted many creative and entrepreneurial individuals who have formulated appropriate strategies to address market variability and even short-term negative margins. Nothing seems to be irreversible in this industry.
Most soybean processing plants are designed and maintained to operate at or near nameplate capacity for 330 to 350 days a year. Downtime is expensive, with maximum use needed to cover fixed costs. Annual maintenance, repairs and equipment replacement are tightly scheduled to limit the amount of time the plant is offline. However, plants may be shut down when market conditions and pricing do not provide positive operating margins. Even if commitments for products have been made, plants may shut down, sell their soybean inventories and buy-in replacement products from competitors to meet obligations. This is the reverse crush, selling soybeans and buying products for delivery to customers. It can be either a defensive strategy or an aggressive trade to potentially capture gains if margins are expected to improve. The bet that a crusher would make is that margins are likely to improve if the industry takes enough production capacity off-line. The cause of decreased margins may be too much product available on the market or too few soybeans.
Selling End ProductsSoybean meal in the U.S. is sold to animal feed mills, aquaculture operators, feed lots, soy protein producers and the export market. Since soybean meal has a higher protein content than other vegetable protein meals, animal feed millers prefer to use soybean meal as a high protein ingredient in their feed formulations. Meal works very well in poultry, swine and dairy rations because it is high in protein and easily digestible. Feed mills mix soybean meal with corn and other commodities to create feed rations that are high in protein (from soybean meal) and carbohydrates (from corn). Soybean meal can also be sold directly to feedlots that use a mix of soybean meal and corn to feed their livestock.
Aquaculture is another industry that consumes soybean meal. Aquaculture or fish farms have become commonplace in certain regions along the U.S. river systems. These farms consist of large pools of fish that are fed soybean meal as a protein ingredient.
The soy protein industry uses the white flakes from soybean meal processing to produce protein concentrates and protein isolates that are incorporated as an ingredient in human food products. The soy protein industry has developed quickly over the last 10 years, due to increased consumer dietary concerns. Protein concentrates and protein isolates, which are very high in protein, are consumed as meat alternatives, in pet and animal feed, in functional foods, nutrition bars and energy drinks.
Most processors will sell their meal to customers FOB. The customer is responsible for moving the meal from the processing plant, testing the meal at the plant and arranging transportation from the plant to its destination. Most sales to customers are made in small quantities since these customers buy just enough soybean meal to meet their needs on a monthly to 45-day basis.
�4 How the Global Oilseed & Grain Trade Works
These sales are moved by truck, rail or barge depending on the location of their destination.
Buyers do not want to have excess inventory on hand for too long. Some buyers are willing to purchase soybean meal several months in advance of the delivery date if current prices are lower than future prices. But these customers must use risk management strategies to hedge against dropping prices in the future. This is true in the international market as well.
Crude soybean oil is sold to refiners, food processors with refineries, biodiesel refiners and industrial markets. Refiners buy the crude oil and refine it into RBD (refined, bleached, deodorized) soybean oil that can be bottled and sold to food processors and used in foods like mayonnaise or salad dressings. (A processor with an on-site refinery can do this as well and sell the RBD soybean oil to food processors or the retail market at higher prices). Food processors that have oil refining facilities can buy crude soybean oil, refine it into RBD soybean oil and use it in their own processed foods as a blend with other oils or directly. Biodiesel producers use crude soybean oil as a feedstock and industrial companies use it to produce biodegradable plastics and adhesives.
Soybean oil usually is moved by truck, railcar tanker or barge. Customers typically purchase just enough to cover their needs for a month because they do not want to carry too much inventory. Soybean oil customers, like meal customers, will contract to buy products several months before the delivery date if prices are lower in the near future than in the distant future. They will have to hedge against the possibility of further declines in price. Most refiners and food processors will not accept long-term supply contracts with individual processors for longer than three to six months. Biodiesel producers prefer to have long-term contracts to ensure feedstock supply.
These types of contracts last up to three years, with the biodiesel producer agreeing to pay the market price for the soybean oil each month. These contracts are beneficial to both the processor and the producer because they ensure the processor will be able to sell a certain percentage of its oil on a monthly basis. They also ensure the biodiesel producer its feedstock at market prices on a monthly basis. Biodiesel producers usually will be charged a slight premium for these types of contracts, but they consider it worthwhile to pay the premium because they do not have to worry about their feedstock supply.
Pricing Each Leg of the Soybean ComplexThere are three different legs to the soybean complex: soybeans that are bought by the plant and meal and oil sold by the plant. These three legs are closely related and determine the crush margin a processing facility can get. Prices for each of these legs are determined by supply and demand for each commodity and start with the soybean itself.
Soybeans are produced by growers who sell them to processing facilities that crush them into value-added products: soybean meal and soybean oil. Soybean prices are determined by supply
and demand. If supply exceeds demand, prices will drop. If demand exceeds supply, prices will rise. When soybean stocks are high, prices processors pay will be lower enabling the plant to buy more soybeans on the open market and produce more meal and oil for the open market. This can cause the price of each commodity to decline as supply exceeds demand.
When soybean demand exceeds supply, the price will rise and availability of soybeans for processors will decline. In this case, there will be fewer soybeans in the marketplace for processors to crush and thus less meal and oil for the open market. Meal and oil prices will rise due to scarcity of these products if demand remains constant.
The examples above are simplistic. Historically, the primary product for processors has been meal because crushing creates more meal and demand for meal in the U.S. has been greater than for oil. However, the new biodiesel industry and rising international demand for edible oil has changed this dynamic. In the current U.S. market, the supply of soybeans is short but processors are crushing more than ever. This is because of high prices for both meal and oil. Crushers are processing soybeans at record levels despite the high prices because meal and oil demand has increased to such high levels.
This is not a typical historical trend. Usually, if soybeans are priced high, it is due to a lack of availability, which is the case now. Crushers will buy fewer soybeans to protect their margins, thereby producing less meal and oil for the open market. However, due to the high prices of meal and oil, crushers feel confident buying and processing more soybeans. Current demand is great for each of their by-products resulting in processor margins remaining well above average.
Historically, processors have crushed for meal because it is a higher value-add product and generates demand from the growing livestock and poultry feeding and soy protein sectors. Recently, oil has provided a larger contribution to a processor’s margins because the biodiesel industry and international markets have boosted demand. Currently, oil’s contribution to the crush margin is around 45% compared to historical levels of about 35%.
The added contribution margin of oil to the processor means processors are beginning to crush more for oil than for meal. This means meal prices should be declining as more meal enters the market. This is not happening because of the international demand for meal and the shift of large sums of capital controlled by institutional investors from equity markets into the agricultural commodities markets. Both developments are keeping soybean meal prices high and soybean processor margins at record highs.
Institutional and index funds, by their charter, must be long, not short, in markets. As funds invest more dollars in commodities markets, this money is used to buy long contracts. This development supports higher prices. Soybean processor margins will remain high and plants will continue to operate at or near full capacity until international demand for meal and oil subsides and the institutional and index funds move their money
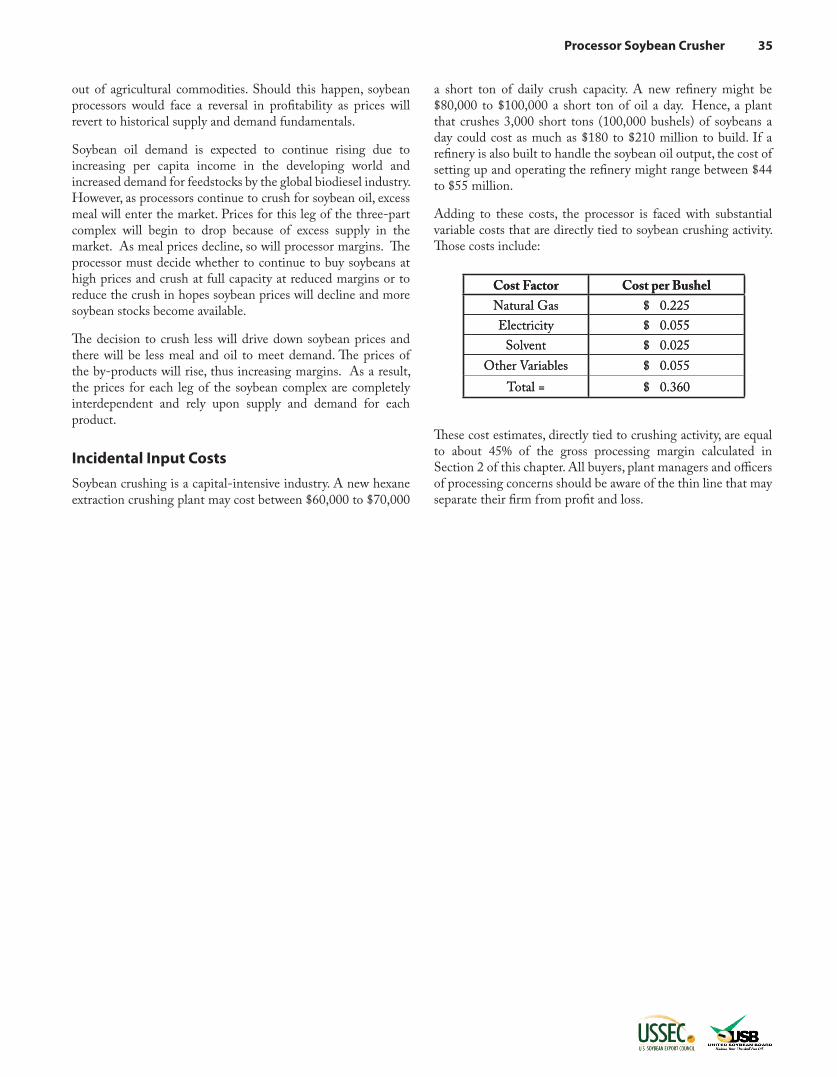
Processor Soybean Crusher �5
out of agricultural commodities. Should this happen, soybean processors would face a reversal in profitability as prices will revert to historical supply and demand fundamentals.
Soybean oil demand is expected to continue rising due to increasing per capita income in the developing world and increased demand for feedstocks by the global biodiesel industry. However, as processors continue to crush for soybean oil, excess meal will enter the market. Prices for this leg of the three-part complex will begin to drop because of excess supply in the market. As meal prices decline, so will processor margins. The processor must decide whether to continue to buy soybeans at high prices and crush at full capacity at reduced margins or to reduce the crush in hopes soybean prices will decline and more soybean stocks become available.
The decision to crush less will drive down soybean prices and there will be less meal and oil to meet demand. The prices of the by-products will rise, thus increasing margins. As a result, the prices for each leg of the soybean complex are completely interdependent and rely upon supply and demand for each product.
Incidental Input CostsSoybean crushing is a capital-intensive industry. A new hexane extraction crushing plant may cost between $60,000 to $70,000
a short ton of daily crush capacity. A new refinery might be $80,000 to $100,000 a short ton of oil a day. Hence, a plant that crushes 3,000 short tons (100,000 bushels) of soybeans a day could cost as much as $180 to $210 million to build. If a refinery is also built to handle the soybean oil output, the cost of setting up and operating the refinery might range between $44 to $55 million.
Adding to these costs, the processor is faced with substantial variable costs that are directly tied to soybean crushing activity. Those costs include:
These cost estimates, directly tied to crushing activity, are equal to about 45% of the gross processing margin calculated in Section 2 of this chapter. All buyers, plant managers and officers of processing concerns should be aware of the thin line that may separate their firm from profit and loss.
Cost Factor Cost per BushelNatural Gas $ 0.225Electricity $ 0.055
Solvent $ 0.025Other Variables $ 0.055
Total = $ 0.360
Cost Factor Cost per BushelNatural Gas $ 0.225Electricity $ 0.055
Solvent $ 0.025Other Variables $ 0.055
Total = $ 0.360
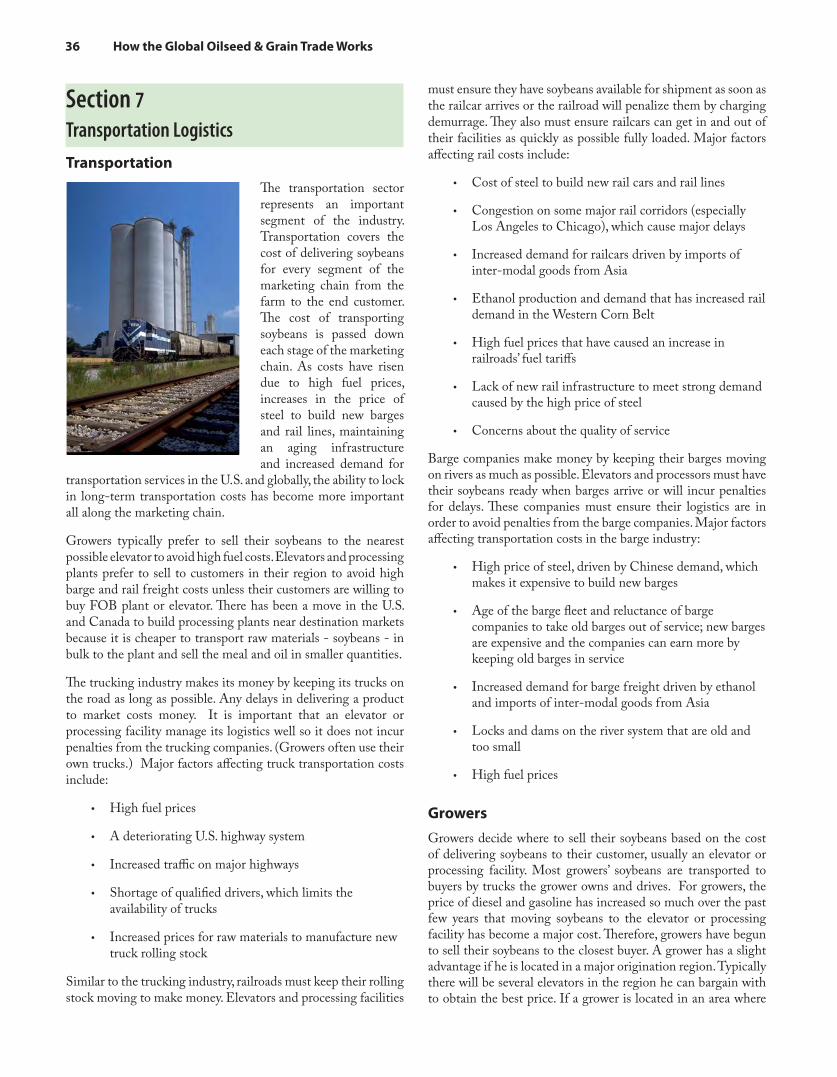
�6 How the Global Oilseed & Grain Trade Works
Section 7 Transportation LogisticsTransportation
The transportation sector represents an important segment of the industry. Transportation covers the cost of delivering soybeans for every segment of the marketing chain from the farm to the end customer. The cost of transporting soybeans is passed down each stage of the marketing chain. As costs have risen due to high fuel prices, increases in the price of steel to build new barges and rail lines, maintaining an aging infrastructure and increased demand for
transportation services in the U.S. and globally, the ability to lock in long-term transportation costs has become more important all along the marketing chain.
Growers typically prefer to sell their soybeans to the nearest possible elevator to avoid high fuel costs. Elevators and processing plants prefer to sell to customers in their region to avoid high barge and rail freight costs unless their customers are willing to buy FOB plant or elevator. There has been a move in the U.S. and Canada to build processing plants near destination markets because it is cheaper to transport raw materials - soybeans - in bulk to the plant and sell the meal and oil in smaller quantities.
The trucking industry makes its money by keeping its trucks on the road as long as possible. Any delays in delivering a product to market costs money. It is important that an elevator or processing facility manage its logistics well so it does not incur penalties from the trucking companies. (Growers often use their own trucks.) Major factors affecting truck transportation costs include:
High fuel prices
A deteriorating U.S. highway system
Increased traffic on major highways
Shortage of qualified drivers, which limits the availability of trucks
Increased prices for raw materials to manufacture new truck rolling stock
Similar to the trucking industry, railroads must keep their rolling stock moving to make money. Elevators and processing facilities
•
•
•
•
•
must ensure they have soybeans available for shipment as soon as the railcar arrives or the railroad will penalize them by charging demurrage. They also must ensure railcars can get in and out of their facilities as quickly as possible fully loaded. Major factors affecting rail costs include:
Cost of steel to build new rail cars and rail lines
Congestion on some major rail corridors (especially Los Angeles to Chicago), which cause major delays
Increased demand for railcars driven by imports of inter-modal goods from Asia
Ethanol production and demand that has increased rail demand in the Western Corn Belt
High fuel prices that have caused an increase in railroads’ fuel tariffs
Lack of new rail infrastructure to meet strong demand caused by the high price of steel
Concerns about the quality of service
Barge companies make money by keeping their barges moving on rivers as much as possible. Elevators and processors must have their soybeans ready when barges arrive or will incur penalties for delays. These companies must ensure their logistics are in order to avoid penalties from the barge companies. Major factors affecting transportation costs in the barge industry:
High price of steel, driven by Chinese demand, which makes it expensive to build new barges
Age of the barge fleet and reluctance of barge companies to take old barges out of service; new barges are expensive and the companies can earn more by keeping old barges in service
Increased demand for barge freight driven by ethanol and imports of inter-modal goods from Asia
Locks and dams on the river system that are old and too small
High fuel prices
GrowersGrowers decide where to sell their soybeans based on the cost of delivering soybeans to their customer, usually an elevator or processing facility. Most growers’ soybeans are transported to buyers by trucks the grower owns and drives. For growers, the price of diesel and gasoline has increased so much over the past few years that moving soybeans to the elevator or processing facility has become a major cost. Therefore, growers have begun to sell their soybeans to the closest buyer. A grower has a slight advantage if he is located in a major origination region. Typically there will be several elevators in the region he can bargain with to obtain the best price. If a grower is located in an area where
•
•
•
•
•
•
•
•
•
•
•
•
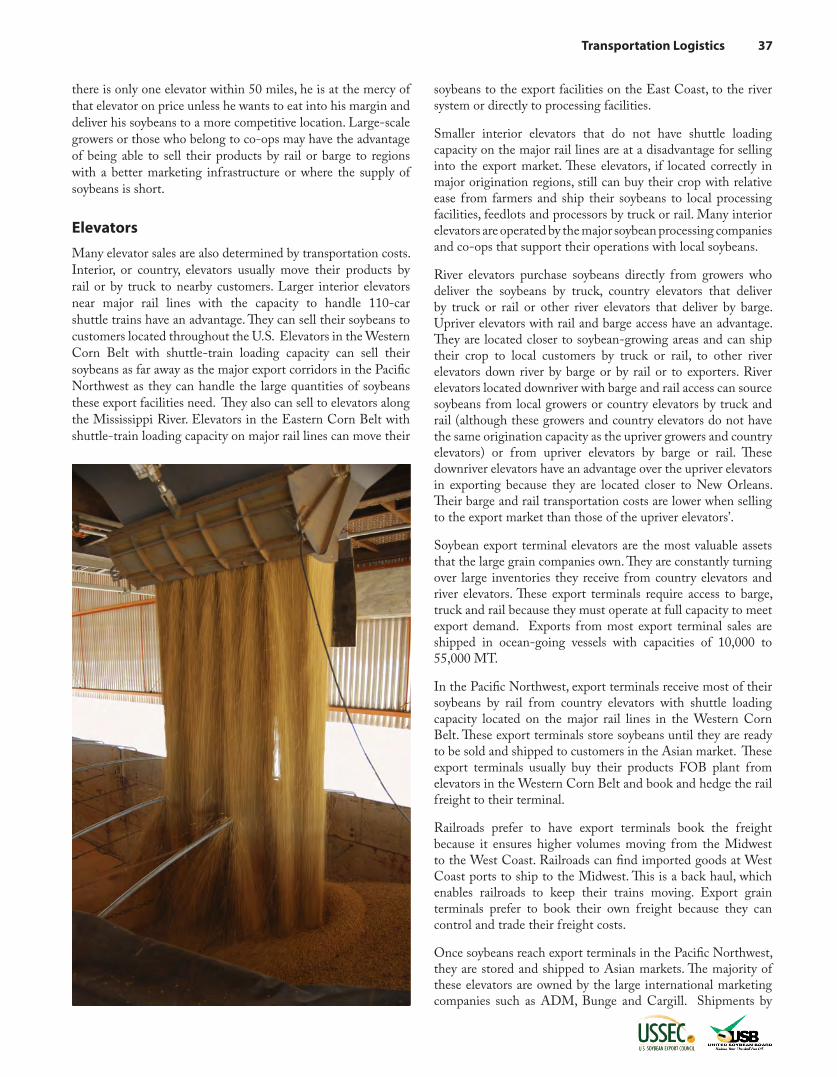
Transportation Logistics �7
there is only one elevator within 50 miles, he is at the mercy of that elevator on price unless he wants to eat into his margin and deliver his soybeans to a more competitive location. Large-scale growers or those who belong to co-ops may have the advantage of being able to sell their products by rail or barge to regions with a better marketing infrastructure or where the supply of soybeans is short.
ElevatorsMany elevator sales are also determined by transportation costs. Interior, or country, elevators usually move their products by rail or by truck to nearby customers. Larger interior elevators near major rail lines with the capacity to handle 110-car shuttle trains have an advantage. They can sell their soybeans to customers located throughout the U.S. Elevators in the Western Corn Belt with shuttle-train loading capacity can sell their soybeans as far away as the major export corridors in the Pacific Northwest as they can handle the large quantities of soybeans these export facilities need. They also can sell to elevators along the Mississippi River. Elevators in the Eastern Corn Belt with shuttle-train loading capacity on major rail lines can move their
soybeans to the export facilities on the East Coast, to the river system or directly to processing facilities.
Smaller interior elevators that do not have shuttle loading capacity on the major rail lines are at a disadvantage for selling into the export market. These elevators, if located correctly in major origination regions, still can buy their crop with relative ease from farmers and ship their soybeans to local processing facilities, feedlots and processors by truck or rail. Many interior elevators are operated by the major soybean processing companies and co-ops that support their operations with local soybeans.
River elevators purchase soybeans directly from growers who deliver the soybeans by truck, country elevators that deliver by truck or rail or other river elevators that deliver by barge. Upriver elevators with rail and barge access have an advantage. They are located closer to soybean-growing areas and can ship their crop to local customers by truck or rail, to other river elevators down river by barge or by rail or to exporters. River elevators located downriver with barge and rail access can source soybeans from local growers or country elevators by truck and rail (although these growers and country elevators do not have the same origination capacity as the upriver growers and country elevators) or from upriver elevators by barge or rail. These downriver elevators have an advantage over the upriver elevators in exporting because they are located closer to New Orleans. Their barge and rail transportation costs are lower when selling to the export market than those of the upriver elevators’.
Soybean export terminal elevators are the most valuable assets that the large grain companies own. They are constantly turning over large inventories they receive from country elevators and river elevators. These export terminals require access to barge, truck and rail because they must operate at full capacity to meet export demand. Exports from most export terminal sales are shipped in ocean-going vessels with capacities of 10,000 to 55,000 MT.
In the Pacific Northwest, export terminals receive most of their soybeans by rail from country elevators with shuttle loading capacity located on the major rail lines in the Western Corn Belt. These export terminals store soybeans until they are ready to be sold and shipped to customers in the Asian market. These export terminals usually buy their products FOB plant from elevators in the Western Corn Belt and book and hedge the rail freight to their terminal.
Railroads prefer to have export terminals book the freight because it ensures higher volumes moving from the Midwest to the West Coast. Railroads can find imported goods at West Coast ports to ship to the Midwest. This is a back haul, which enables railroads to keep their trains moving. Export grain terminals prefer to book their own freight because they can control and trade their freight costs.
Once soybeans reach export terminals in the Pacific Northwest, they are stored and shipped to Asian markets. The majority of these elevators are owned by the large international marketing companies such as ADM, Bunge and Cargill. Shipments by
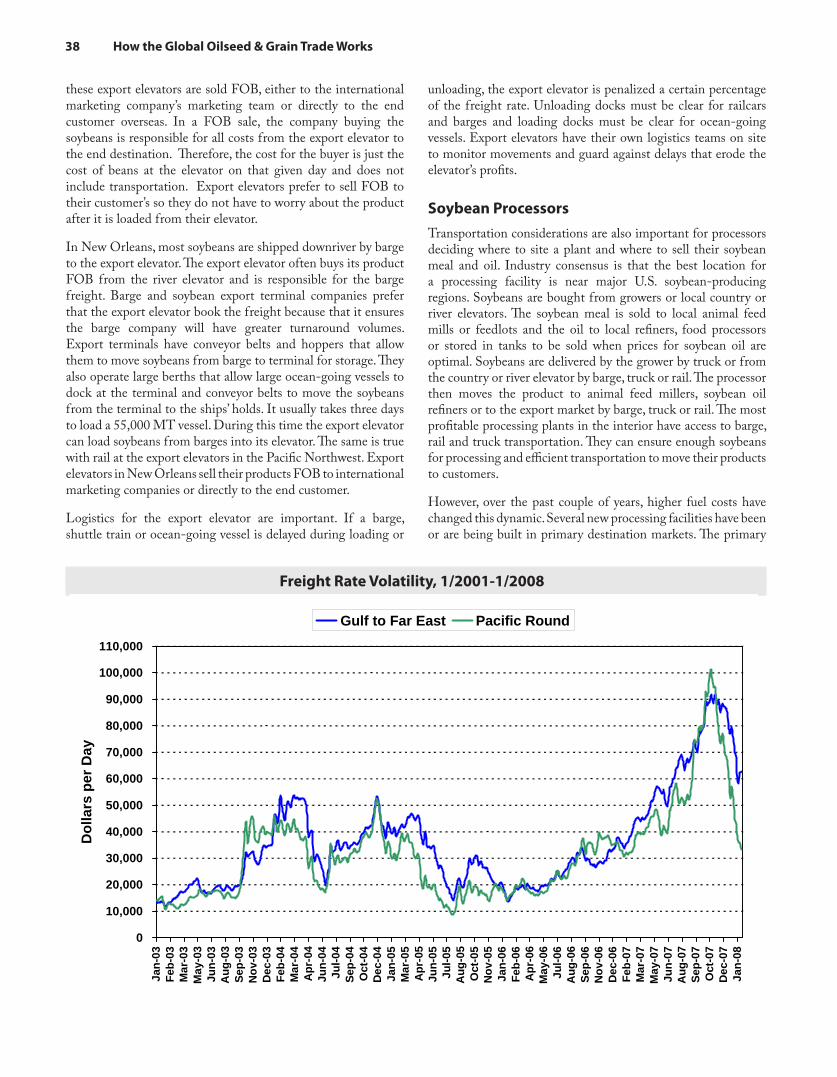
�8 How the Global Oilseed & Grain Trade Works
these export elevators are sold FOB, either to the international marketing company’s marketing team or directly to the end customer overseas. In a FOB sale, the company buying the soybeans is responsible for all costs from the export elevator to the end destination. Therefore, the cost for the buyer is just the cost of beans at the elevator on that given day and does not include transportation. Export elevators prefer to sell FOB to their customer’s so they do not have to worry about the product after it is loaded from their elevator.
In New Orleans, most soybeans are shipped downriver by barge to the export elevator. The export elevator often buys its product FOB from the river elevator and is responsible for the barge freight. Barge and soybean export terminal companies prefer that the export elevator book the freight because that it ensures the barge company will have greater turnaround volumes. Export terminals have conveyor belts and hoppers that allow them to move soybeans from barge to terminal for storage. They also operate large berths that allow large ocean-going vessels to dock at the terminal and conveyor belts to move the soybeans from the terminal to the ships’ holds. It usually takes three days to load a 55,000 MT vessel. During this time the export elevator can load soybeans from barges into its elevator. The same is true with rail at the export elevators in the Pacific Northwest. Export elevators in New Orleans sell their products FOB to international marketing companies or directly to the end customer.
Logistics for the export elevator are important. If a barge, shuttle train or ocean-going vessel is delayed during loading or
unloading, the export elevator is penalized a certain percentage of the freight rate. Unloading docks must be clear for railcars and barges and loading docks must be clear for ocean-going vessels. Export elevators have their own logistics teams on site to monitor movements and guard against delays that erode the elevator’s profits.
Soybean ProcessorsTransportation considerations are also important for processors deciding where to site a plant and where to sell their soybean meal and oil. Industry consensus is that the best location for a processing facility is near major U.S. soybean-producing regions. Soybeans are bought from growers or local country or river elevators. The soybean meal is sold to local animal feed mills or feedlots and the oil to local refiners, food processors or stored in tanks to be sold when prices for soybean oil are optimal. Soybeans are delivered by the grower by truck or from the country or river elevator by barge, truck or rail. The processor then moves the product to animal feed millers, soybean oil refiners or to the export market by barge, truck or rail. The most profitable processing plants in the interior have access to barge, rail and truck transportation. They can ensure enough soybeans for processing and efficient transportation to move their products to customers.
However, over the past couple of years, higher fuel costs have changed this dynamic. Several new processing facilities have been or are being built in primary destination markets. The primary
Freight Rate Volatility, 1/2001-1/2008
21
Key Panamax Time Charter Rates
0
10,000
20,000
30,000
40,000
50,000
60,000
70,000
80,000
90,000
100,000
110,000
Jan-
03Fe
b-03
Mar
-03
May
-03
Jun-
03A
ug-0
3Se
p-03
Nov
-03
Dec
-03
Feb-
04M
ar-0
4A
pr-0
4Ju
n-04
Jul-0
4Se
p-04
Oct
-04
Dec
-04
Jan-
05M
ar-0
5A
pr-0
5Ju
n-05
Jul-0
5A
ug-0
5O
ct-0
5N
ov-0
5Ja
n-06
Feb-
06A
pr-0
6M
ay-0
6Ju
l-06
Aug
-06
Sep-
06N
ov-0
6D
ec-0
6Fe
b-07
Mar
-07
May
-07
Jun-
07A
ug-0
7Se
p-07
Oct
-07
Dec
-07
Jan-
08
Dol
lars
per
Day
Gulf to Far East Pacific Round
0
10,000
20,000
30,000
40,000
50,000
60,000
70,000
80,000
90,000
100,000
110,000
Jan-
03Fe
b-03
Mar
-03
May
-03
Jun-
03A
ug-0
3Se
p-03
Nov
-03
Dec
-03
Feb-
04M
ar-0
4A
pr-0
4Ju
n-04
Jul-0
4Se
p-04
Oct
-04
Dec
-04
Jan-
05M
ar-0
5A
pr-0
5Ju
n-05
Jul-0
5A
ug-0
5O
ct-0
5N
ov-0
5Ja
n-06
Feb-
06A
pr-0
6M
ay-0
6Ju
l-06
Aug
-06
Sep-
06N
ov-0
6D
ec-0
6Fe
b-07
Mar
-07
May
-07
Jun-
07A
ug-0
7Se
p-07
Oct
-07
Dec
-07
Jan-
08
Dol
lars
per
Day
BPI Route 1A BPI Route 2A BPI Route 3A BPI RouteP4 BPI Tc Avg Panamax time charter rates are key variables used to calculate voyage rate or spot ocean freight rates on a $ per metric ton basis.
The spreads among the key four routes has varied significantly.
The two key U.S. time charter rates, route 2A (Gulf to Far East) and route 3A (Pacific Round) have displayed great variance that has impacted the landed price for soybeans originating from the Gulf and PNW.
Route 2A is also used for South American freight calculations.
As the average of all time charter rates increases, the competitive advantage of U.S. exports in “closer” markets also increases.
Note:BPI Route 1A is a Transatlantic route.BPI Route P4 is a Transpacific to Atlantic route.BPI TC is the average of all time charters.
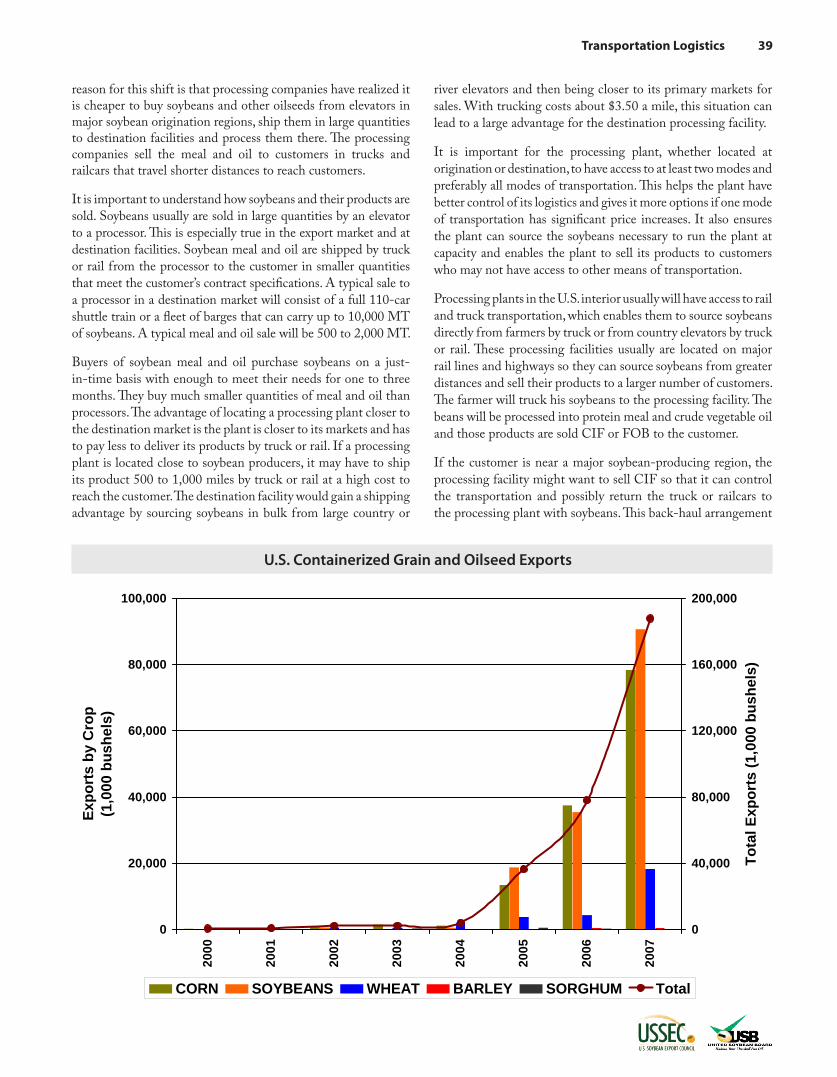
Transportation Logistics �9
reason for this shift is that processing companies have realized it is cheaper to buy soybeans and other oilseeds from elevators in major soybean origination regions, ship them in large quantities to destination facilities and process them there. The processing companies sell the meal and oil to customers in trucks and railcars that travel shorter distances to reach customers.
It is important to understand how soybeans and their products are sold. Soybeans usually are sold in large quantities by an elevator to a processor. This is especially true in the export market and at destination facilities. Soybean meal and oil are shipped by truck or rail from the processor to the customer in smaller quantities that meet the customer’s contract specifications. A typical sale to a processor in a destination market will consist of a full 110-car shuttle train or a fleet of barges that can carry up to 10,000 MT of soybeans. A typical meal and oil sale will be 500 to 2,000 MT.
Buyers of soybean meal and oil purchase soybeans on a just-in-time basis with enough to meet their needs for one to three months. They buy much smaller quantities of meal and oil than processors. The advantage of locating a processing plant closer to the destination market is the plant is closer to its markets and has to pay less to deliver its products by truck or rail. If a processing plant is located close to soybean producers, it may have to ship its product 500 to 1,000 miles by truck or rail at a high cost to reach the customer. The destination facility would gain a shipping advantage by sourcing soybeans in bulk from large country or
river elevators and then being closer to its primary markets for sales. With trucking costs about $3.50 a mile, this situation can lead to a large advantage for the destination processing facility.
It is important for the processing plant, whether located at origination or destination, to have access to at least two modes and preferably all modes of transportation. This helps the plant have better control of its logistics and gives it more options if one mode of transportation has significant price increases. It also ensures the plant can source the soybeans necessary to run the plant at capacity and enables the plant to sell its products to customers who may not have access to other means of transportation.
Processing plants in the U.S. interior usually will have access to rail and truck transportation, which enables them to source soybeans directly from farmers by truck or from country elevators by truck or rail. These processing facilities usually are located on major rail lines and highways so they can source soybeans from greater distances and sell their products to a larger number of customers. The farmer will truck his soybeans to the processing facility. The beans will be processed into protein meal and crude vegetable oil and those products are sold CIF or FOB to the customer.
If the customer is near a major soybean-producing region, the processing facility might want to sell CIF so that it can control the transportation and possibly return the truck or railcars to the processing plant with soybeans. This back-haul arrangement
31
Growth of Exports in Containerized Shipments
U.S. Containerized Grain and Oilseed Exports
0
20,000
40,000
60,000
80,000
100,000
2000
2001
2002
2003
2004
2005
2006
2007
Expo
rts
by C
rop
(1,0
00 b
ushe
ls)
0
40,000
80,000
120,000
160,000
200,000
Tota
l Exp
orts
(1,0
00 b
ushe
ls)
CORN SOYBEANS WHEAT BARLEY SORGHUM Total
Soybean exporters were early adopters of containerizedexport shipments and the trend is now spreading to other commodities while gaining in importance.
Source: Informa Economics
U.S. Containerized Grain and Oilseed Exports
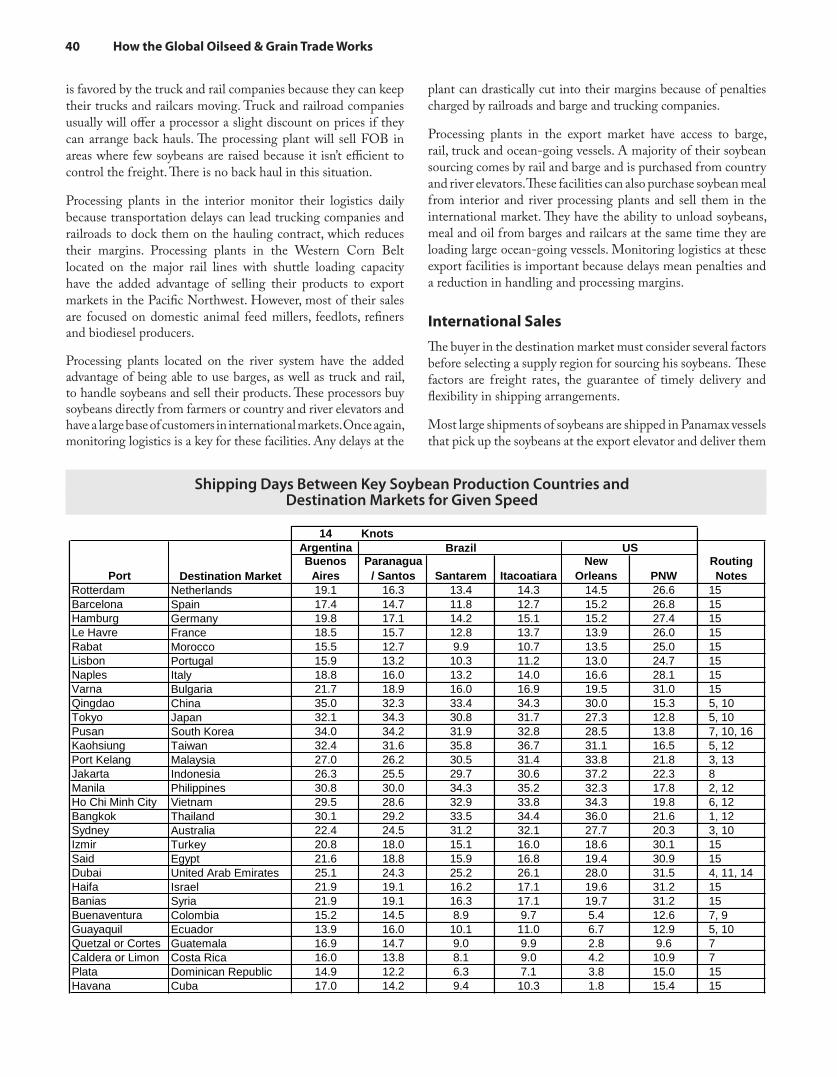
40 How the Global Oilseed & Grain Trade Works
is favored by the truck and rail companies because they can keep their trucks and railcars moving. Truck and railroad companies usually will offer a processor a slight discount on prices if they can arrange back hauls. The processing plant will sell FOB in areas where few soybeans are raised because it isn’t efficient to control the freight. There is no back haul in this situation.
Processing plants in the interior monitor their logistics daily because transportation delays can lead trucking companies and railroads to dock them on the hauling contract, which reduces their margins. Processing plants in the Western Corn Belt located on the major rail lines with shuttle loading capacity have the added advantage of selling their products to export markets in the Pacific Northwest. However, most of their sales are focused on domestic animal feed millers, feedlots, refiners and biodiesel producers.
Processing plants located on the river system have the added advantage of being able to use barges, as well as truck and rail, to handle soybeans and sell their products. These processors buy soybeans directly from farmers or country and river elevators and have a large base of customers in international markets. Once again, monitoring logistics is a key for these facilities. Any delays at the
plant can drastically cut into their margins because of penalties charged by railroads and barge and trucking companies.
Processing plants in the export market have access to barge, rail, truck and ocean-going vessels. A majority of their soybean sourcing comes by rail and barge and is purchased from country and river elevators. These facilities can also purchase soybean meal from interior and river processing plants and sell them in the international market. They have the ability to unload soybeans, meal and oil from barges and railcars at the same time they are loading large ocean-going vessels. Monitoring logistics at these export facilities is important because delays mean penalties and a reduction in handling and processing margins.
International SalesThe buyer in the destination market must consider several factors before selecting a supply region for sourcing his soybeans. These factors are freight rates, the guarantee of timely delivery and flexibility in shipping arrangements.
Most large shipments of soybeans are shipped in Panamax vessels that pick up the soybeans at the export elevator and deliver them
Shipping Days Between Key Soybean Production Countries and Destination Markets for Given Speed
27
Freight ConsiderationsShipping Days between Key Soybean Production Countries and Destination Markets for Given Speed
14 KnotsArgentina
PortBuenos
AiresParanagua
/ Santos Santarem ItacoatiaraNew
Orleans PNWRouting Notes
Rotterdam 19.1 16.3 13.4 14.3 14.5 26.6 15Barcelona 17.4 14.7 11.8 12.7 15.2 26.8 15Hamburg 19.8 17.1 14.2 15.1 15.2 27.4 15Le Havre 18.5 15.7 12.8 13.7 13.9 26.0 15Rabat 15.5 12.7 9.9 10.7 13.5 25.0 15Lisbon 15.9 13.2 10.3 11.2 13.0 24.7 15Naples 18.8 16.0 13.2 14.0 16.6 28.1 15Varna 21.7 18.9 16.0 16.9 19.5 31.0 15Qingdao 35.0 32.3 33.4 34.3 30.0 15.3 5, 10Tokyo 32.1 34.3 30.8 31.7 27.3 12.8 5, 10Pusan 34.0 34.2 31.9 32.8 28.5 13.8 7, 10, 16Kaohsiung 32.4 31.6 35.8 36.7 31.1 16.5 5, 12Port Kelang 27.0 26.2 30.5 31.4 33.8 21.8 3, 13Jakarta 26.3 25.5 29.7 30.6 37.2 22.3 8Manila 30.8 30.0 34.3 35.2 32.3 17.8 2, 12Ho Chi Minh City 29.5 28.6 32.9 33.8 34.3 19.8 6, 12Bangkok 30.1 29.2 33.5 34.4 36.0 21.6 1, 12Sydney 22.4 24.5 31.2 32.1 27.7 20.3 3, 10Izmir 20.8 18.0 15.1 16.0 18.6 30.1 15Said 21.6 18.8 15.9 16.8 19.4 30.9 15Dubai 25.1 24.3 25.2 26.1 28.0 31.5 4, 11, 14Haifa 21.9 19.1 16.2 17.1 19.6 31.2 15Banias 21.9 19.1 16.3 17.1 19.7 31.2 15Buenaventura 15.2 14.5 8.9 9.7 5.4 12.6 7, 9Guayaquil 13.9 16.0 10.1 11.0 6.7 12.9 5, 10Quetzal or Cortes 16.9 14.7 9.0 9.9 2.8 9.6 7Caldera or Limon 16.0 13.8 8.1 9.0 4.2 10.9 7Plata 14.9 12.2 6.3 7.1 3.8 15.0 15Havana 17.0 14.2 9.4 10.3 1.8 15.4 15
Routing Notes123456789
10111213141516
Costa RicaDominican RepublicCuba
SyriaColombiaEcuadorGuatemala
TurkeyEgyptUnited Arab EmiratesIsrael
PhilippinesVietnamThailandAustralia
South KoreaTaiwanMalaysiaIndonesia
ItalyBulgariaChinaJapan
GermanyFranceMoroccoPortugal
Destination MarketNetherlandsSpain
New Orleans through Suez CanalPNW through Malacca StraitPNW through Panama CanalSantos around Cape Good Hope through Malacca Strait
New Orleans and Brazil through Panama CanalNew Orleans and Santarem through Panama CanalNew Orleans and Santarem through Suez CanalNew Orleans through Panama Canal
Argentina and Santos around Cape Horn through Magellan StraitArgentina around Cape Good Hope through Malacca StraitsArgentina around Cape Horn through Magellan StraitArgentina, Brazil and New Orleans around Cape Good Hope
Argentina and Brazil around Cape Good Hope through Malacca StraitsArgentina and Brazil around Cape Good Hope through Sunda StraitArgentina and Brazil around Cape Horn through Magellan StraitArgentina and Santos around Cape Good Hope
Brazil US With accesses to both the Atlantic and Pacific oceans, the U.S. has a transportation advantage over Argentina and Brazil. Lower ocean freight costs, however, are not always sufficient to offset the lower costs of South American products.
Generally, lower freight costs greatly favor U.S. shipments over Argentine and Brazilian ones in Central America (e.g., Colombia) or the Caribbean (e.g., Dominican Republic). From the PNW, U.S. exports are also at an advantage to access the Eastern Asian markets.
To access Europe (from New Orleans) and Southeast Asia (from the PNW), freight cost is not a major factor of competitiveness as the shipping distances from South America and the U.S. narrows.
Transportation Logistics 41
to the port of destination. Panamax time charter rates are key variables used to calculate ocean freight rates on a per-ton basis. The two key U.S time charter rates, route 2A (Gulf of Mexico to Far East) and route 3A (Pacific Round), have displayed great volatility that has affected the destination price for soybeans sourced from the Gulf and Pacific Northwest. Route 2A is also used for South American freight calculations to the Far East. As the average of all time charter rates increases, the competitive advantage of U.S. soybean exports in closer markets increases.
Today, U.S exporters have a freight advantage in shipments to the Caribbean, Central America and East Asia over Argentina and Brazil because they are closer to these markets and have direct access to the Pacific Ocean. Lower freight rates ensure that U.S. shipments to these markets are more competitive and help to reduce the substantial production cost advantage of South American exporters. In Europe, Southeast Asia, the Middle East and North Africa, the U.S. has no transportation advantage over South American exporters. These markets tend to buy South American soybeans and products because U.S. exporters with higher production costs cannot compete with their South American counterparts.
The guarantee of timely delivery is another important factor in an international buyer’s decision of where to source soybeans
and soy products. Major soybean export ports in the U.S. are less congested than those in South America, which provides an advantage for U.S. exporters. Since many international buyers purchase soybeans and soy products on a just-in-time basis, delays at the origin port could lead to significant losses for the end buyer. Many international buyers prefer to source their products from less congested ports and therefore have minimal risk for delays.
A new phenomenon is occurring in U.S. soybean transportation. Increased U.S. demand for Asian products has led to a rise in container shipments to U.S. ports. These ships need to return to Asia so more goods can be loaded for export from Asia to the U.S. U.S. soybean exporters understand this demand for containers in Asia can lead to excellent opportunities for shipping soybeans in the container ships back to Asia in a back-haul arrangement. In 2007, 9% of U.S. soybean exports were handled by container vessels because Asian companies did not want to return empty containers. This allows for more flexibility in U.S. shipments of soybeans than South America has. U.S. exporters also have a flexibility advantage because they can ship more combo vessels (soybeans, corn, soybean meal and wheat in four different holds) than their South American counterparts. The U.S. can source more of these products than their competitors.
42 How the Global Oilseed & Grain Trade Works
Section 8 Risk Management ToolsRisk and MarketsParticipants in the agricultural value chain are subject to many risks that threaten financial well-being and survivability. Price variability introduces risk to growers, food companies, exporters and consumers. It is the inescapable result of economic activity and time. “If there were no tomorrow there would be no risk. Time transforms risk, and the nature of risk is shaped by the time horizon: the future is the playing field.” (Against The Gods, Peter L. Bernstein)
Man has faced and addressed personal physical risks since the time he first walked on earth – risks from weather, natural disasters, disease, conflict and predators. Man’s evolution into a social being introduced a new form of peril related to his emerging experience with commerce and the exchange of goods. This is a risk for which nature left humans unprepared: economic risk.
Early purveyors, peddlers and traders of goods encountered these new forms of hazard, including spoilage and loss of product condition, destruction or theft, disappearance or insolvency of a trading partner and disagreements regarding a good’s value. Solutions to these problems were scarce, requiring new systems and strategies for lessening these risks, mostly through trial and error and, in some cases, ingenuity.
Brief History of Agricultural Futures and OptionsAs trade developed in early society there were verbal accords, and later written covenants (agreements made between buyers and sellers for delivery of goods or services), which aided in the development and evolution of commerce. These early commercial contracts helped formalize the relationship and legal standing of buyers and sellers by establishing transaction prices, calling for delivery to be made in a prescribed manner and agreed-upon time period, with delivery made to a specific location. For a long time the only commercial delivery of transacted goods was to one location, and in only one time frame. Payments were by barter, an exchange for goods of apparently equal value.
There is significant historical evidence that forms of forward contracts were developed by early agrarian societies as a means of selling with a promise for future delivery of farm products to consumers, established markets and marketers. Forward contracts have proved to be useful time-tested tools for transactions. Sometimes they prove to be inflexible and onerous for buyers and sellers when market conditions and circumstances change. However, development of early contracts provided the effective framework for the robust modern tools available to risk managers today.
Urban societies saw the development of the central marketplace and benefitted from the positive social and financial interaction
it promoted. The market was a direct by-product of the repetitive transactions of comparable goods. This new institution was an efficient solution for finding a mutually convenient location to transact the buying, selling and barter exchange of animals, food and produce, furs, land, wool, cotton, spices and most anything of value. Conceptually, these early markets were not much different from modern commodity and financial markets.
Ancient Greeks may have engaged in a rudimentary form of forward trading, but a true futures-type trading concept was first seen at the Dojima Rice Exchange in Osaka, Japan, in the early 1700s. In the U.S., futures-type trading in grains began in the centers of transportation: New York City with its access to other East coast cities, the Hudson River and overseas markets, and Buffalo, the western terminus of the New York canal systems. However, these early experiments were never formalized and did not survive. The modern futures market, with its unique brand of standard forward agreement, was founded in Chicago – close to the vast farmlands of the Midwest, the hub of Great Lakes shipping and the new national railway network.
Until establishment of the Chicago Board of Trade, forward contracts had been anything but standard. Often these forward contracts were not honored by the buyer or the seller between the time the agreement was initialed and the time of delivery. Contract defaults were customary on forward contracts established between farmers, middlemen and shippers, especially if the price of the agricultural good either rose or fell significantly from the time the contract was written.
By the middle of the 19th century, the volume of agricultural goods produced in the Midwestern U.S. was expanding. The region quickly became known as the breadbasket of the world. However, huge inefficiencies in the region’s marketing and logistical systems plagued this market, taking a substantial toll on its true potential. Buyers could not find sellers, and sellers could not find buyers. The marketing, storage and shipping of the region’s bountiful crops were inefficient and disorganized. Harvested crops that were unshipped often sat rotting.
In 1848 a group of businessmen formed an organization to promote “to-arrive” trading of timothy seed, flour and hay in Chicago. A to-arrive transaction is a contractual agreement for the future delivery of a commodity meeting specific quality standards on or before a specified date. Two years later the group offered the centralization and standardization of a new, abbreviated system of negotiating forward contracts for the purchasing and selling of grain – the first fully functioning futures contract. Point of delivery, size of shipment, time of delivery and delivery grade were all established. Only price was left for the parties to negotiate. The streamlined buying and selling process led to increased trading activity, effectively providing new market liquidity and reduced transaction risk. Trading of these contracts could only be achieved at the exchange, and trading was restricted to established times, agreed upon by the members. All transactions had to be conducted through open outcry auctions and the exchange shared pricing activity with the industry and the public. This led to a system of broad-based price discovery for market participants and observers around the world.
Risk Management Tools 4�
The new exchange established itself as a clearinghouse for all member trades, reducing the risk of default by matching all exchange traded purchases with sales, effectively netting positions at the end of each day. This new way of doing business in Chicago and these new contracts became the templates for the development of all futures contracts, from soybeans to orange juice to 30-year bonds to carbon-emissions.
The futures clearinghouse was devised to provide all trade processing services to the exchange, as well as guarantee the trades of all members would be honored. It performs this service by effectively becoming a counterpart to every trade made at the exchange. The clearinghouse’s function is distinctly different from that of the exchange and its members. It takes no market positions but places itself squarely between the different parties to each transaction executed at the exchange. This creates efficiency. When member broker A sells 50 contracts of soybean oil to member B, it will not be necessary for the two parties to agree on the details of unwinding the trade at a later date. Each member can buy the original trade back from, or sell to, any other member, effectively offsetting or liquidating their original transaction at the prevailing market price at any given time before the contract expires.
The universe of futures trading changed forever and began to expand in 1971, at the same time as the Bretton Woods Agreement of 1944, which had established a system of semi-fixed currency exchange valuations for member countries and made the dollar convertible to gold, collapsed. With the end of fixed exchange rates and dollar-gold convertibility, the first financial futures - currency futures - were introduced by the Chicago Mercantile Exchange’s International Monetary Market. The new instruments offered a new tool to international companies, multinational banks and traders for mitigating the emerging risk of fluctuation currencies. Precious metals trading also began during this period, since the value of gold was no longer tied to the dollar.
The development of the currency futures opened the door for a widening array of futures contracts on financial instruments, including interest rates in 1976 and stock indexes in 1982. These were followed by contracts on energy markets, commodity indexes and, most recently, greenhouse-gas emissions. The introduction of electronic trading platforms in the last 15 years has generally increased market efficiency and capacity. Many futures trading pits of the past have been entirely replaced by the new format, and many others share a side-by-side relationship with trading floors.
Brief Description of Each Financial Instrument
Futures
The exact origin of futures trading is unclear, but they are generally defined as transferable fungible contracts that are exchange-traded and closely regulated by both the Commodity Futures Trading Commission and monitored by the host exchanges. By original definition, futures contracts require the delivery of an underlying physical commodity or financial asset at a specified
■
price, on a specified future date. Depending on the contract specifications, delivery may be required in the form of the physical or financial asset being traded, or as cash. Futures were initially developed to provide standardization and contractual integrity to forward trading in storable commodities. The development of new futures contracts in the last 35 years have moved beyond the previous commodity and storability requirements as currencies, interest rates, indexes, single stock futures and a host of other applicable products have come to market.
A number of important features are typically standardized in the development of an exchange traded futures contract. Those defined elements include:
Size, amount or quantity of the traded item or commodity
Trading months for delivery of the item
Delivery terms
Trading hours
Product specifications – quality requirements for delivery
Price specifications, i.e., U.S. dollars a bushel
Minimum price fluctuation and maximum daily price limits
Buying and selling regulated futures contracts is exclusively conducted by members of the exchange during the hours specified by the exchange and at a specific location. Non-member traders must establish an account with a member firm of the exchange and have that firm execute all trades for the account. Trading positions may be established through an initiating buy or sell order, by the exercise of an options contract or through a versus-cash or exchange-for-physicals transaction. The latter is a privately negotiated pricing mechanism used by cash traders for valuing a commodity they wish to exchange.
Ownership of a futures contract is equal to ownership of the underlying asset. Futures convey the obligation to either take delivery of that asset as an owner or make delivery as a seller. The risk to the seller of futures is unlimited, as no theoretical limit exists for the cost of an asset in short supply. Buyers, or traders with long positions, are subject to the risk of an asset that declines in value, but buyers enjoy the flip side of the seller’s dilemma, unlimited profit potential.
Although futures positions confer asset ownership, the contract itself has a finite lifespan. Before a contract expires, the owner has the right to liquidate the futures position or hold the position open, demanding actual delivery of the physical or financial asset. In fact, a miniscule number of transacted futures contracts participate in the delivery process. Nearly all futures positions are offset with equal and opposite transactions by traders. Hedge trades may be temporary placeholders until the underlying asset is bought or sold in the cash market. Speculative positions
•
•
•
•
•
•
•
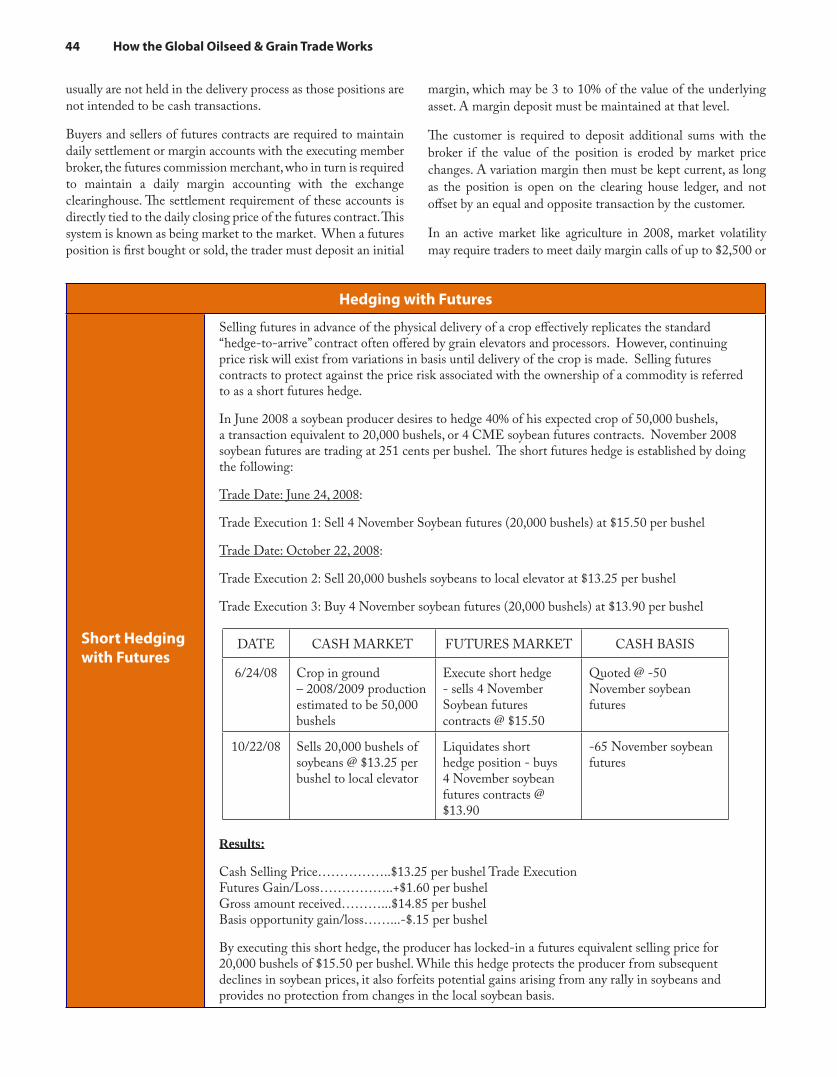
44 How the Global Oilseed & Grain Trade Works
usually are not held in the delivery process as those positions are not intended to be cash transactions.
Buyers and sellers of futures contracts are required to maintain daily settlement or margin accounts with the executing member broker, the futures commission merchant, who in turn is required to maintain a daily margin accounting with the exchange clearinghouse. The settlement requirement of these accounts is directly tied to the daily closing price of the futures contract. This system is known as being market to the market. When a futures position is first bought or sold, the trader must deposit an initial
margin, which may be 3 to 10% of the value of the underlying asset. A margin deposit must be maintained at that level.
The customer is required to deposit additional sums with the broker if the value of the position is eroded by market price changes. A variation margin then must be kept current, as long as the position is open on the clearing house ledger, and not offset by an equal and opposite transaction by the customer.
In an active market like agriculture in 2008, market volatility may require traders to meet daily margin calls of up to $2,500 or
Hedging with Futures
Short Hedging with Futures
Selling futures in advance of the physical delivery of a crop effectively replicates the standard “hedge-to-arrive” contract often offered by grain elevators and processors. However, continuing price risk will exist from variations in basis until delivery of the crop is made. Selling futures contracts to protect against the price risk associated with the ownership of a commodity is referred to as a short futures hedge.
In June 2008 a soybean producer desires to hedge 40% of his expected crop of 50,000 bushels, a transaction equivalent to 20,000 bushels, or 4 CME soybean futures contracts. November 2008 soybean futures are trading at 251 cents per bushel. The short futures hedge is established by doing the following:
Trade Date: June 24, 2008:
Trade Execution 1: Sell 4 November Soybean futures (20,000 bushels) at $15.50 per bushel
Trade Date: October 22, 2008:
Trade Execution 2: Sell 20,000 bushels soybeans to local elevator at $13.25 per bushel
Trade Execution 3: Buy 4 November soybean futures (20,000 bushels) at $13.90 per bushel
Results:
Cash Selling Price……………..$13.25 per bushel Trade Execution Futures Gain/Loss……………..+$1.60 per bushel Gross amount received………...$14.85 per bushel Basis opportunity gain/loss……...-$.15 per bushel
By executing this short hedge, the producer has locked-in a futures equivalent selling price for 20,000 bushels of $15.50 per bushel. While this hedge protects the producer from subsequent declines in soybean prices, it also forfeits potential gains arising from any rally in soybeans and provides no protection from changes in the local soybean basis.
DATE CASH MARKET FUTURES MARKET CASH BASIS
6/24/08 Crop in ground – 2008/2009 production estimated to be 50,000 bushels
Execute short hedge - sells 4 November Soybean futures contracts @ $15.50
Quoted @ -50 November soybean futures
10/22/08 Sells 20,000 bushels of soybeans @ $13.25 per bushel to local elevator
Liquidates short hedge position - buys 4 November soybean futures contracts @ $13.90
-65 November soybean futures
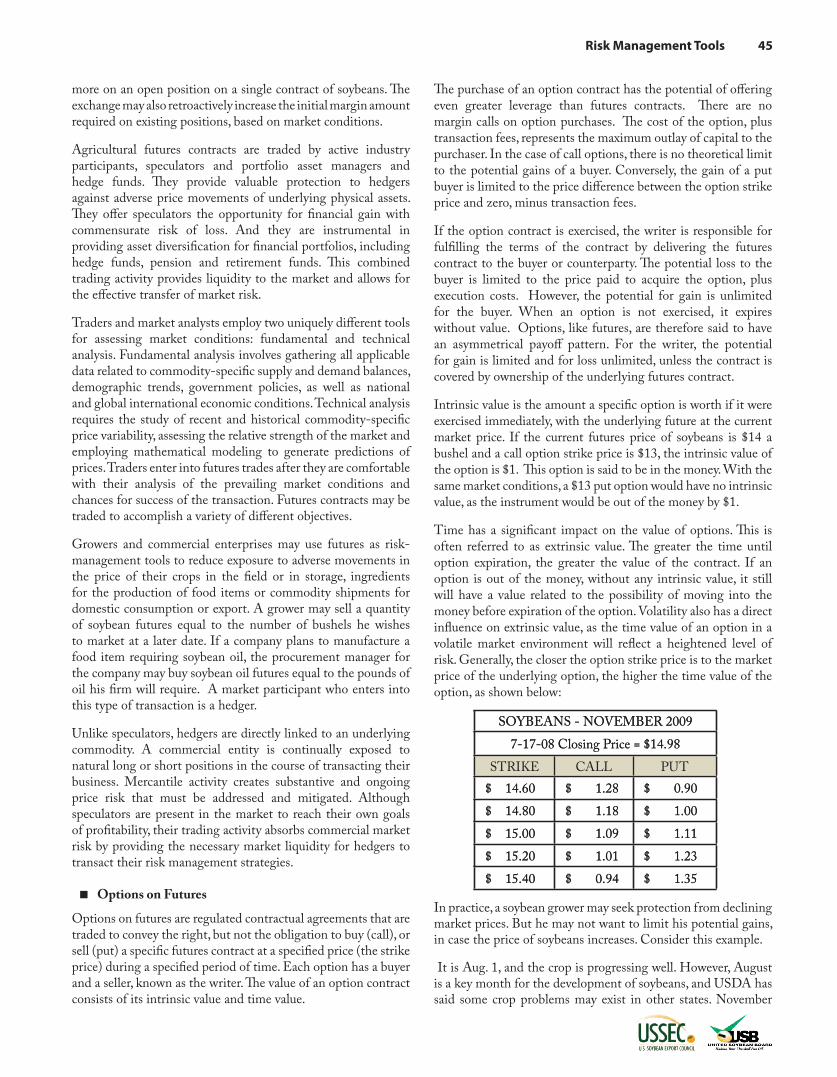
Risk Management Tools 45
more on an open position on a single contract of soybeans. The exchange may also retroactively increase the initial margin amount required on existing positions, based on market conditions.
Agricultural futures contracts are traded by active industry participants, speculators and portfolio asset managers and hedge funds. They provide valuable protection to hedgers against adverse price movements of underlying physical assets. They offer speculators the opportunity for financial gain with commensurate risk of loss. And they are instrumental in providing asset diversification for financial portfolios, including hedge funds, pension and retirement funds. This combined trading activity provides liquidity to the market and allows for the effective transfer of market risk.
Traders and market analysts employ two uniquely different tools for assessing market conditions: fundamental and technical analysis. Fundamental analysis involves gathering all applicable data related to commodity-specific supply and demand balances, demographic trends, government policies, as well as national and global international economic conditions. Technical analysis requires the study of recent and historical commodity-specific price variability, assessing the relative strength of the market and employing mathematical modeling to generate predictions of prices. Traders enter into futures trades after they are comfortable with their analysis of the prevailing market conditions and chances for success of the transaction. Futures contracts may be traded to accomplish a variety of different objectives.
Growers and commercial enterprises may use futures as risk-management tools to reduce exposure to adverse movements in the price of their crops in the field or in storage, ingredients for the production of food items or commodity shipments for domestic consumption or export. A grower may sell a quantity of soybean futures equal to the number of bushels he wishes to market at a later date. If a company plans to manufacture a food item requiring soybean oil, the procurement manager for the company may buy soybean oil futures equal to the pounds of oil his firm will require. A market participant who enters into this type of transaction is a hedger.
Unlike speculators, hedgers are directly linked to an underlying commodity. A commercial entity is continually exposed to natural long or short positions in the course of transacting their business. Mercantile activity creates substantive and ongoing price risk that must be addressed and mitigated. Although speculators are present in the market to reach their own goals of profitability, their trading activity absorbs commercial market risk by providing the necessary market liquidity for hedgers to transact their risk management strategies.
Options on Futures
Options on futures are regulated contractual agreements that are traded to convey the right, but not the obligation to buy (call), or sell (put) a specific futures contract at a specified price (the strike price) during a specified period of time. Each option has a buyer and a seller, known as the writer. The value of an option contract consists of its intrinsic value and time value.
■
The purchase of an option contract has the potential of offering even greater leverage than futures contracts. There are no margin calls on option purchases. The cost of the option, plus transaction fees, represents the maximum outlay of capital to the purchaser. In the case of call options, there is no theoretical limit to the potential gains of a buyer. Conversely, the gain of a put buyer is limited to the price difference between the option strike price and zero, minus transaction fees.
If the option contract is exercised, the writer is responsible for fulfilling the terms of the contract by delivering the futures contract to the buyer or counterparty. The potential loss to the buyer is limited to the price paid to acquire the option, plus execution costs. However, the potential for gain is unlimited for the buyer. When an option is not exercised, it expires without value. Options, like futures, are therefore said to have an asymmetrical payoff pattern. For the writer, the potential for gain is limited and for loss unlimited, unless the contract is covered by ownership of the underlying futures contract.
Intrinsic value is the amount a specific option is worth if it were exercised immediately, with the underlying future at the current market price. If the current futures price of soybeans is $14 a bushel and a call option strike price is $13, the intrinsic value of the option is $1. This option is said to be in the money. With the same market conditions, a $13 put option would have no intrinsic value, as the instrument would be out of the money by $1.
Time has a significant impact on the value of options. This is often referred to as extrinsic value. The greater the time until option expiration, the greater the value of the contract. If an option is out of the money, without any intrinsic value, it still will have a value related to the possibility of moving into the money before expiration of the option. Volatility also has a direct influence on extrinsic value, as the time value of an option in a volatile market environment will reflect a heightened level of risk. Generally, the closer the option strike price is to the market price of the underlying option, the higher the time value of the option, as shown below:
In practice, a soybean grower may seek protection from declining market prices. But he may not want to limit his potential gains, in case the price of soybeans increases. Consider this example.
It is Aug. 1, and the crop is progressing well. However, August is a key month for the development of soybeans, and USDA has said some crop problems may exist in other states. November
SOYBEANS - NOVEMBER 20097-17-08 Closing Price = $14.98
STRIKE CALL PUT $ 14.60 $ 1.28 $ 0.90 $ 14.80 $ 1.18 $ 1.00 $ 15.00 $ 1.09 $ 1.11 $ 15.20 $ 1.01 $ 1.23 $ 15.40 $ 0.94 $ 1.35
SOYBEANS - NOVEMBER 20097-17-08 Closing Price = $14.98
STRIKE CALL PUT $ 14.60 $ 1.28 $ 0.90 $ 14.80 $ 1.18 $ 1.00 $ 15.00 $ 1.09 $ 1.11 $ 15.20 $ 1.01 $ 1.23 $ 15.40 $ 0.94 $ 1.35
46 How the Global Oilseed & Grain Trade Works
soybean futures are trading at $13.25 a bushel. If conditions do not improve in other key producing states, the grower believes November soybean futures prices could reach $15 or more. He could sell a portion of his crop now - say 5,000 bushels - based on the November futures price of $13.25. Or he could initiate a minimum-price selling strategy by buying one Chicago Board of Trade put (5,000 bushels) on the November futures contract. If he sells the crop he will never get a price better than $13.25 on those 5,000 bushels. If he buys a $12 November put, priced at 40 cents a bushel, he will receive no less than $11.60 ($12 strike price, minus the 40 cents cost for the put purchase, exclusive of transaction fees) for this sale. If the market does rally to $15, he is free to sell his crop at the higher price, minus his sunk cost of 40 cents a bushel for the put purchase.
There are many options strategies to every market assessment - bullish, bearish or undecided - and each market condition - rising, falling and uncertain volatility. Many of these trades may combine the use of calls and puts into a single strategy or use multiple option contracts of differing strike prices of the same underlying futures contract or options of different underlying contracts or a combination of futures and options. Like futures, options are complex and dynamic financial instruments. Their risks and complexities should be understood and respected before being used in trading or hedging applications.
Commodity Swaps
A swap transaction is a non-regulated exchange of cash flows, one being fixed and one floating. It is dependent upon the price of an underlying, or associated, commodity. In most cases only the payments are exchanged, not the principal. Swaps are privately negotiated, individual transactions and offer market participants an over-the-counter alternative to the futures and options markets. They are flexible instruments, allowing firms to duplicate their cash market needs and transfer the risk to another party. But they are also illiquid and potentially non-transferrable.
The consumer of a commodity may wish to secure a maximum price and agree to pay a fee to a financial institution for this version of fixed price insurance. When the price of the swapped commodity rises above the previous price, the financial institution will provide a cash flow or payment to the consumer to offset the incremental market price increase.
Conversely, a producer may wish to fix his income by setting a floor on the price he receives for his product. He would agree to pay the market price to a financial institution. In return, he would receive variable payments based on the actual selling price of the commodity. Firms may seek the protection secured by this type of agreement when dealing in commodities that are either low volume and illiquid or when the target asset is not traded on regulated futures exchanges.
Spreads / Straddles
Commodity futures spreads or straddles are the dynamic price differentials between two or more contracts, usually futures contracts. Spreads involve the simultaneous buying and selling
■
■
of futures or options contracts with the goal of profiting from the changing price relationship between these assets. Spreads can be a measure of the differential between two trading months of the same futures contract (referred to as inter-month or calendar spreads). They can be traded as the difference between two different futures contracts that share a unique price relationship (inter-commodity or inter-market spread). Or they can consist of more than two futures contracts that share a price, or operational relationship, like the soybean crushing margin (soybeans, soybean oil and soybean meal). Basis may also be expressed as a spread, as a value difference between the cash market and a futures contract.
If the price difference between two contract months of the same commodity positively reflects the costs of holding that commodity for a period of time (upward sloping price curve), it is said to be at carry, or contango. The cost of carrying a storable commodity typically includes storage or rental costs, interest and insurance. A market with carrying charges may indicate a fundamental market condition where the commodity is adequately supplied and in good balance. The function of this market scenario is to provide market participants who own storage capacity with a price incentive to keep supplies of the commodity temporarily off the market. Traders continuously watch these inter-month price relationships, as they potentially represent prime-income opportunities. These are the relative difference between various contract positions and can contribute enhancement to handling margins or the profitability of their market participation.
If a calendar spread is believed to be near its mathematical carrying charge maximum, traders may position their trades to take advantage of a potential narrowing of the relationship by buying or owning one futures contract month and selling another that is more distant in the future. Traders may also engage in this strategy if they believe the fundamental nature of the market is changing from adequate supplies to a tightening balance. Conversely, if a strong demand market is changing into one of excessive supply, a trader may buy forward contracts and sell the spot futures.
Traders use a variety of spreads, hoping to profit by any changes in the price relationship between elements of the trade. Although the cost of entry (margin) is usually less than establishing a futures position, there can be substantial risk in spread trading. A spread is nearly certain to change over time, reflecting changing market fundamentals and price relationships. Spread trades are generally thought to carry less inherent risk than futures positions, but that is not always the case. Calendar spreads between crop years, and inter-commodity spreads, may not be limited to the constraints of shared market fundamentals. That’s why they carry significant risk.
The dynamic nature of commodity spreads often gives evidence to changing market conditions, as one commodity may gain or lose ground against another. For example, calendar spreads of the same commodity may change from contango to backwardation (the opposite of contango where the market is inverted – the spot month trades at a premium to the more deferred trading months).
Risk Management Tools 47
Inter-market spreads can be the most exciting of all spreading activity. In most cases, the contracts have a sound fundamental relationship, either through processing activity or in a specific physical attribute or characteristic. Chicago, Kansas City and Minneapolis wheat futures contracts each represent a unique type of wheat – soft red winter, hard winter and spring wheat – and, each variety is subject to different supply-and-demand characteristics, regional weather patterns and different uses. Traders constantly monitor and trade the relative value differentials between these products and markets, trying to identify and take advantage of relationships that may be out of alignment.
The soybean crushing margin is an example of a processing relationship between the feedstock of an industry and its outputs. The dynamics of this relationship can be experienced on several different levels, as there is a margin differential between soybeans and soybean oil and soybean meal – but there is also the relationship between the meal and oil to consider. Market fundamentals may reflect an abundant soybean crop in the U.S., but soybean oil and crushing margins may be very strong if a canola crop failure exists.
BasisBasis is the price difference between the cash, or physical commodity, and the applicable futures market contract – such as the price difference between soybeans in Decatur, IL, and Chicago Mercantile Exchange soybean futures. The cash basis of a commodity can be at a premium or a discount to the futures price, at a specific location for a given time frame. As consumers, we are not accustomed to paying different prices for goods or services at different locations. However, as in real estate, the world of commodity trading is motivated by location, location, location.
Moving massive amounts of commodities is a logistically challenging, energy-intensive exercise, costing large sums of money. In physical commodities, the basis price reflects the local and regional market supply and demand of the product and the cost of available freight to the most accessible competing location or futures delivery point for that commodity.
If A owns a widget business in Winnipeg and the best market for widgets is Wisconsin, A’s inventory will be worth more in Wisconsin than in Winnipeg. As a business owner, A must be constantly aware of where his best market is every day, as well as his cost of delivery and his cost to hold inventory. A may sell to Wisconsin today, to West Virginia tomorrow or hold his product for delivery to Washington next month.
Basis is one of the primary market pricing tools available to the entire value chain of the agricultural commodity industry, from growers to processors, to exporters, to food manufacturers, to food service establishments and more.
Another example: A western Illinois soybean grower holds 3,000 bushels from last season’s crop he wants to sell in grain bins on his farm. The Chicago Board of Trade August soybean futures are trading at $12.50 a bushel. Elevator A on the Illinois River
is bidding $12.05, or 45 cents less for spot delivery. An Illinois soybean processor is paying $12.20, or 30 cents less. It costs 10 cents a bushel to truck the beans to the river and 20 cents to send them to the crusher. The grower calculates the difference and concludes that the freight savings to the river do not make up for the higher basis paid by the processor. The delivered basis is 55 cents less to the river and 50 cents less to the processor. The grower sells his soybeans to the processor.
The value of the basis – the price difference of cash price minus futures – is dynamic and variable, changing from hour to hour and day to day. It is driven by micro- and macro-economic forces. Occasionally, prevailing market conditions affect basis levels even more than futures, elevating basis to the level of greatest risk component and price variability component to market participants. If supply and demand fundamentals in a certain region shift quickly, then the basis in the local market will change more quickly than prices in Chicago. Even in a period of strong demand and historically high futures prices, basis may perform differently. Basis weakness in interior U.S. locations has recently been linked to the rapid rise in energy and the cost of shipping to export markets. Major grain trading firms increasingly rely on internal basis trading expertise to provide optimal risk management and income potential. The great level of price volatility in the recent markets translates into higher levels of risk for all agribusiness throughout the length and breadth of the supply chain.
Variations in basis reflect the costs of transportation, proximity to markets, availability of storage and regional supply-and-demand factors. This variability can be clearly seen on the following soybean basis map. The value of soybeans increases dramatically from west to east and along river systems.
Chicago Board of Trade PriceBoard of Trade exchange members were responsible for developing and implementing the modern futures contract. This is an innovative forward contract that created a standard and abbreviated the system of negotiating forward contracts for purchasing and selling of grain. Many of the important details required of a bona fide forward contract, like points of delivery, size of shipments, times of delivery and delivery grades were all established in the futures contract. Only price was left to be negotiated by the member traders. Futures trading is always conducted through the auction process - by open outcry on the exchange trading floors or electronically - and all transaction prices are required to be made available to the public to promote price transparency and discovery for the entire market.
At specific times, trading hours, exchange members may engage in an auction process, where other members simultaneously bid to buy or offer to sell the standardized futures contracts for varying delivery periods. Trading in each commodity may be located in its unique trading pit on an exchange floor, or in a virtual, electronic trading pit. This system of trading - either on a trading floor or in an electronic version - is the same successful format that has been used for more than 150 years. It
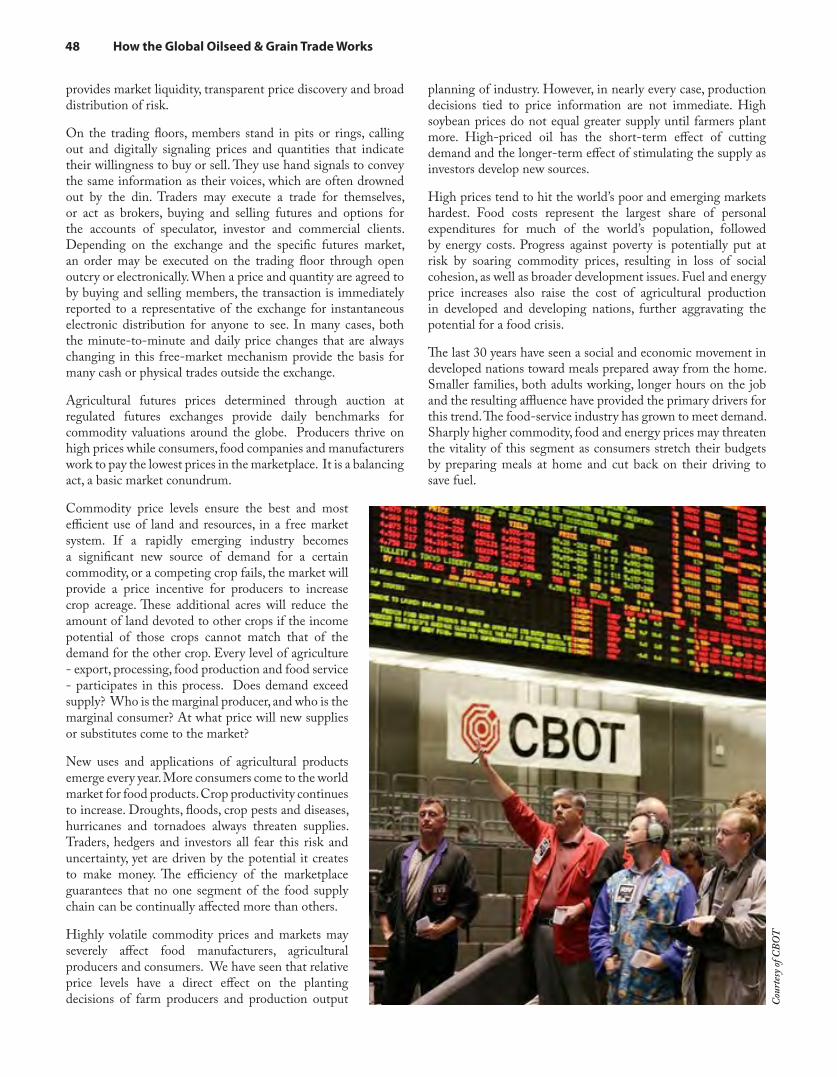
48 How the Global Oilseed & Grain Trade Works
provides market liquidity, transparent price discovery and broad distribution of risk.
On the trading floors, members stand in pits or rings, calling out and digitally signaling prices and quantities that indicate their willingness to buy or sell. They use hand signals to convey the same information as their voices, which are often drowned out by the din. Traders may execute a trade for themselves, or act as brokers, buying and selling futures and options for the accounts of speculator, investor and commercial clients. Depending on the exchange and the specific futures market, an order may be executed on the trading floor through open outcry or electronically. When a price and quantity are agreed to by buying and selling members, the transaction is immediately reported to a representative of the exchange for instantaneous electronic distribution for anyone to see. In many cases, both the minute-to-minute and daily price changes that are always changing in this free-market mechanism provide the basis for many cash or physical trades outside the exchange.
Agricultural futures prices determined through auction at regulated futures exchanges provide daily benchmarks for commodity valuations around the globe. Producers thrive on high prices while consumers, food companies and manufacturers work to pay the lowest prices in the marketplace. It is a balancing act, a basic market conundrum.
Commodity price levels ensure the best and most efficient use of land and resources, in a free market system. If a rapidly emerging industry becomes a significant new source of demand for a certain commodity, or a competing crop fails, the market will provide a price incentive for producers to increase crop acreage. These additional acres will reduce the amount of land devoted to other crops if the income potential of those crops cannot match that of the demand for the other crop. Every level of agriculture - export, processing, food production and food service - participates in this process. Does demand exceed supply? Who is the marginal producer, and who is the marginal consumer? At what price will new supplies or substitutes come to the market?
New uses and applications of agricultural products emerge every year. More consumers come to the world market for food products. Crop productivity continues to increase. Droughts, floods, crop pests and diseases, hurricanes and tornadoes always threaten supplies. Traders, hedgers and investors all fear this risk and uncertainty, yet are driven by the potential it creates to make money. The efficiency of the marketplace guarantees that no one segment of the food supply chain can be continually affected more than others.
Highly volatile commodity prices and markets may severely affect food manufacturers, agricultural producers and consumers. We have seen that relative price levels have a direct effect on the planting decisions of farm producers and production output
planning of industry. However, in nearly every case, production decisions tied to price information are not immediate. High soybean prices do not equal greater supply until farmers plant more. High-priced oil has the short-term effect of cutting demand and the longer-term effect of stimulating the supply as investors develop new sources.
High prices tend to hit the world’s poor and emerging markets hardest. Food costs represent the largest share of personal expenditures for much of the world’s population, followed by energy costs. Progress against poverty is potentially put at risk by soaring commodity prices, resulting in loss of social cohesion, as well as broader development issues. Fuel and energy price increases also raise the cost of agricultural production in developed and developing nations, further aggravating the potential for a food crisis.
The last 30 years have seen a social and economic movement in developed nations toward meals prepared away from the home. Smaller families, both adults working, longer hours on the job and the resulting affluence have provided the primary drivers for this trend. The food-service industry has grown to meet demand. Sharply higher commodity, food and energy prices may threaten the vitality of this segment as consumers stretch their budgets by preparing meals at home and cut back on their driving to save fuel.
Cour
tesy o
f CBO
T
Risk Management Tools 49
Basis Impacting Trade Volumes Like futures prices, basis responds to supply and demand. The impact of today’s supply-and-demand pressures may be expected to diminish over time, as the market reacts. A soybean oil supplier may want to reduce current burdensome stocks by aggressively offering spot, crude degummed oil at minus 300 points (3 cents a pound) under Board of Trade futures. However, the supplier is unlikely to offer oil for forward delivery at the same discounted level, since he may expect the basis eventually is likely to converge on a historical mean price level.
Basis is a true location-specific barometer of commodity alloca-tions and dislocations. Basis provides market participants with a road map for the logistically efficient flow of products. The awareness of relative basis levels and meaning of their departure from normal, combined with freight availability and costs can be a powerful profit-generating advantage in a competitive market.
Basis risk can be both significant and immediate. Plant closures, transportation interruptions, weather developments such as floods and hurricanes, and changes in government policy instantly can affect the basis. The only basis-risk mitigating tools available to traders are vertical integration - passing basis changes along the value chain - and establishing a flat-price position that is opposite of basis risk exposure.
Risk Management ToolsFutures prices have varied dramatically during the past five years, with nearly all categories of commodities being affected: agriculture, energy, precious metals and food. The rapid rise in prices has proven to be a hardship for consumers and industrial users of the commodities. Individuals have experienced higher consumer prices on a day-to-day basis at the fuel pump and the grocery store. Most industries have been left reeling from the impact of sharply increased costs.
This high degree of volatility in prices has had a significant impact on virtually every manufacturing, transportation and food-processing company that uses commodities to create products or consumes them in conducting their business. The ability of these companies to manage commodity risks is often the most vital factor in achieving success and long-term financial stability.
Price-risk management provides strategies for assessing the uncertainty related to adverse price movement and the tools for managing and mitigating that risk. Each party engaging in risk-management practices tries to transfer any unacceptable or threatening risk to another party, therefore reducing the potential negative effects of the risk to the transferring party.
Primary risk-management and mitigation tools available to anyone exposed to adverse commodity prices include:
Hedging
Commodity swaps
•
•
Vertical integration, or strategic partnering agreements with suppliers
Mathematical risk-assessment modeling and analytics, such as VaR and SPAN.
A hedge is a transaction that requires establishing a futures or options position equal to and opposite of the underlying physical position that is exposed to price risk. An example is over-the-counter options. Commodity swaps are exchanges of price flows based on the price of a target commodity. Vertical integration means that a company has assets at every step of the value chain and thus can control its own prices.
There are two types of mathematical risk-assessment models that are used by the agricultural industry to limit risk exposure: VaR (Value at Risk) and SPAN (Standard Portfolio Analysis of Risk). VaR is a statistical measure of risk exposure that provides a quantified statement of risk to an entire portfolio. The output variable of the model is a loss probability measurement of a specific dollar amount. The VaR measurement is derived through computer simulations of market scenarios and proprietary risk assessment modeling. Companies such as Bunge use VaR to control position limits and risk.
SPAN is a methodology that calculates performance requirements by analyzing the what-ifs of many market scenarios. SPAN produces a calculated output solution based on the overall portfolio risk. The SPAN program is used by many risk managers, including futures commission merchants, investment banks, hedge funds, research organizations, risk managers, brokerage firms and individual investors.
How Commodity Funds and Indexes Affect Chicago Board of Trade PricesProfessional investment managers have included futures funds in their portfolios for more than 30 years. The potential for huge profits in commodities was recognized by investors following the high level of commodity price volatility in the 1970s. Many individuals and trading firms proved to be phenomenally successful during this time. Many of these traders belied the cowboy image previously associated with the commodity markets. The markets began to attract an intellectual crowd: adventurous mathematicians, theoreticians and an occasional Nobel laureate. Computer trading programs and systems were written and tested. Well-funded traders and new investors burst onto the scene. Legendary names like Helmut Weymar, Bruce Kovner, Paul Tudor Jones, Michael Marcus, Louis Bacon and Richard Dennis began to be regularly heard in every day conversations on Wall Street.
Commodity investment vehicles have become mainstream. In the last 15 years, institutional and corporate investors, public pension funds, endowments, trusts, and banks have included managed futures as part of their well-diversified portfolios. Introduction of the Goldman Sachs Commodity Index (GSCI) conferred legitimacy to commodities as a functional investment medium. Today, commodity investments are included in the
•
•
50 How the Global Oilseed & Grain Trade Works
portfolios of even historically conservative investors. Statistical research offered by several financial services companies have shown that long-term yields improve and risk is reduced by including broad commodity portfolios in investment strategies.
Commodities often are seen as a hedge against inflation because they tend to rise with inflation. Commodity indexes tend to run counter to stock and bond prices, increasing their attractiveness to investors. Their popularity has helped commodity portfolio fund trading grow quickly in the last few years, increasing to $250 billion in 2008 from $15 billion in 2003.
The size of this investment has become a concern of consumers, food manufacturers and members of Congress. Many observers blame these large speculative investments for the market’s recent increase in volatility, accelerated and accentuated price trends, and prices being driven away from apparent fundamental values.
Rising costs for agricultural producers and food riots from Haiti to Egypt are blamed on speculative commodity buying. Attracting the most attention are large investments made by index funds. As these funds are positioned to duplicate the ups and downs of the underlying index, they must maintain long positions in the market by buying and owning assets. They can never sell to go short. They can only sell to roll their hedges forward.
Investors and speculators have almost certainly helped to push prices higher. But to date, no one has been able to quantify their contribution and degree of their impact. How far has the market strayed from the mean? Some financial industry analysts argue that index investing and speculation isn’t to blame for higher prices. They say the true culprits are the weak U.S. dollar, new demand from emerging markets, weather aberrations, shifts in the supply and demand equilibrium and low interest rates.
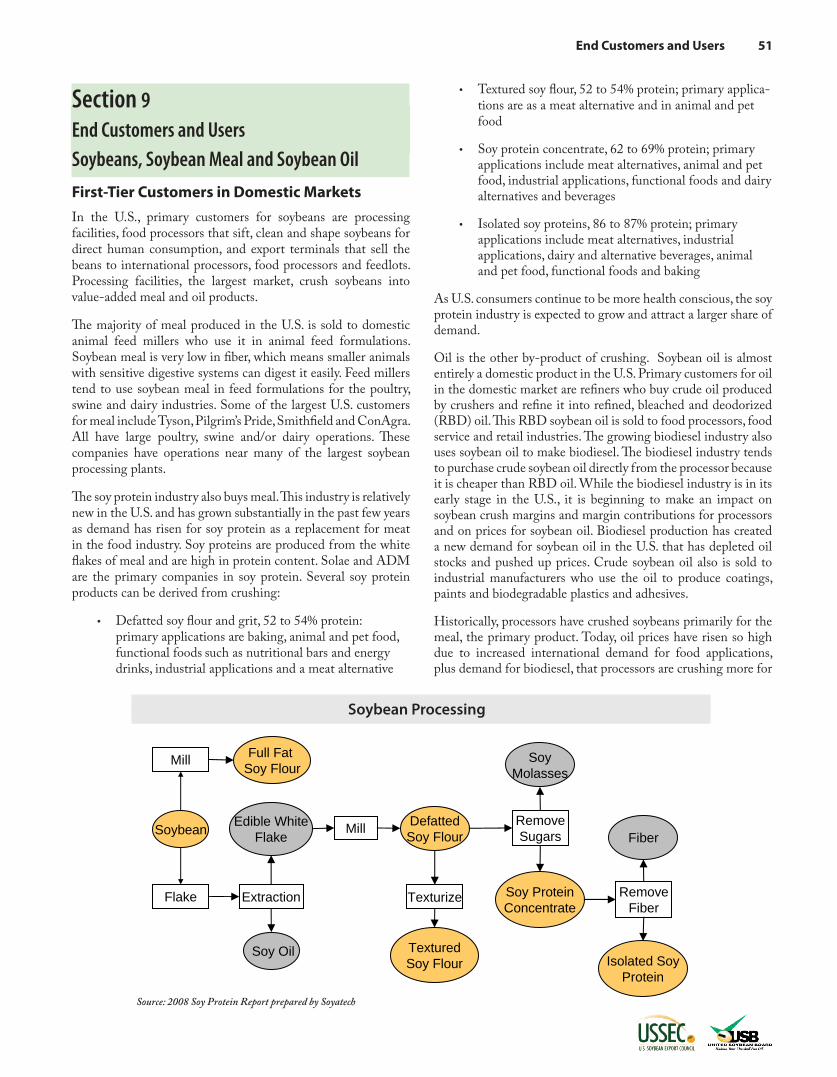
End Customers and Users 51
Section 9 End Customers and Users Soybeans, Soybean Meal and Soybean OilFirst-Tier Customers in Domestic MarketsIn the U.S., primary customers for soybeans are processing facilities, food processors that sift, clean and shape soybeans for direct human consumption, and export terminals that sell the beans to international processors, food processors and feedlots. Processing facilities, the largest market, crush soybeans into value-added meal and oil products.
The majority of meal produced in the U.S. is sold to domestic animal feed millers who use it in animal feed formulations. Soybean meal is very low in fiber, which means smaller animals with sensitive digestive systems can digest it easily. Feed millers tend to use soybean meal in feed formulations for the poultry, swine and dairy industries. Some of the largest U.S. customers for meal include Tyson, Pilgrim’s Pride, Smithfield and ConAgra. All have large poultry, swine and/or dairy operations. These companies have operations near many of the largest soybean processing plants.
The soy protein industry also buys meal. This industry is relatively new in the U.S. and has grown substantially in the past few years as demand has risen for soy protein as a replacement for meat in the food industry. Soy proteins are produced from the white flakes of meal and are high in protein content. Solae and ADM are the primary companies in soy protein. Several soy protein products can be derived from crushing:
Defatted soy flour and grit, 52 to 54% protein: primary applications are baking, animal and pet food, functional foods such as nutritional bars and energy drinks, industrial applications and a meat alternative
•
Textured soy flour, 52 to 54% protein; primary applica-tions are as a meat alternative and in animal and pet food
Soy protein concentrate, 62 to 69% protein; primary applications include meat alternatives, animal and pet food, industrial applications, functional foods and dairy alternatives and beverages
Isolated soy proteins, 86 to 87% protein; primary applications include meat alternatives, industrial applications, dairy and alternative beverages, animal and pet food, functional foods and baking
As U.S. consumers continue to be more health conscious, the soy protein industry is expected to grow and attract a larger share of demand.
Oil is the other by-product of crushing. Soybean oil is almost entirely a domestic product in the U.S. Primary customers for oil in the domestic market are refiners who buy crude oil produced by crushers and refine it into refined, bleached and deodorized (RBD) oil. This RBD soybean oil is sold to food processors, food service and retail industries. The growing biodiesel industry also uses soybean oil to make biodiesel. The biodiesel industry tends to purchase crude soybean oil directly from the processor because it is cheaper than RBD oil. While the biodiesel industry is in its early stage in the U.S., it is beginning to make an impact on soybean crush margins and margin contributions for processors and on prices for soybean oil. Biodiesel production has created a new demand for soybean oil in the U.S. that has depleted oil stocks and pushed up prices. Crude soybean oil also is sold to industrial manufacturers who use the oil to produce coatings, paints and biodegradable plastics and adhesives.
Historically, processors have crushed soybeans primarily for the meal, the primary product. Today, oil prices have risen so high due to increased international demand for food applications, plus demand for biodiesel, that processors are crushing more for
•
•
•
soyatech A S O Y A T E C H S Y N D I C A T E D R E P O R T • © 2008 by Soyatech, LLC. All rights reserved. 18
Soy Protein Ingredients & Processing
Soy Protein Processing (depiction above for representational purposes only, not complete or actual process)
– Soy proteins are derived from deffated soybean meal or flakes after the oil has been extracted from the whole soybean by solvent extraction or by pressing
– Defatted Soy Flour is milled from the defatted white cake or flake– Textured Soy Flour is made by texturizing soy flour with by extrusion– Soy Protein Concentrates are produced from the flour by further removal of the soluble sugars, or “soy
molasses” (which also contains the isoflavones) with the Alcohol/Aqueous wash method (above)• An alternative Acid Wash process precipitates a protein/water mixture into curds and whey, which is
then removed, leaving the protein and fiber components after drying– Soy Protein concentrate can also be texturized using extrusion, or spray-dried– Isolated Soy Proteins are produced by the removal of the carbohydrates and the fiber from the defatted
flakes
Soybean
Mill Full Fat Soy Flour
Flake
RemoveSugarsMill
Extraction
Soy Oil
Edible WhiteFlake
Soy ProteinConcentrate
DefattedSoy Flour
RemoveFiber
Isolated SoyProtein
Texturize
TexturedSoy Flour
SoyMolasses
Fiber
Soybean Processing
Source: 2008 Soy Protein Report prepared by Soyatech
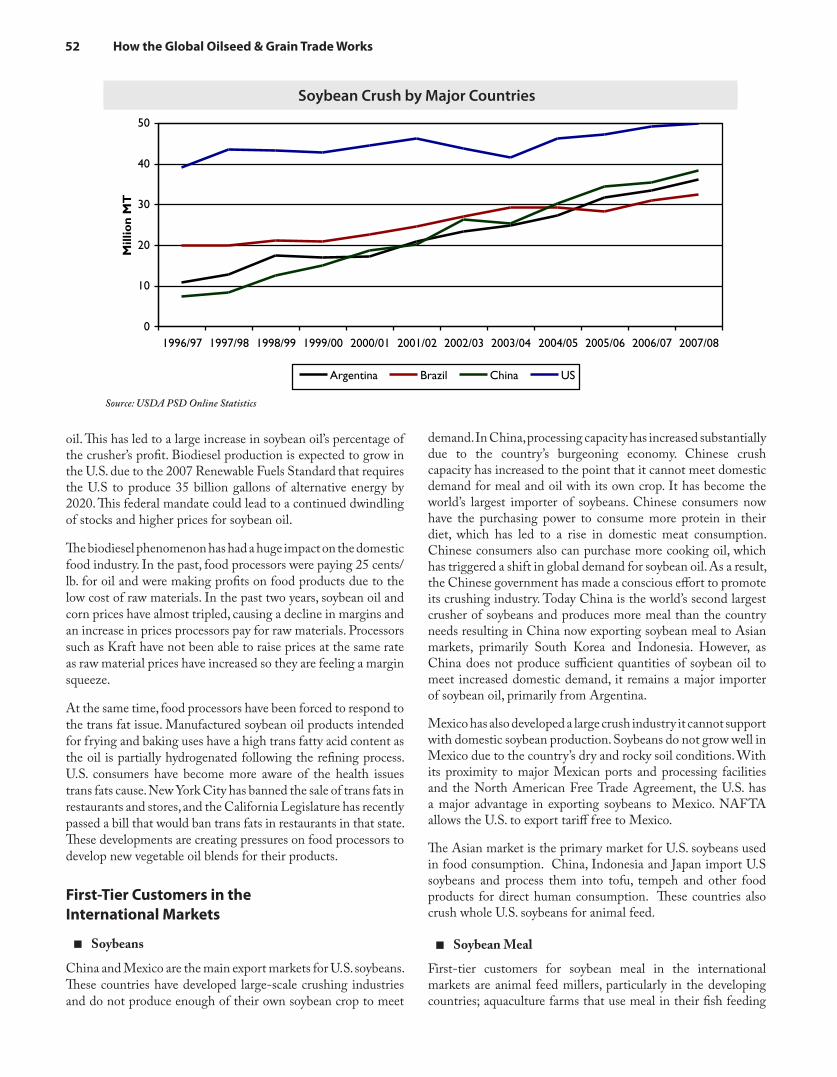
52 How the Global Oilseed & Grain Trade Works
oil. This has led to a large increase in soybean oil’s percentage of the crusher’s profit. Biodiesel production is expected to grow in the U.S. due to the 2007 Renewable Fuels Standard that requires the U.S to produce 35 billion gallons of alternative energy by 2020. This federal mandate could lead to a continued dwindling of stocks and higher prices for soybean oil.
The biodiesel phenomenon has had a huge impact on the domestic food industry. In the past, food processors were paying 25 cents/lb. for oil and were making profits on food products due to the low cost of raw materials. In the past two years, soybean oil and corn prices have almost tripled, causing a decline in margins and an increase in prices processors pay for raw materials. Processors such as Kraft have not been able to raise prices at the same rate as raw material prices have increased so they are feeling a margin squeeze.
At the same time, food processors have been forced to respond to the trans fat issue. Manufactured soybean oil products intended for frying and baking uses have a high trans fatty acid content as the oil is partially hydrogenated following the refining process. U.S. consumers have become more aware of the health issues trans fats cause. New York City has banned the sale of trans fats in restaurants and stores, and the California Legislature has recently passed a bill that would ban trans fats in restaurants in that state. These developments are creating pressures on food processors to develop new vegetable oil blends for their products.
First-Tier Customers in the International Markets
Soybeans
China and Mexico are the main export markets for U.S. soybeans. These countries have developed large-scale crushing industries and do not produce enough of their own soybean crop to meet
■
0
10
20
30
40
50
1996/97 1997/98 1998/99 1999/00 2000/01 2001/02 2002/03 2003/04 2004/05 2005/06 2006/07 2007/08
Mill
ion
MT
Argentina Brazil China US
Soybean Crush by Major Countries
Source: USDA PSD Online Statistics
demand. In China, processing capacity has increased substantially due to the country’s burgeoning economy. Chinese crush capacity has increased to the point that it cannot meet domestic demand for meal and oil with its own crop. It has become the world’s largest importer of soybeans. Chinese consumers now have the purchasing power to consume more protein in their diet, which has led to a rise in domestic meat consumption. Chinese consumers also can purchase more cooking oil, which has triggered a shift in global demand for soybean oil. As a result, the Chinese government has made a conscious effort to promote its crushing industry. Today China is the world’s second largest crusher of soybeans and produces more meal than the country needs resulting in China now exporting soybean meal to Asian markets, primarily South Korea and Indonesia. However, as China does not produce sufficient quantities of soybean oil to meet increased domestic demand, it remains a major importer of soybean oil, primarily from Argentina.
Mexico has also developed a large crush industry it cannot support with domestic soybean production. Soybeans do not grow well in Mexico due to the country’s dry and rocky soil conditions. With its proximity to major Mexican ports and processing facilities and the North American Free Trade Agreement, the U.S. has a major advantage in exporting soybeans to Mexico. NAFTA allows the U.S. to export tariff free to Mexico.
The Asian market is the primary market for U.S. soybeans used in food consumption. China, Indonesia and Japan import U.S soybeans and process them into tofu, tempeh and other food products for direct human consumption. These countries also crush whole U.S. soybeans for animal feed.
Soybean Meal
First-tier customers for soybean meal in the international markets are animal feed millers, particularly in the developing countries; aquaculture farms that use meal in their fish feeding
■
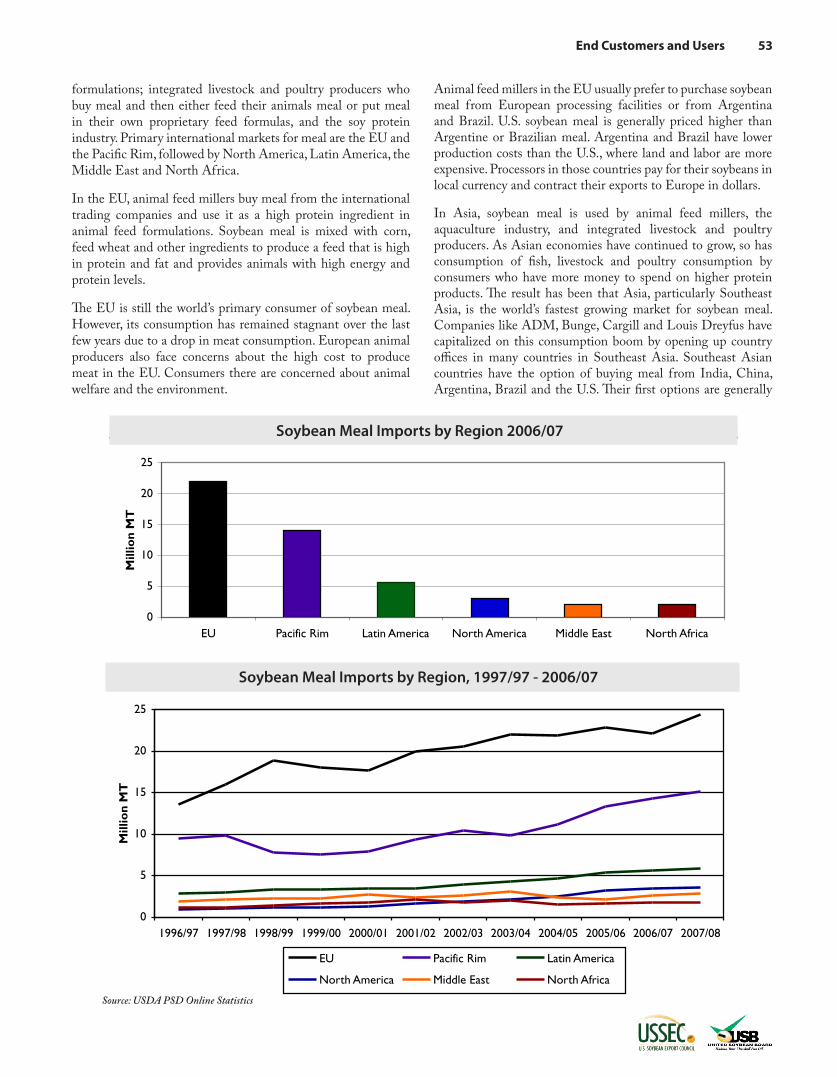
End Customers and Users 5�
formulations; integrated livestock and poultry producers who buy meal and then either feed their animals meal or put meal in their own proprietary feed formulas, and the soy protein industry. Primary international markets for meal are the EU and the Pacific Rim, followed by North America, Latin America, the Middle East and North Africa.
In the EU, animal feed millers buy meal from the international trading companies and use it as a high protein ingredient in animal feed formulations. Soybean meal is mixed with corn, feed wheat and other ingredients to produce a feed that is high in protein and fat and provides animals with high energy and protein levels.
The EU is still the world’s primary consumer of soybean meal. However, its consumption has remained stagnant over the last few years due to a drop in meat consumption. European animal producers also face concerns about the high cost to produce meat in the EU. Consumers there are concerned about animal welfare and the environment.
Animal feed millers in the EU usually prefer to purchase soybean meal from European processing facilities or from Argentina and Brazil. U.S. soybean meal is generally priced higher than Argentine or Brazilian meal. Argentina and Brazil have lower production costs than the U.S., where land and labor are more expensive. Processors in those countries pay for their soybeans in local currency and contract their exports to Europe in dollars.
In Asia, soybean meal is used by animal feed millers, the aquaculture industry, and integrated livestock and poultry producers. As Asian economies have continued to grow, so has consumption of fish, livestock and poultry consumption by consumers who have more money to spend on higher protein products. The result has been that Asia, particularly Southeast Asia, is the world’s fastest growing market for soybean meal. Companies like ADM, Bunge, Cargill and Louis Dreyfus have capitalized on this consumption boom by opening up country offices in many countries in Southeast Asia. Southeast Asian countries have the option of buying meal from India, China, Argentina, Brazil and the U.S. Their first options are generally
0
5
10
15
20
25
EU Pacific Rim Latin America North America Middle East North Africa
Mill
ion
MT
Soybean Meal Imports by Region 2006/07
0
5
10
15
20
25
1996/97 1997/98 1998/99 1999/00 2000/01 2001/02 2002/03 2003/04 2004/05 2005/06 2006/07 2007/08
Mill
ion
MT
EU Pacific Rim Latin America
North America Middle East North Africa
Soybean Meal Imports by Region, 1997/97 - 2006/07
Source: USDA PSD Online Statistics
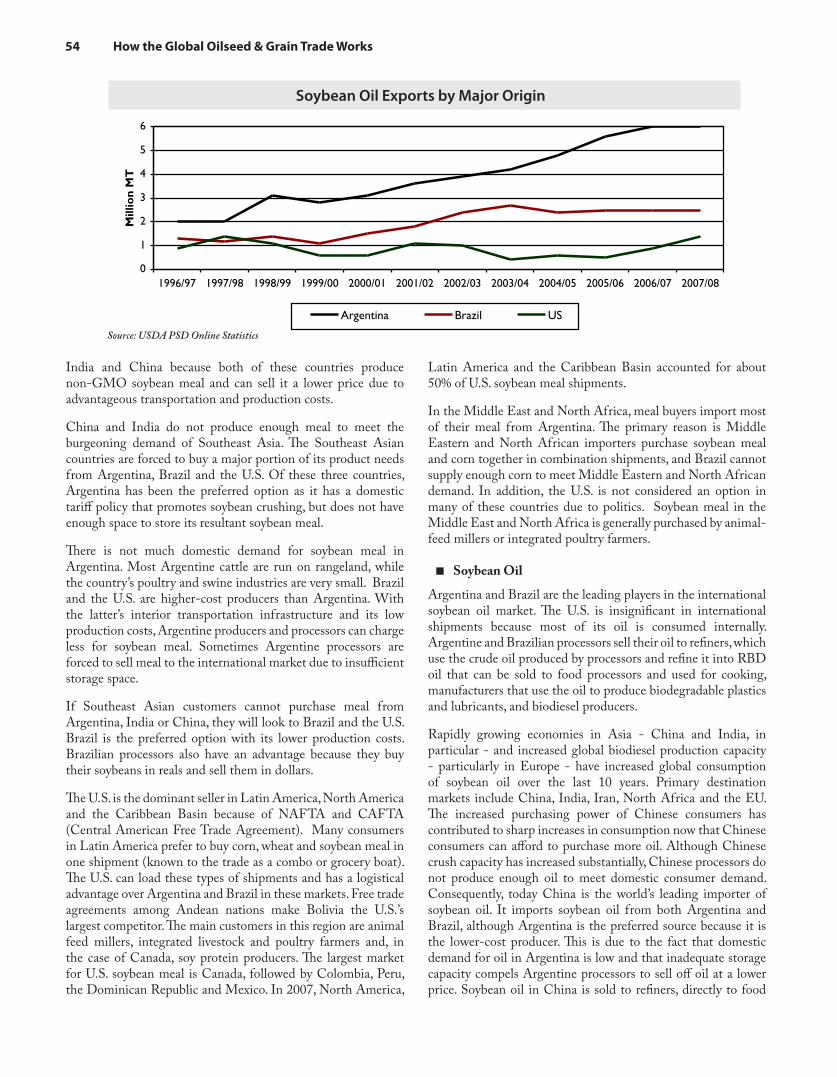
54 How the Global Oilseed & Grain Trade Works
India and China because both of these countries produce non-GMO soybean meal and can sell it a lower price due to advantageous transportation and production costs.
China and India do not produce enough meal to meet the burgeoning demand of Southeast Asia. The Southeast Asian countries are forced to buy a major portion of its product needs from Argentina, Brazil and the U.S. Of these three countries, Argentina has been the preferred option as it has a domestic tariff policy that promotes soybean crushing, but does not have enough space to store its resultant soybean meal.
There is not much domestic demand for soybean meal in Argentina. Most Argentine cattle are run on rangeland, while the country’s poultry and swine industries are very small. Brazil and the U.S. are higher-cost producers than Argentina. With the latter’s interior transportation infrastructure and its low production costs, Argentine producers and processors can charge less for soybean meal. Sometimes Argentine processors are forced to sell meal to the international market due to insufficient storage space.
If Southeast Asian customers cannot purchase meal from Argentina, India or China, they will look to Brazil and the U.S. Brazil is the preferred option with its lower production costs. Brazilian processors also have an advantage because they buy their soybeans in reals and sell them in dollars.
The U.S. is the dominant seller in Latin America, North America and the Caribbean Basin because of NAFTA and CAFTA (Central American Free Trade Agreement). Many consumers in Latin America prefer to buy corn, wheat and soybean meal in one shipment (known to the trade as a combo or grocery boat). The U.S. can load these types of shipments and has a logistical advantage over Argentina and Brazil in these markets. Free trade agreements among Andean nations make Bolivia the U.S.’s largest competitor. The main customers in this region are animal feed millers, integrated livestock and poultry farmers and, in the case of Canada, soy protein producers. The largest market for U.S. soybean meal is Canada, followed by Colombia, Peru, the Dominican Republic and Mexico. In 2007, North America,
Latin America and the Caribbean Basin accounted for about 50% of U.S. soybean meal shipments.
In the Middle East and North Africa, meal buyers import most of their meal from Argentina. The primary reason is Middle Eastern and North African importers purchase soybean meal and corn together in combination shipments, and Brazil cannot supply enough corn to meet Middle Eastern and North African demand. In addition, the U.S. is not considered an option in many of these countries due to politics. Soybean meal in the Middle East and North Africa is generally purchased by animal-feed millers or integrated poultry farmers.
Soybean Oil
Argentina and Brazil are the leading players in the international soybean oil market. The U.S. is insignificant in international shipments because most of its oil is consumed internally. Argentine and Brazilian processors sell their oil to refiners, which use the crude oil produced by processors and refine it into RBD oil that can be sold to food processors and used for cooking, manufacturers that use the oil to produce biodegradable plastics and lubricants, and biodiesel producers.
Rapidly growing economies in Asia - China and India, in particular - and increased global biodiesel production capacity - particularly in Europe - have increased global consumption of soybean oil over the last 10 years. Primary destination markets include China, India, Iran, North Africa and the EU. The increased purchasing power of Chinese consumers has contributed to sharp increases in consumption now that Chinese consumers can afford to purchase more oil. Although Chinese crush capacity has increased substantially, Chinese processors do not produce enough oil to meet domestic consumer demand. Consequently, today China is the world’s leading importer of soybean oil. It imports soybean oil from both Argentina and Brazil, although Argentina is the preferred source because it is the lower-cost producer. This is due to the fact that domestic demand for oil in Argentina is low and that inadequate storage capacity compels Argentine processors to sell off oil at a lower price. Soybean oil in China is sold to refiners, directly to food
■
0
1
2
3
4
5
6
1996/97 1997/98 1998/99 1999/00 2000/01 2001/02 2002/03 2003/04 2004/05 2005/06 2006/07 2007/08
Mill
ion
MT
Argentina Brazil US
Soybean Oil Exports by Major Origin
Source: USDA PSD Online Statistics
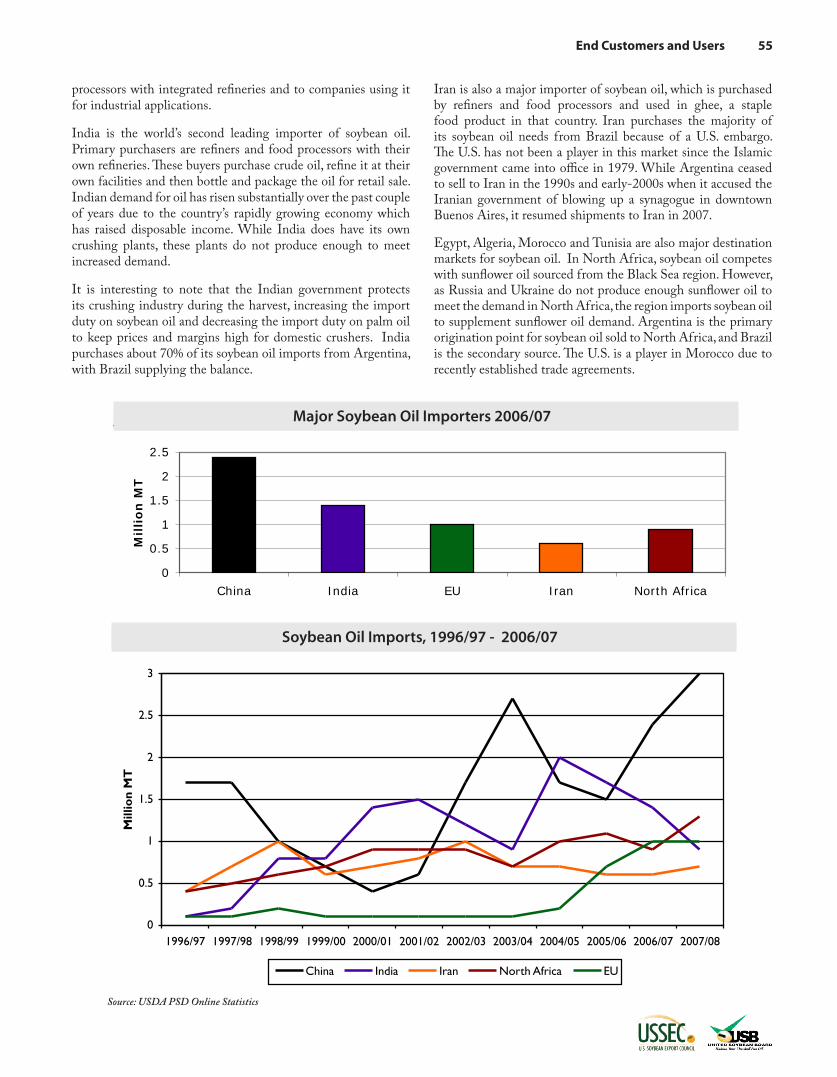
End Customers and Users 55
processors with integrated refineries and to companies using it for industrial applications.
India is the world’s second leading importer of soybean oil. Primary purchasers are refiners and food processors with their own refineries. These buyers purchase crude oil, refine it at their own facilities and then bottle and package the oil for retail sale. Indian demand for oil has risen substantially over the past couple of years due to the country’s rapidly growing economy which has raised disposable income. While India does have its own crushing plants, these plants do not produce enough to meet increased demand.
It is interesting to note that the Indian government protects its crushing industry during the harvest, increasing the import duty on soybean oil and decreasing the import duty on palm oil to keep prices and margins high for domestic crushers. India purchases about 70% of its soybean oil imports from Argentina, with Brazil supplying the balance.
Iran is also a major importer of soybean oil, which is purchased by refiners and food processors and used in ghee, a staple food product in that country. Iran purchases the majority of its soybean oil needs from Brazil because of a U.S. embargo. The U.S. has not been a player in this market since the Islamic government came into office in 1979. While Argentina ceased to sell to Iran in the 1990s and early-2000s when it accused the Iranian government of blowing up a synagogue in downtown Buenos Aires, it resumed shipments to Iran in 2007.
Egypt, Algeria, Morocco and Tunisia are also major destination markets for soybean oil. In North Africa, soybean oil competes with sunflower oil sourced from the Black Sea region. However, as Russia and Ukraine do not produce enough sunflower oil to meet the demand in North Africa, the region imports soybean oil to supplement sunflower oil demand. Argentina is the primary origination point for soybean oil sold to North Africa, and Brazil is the secondary source. The U.S. is a player in Morocco due to recently established trade agreements.
0
0.5
1
1.5
2
2.5
China India EU Iran North Africa
Mil
lio
n M
T
Major Soybean Oil Importers 2006/07
0
0.5
1
1.5
2
2.5
3
1996/97 1997/98 1998/99 1999/00 2000/01 2001/02 2002/03 2003/04 2004/05 2005/06 2006/07 2007/08
Mill
ion
MT
China India Iran North Africa EU
Soybean Oil Imports, 1996/97 - 2006/07
Source: USDA PSD Online Statistics
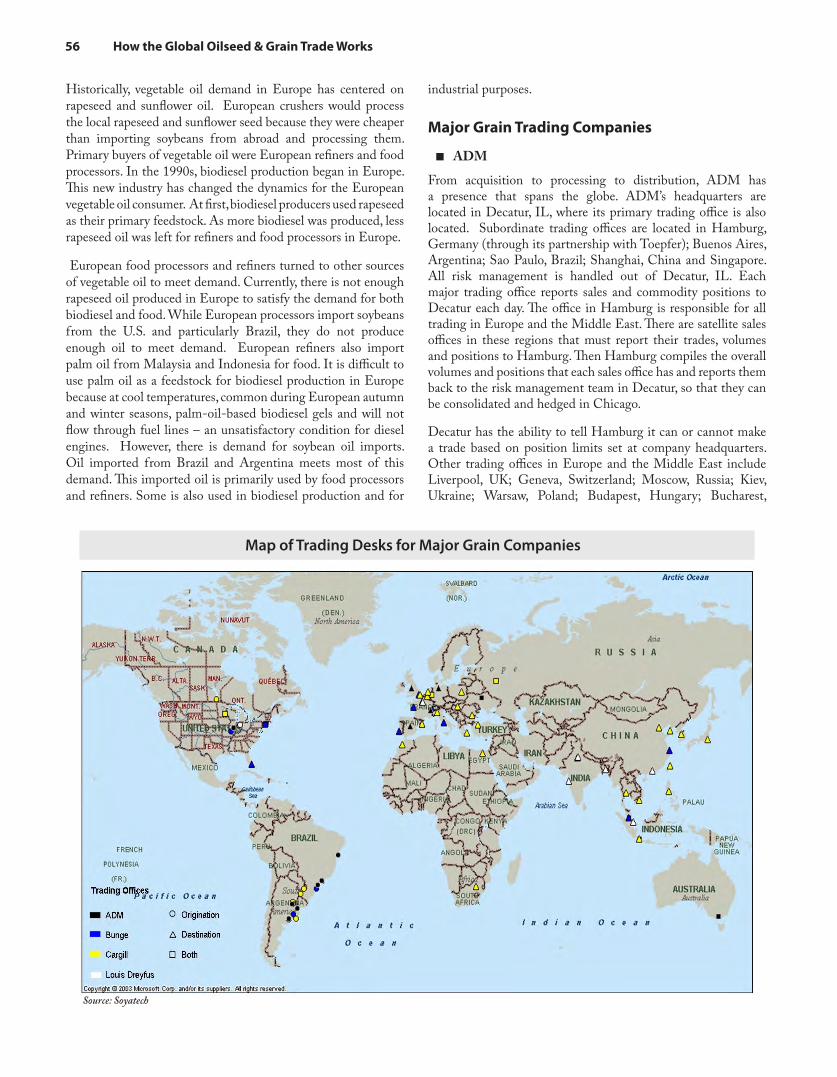
56 How the Global Oilseed & Grain Trade Works
Historically, vegetable oil demand in Europe has centered on rapeseed and sunflower oil. European crushers would process the local rapeseed and sunflower seed because they were cheaper than importing soybeans from abroad and processing them. Primary buyers of vegetable oil were European refiners and food processors. In the 1990s, biodiesel production began in Europe. This new industry has changed the dynamics for the European vegetable oil consumer. At first, biodiesel producers used rapeseed as their primary feedstock. As more biodiesel was produced, less rapeseed oil was left for refiners and food processors in Europe.
European food processors and refiners turned to other sources of vegetable oil to meet demand. Currently, there is not enough rapeseed oil produced in Europe to satisfy the demand for both biodiesel and food. While European processors import soybeans from the U.S. and particularly Brazil, they do not produce enough oil to meet demand. European refiners also import palm oil from Malaysia and Indonesia for food. It is difficult to use palm oil as a feedstock for biodiesel production in Europe because at cool temperatures, common during European autumn and winter seasons, palm-oil-based biodiesel gels and will not flow through fuel lines – an unsatisfactory condition for diesel engines. However, there is demand for soybean oil imports. Oil imported from Brazil and Argentina meets most of this demand. This imported oil is primarily used by food processors and refiners. Some is also used in biodiesel production and for
industrial purposes.
Major Grain Trading Companies
ADM
From acquisition to processing to distribution, ADM has a presence that spans the globe. ADM’s headquarters are located in Decatur, IL, where its primary trading office is also located. Subordinate trading offices are located in Hamburg, Germany (through its partnership with Toepfer); Buenos Aires, Argentina; Sao Paulo, Brazil; Shanghai, China and Singapore. All risk management is handled out of Decatur, IL. Each major trading office reports sales and commodity positions to Decatur each day. The office in Hamburg is responsible for all trading in Europe and the Middle East. There are satellite sales offices in these regions that must report their trades, volumes and positions to Hamburg. Then Hamburg compiles the overall volumes and positions that each sales office has and reports them back to the risk management team in Decatur, so that they can be consolidated and hedged in Chicago.
Decatur has the ability to tell Hamburg it can or cannot make a trade based on position limits set at company headquarters. Other trading offices in Europe and the Middle East include Liverpool, UK; Geneva, Switzerland; Moscow, Russia; Kiev, Ukraine; Warsaw, Poland; Budapest, Hungary; Bucharest,
■
Map of Trading Desks for Major Grain Companies
Source: Soyatech
End Customers and Users 57
Romania; Athens, Greece; Madrid, Spain; Paris, France; Jerusalem, Israel and Cairo, Egypt. These offices buy their products FOB from the major origination export elevators and are responsible for the product as soon as it is loaded on the ship at the origination port. As they sell the product CIF destination port, they are responsible for the ocean freight and the customer is responsible for picking products up at the port and ensuring they reach their destinations.
The Asia/Pacific Rim region is run out of Singapore. The Singapore office operates under similar dynamics as Hamburg in that all of the other Asia/Pacific Rim offices report to it. But Singapore must report to Decatur to ensure positions are in line with set limits. Other trading offices in the Asia/Pacific Rim region include Mumbai, India; Bangkok, Thailand; Ho Chi Minh City, Vietnam; Kuala Lumpur, Malaysia; Djakarta, Indonesia; Manila, Philippines; Melbourne and Sydney, Australia; Taipei, Taiwan; Seoul, South Korea; Tokyo, Japan and Shanghai, Beijing and Dalian, China. Shanghai is responsible for the other two offices in China and reports to Singapore. Sales are structured the same way as in Europe and the Middle East.
Argentina, like the U.S. and Brazil, is considered a soybean origination country. While ADM’s primary origination office in Argentina is located in Buenos Aires, ADM also has sales offices located in Santa Fe, the major soybean-producing region, and Bahia Blanca, the primary wheat-producing region. These offices, which belong to ADM’s partner, A.C. Toepfer International source soybeans, corn and wheat and produce soybean meal and oil which are sold on a FOB basis to the destination offices, which in turn are responsible for freight costs. They are originations for destination sales offices.
Brazil is organized in much the same way as Argentina, although ADM owns and operates almost all of the sales offices in this country. These offices source soybeans in Brazil which they sell FOB to the destination offices, which are responsible for the product as soon as it is loaded onto a ship. The primary sales office is located in Sao Paulo, with other offices located in Salvador, Santos and Paranagua responsible for reporting their positions to the office in Sao Paulo, which in turn reports to Decatur.
The primary sales office for North America, the Caribbean basin and the Andean region of South America is located in Decatur. The whole sales network reports to Decatur. ADM also has export elevators located in Windsor, Ontario, Portland, OR and New Orleans. These elevators sell products to destination offices FOB. The company has destination offices in Mexico City; Santo Domingo, Dominican Republic; Caracas, Venezuela; Bogota, Colombia, and Lima, Peru. These offices buy FOB from the export elevators and sell CIF destination port to customers within their countries.
Bunge
Bunge’s headquarters is located in White Plains, NY, where the company’s primary trading desk and risk management teams are also located. All soybean oil is traded from White Plains. The company compiles all of its soybean, soybean meal and
■
soybean oil positions in White Plains, which facilitates the risk management team’s ability to hedge these positions effectively. White Plains operates in a similar fashion as to Decatur does for ADM. The office can authorize any of the origination or destination offices to make a trade based upon daily global positions the company oversees.
Bunge’s primary soybean origination offices are located in Gaspar, Brazil (Santa Catarina province); Buenos Aires, Argentina and St. Louis, MO. (The company also has an origination office in Geneva, Switzerland that is responsible for originating wheat and sunflower seeds from the EU and Eastern Europe).These offices are responsible for all of the grain origination and soybean-processing capacity in their respective regions. They also are responsible for selling products FOB to Bunge’s international marketing group, which controls the destination market offices.
The office in Buenos Aires monitors all of the soybean positions in Argentina and Uruguay as well as all origination and processing operations and sales. The office in Gaspar is responsible for all origination, processing and sales of soybeans and products in Brazil. It is also responsible for monitoring and compiling all of the soybean and product positions in Brazil and sending these positions to White Plains daily. The office in St. Louis is responsible for all North American origination and processing operations, including canola operations in Canada. St. Louis compiles the North American soybean position daily and send it to White Plains so the risk management team can hedge these positions. Through its Miami satellite office, the St. Louis office also is responsible for international sales to Mexico, Central America, the Caribbean Basin and the Andean region.
These origination offices are responsible for all domestic sales in their regions. They are also responsible for generating sufficient amounts of products at Bunge’s export terminals to sell to the international marketing team. Bunge’s international marketing team has three primary offices: White Plains, Geneva and Singapore. White Plains is the primary destination office because it is responsible for all soybean oil sales and for maintaining Bunge’s global soybean and soybean product positions.
The Geneva office is Bunge’s primary destination soybean office. It covers all soybean and soybean product sales in the EU, North Africa and the Middle East. It also provides origination capabilities for the Singapore office and trades all freight for the international operation. The Geneva office is home to the head traders of soybeans and soybean meal, as well as wheat and corn, on a global basis. Bunge has several satellite offices in Europe that report to Geneva:
Hamburg, Germany - sales of soybeans and soybean meal in Northern Europe, from Ireland to the Baltic Sea; reports its position as well as the positions of St. Nazaire and Tilbury to Geneva daily
Tilbury, U.K. - soybean meal sales in the U.K. and reports to Hamburg
St. Nazaire, France - soybean meal sales in France and
•
•
•
58 How the Global Oilseed & Grain Trade Works
reports to Hamburg
Rome, Italy - crushing operations in Italy; sells soybeans and soybean meal to countries throughout the Mediterranean Basin with the exception of Spain and Turkey; compiles soybean and soybean meal positions for Rome, Barcelona and Istanbul that are reported to Geneva
Barcelona, Spain - crushing operations in Spain and Portugal; sells soybeans and soybean meal throughout Spain; reports to Rome
Istanbul, Turkey - sunflower crushing operations in Turkey and all soybean and soybean meal sales in Turkey; reports to Rome
The Geneva office also buys soybeans and soy products from North and South America for the office in Singapore. Singapore will send its daily sales to Geneva, and Geneva will buy soybeans and meal CIF to match these sales from Bunge’s major origination offices. Bunge set up its Asian operations in this way because of the time difference between Singapore and the major origination regions.
The Singapore office is responsible for maintaining all soybean positions in Asia. All sales are reported to Singapore, which sends the position list and sales contracts to the Geneva office. Geneva buys products that meet contract specifications from Bunge’s major origination offices FOB and arranges for freight. Singapore is responsible for all soybean and soybean meal sales to Indonesia, Malaysia, the Philippines, South Korea, Taiwan, Thailand and Vietnam. The Singapore office has satellite offices.
Shanghai, China - soybean sales to China and processing operations of two processing facilities in China
Mumbai, India - soybean processing and sales of crude soybean oil and bottled soybean oil in India
The Singapore office is quickly growing in importance for Bunge because demand for soybeans and products is high in Asia, the fastest-growing region in the world. Bunge Singapore is expected to become a separate operating unit soon. This change would not directly affect how Bunge’s international marketing team operates, but would only ensure that Singapore becomes its own profit center.
CargillCargill is headquartered in Minneapolis, MN. The Minneapolis office operates in a similar fashion to ADM’s Decatur headquarters. It is responsible for all grain origination and soybean processing operations and sales in the U.S., Canada and Mexico, and it is in charge of global risk management. Cargill has export terminals on the Gulf of Mexico in Louisiana and Texas from which it sells soybeans and soybean products to Cargill’s many destination offices and to third parties. Cargill
•
•
•
•
•
■
North America is also responsible for elevator operations in 16 U.S. states and soybean and canola crushing operations in the U.S. and Canada. Cargill Minneapolis is also responsible for all sales offices in Central America, the Caribbean Basin and South America outside of Argentina and Brazil. These are located in Bolivia, Chile, Colombia, Costa Rica, the Dominican Republic, Guatemala, Honduras, Paraguay, Peru and Venezuela. All of Cargill’s destination and origination offices report to Minneapolis.
Cargill has other soybean origination offices located in Buenos Aires and Sao Paulo as well as sunflower seed origination offices in Kiev and Moscow. Its canola and rapeseed origination offices are located in Melbourne, Winnipeg and Krefield, Germany. In Argentina, Cargill owns five export terminals (Puerto San Martin, Villa Gobernador Galvez, Alvear, White and Diamante), four oilseed crushing plants (Puerto San Martin, Villa Gobernador Galvez, White and Necochea) and a network of over 50 country elevators (located in the provinces of Buenos Aires, Cordoba, Santa Fe, La Pampa, Entre Rios, Chaco and Santiago del Estero). These offices report their positions daily to Buenos Aires, which, in turn, reports Argentina’s overall soybean position to Minneapolis. They sell soybeans and products FOB to Cargill’s destination offices or to third parties.
In Brazil, Cargill owns six export terminals, six soybean processing plants and more than 120 soybean elevators. Brazil operates in the same way as Argentina, reporting all positions to Sao Paulo, which, in turn, reports Brazil’s overall position to Minneapolis. Brazil also sells soybeans and products FOB domestically to Cargill’s destination offices or to third parties.
Cargill International S.A. is based in Geneva. It is responsible for Cargill’s world-wide trading of grains and oilseeds and vegetable oils. The world trading unit provides access to markets for Cargill offices originating grains, oilseeds, vegetable oils and proteins from North and South America. It also handles supply-chain management for Cargill’s processing plants in Europe and customers around the world.
Cargill Switzerland handles physical shipments of grains and oilseeds that exceed 30 million MT a year. Geneva buys soybeans, products and grains from major origination offices CIF and arranges for the freight so the products reach their final destinations efficiently. For this to happen efficiently, other destination offices must report sales and contracts to Geneva each day. Geneva reports its positions to Cargill’s risk management team in Minneapolis, which hedges the global position daily. Destination offices located in Africa, Asia, Australia, Europe and the Middle East report to Geneva. Other satellite sales offices in Europe, the Middle and Africa include: Mechelen, Belgium; Saint-Germain-en-Laye, France; Krefield, Germany; Surrey, U.K.; Athens, Greece; Budapest, Hungary; Milan, Italy; Amsterdam, the Netherlands; Warsaw, Poland; Bucharest, Romania; Moscow, Russia; Barcelona, Spain; Istanbul, Turkey; Kiev, Ukraine; Cairo, Egypt; Casablanca, Morocco and Johannesburg, South Africa.
Cargill’s Asian headquarters is in Singapore. Singapore is
End Customers and Users 59
responsible for selling soybeans and soybean products to Asian customers. Their products are purchased from Cargill’s major grain origination offices by the Geneva office, which is also responsible for the freight. Singapore is responsible for reporting all sales positions to Geneva daily so Geneva can buy the correct amount of product from the correct destinations with the specifications that meet the sales contract. Singapore is responsible for maintaining the overall positions for all of the satellite offices in the Pacific. These offices include: Shanghai, Beijing and Dalian, China; Gurgaon, India; Djakarta, Indonesia; Tokyo, Japan; Kuala Lumpur, Malaysia; Manila, Philippines; Seoul, South Korea; Taipei, Taiwan; Bangkok, Thailand; Ho Chi Minh City, Vietnam, and Melbourne, Australia.
Louis Dreyfus
Louis Dreyfus operates extensive oilseed crushing and refining operations in South America, where it is the third largest oilseed processor. Through SACEIF Louis Dreyfus, its Argentine subsidiary, the company owns and operates the General Lagos crushing plant and port facility located on the Parana River in Argentina with deep-water access for large export-bound, ocean-going vessels. General Lagos, which has a crushing capacity of 12,000 MT/day, is one of the largest, most efficient crush plants in the world. Another subsidiary, Coimbra, owns and operates oilseed crushing facilities in Brazil with a combined crushing capacity of over 8,000 MT/day and a combined oil refining capacity of over 600 MT/day. While Louis Dreyfus is a minor player in the U.S crush industry, it does own and operate a crushing facility with an integrated biodiesel refinery located in Claypool, IN.
Louis Dreyfus owns and operates four export terminals in the U.S., one in Canada and one in Argentina. Export terminals in the U.S. are on the Gulf of Mexico (Beaumont and Houston, TX) and in the Pacific Northwest (Seattle, WA and Portland, OR). The export facility in Canada is located in Port Cartier, Quebec on the St. Lawrence Seaway, and the export facility in Argentina is in General Lagos. The Beaumont and Houston facilities, which handle corn, soybeans, sorghum and wheat, can store 8.9 million bushels of agricultural products. The export terminal in Seattle handles barley, corn, sorghum, soybeans and wheat and can handle 4.2 billion bushels a year. The facility in Portland handles wheat and barley and can store 1.4 million bushels. These facilities are primarily used for sales to Asia. The terminal located in Port Cartier, Quebec, handles canola, corn, soybeans and wheat and can store 285,000 MT. All of these offices are under the control of LDC-Grain Division and sell their products FOB to Louis Dreyfus destination offices or to third parties.
Louis Dreyfus Corporation-Grain Division is headquartered in Wilton, CT. It is responsible for all grains and oilseeds activity in the U.S., Canada, Australia and Mexico and is responsible for the overall trading group’s daily positions. This group is responsible for all origination in North America and Australia, as well as all soybean processing capacity in these regions. It is an origination office that sells products FOB to Louis Dreyfus’ destination offices and to third parties. The group is
■
also responsible for tracking all supply and demand trends in soybeans on a global basis.
Louis Dreyfus also has origination offices located in Argentina and Brazil. SACEIF Louis Dreyfus is one of the largest exporters of soybeans, soybean products and grains in Argentina. SACEIF owns and operates the General Lagos crushing plant and port facility on the Parana River and sells its soybeans, products and corn to Louis Dreyfus’ destination offices in Paris and Singapore. Coimbra is Louis Dreyfus’ wholly owned subsidiary in Brazil. It owns and operates five soybean crushing plants in Brazil and is located in Tiroria.
The company’s primary destination offices are Louis Dreyfus Negoce in Paris, France and Louis Dreyfus Asia located in Singapore. Louis Dreyfus Negoce controls both its own grain and oilseed operations as well as the group’s. Louis Dreyfus Negoce is the headquarters for Louis Dreyfus’ overall grain division, but the Louis Dreyfus grain division in Wilton, CT, handles monitoring of positions. This office buys its products CIF from major origination offices and supervises all sales of soybeans and soybean products and processing operations in Europe, the Mediterranean, the Middle East and South and East Africa.
Louis Dreyfus Asia is responsible for all trading operations and logistical support activities in Asia. The company buys its products CIF from major origination offices and sells them in Asia. Satellite offices that report to Singapore include Beijing, Shanghai and Guangzhou, China; Bangkok, Thailand; Djakarta, Indonesia; Delhi and Mumbai, India and Dhaka, Bangladesh. The company is expected to open an office in Manila, Philippines soon. The Asia office reports its positions each day to the group in Wilton, CT, which makes all risk management decisions for Louis Dreyfus.
How International Sales WorkThe export elevator’s role in the international marketplace is to sell its soybeans and products FOB to the international oilseed trading companies. FOB means that the buyer is selling the product to the seller after loading it onto a ship (dockside); the seller is responsible for the product after the sale. At the point of sale, the international trading company, buyer, is responsible for everything involved in moving the product from the buyer’s facility to the destination market. This includes testing the product at the facility, transportation costs, insurance for the product and the timeliness of delivery. The export elevator sells FOB to the international trading company because it does not have the capability to manage freight.
At the same time that the international trading company is buying products from the origination elevator, it is reaching out to customers in the international market who want to buy these products CIF to an international port. CIF means that the international trading company is responsible for all costs from the export elevator to the port of destination including transportation and insurance. The cost of the transportation
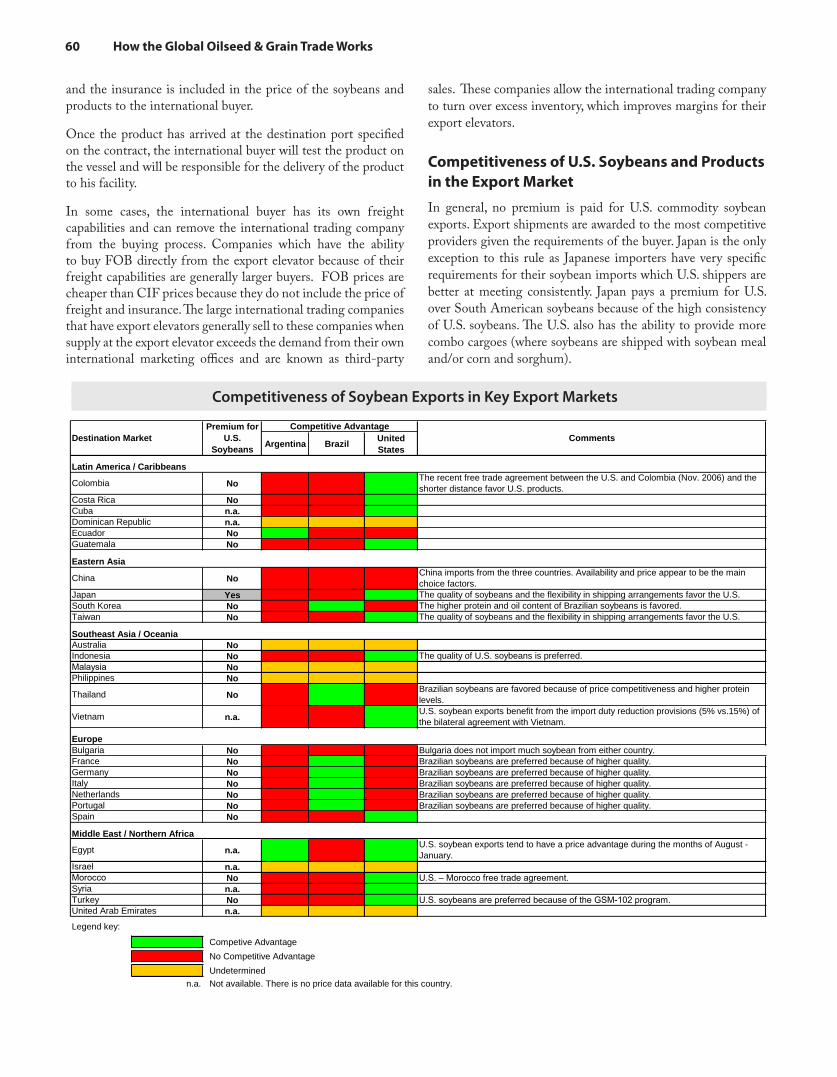
60 How the Global Oilseed & Grain Trade Works
and the insurance is included in the price of the soybeans and products to the international buyer.
Once the product has arrived at the destination port specified on the contract, the international buyer will test the product on the vessel and will be responsible for the delivery of the product to his facility.
In some cases, the international buyer has its own freight capabilities and can remove the international trading company from the buying process. Companies which have the ability to buy FOB directly from the export elevator because of their freight capabilities are generally larger buyers. FOB prices are cheaper than CIF prices because they do not include the price of freight and insurance. The large international trading companies that have export elevators generally sell to these companies when supply at the export elevator exceeds the demand from their own international marketing offices and are known as third-party
sales. These companies allow the international trading company to turn over excess inventory, which improves margins for their export elevators.
Competitiveness of U.S. Soybeans and Products in the Export Market
In general, no premium is paid for U.S. commodity soybean exports. Export shipments are awarded to the most competitive providers given the requirements of the buyer. Japan is the only exception to this rule as Japanese importers have very specific requirements for their soybean imports which U.S. shippers are better at meeting consistently. Japan pays a premium for U.S. over South American soybeans because of the high consistency of U.S. soybeans. The U.S. also has the ability to provide more combo cargoes (where soybeans are shipped with soybean meal and/or corn and sorghum).
Competitiveness of Soybean Exports in Key Export Markets
6
Competitiveness of Soybean Exports in Key Export Markets
Argentina Brazil United States
No The recent free trade agreement between the U.S. and Colombia (Nov. 2006) and the shorter distance favor U.S. products.
Non.a.n.a.NoNo
No China imports from the three countries. Availability and price appear to be the main choice factors.
Yes The quality of soybeans and the flexibility in shipping arrangements favor the U.S.No The higher protein and oil content of Brazilian soybeans is favored.No The quality of soybeans and the flexibility in shipping arrangements favor the U.S.
Southeast Asia / OceaniaNoNo The quality of U.S. soybeans is preferred.NoNo
No Brazilian soybeans are favored because of price competitiveness and higher protein levels.
n.a. U.S. soybean exports benefit from the import duty reduction provisions (5% vs.15%) of the bilateral agreement with Vietnam.
No Bulgaria does not import much soybean from either country.No Brazilian soybeans are preferred because of higher quality.No Brazilian soybeans are preferred because of higher quality.No Brazilian soybeans are preferred because of higher quality.No Brazilian soybeans are preferred because of higher quality.No Brazilian soybeans are preferred because of higher quality.No
Middle East / Northern Africa
n.a. U.S. soybean exports tend to have a price advantage during the months of August -January.
n.a.No U.S. – Morocco free trade agreement.n.a.No U.S. soybeans are preferred because of the GSM-102 program.n.a.
Legend key:
Competive Advantage No Competitive Advantage Undetermined
n.a. Not available. There is no price data available for this country.
Dominican Republic
Competitive AdvantageDestination Market Comments
Premium for U.S.
Soybeans
MoroccoSyriaTurkeyUnited Arab Emirates
Israel
Europe
Spain
Egypt
NetherlandsPortugal
Italy
FranceGermany
Taiwan
IndonesiaMalaysiaPhilippines
Thailand
Vietnam
Australia
Bulgaria
Latin America / Caribbeans
China
JapanSouth Korea
EcuadorGuatemala
Eastern Asia
Colombia
Costa RicaCuba
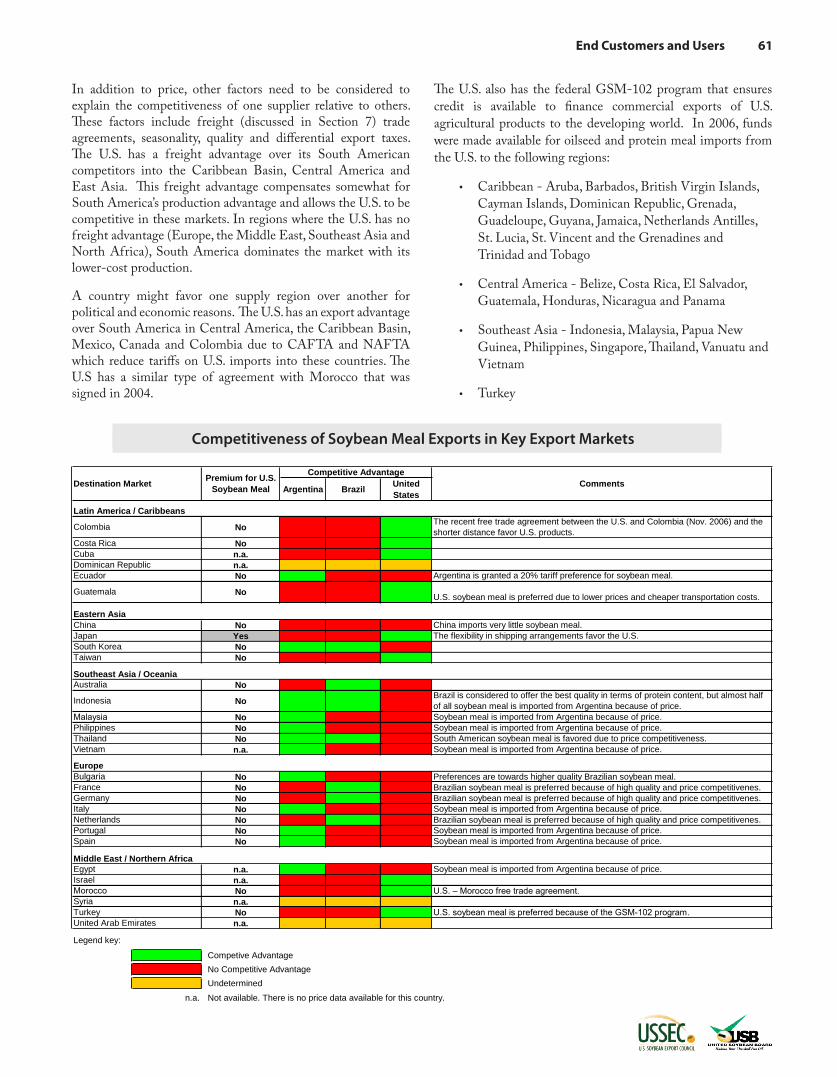
End Customers and Users 61
In addition to price, other factors need to be considered to explain the competitiveness of one supplier relative to others. These factors include freight (discussed in Section 7) trade agreements, seasonality, quality and differential export taxes. The U.S. has a freight advantage over its South American competitors into the Caribbean Basin, Central America and East Asia. This freight advantage compensates somewhat for South America’s production advantage and allows the U.S. to be competitive in these markets. In regions where the U.S. has no freight advantage (Europe, the Middle East, Southeast Asia and North Africa), South America dominates the market with its lower-cost production.
A country might favor one supply region over another for political and economic reasons. The U.S. has an export advantage over South America in Central America, the Caribbean Basin, Mexico, Canada and Colombia due to CAFTA and NAFTA which reduce tariffs on U.S. imports into these countries. The U.S has a similar type of agreement with Morocco that was signed in 2004.
The U.S. also has the federal GSM-102 program that ensures credit is available to finance commercial exports of U.S. agricultural products to the developing world. In 2006, funds were made available for oilseed and protein meal imports from the U.S. to the following regions:
Caribbean - Aruba, Barbados, British Virgin Islands, Cayman Islands, Dominican Republic, Grenada, Guadeloupe, Guyana, Jamaica, Netherlands Antilles, St. Lucia, St. Vincent and the Grenadines and Trinidad and Tobago
Central America - Belize, Costa Rica, El Salvador, Guatemala, Honduras, Nicaragua and Panama
Southeast Asia - Indonesia, Malaysia, Papua New Guinea, Philippines, Singapore, Thailand, Vanuatu and Vietnam
Turkey
•
•
•
•
Competitiveness of Soybean Meal Exports in Key Export Markets
7
Competitiveness of Soybean Meal Exports in Key Export Markets
Argentina Brazil United States
No The recent free trade agreement between the U.S. and Colombia (Nov. 2006) and the shorter distance favor U.S. products.
Non.a.n.a.No Argentina is granted a 20% tariff preference for soybean meal.
No U.S. soybean meal is preferred due to lower prices and cheaper transportation costs.
No China imports very little soybean meal.Yes The flexibility in shipping arrangements favor the U.S.NoNo
Southeast Asia / OceaniaNo
No Brazil is considered to offer the best quality in terms of protein content, but almost half of all soybean meal is imported from Argentina because of price.
No Soybean meal is imported from Argentina because of price.No Soybean meal is imported from Argentina because of price.No South American soybean meal is favored due to price competitiveness.n.a. Soybean meal is imported from Argentina because of price.
No Preferences are towards higher quality Brazilian soybean meal.No Brazilian soybean meal is preferred because of high quality and price competitivenes.No Brazilian soybean meal is preferred because of high quality and price competitivenes.No Soybean meal is imported from Argentina because of price.No Brazilian soybean meal is preferred because of high quality and price competitivenes.No Soybean meal is imported from Argentina because of price.No Soybean meal is imported from Argentina because of price.
Middle East / Northern African.a. Soybean meal is imported from Argentina because of price.n.a.No U.S. – Morocco free trade agreement.n.a.No U.S. soybean meal is preferred because of the GSM-102 program.n.a.
Legend key:
Competive Advantage No Competitive Advantage Undetermined
n.a. Not available. There is no price data available for this country.
Eastern AsiaChina
BulgariaFranceGermany
PhilippinesThailandVietnam
Dominican RepublicEcuador
Guatemala
Europe
Australia
Indonesia
Malaysia
JapanSouth KoreaTaiwan
Latin America / Caribbeans
Colombia
Costa RicaCuba
ItalyNetherlandsPortugalSpain
TurkeyUnited Arab Emirates
EgyptIsraelMoroccoSyria
Premium for U.S. Soybean MealDestination Market
Competitive AdvantageComments
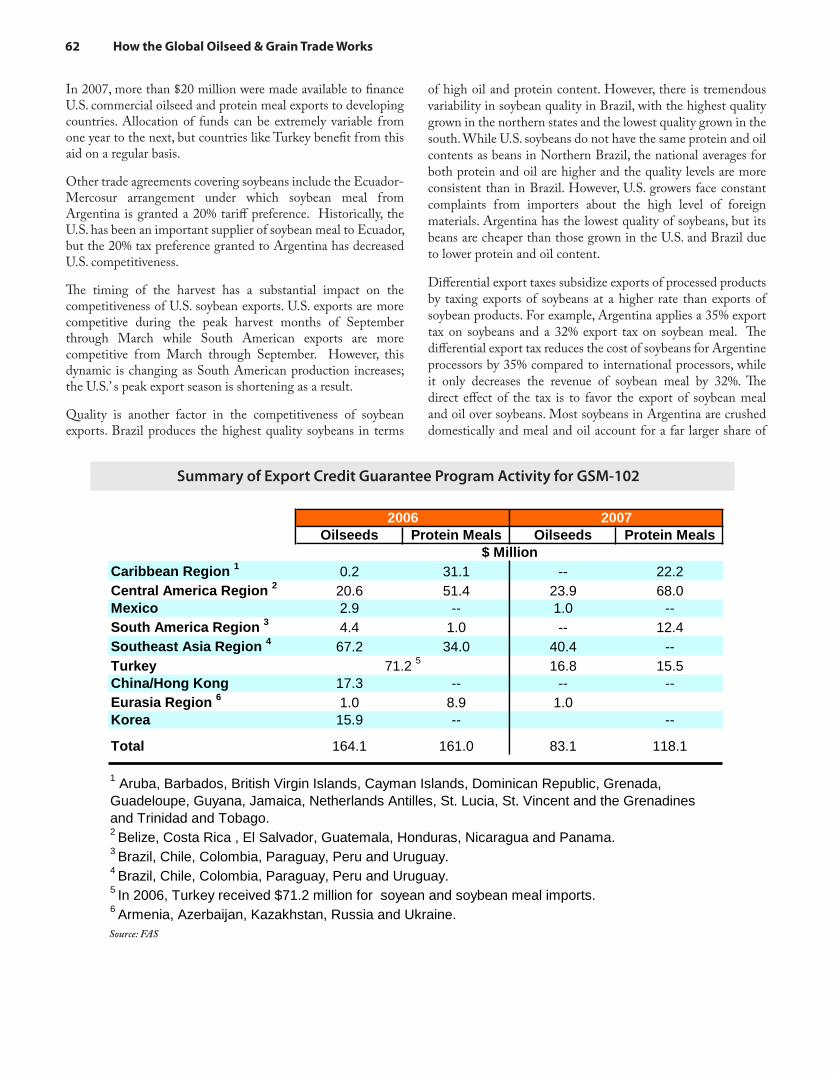
62 How the Global Oilseed & Grain Trade Works
In 2007, more than $20 million were made available to finance U.S. commercial oilseed and protein meal exports to developing countries. Allocation of funds can be extremely variable from one year to the next, but countries like Turkey benefit from this aid on a regular basis.
Other trade agreements covering soybeans include the Ecuador-Mercosur arrangement under which soybean meal from Argentina is granted a 20% tariff preference. Historically, the U.S. has been an important supplier of soybean meal to Ecuador, but the 20% tax preference granted to Argentina has decreased U.S. competitiveness.
The timing of the harvest has a substantial impact on the competitiveness of U.S. soybean exports. U.S. exports are more competitive during the peak harvest months of September through March while South American exports are more competitive from March through September. However, this dynamic is changing as South American production increases; the U.S.’ s peak export season is shortening as a result.
Quality is another factor in the competitiveness of soybean exports. Brazil produces the highest quality soybeans in terms
of high oil and protein content. However, there is tremendous variability in soybean quality in Brazil, with the highest quality grown in the northern states and the lowest quality grown in the south. While U.S. soybeans do not have the same protein and oil contents as beans in Northern Brazil, the national averages for both protein and oil are higher and the quality levels are more consistent than in Brazil. However, U.S. growers face constant complaints from importers about the high level of foreign materials. Argentina has the lowest quality of soybeans, but its beans are cheaper than those grown in the U.S. and Brazil due to lower protein and oil content.
Differential export taxes subsidize exports of processed products by taxing exports of soybeans at a higher rate than exports of soybean products. For example, Argentina applies a 35% export tax on soybeans and a 32% export tax on soybean meal. The differential export tax reduces the cost of soybeans for Argentine processors by 35% compared to international processors, while it only decreases the revenue of soybean meal by 32%. The direct effect of the tax is to favor the export of soybean meal and oil over soybeans. Most soybeans in Argentina are crushed domestically and meal and oil account for a far larger share of
38
Allocation of Funds for the GSM-102 Program
Oilseeds Protein Meals Oilseeds Protein Meals
Caribbean Region 1 0.2 31.1 -- 22.2Central America Region 2 20.6 51.4 23.9 68.0Mexico 2.9 -- 1.0 --South America Region 3 4.4 1.0 -- 12.4Southeast Asia Region 4 67.2 34.0 40.4 --Turkey 16.8 15.5China/Hong Kong 17.3 -- -- --Eurasia Region 6 1.0 8.9 1.0Korea 15.9 -- --
Total 164.1 161.0 83.1 118.1
Source: FAS
5 In 2006, Turkey received $71.2 million for soyean and soybean meal imports.6 Armenia, Azerbaijan, Kazakhstan, Russia and Ukraine.
Summary of Export Credit Guarantee Program Activity for GSM-102
1 Aruba, Barbados, British Virgin Islands, Cayman Islands, Dominican Republic, Grenada, Guadeloupe, Guyana, Jamaica, Netherlands Antilles, St. Lucia, St. Vincent and the Grenadines and Trinidad and Tobago.2 Belize, Costa Rica , El Salvador, Guatemala, Honduras, Nicaragua and Panama.3 Brazil, Chile, Colombia, Paraguay, Peru and Uruguay.4 Brazil, Chile, Colombia, Paraguay, Peru and Uruguay.
2006 2007
71.2 5
$ Million
In 2007, more than $20 million were made available to finance U.S. commercial oilseed and protein meal exports to developing countries.
Allocation of funds can be extremely variable from one year to the next but some countries like Turkey benefit from this help on a regular basis. For such countries, U.S. soybeans and soybean meal imports are very attractive.
Summary of Export Credit Guarantee Program Activity for GSM-102
Source: FAS
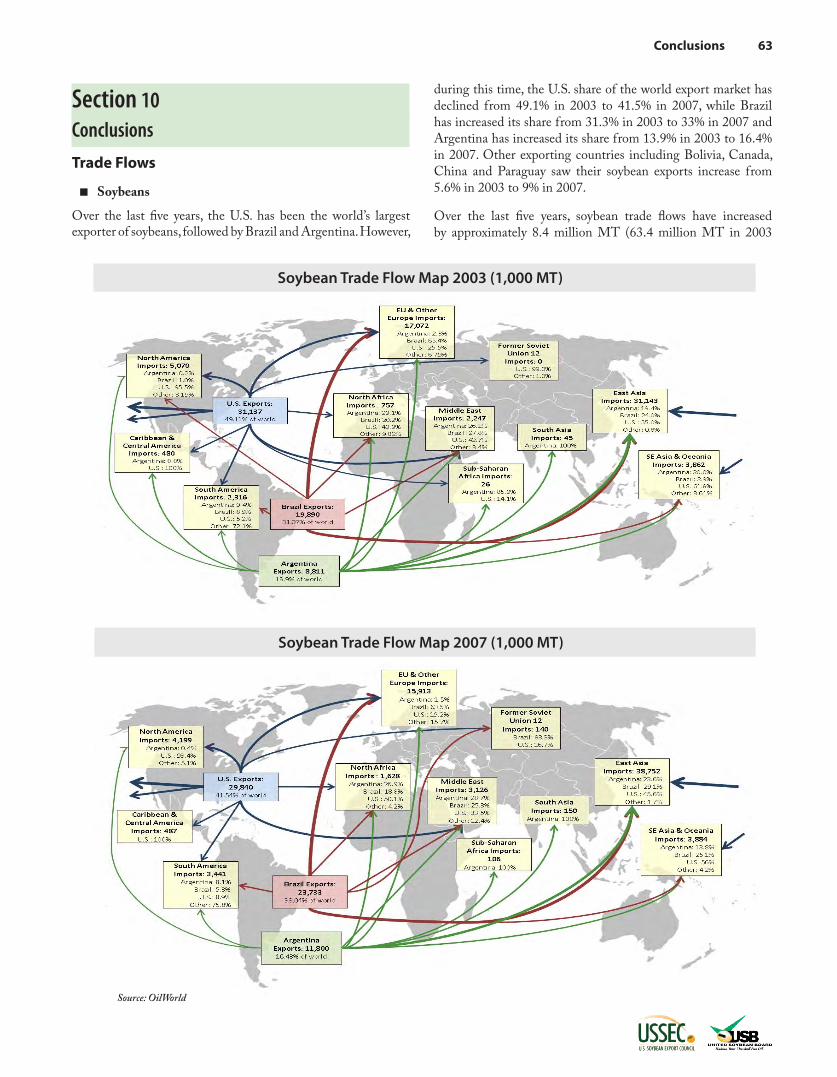
Conclusions 6�
Section 10 ConclusionsTrade Flows
Soybeans
Over the last five years, the U.S. has been the world’s largest exporter of soybeans, followed by Brazil and Argentina. However,
■
during this time, the U.S. share of the world export market has declined from 49.1% in 2003 to 41.5% in 2007, while Brazil has increased its share from 31.3% in 2003 to 33% in 2007 and Argentina has increased its share from 13.9% in 2003 to 16.4% in 2007. Other exporting countries including Bolivia, Canada, China and Paraguay saw their soybean exports increase from 5.6% in 2003 to 9% in 2007.
Over the last five years, soybean trade flows have increased by approximately 8.4 million MT (63.4 million MT in 2003
Soybean Trade Flow Map 2007 (1,000 MT)
Soybean Trade Flow Map 2003 (1,000 MT)
Source: OilWorld
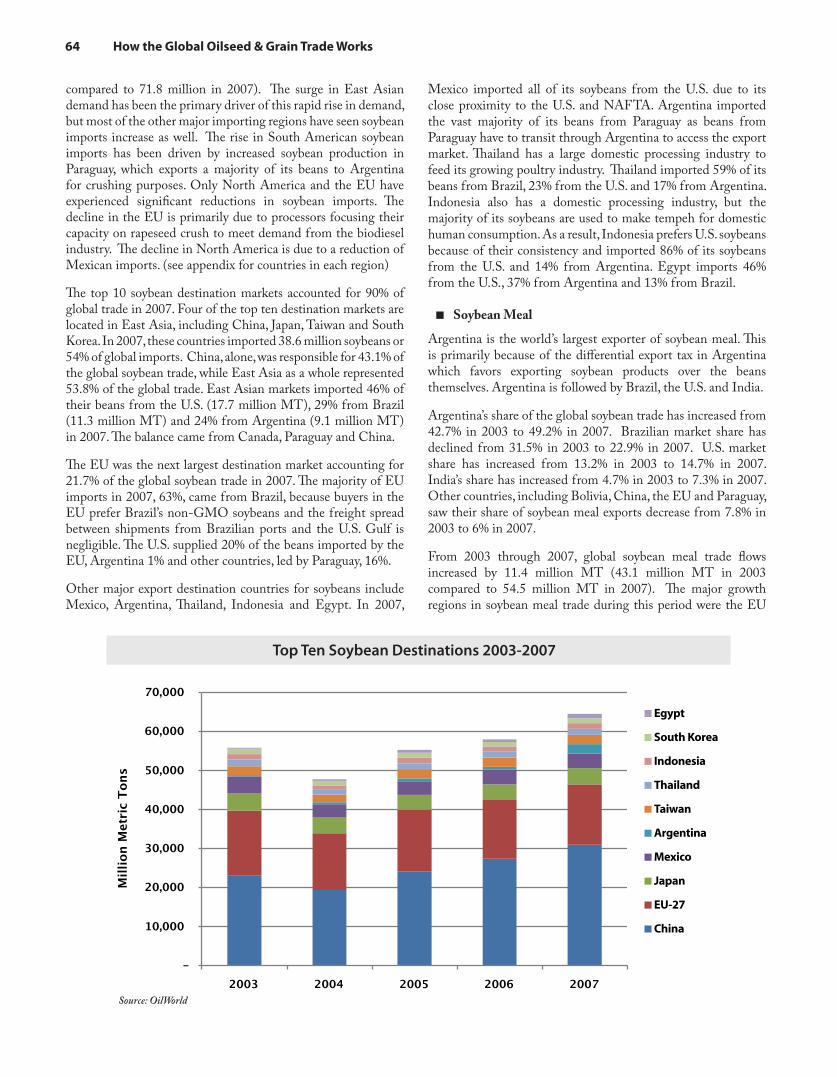
64 How the Global Oilseed & Grain Trade Works
compared to 71.8 million in 2007). The surge in East Asian demand has been the primary driver of this rapid rise in demand, but most of the other major importing regions have seen soybean imports increase as well. The rise in South American soybean imports has been driven by increased soybean production in Paraguay, which exports a majority of its beans to Argentina for crushing purposes. Only North America and the EU have experienced significant reductions in soybean imports. The decline in the EU is primarily due to processors focusing their capacity on rapeseed crush to meet demand from the biodiesel industry. The decline in North America is due to a reduction of Mexican imports. (see appendix for countries in each region)
The top 10 soybean destination markets accounted for 90% of global trade in 2007. Four of the top ten destination markets are located in East Asia, including China, Japan, Taiwan and South Korea. In 2007, these countries imported 38.6 million soybeans or 54% of global imports. China, alone, was responsible for 43.1% of the global soybean trade, while East Asia as a whole represented 53.8% of the global trade. East Asian markets imported 46% of their beans from the U.S. (17.7 million MT), 29% from Brazil (11.3 million MT) and 24% from Argentina (9.1 million MT) in 2007. The balance came from Canada, Paraguay and China.
The EU was the next largest destination market accounting for 21.7% of the global soybean trade in 2007. The majority of EU imports in 2007, 63%, came from Brazil, because buyers in the EU prefer Brazil’s non-GMO soybeans and the freight spread between shipments from Brazilian ports and the U.S. Gulf is negligible. The U.S. supplied 20% of the beans imported by the EU, Argentina 1% and other countries, led by Paraguay, 16%.
Other major export destination countries for soybeans include Mexico, Argentina, Thailand, Indonesia and Egypt. In 2007,
Mexico imported all of its soybeans from the U.S. due to its close proximity to the U.S. and NAFTA. Argentina imported the vast majority of its beans from Paraguay as beans from Paraguay have to transit through Argentina to access the export market. Thailand has a large domestic processing industry to feed its growing poultry industry. Thailand imported 59% of its beans from Brazil, 23% from the U.S. and 17% from Argentina. Indonesia also has a domestic processing industry, but the majority of its soybeans are used to make tempeh for domestic human consumption. As a result, Indonesia prefers U.S. soybeans because of their consistency and imported 86% of its soybeans from the U.S. and 14% from Argentina. Egypt imports 46% from the U.S., 37% from Argentina and 13% from Brazil.
Soybean Meal
Argentina is the world’s largest exporter of soybean meal. This is primarily because of the differential export tax in Argentina which favors exporting soybean products over the beans themselves. Argentina is followed by Brazil, the U.S. and India.
Argentina’s share of the global soybean trade has increased from 42.7% in 2003 to 49.2% in 2007. Brazilian market share has declined from 31.5% in 2003 to 22.9% in 2007. U.S. market share has increased from 13.2% in 2003 to 14.7% in 2007. India’s share has increased from 4.7% in 2003 to 7.3% in 2007. Other countries, including Bolivia, China, the EU and Paraguay, saw their share of soybean meal exports decrease from 7.8% in 2003 to 6% in 2007.
From 2003 through 2007, global soybean meal trade flows increased by 11.4 million MT (43.1 million MT in 2003 compared to 54.5 million MT in 2007). The major growth regions in soybean meal trade during this period were the EU
■
Source: OilWorld
-
10,000
20,000
30,000
40,000
50,000
60,000
70,000
2003 2004 2005 2006 2007
Million M
etr
ic T
ons
Egypt
South Korea
Indonesia
Thailand
Taiwan
Argentina
Mexico
Japan
EU-27
China
Top Ten Soybean Destinations 2003-2007
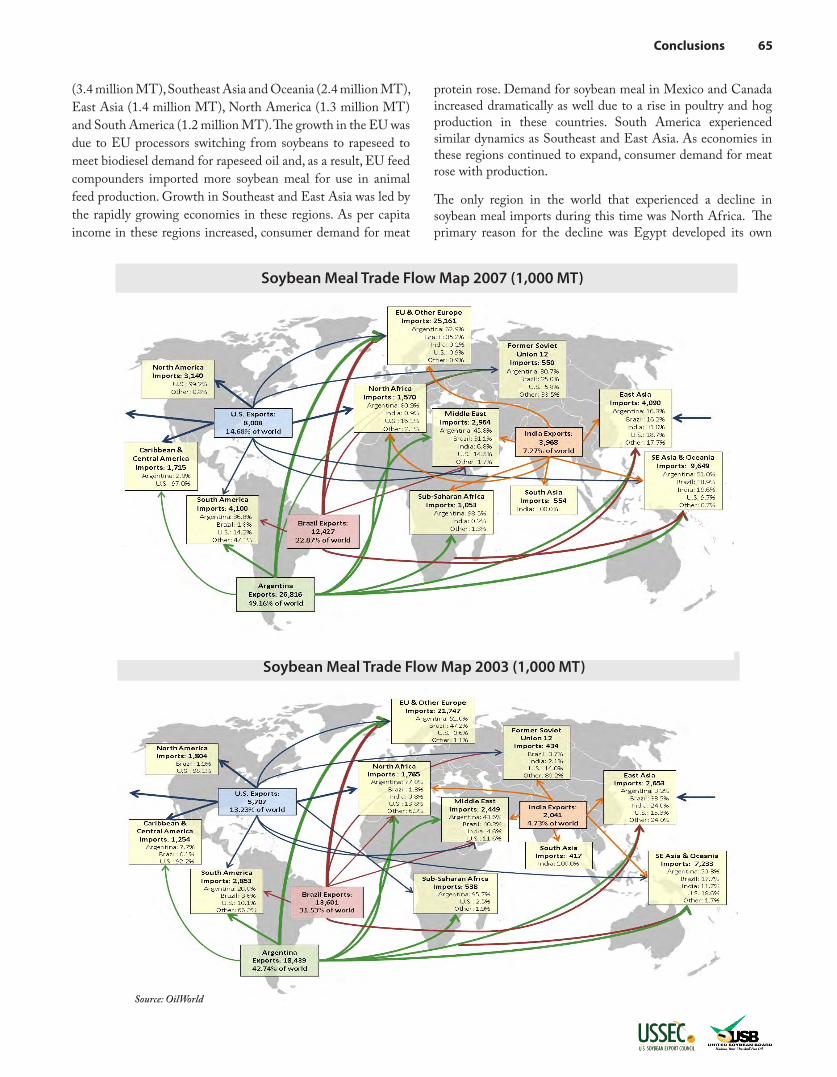
Conclusions 65
(3.4 million MT), Southeast Asia and Oceania (2.4 million MT), East Asia (1.4 million MT), North America (1.3 million MT) and South America (1.2 million MT). The growth in the EU was due to EU processors switching from soybeans to rapeseed to meet biodiesel demand for rapeseed oil and, as a result, EU feed compounders imported more soybean meal for use in animal feed production. Growth in Southeast and East Asia was led by the rapidly growing economies in these regions. As per capita income in these regions increased, consumer demand for meat
protein rose. Demand for soybean meal in Mexico and Canada increased dramatically as well due to a rise in poultry and hog production in these countries. South America experienced similar dynamics as Southeast and East Asia. As economies in these regions continued to expand, consumer demand for meat rose with production.
The only region in the world that experienced a decline in soybean meal imports during this time was North Africa. The primary reason for the decline was Egypt developed its own
Soybean Meal Trade Flow Map 2007 (1,000 MT)
Soybean Meal Trade Flow Map 2003 (1,000 MT)
Source: OilWorld
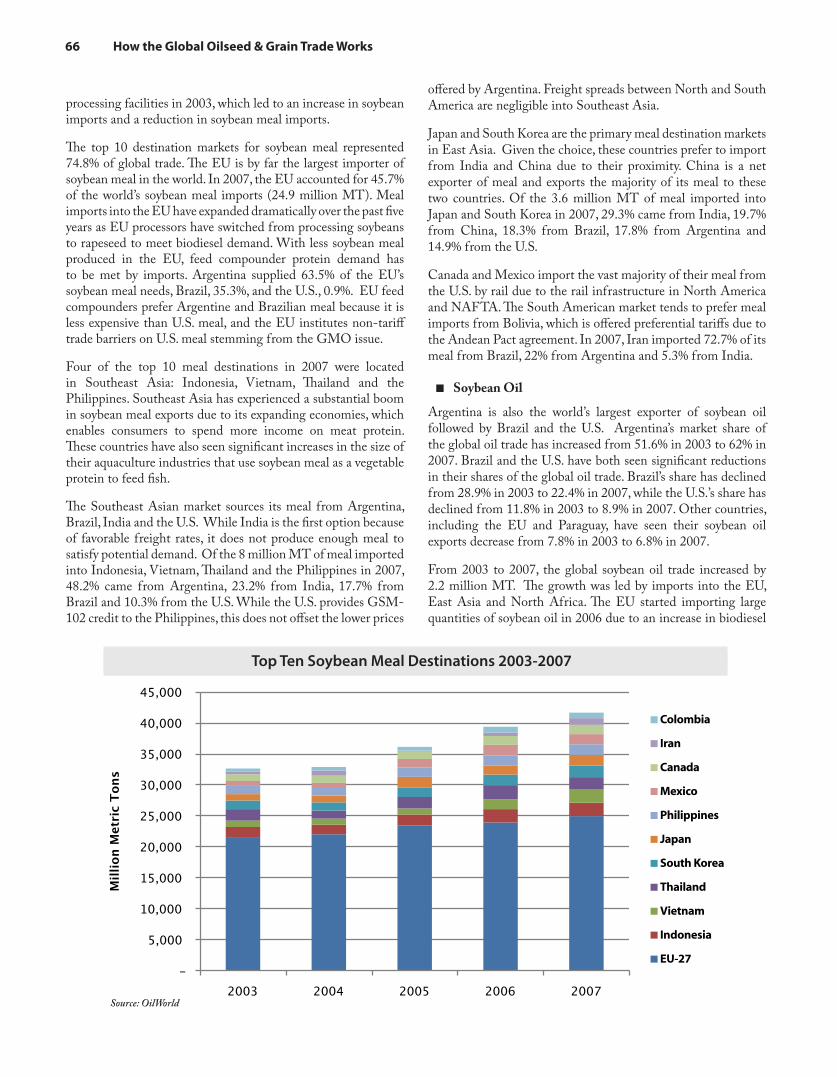
66 How the Global Oilseed & Grain Trade Works
offered by Argentina. Freight spreads between North and South America are negligible into Southeast Asia.
Japan and South Korea are the primary meal destination markets in East Asia. Given the choice, these countries prefer to import from India and China due to their proximity. China is a net exporter of meal and exports the majority of its meal to these two countries. Of the 3.6 million MT of meal imported into Japan and South Korea in 2007, 29.3% came from India, 19.7% from China, 18.3% from Brazil, 17.8% from Argentina and 14.9% from the U.S.
Canada and Mexico import the vast majority of their meal from the U.S. by rail due to the rail infrastructure in North America and NAFTA. The South American market tends to prefer meal imports from Bolivia, which is offered preferential tariffs due to the Andean Pact agreement. In 2007, Iran imported 72.7% of its meal from Brazil, 22% from Argentina and 5.3% from India.
Soybean Oil
Argentina is also the world’s largest exporter of soybean oil followed by Brazil and the U.S. Argentina’s market share of the global oil trade has increased from 51.6% in 2003 to 62% in 2007. Brazil and the U.S. have both seen significant reductions in their shares of the global oil trade. Brazil’s share has declined from 28.9% in 2003 to 22.4% in 2007, while the U.S.’s share has declined from 11.8% in 2003 to 8.9% in 2007. Other countries, including the EU and Paraguay, have seen their soybean oil exports decrease from 7.8% in 2003 to 6.8% in 2007.
From 2003 to 2007, the global soybean oil trade increased by 2.2 million MT. The growth was led by imports into the EU, East Asia and North Africa. The EU started importing large quantities of soybean oil in 2006 due to an increase in biodiesel
■
processing facilities in 2003, which led to an increase in soybean imports and a reduction in soybean meal imports.
The top 10 destination markets for soybean meal represented 74.8% of global trade. The EU is by far the largest importer of soybean meal in the world. In 2007, the EU accounted for 45.7% of the world’s soybean meal imports (24.9 million MT). Meal imports into the EU have expanded dramatically over the past five years as EU processors have switched from processing soybeans to rapeseed to meet biodiesel demand. With less soybean meal produced in the EU, feed compounder protein demand has to be met by imports. Argentina supplied 63.5% of the EU’s soybean meal needs, Brazil, 35.3%, and the U.S., 0.9%. EU feed compounders prefer Argentine and Brazilian meal because it is less expensive than U.S. meal, and the EU institutes non-tariff trade barriers on U.S. meal stemming from the GMO issue.
Four of the top 10 meal destinations in 2007 were located in Southeast Asia: Indonesia, Vietnam, Thailand and the Philippines. Southeast Asia has experienced a substantial boom in soybean meal exports due to its expanding economies, which enables consumers to spend more income on meat protein. These countries have also seen significant increases in the size of their aquaculture industries that use soybean meal as a vegetable protein to feed fish.
The Southeast Asian market sources its meal from Argentina, Brazil, India and the U.S. While India is the first option because of favorable freight rates, it does not produce enough meal to satisfy potential demand. Of the 8 million MT of meal imported into Indonesia, Vietnam, Thailand and the Philippines in 2007, 48.2% came from Argentina, 23.2% from India, 17.7% from Brazil and 10.3% from the U.S. While the U.S. provides GSM-102 credit to the Philippines, this does not offset the lower prices
Source: OilWorld
-
5,000
10,000
15,000
20,000
25,000
30,000
35,000
40,000
45,000
2003 2004 2005 2006 2007
Million M
etric
Tons
Colombia
Iran
Canada
Mexico
Philippines
Japan
South Korea
Thailand
Vietnam
Indonesia
EU-27
Top Ten Soybean Meal Destinations 2003-2007

Conclusions 67
production which reduced supply of rapeseed oil for both food consumption and biodiesel production. EU processors switched from crushing soybeans to rapeseed, and the EU had to import more soybean oil to offset the reduction in domestic production. East Asian demand was driven by the growing economy in China. As per capita incomes rose throughout the period, the Chinese population had more disposable income to spend on cooking oils. The increased demand for soybean oil in North Africa was
a result of the sharp increase in the price of sunflower oil from Russia and Ukraine, which competes directly with soybean oil in this region. North African buyers bought more soybean oil as the spread between the price of sunflower oil from Russia and Ukraine and soybean oil continued to widen.
The top 10 export destinations for oil accounted for 72.9% of global exports in 2007. China, India and Bangladesh represented 43.3% of these exports. These countries have processing industries,
Soybean Oil Trade Flow Map 2007 (1,000 MT)
Soybean Oil Trade Flow Map 2003 (1,000 MT)
Source: OilWorld
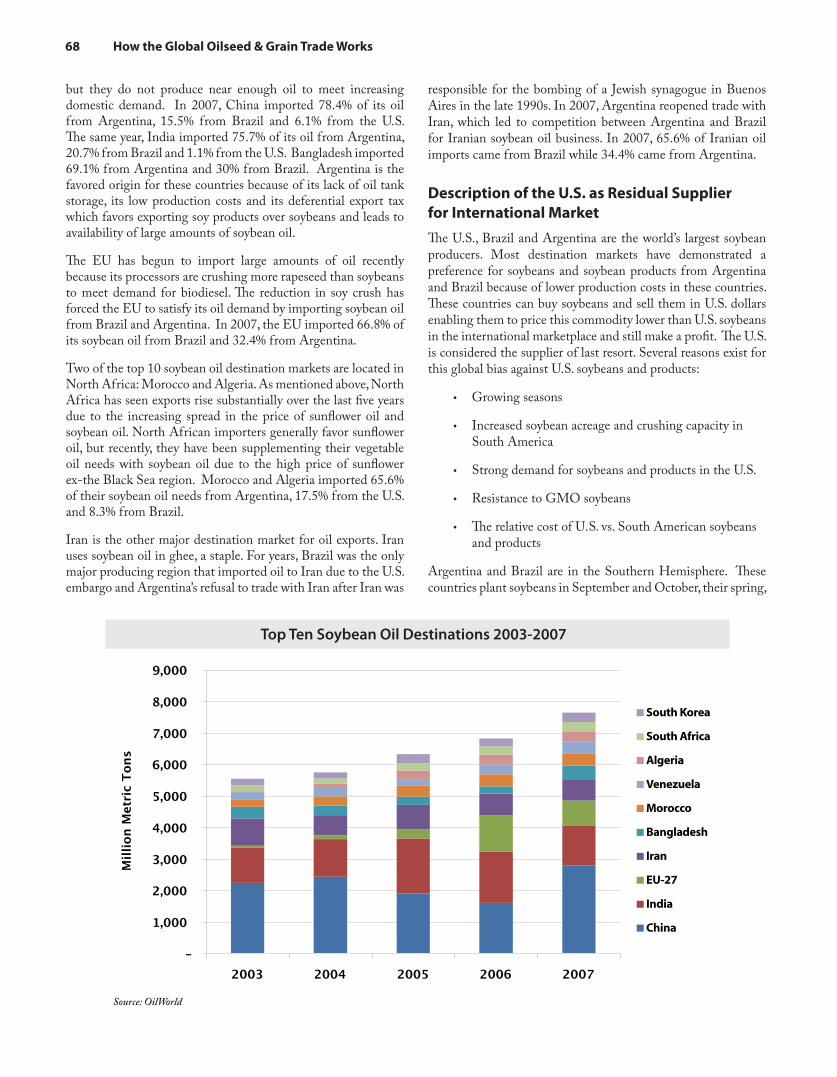
68 How the Global Oilseed & Grain Trade Works
but they do not produce near enough oil to meet increasing domestic demand. In 2007, China imported 78.4% of its oil from Argentina, 15.5% from Brazil and 6.1% from the U.S. The same year, India imported 75.7% of its oil from Argentina, 20.7% from Brazil and 1.1% from the U.S. Bangladesh imported 69.1% from Argentina and 30% from Brazil. Argentina is the favored origin for these countries because of its lack of oil tank storage, its low production costs and its deferential export tax which favors exporting soy products over soybeans and leads to availability of large amounts of soybean oil.
The EU has begun to import large amounts of oil recently because its processors are crushing more rapeseed than soybeans to meet demand for biodiesel. The reduction in soy crush has forced the EU to satisfy its oil demand by importing soybean oil from Brazil and Argentina. In 2007, the EU imported 66.8% of its soybean oil from Brazil and 32.4% from Argentina.
Two of the top 10 soybean oil destination markets are located in North Africa: Morocco and Algeria. As mentioned above, North Africa has seen exports rise substantially over the last five years due to the increasing spread in the price of sunflower oil and soybean oil. North African importers generally favor sunflower oil, but recently, they have been supplementing their vegetable oil needs with soybean oil due to the high price of sunflower ex-the Black Sea region. Morocco and Algeria imported 65.6% of their soybean oil needs from Argentina, 17.5% from the U.S. and 8.3% from Brazil.
Iran is the other major destination market for oil exports. Iran uses soybean oil in ghee, a staple. For years, Brazil was the only major producing region that imported oil to Iran due to the U.S. embargo and Argentina’s refusal to trade with Iran after Iran was
responsible for the bombing of a Jewish synagogue in Buenos Aires in the late 1990s. In 2007, Argentina reopened trade with Iran, which led to competition between Argentina and Brazil for Iranian soybean oil business. In 2007, 65.6% of Iranian oil imports came from Brazil while 34.4% came from Argentina.
Description of the U.S. as Residual Supplier for International MarketThe U.S., Brazil and Argentina are the world’s largest soybean producers. Most destination markets have demonstrated a preference for soybeans and soybean products from Argentina and Brazil because of lower production costs in these countries. These countries can buy soybeans and sell them in U.S. dollars enabling them to price this commodity lower than U.S. soybeans in the international marketplace and still make a profit. The U.S. is considered the supplier of last resort. Several reasons exist for this global bias against U.S. soybeans and products:
Growing seasons
Increased soybean acreage and crushing capacity in South America
Strong demand for soybeans and products in the U.S.
Resistance to GMO soybeans
The relative cost of U.S. vs. South American soybeans and products
Argentina and Brazil are in the Southern Hemisphere. These countries plant soybeans in September and October, their spring,
•
•
•
•
•
Source: OilWorld
-
1,000
2,000
3,000
4,000
5,000
6,000
7,000
8,000
9,000
2003 2004 2005 2006 2007
Million M
etr
ic T
ons
South Korea
South Africa
Algeria
Venezuela
Morocco
Bangladesh
Iran
EU-27
India
China
Top Ten Soybean Oil Destinations 2003-2007
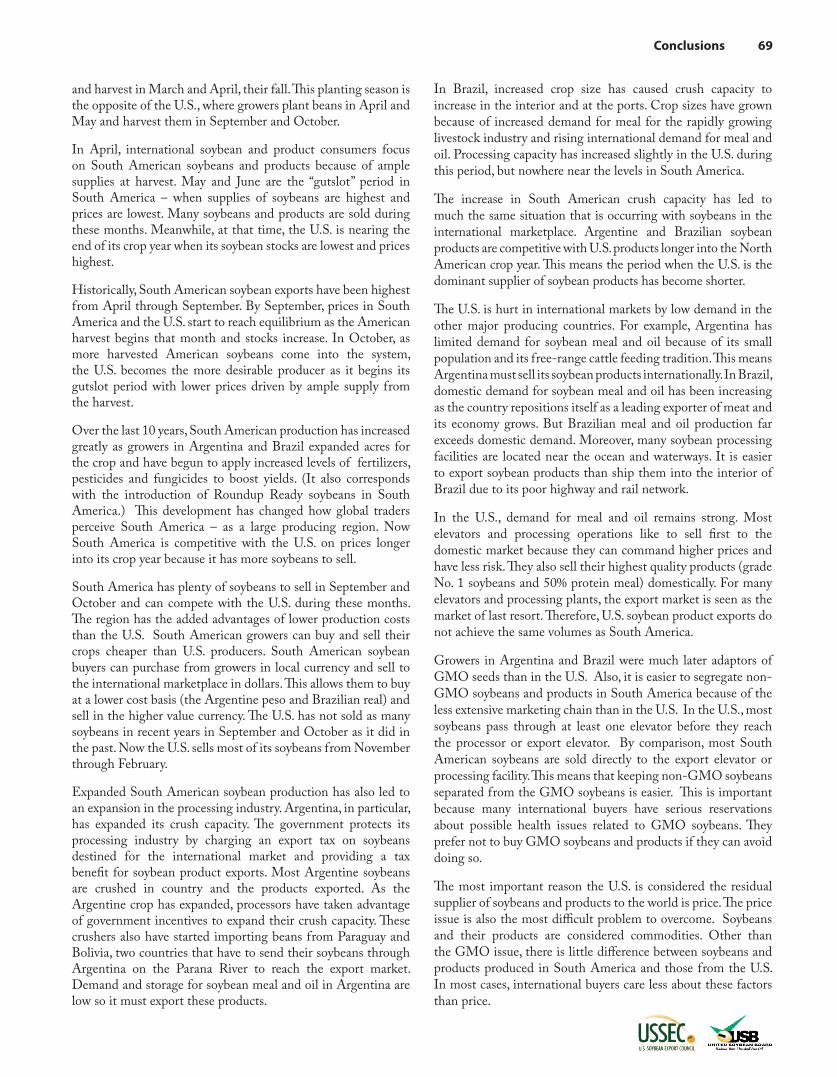
Conclusions 69
and harvest in March and April, their fall. This planting season is the opposite of the U.S., where growers plant beans in April and May and harvest them in September and October.
In April, international soybean and product consumers focus on South American soybeans and products because of ample supplies at harvest. May and June are the “gutslot” period in South America – when supplies of soybeans are highest and prices are lowest. Many soybeans and products are sold during these months. Meanwhile, at that time, the U.S. is nearing the end of its crop year when its soybean stocks are lowest and prices highest.
Historically, South American soybean exports have been highest from April through September. By September, prices in South America and the U.S. start to reach equilibrium as the American harvest begins that month and stocks increase. In October, as more harvested American soybeans come into the system, the U.S. becomes the more desirable producer as it begins its gutslot period with lower prices driven by ample supply from the harvest.
Over the last 10 years, South American production has increased greatly as growers in Argentina and Brazil expanded acres for the crop and have begun to apply increased levels of fertilizers, pesticides and fungicides to boost yields. (It also corresponds with the introduction of Roundup Ready soybeans in South America.) This development has changed how global traders perceive South America – as a large producing region. Now South America is competitive with the U.S. on prices longer into its crop year because it has more soybeans to sell.
South America has plenty of soybeans to sell in September and October and can compete with the U.S. during these months. The region has the added advantages of lower production costs than the U.S. South American growers can buy and sell their crops cheaper than U.S. producers. South American soybean buyers can purchase from growers in local currency and sell to the international marketplace in dollars. This allows them to buy at a lower cost basis (the Argentine peso and Brazilian real) and sell in the higher value currency. The U.S. has not sold as many soybeans in recent years in September and October as it did in the past. Now the U.S. sells most of its soybeans from November through February.
Expanded South American soybean production has also led to an expansion in the processing industry. Argentina, in particular, has expanded its crush capacity. The government protects its processing industry by charging an export tax on soybeans destined for the international market and providing a tax benefit for soybean product exports. Most Argentine soybeans are crushed in country and the products exported. As the Argentine crop has expanded, processors have taken advantage of government incentives to expand their crush capacity. These crushers also have started importing beans from Paraguay and Bolivia, two countries that have to send their soybeans through Argentina on the Parana River to reach the export market. Demand and storage for soybean meal and oil in Argentina are low so it must export these products.
In Brazil, increased crop size has caused crush capacity to increase in the interior and at the ports. Crop sizes have grown because of increased demand for meal for the rapidly growing livestock industry and rising international demand for meal and oil. Processing capacity has increased slightly in the U.S. during this period, but nowhere near the levels in South America.
The increase in South American crush capacity has led to much the same situation that is occurring with soybeans in the international marketplace. Argentine and Brazilian soybean products are competitive with U.S. products longer into the North American crop year. This means the period when the U.S. is the dominant supplier of soybean products has become shorter.
The U.S. is hurt in international markets by low demand in the other major producing countries. For example, Argentina has limited demand for soybean meal and oil because of its small population and its free-range cattle feeding tradition. This means Argentina must sell its soybean products internationally. In Brazil, domestic demand for soybean meal and oil has been increasing as the country repositions itself as a leading exporter of meat and its economy grows. But Brazilian meal and oil production far exceeds domestic demand. Moreover, many soybean processing facilities are located near the ocean and waterways. It is easier to export soybean products than ship them into the interior of Brazil due to its poor highway and rail network.
In the U.S., demand for meal and oil remains strong. Most elevators and processing operations like to sell first to the domestic market because they can command higher prices and have less risk. They also sell their highest quality products (grade No. 1 soybeans and 50% protein meal) domestically. For many elevators and processing plants, the export market is seen as the market of last resort. Therefore, U.S. soybean product exports do not achieve the same volumes as South America.
Growers in Argentina and Brazil were much later adaptors of GMO seeds than in the U.S. Also, it is easier to segregate non-GMO soybeans and products in South America because of the less extensive marketing chain than in the U.S. In the U.S., most soybeans pass through at least one elevator before they reach the processor or export elevator. By comparison, most South American soybeans are sold directly to the export elevator or processing facility. This means that keeping non-GMO soybeans separated from the GMO soybeans is easier. This is important because many international buyers have serious reservations about possible health issues related to GMO soybeans. They prefer not to buy GMO soybeans and products if they can avoid doing so.
The most important reason the U.S. is considered the residual supplier of soybeans and products to the world is price. The price issue is also the most difficult problem to overcome. Soybeans and their products are considered commodities. Other than the GMO issue, there is little difference between soybeans and products produced in South America and those from the U.S. In most cases, international buyers care less about these factors than price.
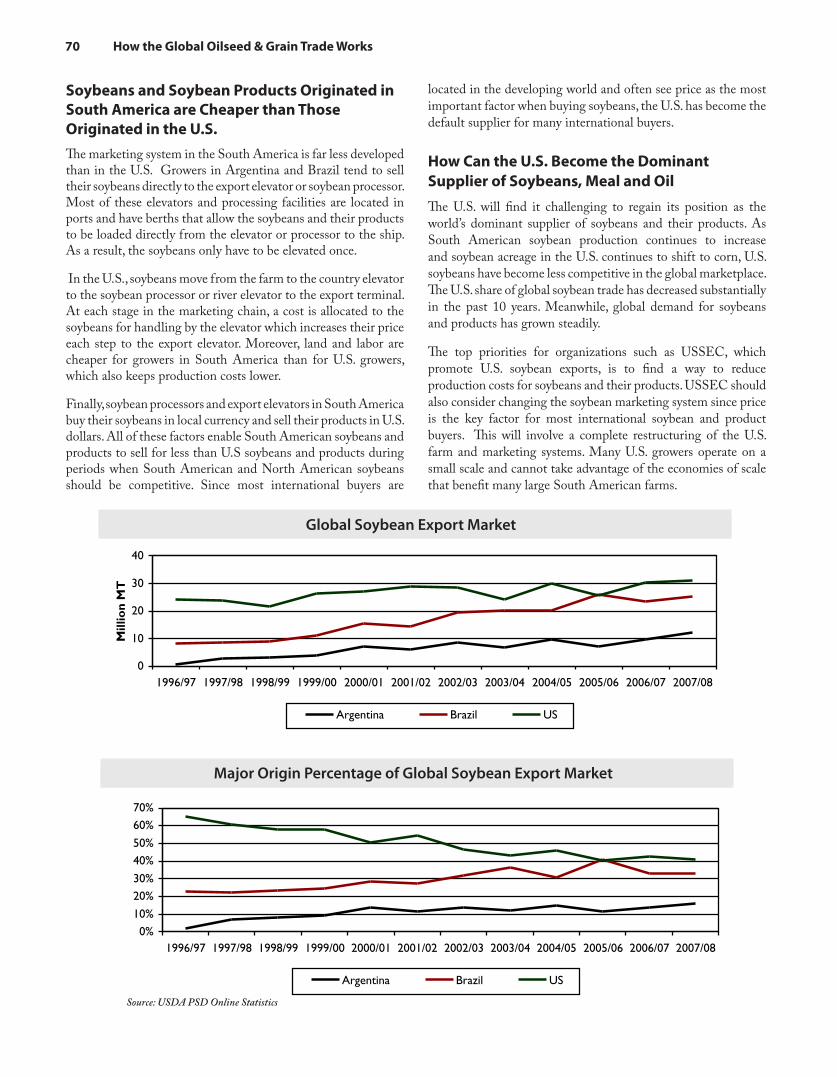
70 How the Global Oilseed & Grain Trade Works
Soybeans and Soybean Products Originated in South America are Cheaper than Those Originated in the U.S. The marketing system in the South America is far less developed than in the U.S. Growers in Argentina and Brazil tend to sell their soybeans directly to the export elevator or soybean processor. Most of these elevators and processing facilities are located in ports and have berths that allow the soybeans and their products to be loaded directly from the elevator or processor to the ship. As a result, the soybeans only have to be elevated once.
In the U.S., soybeans move from the farm to the country elevator to the soybean processor or river elevator to the export terminal. At each stage in the marketing chain, a cost is allocated to the soybeans for handling by the elevator which increases their price each step to the export elevator. Moreover, land and labor are cheaper for growers in South America than for U.S. growers, which also keeps production costs lower.
Finally, soybean processors and export elevators in South America buy their soybeans in local currency and sell their products in U.S. dollars. All of these factors enable South American soybeans and products to sell for less than U.S soybeans and products during periods when South American and North American soybeans should be competitive. Since most international buyers are
located in the developing world and often see price as the most important factor when buying soybeans, the U.S. has become the default supplier for many international buyers.
How Can the U.S. Become the Dominant Supplier of Soybeans, Meal and OilThe U.S. will find it challenging to regain its position as the world’s dominant supplier of soybeans and their products. As South American soybean production continues to increase and soybean acreage in the U.S. continues to shift to corn, U.S. soybeans have become less competitive in the global marketplace. The U.S. share of global soybean trade has decreased substantially in the past 10 years. Meanwhile, global demand for soybeans and products has grown steadily.
The top priorities for organizations such as USSEC, which promote U.S. soybean exports, is to find a way to reduce production costs for soybeans and their products. USSEC should also consider changing the soybean marketing system since price is the key factor for most international soybean and product buyers. This will involve a complete restructuring of the U.S. farm and marketing systems. Many U.S. growers operate on a small scale and cannot take advantage of the economies of scale that benefit many large South American farms.
0
10
20
30
40
1996/97 1997/98 1998/99 1999/00 2000/01 2001/02 2002/03 2003/04 2004/05 2005/06 2006/07 2007/08
Mill
ion
MT
Argentina Brazil US
Global Soybean Export Market
0%
10%
20%
30%
40%
50%
60%
70%
1996/97 1997/98 1998/99 1999/00 2000/01 2001/02 2002/03 2003/04 2004/05 2005/06 2006/07 2007/08
Argentina Brazil US
Major Origin Percentage of Global Soybean Export Market
Source: USDA PSD Online Statistics
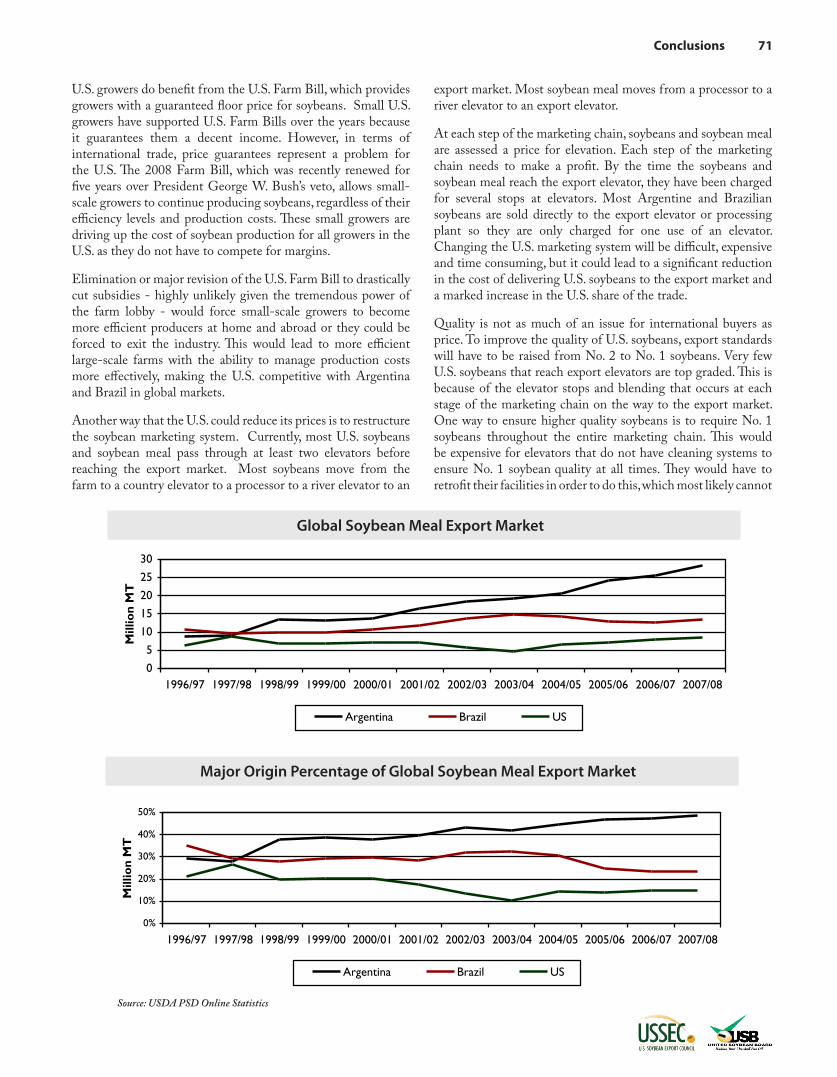
Conclusions 71
U.S. growers do benefit from the U.S. Farm Bill, which provides growers with a guaranteed floor price for soybeans. Small U.S. growers have supported U.S. Farm Bills over the years because it guarantees them a decent income. However, in terms of international trade, price guarantees represent a problem for the U.S. The 2008 Farm Bill, which was recently renewed for five years over President George W. Bush’s veto, allows small-scale growers to continue producing soybeans, regardless of their efficiency levels and production costs. These small growers are driving up the cost of soybean production for all growers in the U.S. as they do not have to compete for margins.
Elimination or major revision of the U.S. Farm Bill to drastically cut subsidies - highly unlikely given the tremendous power of the farm lobby - would force small-scale growers to become more efficient producers at home and abroad or they could be forced to exit the industry. This would lead to more efficient large-scale farms with the ability to manage production costs more effectively, making the U.S. competitive with Argentina and Brazil in global markets.
Another way that the U.S. could reduce its prices is to restructure the soybean marketing system. Currently, most U.S. soybeans and soybean meal pass through at least two elevators before reaching the export market. Most soybeans move from the farm to a country elevator to a processor to a river elevator to an
export market. Most soybean meal moves from a processor to a river elevator to an export elevator.
At each step of the marketing chain, soybeans and soybean meal are assessed a price for elevation. Each step of the marketing chain needs to make a profit. By the time the soybeans and soybean meal reach the export elevator, they have been charged for several stops at elevators. Most Argentine and Brazilian soybeans are sold directly to the export elevator or processing plant so they are only charged for one use of an elevator. Changing the U.S. marketing system will be difficult, expensive and time consuming, but it could lead to a significant reduction in the cost of delivering U.S. soybeans to the export market and a marked increase in the U.S. share of the trade.
Quality is not as much of an issue for international buyers as price. To improve the quality of U.S. soybeans, export standards will have to be raised from No. 2 to No. 1 soybeans. Very few U.S. soybeans that reach export elevators are top graded. This is because of the elevator stops and blending that occurs at each stage of the marketing chain on the way to the export market. One way to ensure higher quality soybeans is to require No. 1 soybeans throughout the entire marketing chain. This would be expensive for elevators that do not have cleaning systems to ensure No. 1 soybean quality at all times. They would have to retrofit their facilities in order to do this, which most likely cannot
0
5
10
15
20
25
30
1996/97 1997/98 1998/99 1999/00 2000/01 2001/02 2002/03 2003/04 2004/05 2005/06 2006/07 2007/08
Mill
ion
MT
Argentina Brazil US
Global Soybean Meal Export Market
0%
10%
20%
30%
40%
50%
1996/97 1997/98 1998/99 1999/00 2000/01 2001/02 2002/03 2003/04 2004/05 2005/06 2006/07 2007/08
Mill
ion
MT
Argentina Brazil US
Major Origin Percentage of Global Soybean Meal Export Market
Source: USDA PSD Online Statistics
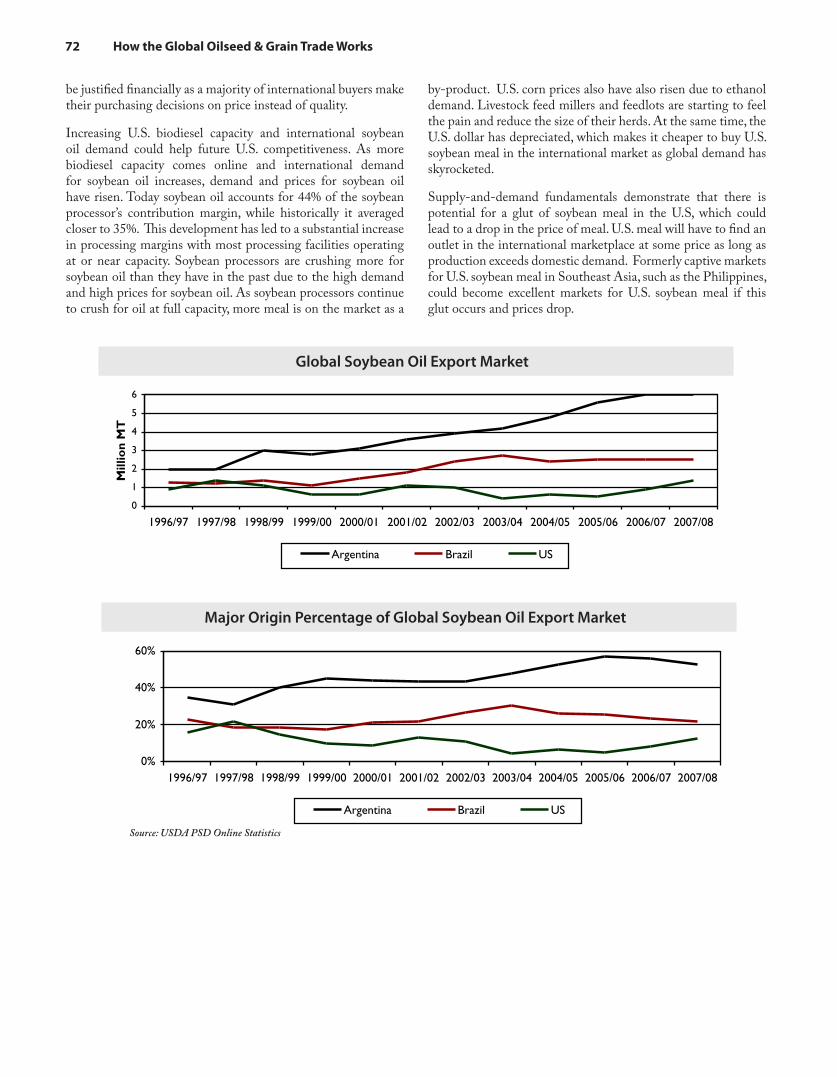
72 How the Global Oilseed & Grain Trade Works
be justified financially as a majority of international buyers make their purchasing decisions on price instead of quality.
Increasing U.S. biodiesel capacity and international soybean oil demand could help future U.S. competitiveness. As more biodiesel capacity comes online and international demand for soybean oil increases, demand and prices for soybean oil have risen. Today soybean oil accounts for 44% of the soybean processor’s contribution margin, while historically it averaged closer to 35%. This development has led to a substantial increase in processing margins with most processing facilities operating at or near capacity. Soybean processors are crushing more for soybean oil than they have in the past due to the high demand and high prices for soybean oil. As soybean processors continue to crush for oil at full capacity, more meal is on the market as a
by-product. U.S. corn prices also have also risen due to ethanol demand. Livestock feed millers and feedlots are starting to feel the pain and reduce the size of their herds. At the same time, the U.S. dollar has depreciated, which makes it cheaper to buy U.S. soybean meal in the international market as global demand has skyrocketed.
Supply-and-demand fundamentals demonstrate that there is potential for a glut of soybean meal in the U.S, which could lead to a drop in the price of meal. U.S. meal will have to find an outlet in the international marketplace at some price as long as production exceeds domestic demand. Formerly captive markets for U.S. soybean meal in Southeast Asia, such as the Philippines, could become excellent markets for U.S. soybean meal if this glut occurs and prices drop.
0
1
2
3
4
5
6
1996/97 1997/98 1998/99 1999/00 2000/01 2001/02 2002/03 2003/04 2004/05 2005/06 2006/07 2007/08
Mill
ion
MT
Argentina Brazil US
Global Soybean Oil Export Market
0%
20%
40%
60%
1996/97 1997/98 1998/99 1999/00 2000/01 2001/02 2002/03 2003/04 2004/05 2005/06 2006/07 2007/08
Argentina Brazil US
Major Origin Percentage of Global Soybean Oil Export Market
Source: USDA PSD Online Statistics
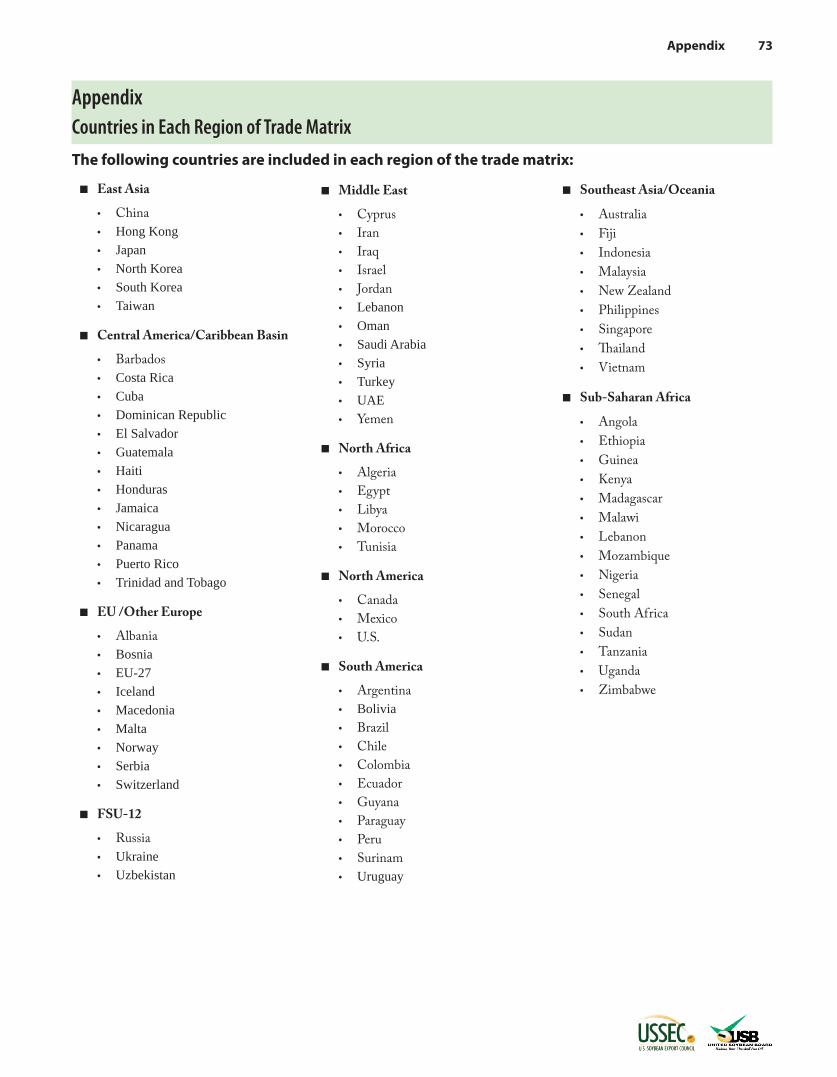
Appendix 7�
East Asia
China Hong Kong Japan North Korea South KoreaTaiwan
Central America/Caribbean Basin
Barbados Costa Rica Cuba Dominican Republic El SalvadorGuatemala Haiti Honduras Jamaica Nicaragua Panama Puerto Rico Trinidad and Tobago
EU /Other Europe
AlbaniaBosniaEU-27Iceland MacedoniaMaltaNorwaySerbiaSwitzerland
FSU-12
RussiaUkraineUzbekistan
■
••••••
■
•••••••••••••
■
•••••••••
■
•••
Appendix Countries in Each Region of Trade MatrixThe following countries are included in each region of the trade matrix:
Middle East
Cyprus IranIraqIsrael Jordan LebanonOmanSaudi ArabiaSyriaTurkey UAEYemen
North Africa
Algeria EgyptLibyaMoroccoTunisia
North America
CanadaMexicoU.S.
South America
ArgentinaBoliviaBrazilChileColombiaEcuadorGuyanaParaguayPeruSurinamUruguay
■
••••••••••••
■
•••••
■
•••
■
•••••••••••
Southeast Asia/Oceania
AustraliaFijiIndonesiaMalaysiaNew ZealandPhilippinesSingaporeThailandVietnam
Sub-Saharan Africa
AngolaEthiopiaGuineaKenyaMadagascarMalawiLebanon MozambiqueNigeriaSenegalSouth AfricaSudanTanzaniaUgandaZimbabwe
■
•••••••••
■
•••••••••••••••
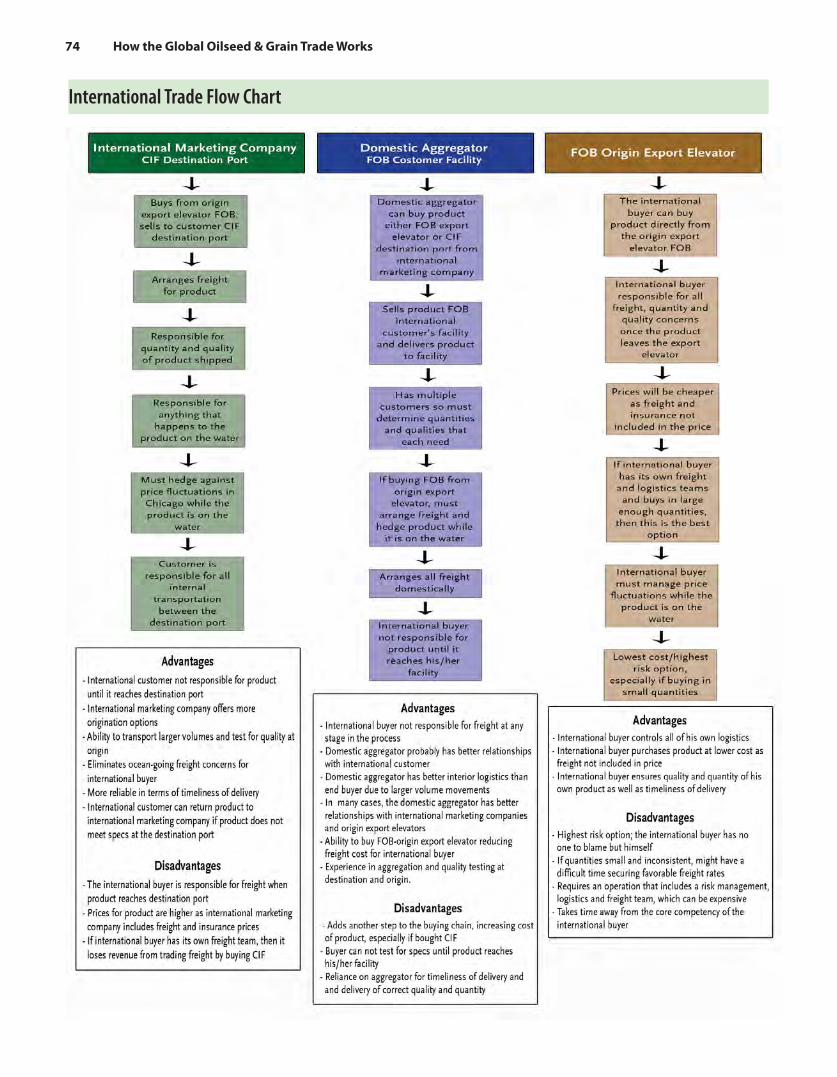
74 How the Global Oilseed & Grain Trade Works
International Trade Flow Chart
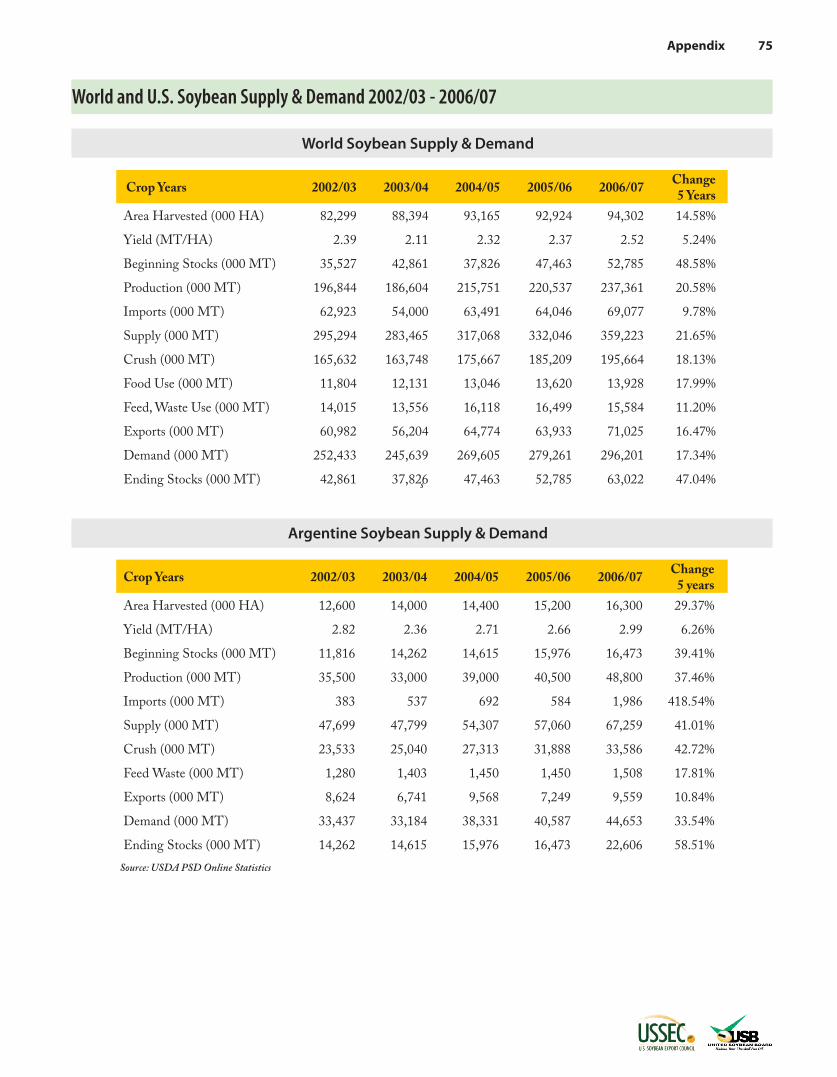
Appendix 75
World and U.S. Soybean Supply & Demand 2002/03 - 2006/07
World Soybean Supply & Demand
Crop Years 2002/03 2003/04 2004/05 2005/06 2006/07 Change 5 Years
Area Harvested (000 HA) 82,299 88,394 93,165 92,924 94,302 14.58%
Yield (MT/HA) 2.39 2.11 2.32 2.37 2.52 5.24%
Beginning Stocks (000 MT) 35,527 42,861 37,826 47,463 52,785 48.58%
Production (000 MT) 196,844 186,604 215,751 220,537 237,361 20.58%
Imports (000 MT) 62,923 54,000 63,491 64,046 69,077 9.78%
Supply (000 MT) 295,294 283,465 317,068 332,046 359,223 21.65%
Crush (000 MT) 165,632 163,748 175,667 185,209 195,664 18.13%
Food Use (000 MT) 11,804 12,131 13,046 13,620 13,928 17.99%
Feed, Waste Use (000 MT) 14,015 13,556 16,118 16,499 15,584 11.20%
Exports (000 MT) 60,982 56,204 64,774 63,933 71,025 16.47%
Demand (000 MT) 252,433 245,639 269,605 279,261 296,201 17.34%
Ending Stocks (000 MT) 42,861 37,826 47,463 52,785 63,022 47.04%s
Argentine Soybean Supply & Demand
Crop Years 2002/03 2003/04 2004/05 2005/06 2006/07 Change 5 years
Area Harvested (000 HA) 12,600 14,000 14,400 15,200 16,300 29.37%
Yield (MT/HA) 2.82 2.36 2.71 2.66 2.99 6.26%
Beginning Stocks (000 MT) 11,816 14,262 14,615 15,976 16,473 39.41%
Production (000 MT) 35,500 33,000 39,000 40,500 48,800 37.46%
Imports (000 MT) 383 537 692 584 1,986 418.54%
Supply (000 MT) 47,699 47,799 54,307 57,060 67,259 41.01%
Crush (000 MT) 23,533 25,040 27,313 31,888 33,586 42.72%
Feed Waste (000 MT) 1,280 1,403 1,450 1,450 1,508 17.81%
Exports (000 MT) 8,624 6,741 9,568 7,249 9,559 10.84%
Demand (000 MT) 33,437 33,184 38,331 40,587 44,653 33.54%
Ending Stocks (000 MT) 14,262 14,615 15,976 16,473 22,606 58.51% Source: USDA PSD Online Statistics
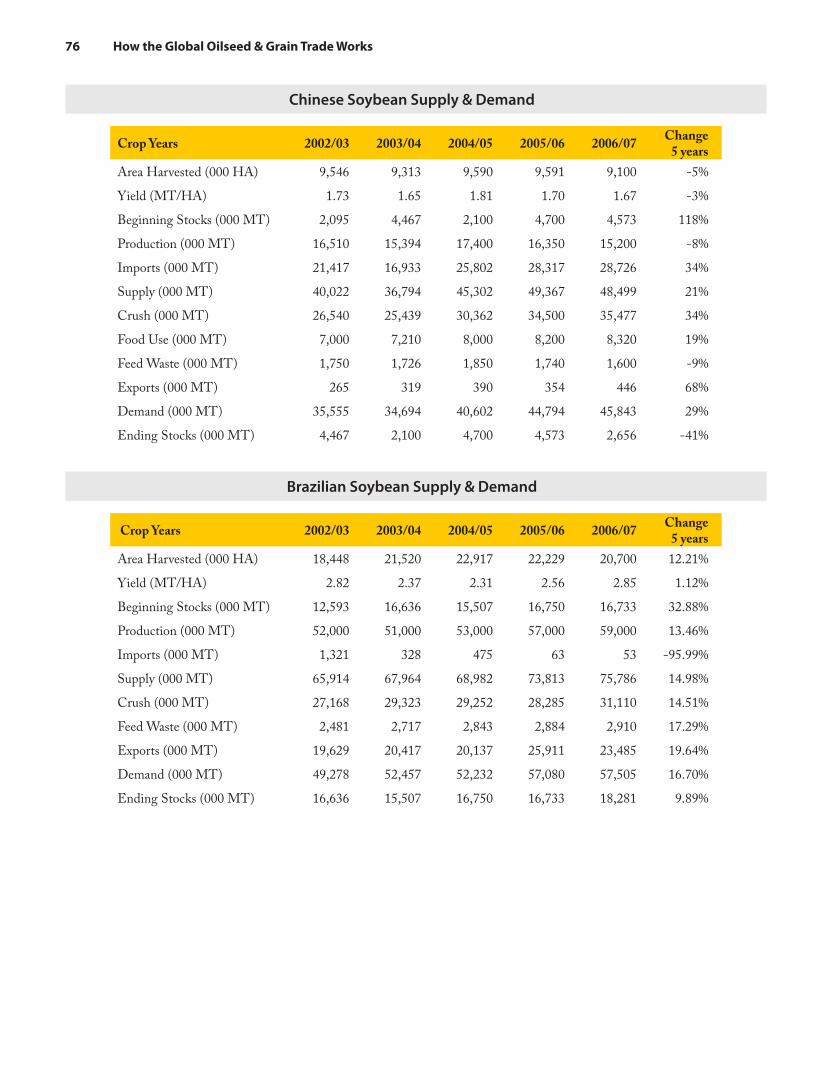
76 How the Global Oilseed & Grain Trade Works
Chinese Soybean Supply & Demand
Crop Years 2002/03 2003/04 2004/05 2005/06 2006/07 Change 5 years
Area Harvested (000 HA) 9,546 9,313 9,590 9,591 9,100 -5%
Yield (MT/HA) 1.73 1.65 1.81 1.70 1.67 -3%
Beginning Stocks (000 MT) 2,095 4,467 2,100 4,700 4,573 118%
Production (000 MT) 16,510 15,394 17,400 16,350 15,200 -8%
Imports (000 MT) 21,417 16,933 25,802 28,317 28,726 34%
Supply (000 MT) 40,022 36,794 45,302 49,367 48,499 21%
Crush (000 MT) 26,540 25,439 30,362 34,500 35,477 34%
Food Use (000 MT) 7,000 7,210 8,000 8,200 8,320 19%
Feed Waste (000 MT) 1,750 1,726 1,850 1,740 1,600 -9%
Exports (000 MT) 265 319 390 354 446 68%
Demand (000 MT) 35,555 34,694 40,602 44,794 45,843 29%
Ending Stocks (000 MT) 4,467 2,100 4,700 4,573 2,656 -41%
Brazilian Soybean Supply & Demand
Crop Years 2002/03 2003/04 2004/05 2005/06 2006/07 Change 5 years
Area Harvested (000 HA) 18,448 21,520 22,917 22,229 20,700 12.21%
Yield (MT/HA) 2.82 2.37 2.31 2.56 2.85 1.12%
Beginning Stocks (000 MT) 12,593 16,636 15,507 16,750 16,733 32.88%
Production (000 MT) 52,000 51,000 53,000 57,000 59,000 13.46%
Imports (000 MT) 1,321 328 475 63 53 -95.99%
Supply (000 MT) 65,914 67,964 68,982 73,813 75,786 14.98%
Crush (000 MT) 27,168 29,323 29,252 28,285 31,110 14.51%
Feed Waste (000 MT) 2,481 2,717 2,843 2,884 2,910 17.29%
Exports (000 MT) 19,629 20,417 20,137 25,911 23,485 19.64%
Demand (000 MT) 49,278 52,457 52,232 57,080 57,505 16.70%
Ending Stocks (000 MT) 16,636 15,507 16,750 16,733 18,281 9.89%
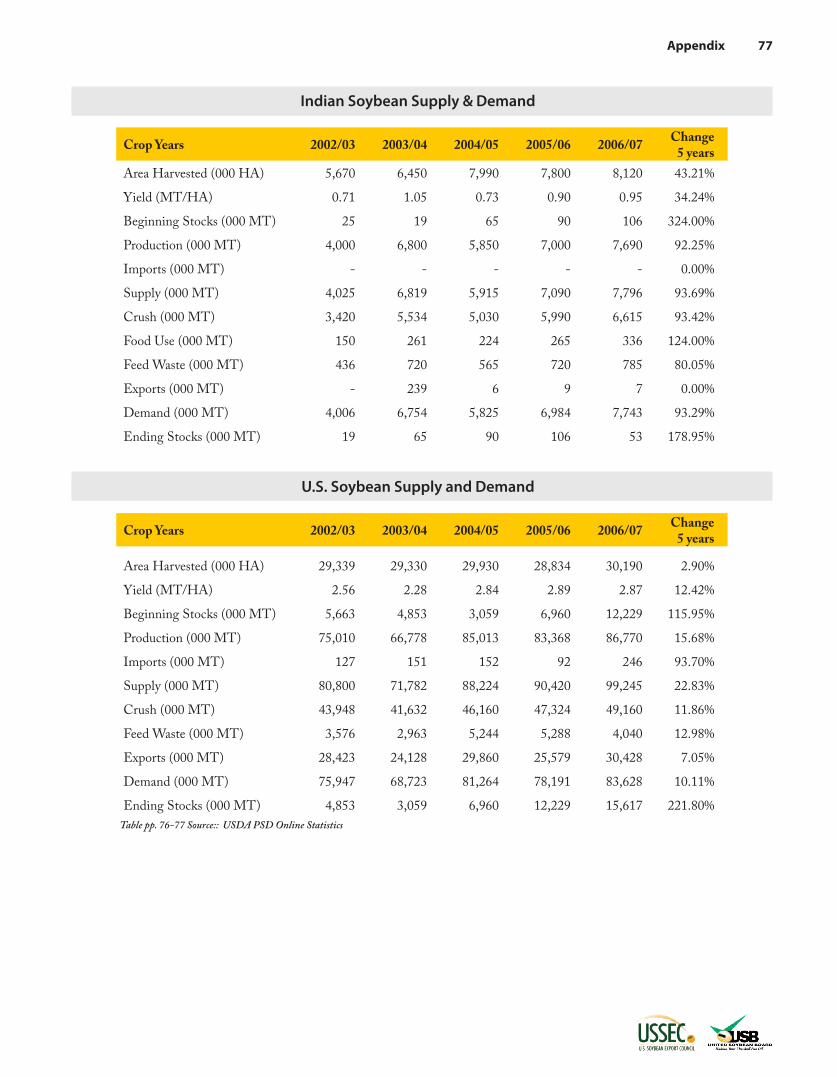
Appendix 77
Indian Soybean Supply & Demand
Crop Years 2002/03 2003/04 2004/05 2005/06 2006/07 Change 5 years
Area Harvested (000 HA) 5,670 6,450 7,990 7,800 8,120 43.21%
Yield (MT/HA) 0.71 1.05 0.73 0.90 0.95 34.24%
Beginning Stocks (000 MT) 25 19 65 90 106 324.00%
Production (000 MT) 4,000 6,800 5,850 7,000 7,690 92.25%
Imports (000 MT) - - - - - 0.00%
Supply (000 MT) 4,025 6,819 5,915 7,090 7,796 93.69%
Crush (000 MT) 3,420 5,534 5,030 5,990 6,615 93.42%
Food Use (000 MT) 150 261 224 265 336 124.00%
Feed Waste (000 MT) 436 720 565 720 785 80.05%
Exports (000 MT) - 239 6 9 7 0.00%
Demand (000 MT) 4,006 6,754 5,825 6,984 7,743 93.29%
Ending Stocks (000 MT) 19 65 90 106 53 178.95%
U.S. Soybean Supply and Demand
Crop Years 2002/03 2003/04 2004/05 2005/06 2006/07 Change 5 years
Area Harvested (000 HA) 29,339 29,330 29,930 28,834 30,190 2.90%
Yield (MT/HA) 2.56 2.28 2.84 2.89 2.87 12.42%
Beginning Stocks (000 MT) 5,663 4,853 3,059 6,960 12,229 115.95%
Production (000 MT) 75,010 66,778 85,013 83,368 86,770 15.68%
Imports (000 MT) 127 151 152 92 246 93.70%
Supply (000 MT) 80,800 71,782 88,224 90,420 99,245 22.83%
Crush (000 MT) 43,948 41,632 46,160 47,324 49,160 11.86%
Feed Waste (000 MT) 3,576 2,963 5,244 5,288 4,040 12.98%
Exports (000 MT) 28,423 24,128 29,860 25,579 30,428 7.05%
Demand (000 MT) 75,947 68,723 81,264 78,191 83,628 10.11%
Ending Stocks (000 MT) 4,853 3,059 6,960 12,229 15,617 221.80%
Table pp. 76-77 Source:: USDA PSD Online Statistics
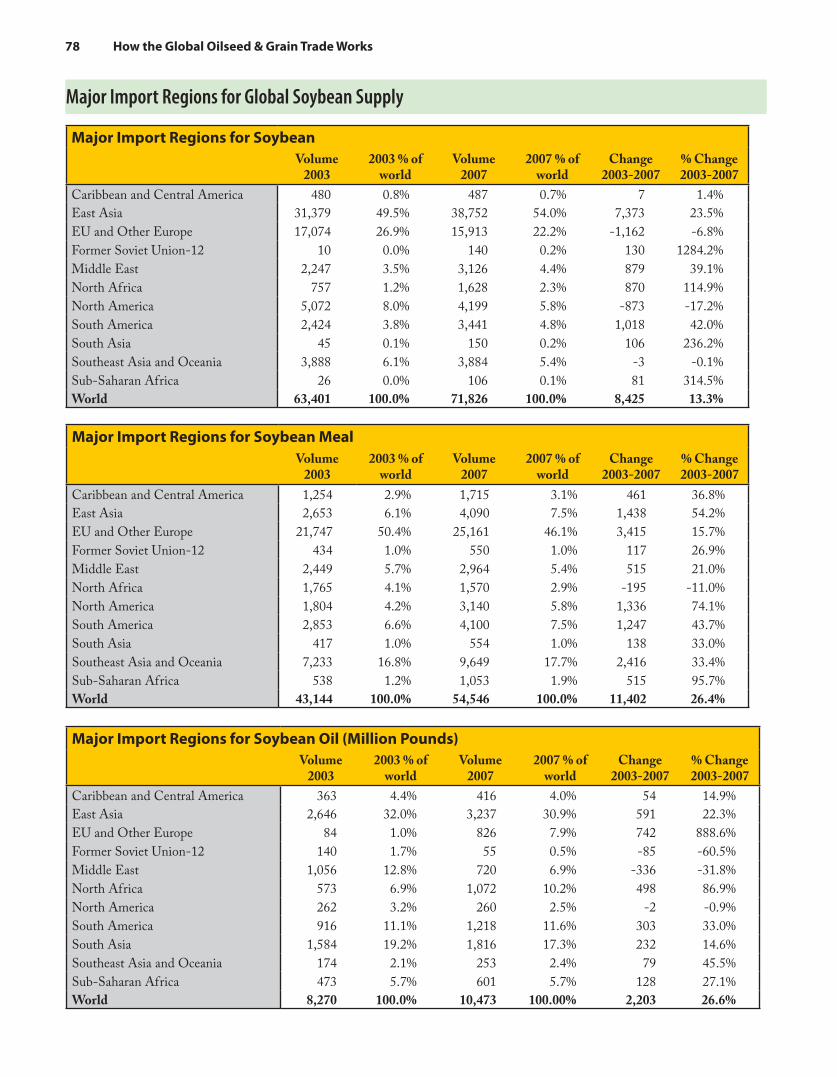
78 How the Global Oilseed & Grain Trade Works
Major Import Regions for Global Soybean Supply
Major Import Regions for Soybean MealVolume
20032003 % of
worldVolume
20072007 % of
worldChange
2003-2007% Change 2003-2007
Caribbean and Central America 1,254 2.9% 1,715 3.1% 461 36.8%East Asia 2,653 6.1% 4,090 7.5% 1,438 54.2%EU and Other Europe 21,747 50.4% 25,161 46.1% 3,415 15.7%Former Soviet Union-12 434 1.0% 550 1.0% 117 26.9%Middle East 2,449 5.7% 2,964 5.4% 515 21.0%North Africa 1,765 4.1% 1,570 2.9% -195 -11.0%North America 1,804 4.2% 3,140 5.8% 1,336 74.1%South America 2,853 6.6% 4,100 7.5% 1,247 43.7%South Asia 417 1.0% 554 1.0% 138 33.0%Southeast Asia and Oceania 7,233 16.8% 9,649 17.7% 2,416 33.4%Sub-Saharan Africa 538 1.2% 1,053 1.9% 515 95.7%World 43,144 100.0% 54,546 100.0% 11,402 26.4%
Major Import Regions for Soybean Oil (Million Pounds)Volume
20032003 % of
worldVolume
20072007 % of
worldChange
2003-2007% Change 2003-2007
Caribbean and Central America 363 4.4% 416 4.0% 54 14.9%East Asia 2,646 32.0% 3,237 30.9% 591 22.3%EU and Other Europe 84 1.0% 826 7.9% 742 888.6%Former Soviet Union-12 140 1.7% 55 0.5% -85 -60.5%Middle East 1,056 12.8% 720 6.9% -336 -31.8%North Africa 573 6.9% 1,072 10.2% 498 86.9%North America 262 3.2% 260 2.5% -2 -0.9%South America 916 11.1% 1,218 11.6% 303 33.0%South Asia 1,584 19.2% 1,816 17.3% 232 14.6%Southeast Asia and Oceania 174 2.1% 253 2.4% 79 45.5%Sub-Saharan Africa 473 5.7% 601 5.7% 128 27.1%World 8,270 100.0% 10,473 100.00% 2,203 26.6%
Major Import Regions for Soybean Volume
20032003 % of
worldVolume
20072007 % of
worldChange
2003-2007% Change 2003-2007
Caribbean and Central America 480 0.8% 487 0.7% 7 1.4%East Asia 31,379 49.5% 38,752 54.0% 7,373 23.5%EU and Other Europe 17,074 26.9% 15,913 22.2% -1,162 -6.8%Former Soviet Union-12 10 0.0% 140 0.2% 130 1284.2%Middle East 2,247 3.5% 3,126 4.4% 879 39.1%North Africa 757 1.2% 1,628 2.3% 870 114.9%North America 5,072 8.0% 4,199 5.8% -873 -17.2%South America 2,424 3.8% 3,441 4.8% 1,018 42.0%South Asia 45 0.1% 150 0.2% 106 236.2%Southeast Asia and Oceania 3,888 6.1% 3,884 5.4% -3 -0.1%Sub-Saharan Africa 26 0.0% 106 0.1% 81 314.5%World 63,401 100.0% 71,826 100.0% 8,425 13.3%
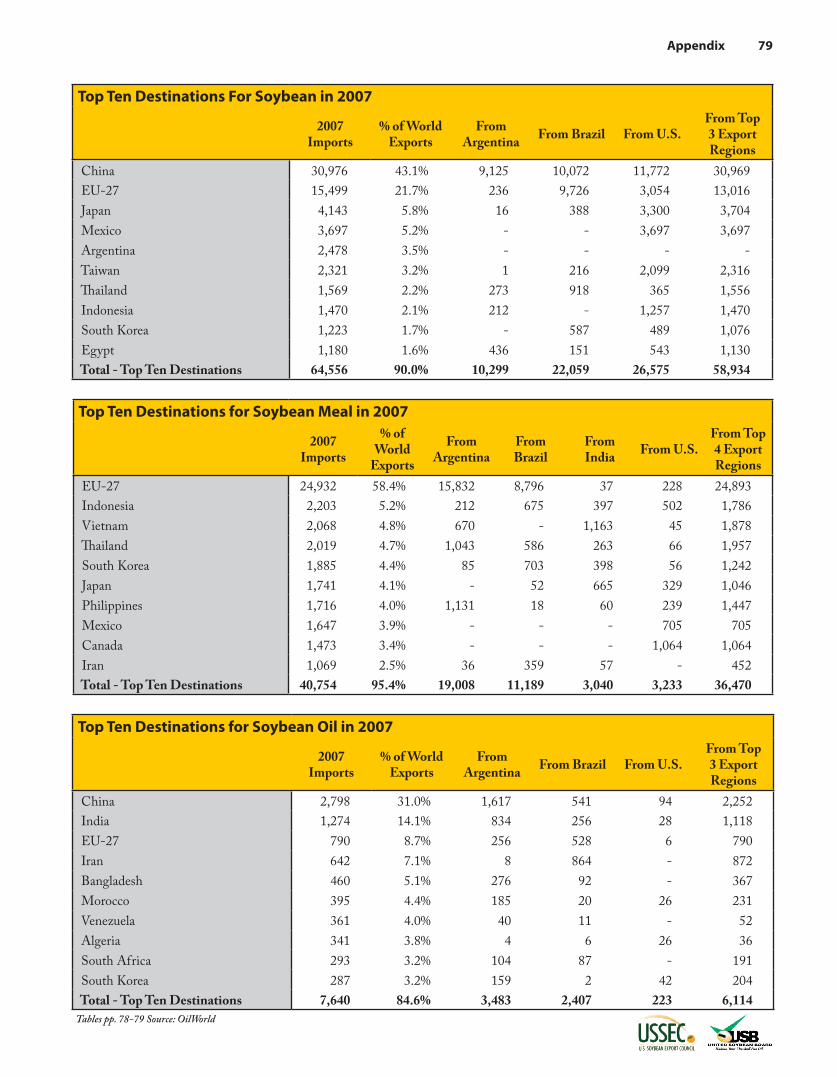
Appendix 79
Tables pp. 78-79 Source: OilWorld
Top Ten Destinations For Soybean in 2007
2007 Imports
% of World Exports
From Argentina From Brazil From U.S.
From Top 3 Export Regions
China 30,976 43.1% 9,125 10,072 11,772 30,969 EU-27 15,499 21.7% 236 9,726 3,054 13,016 Japan 4,143 5.8% 16 388 3,300 3,704 Mexico 3,697 5.2% - - 3,697 3,697 Argentina 2,478 3.5% - - - - Taiwan 2,321 3.2% 1 216 2,099 2,316 Thailand 1,569 2.2% 273 918 365 1,556 Indonesia 1,470 2.1% 212 - 1,257 1,470 South Korea 1,223 1.7% - 587 489 1,076 Egypt 1,180 1.6% 436 151 543 1,130 Total - Top Ten Destinations 64,556 90.0% 10,299 22,059 26,575 58,934
Top Ten Destinations for Soybean Meal in 2007
2007 Imports
% of World
Exports
From Argentina
From Brazil
From India From U.S.
From Top 4 Export Regions
EU-27 24,932 58.4% 15,832 8,796 37 228 24,893 Indonesia 2,203 5.2% 212 675 397 502 1,786 Vietnam 2,068 4.8% 670 - 1,163 45 1,878 Thailand 2,019 4.7% 1,043 586 263 66 1,957 South Korea 1,885 4.4% 85 703 398 56 1,242 Japan 1,741 4.1% - 52 665 329 1,046 Philippines 1,716 4.0% 1,131 18 60 239 1,447 Mexico 1,647 3.9% - - - 705 705 Canada 1,473 3.4% - - - 1,064 1,064 Iran 1,069 2.5% 36 359 57 - 452 Total - Top Ten Destinations 40,754 95.4% 19,008 11,189 3,040 3,233 36,470
Top Ten Destinations for Soybean Oil in 2007
2007 Imports
% of World Exports
From Argentina From Brazil From U.S.
From Top 3 Export Regions
China 2,798 31.0% 1,617 541 94 2,252 India 1,274 14.1% 834 256 28 1,118 EU-27 790 8.7% 256 528 6 790 Iran 642 7.1% 8 864 - 872 Bangladesh 460 5.1% 276 92 - 367 Morocco 395 4.4% 185 20 26 231 Venezuela 361 4.0% 40 11 - 52 Algeria 341 3.8% 4 6 26 36 South Africa 293 3.2% 104 87 - 191 South Korea 287 3.2% 159 2 42 204 Total - Top Ten Destinations 7,640 84.6% 3,483 2,407 223 6,114
80 How the Global Oilseed & Grain Trade Works
Index of Maps, Tables and Graphs
Argentine Soybean Supply & Demand . . . . . . 75
Average U.S. Soybean Production by Region, 2002-2007 . . . . . . . . . . . . . . . . . . 19
Brazilian Soybean Supply & Demand . . . . . . . 76
Chinese Soybean Supply & Demand . . . . . . . 76
Competitiveness of Soybean Exports in Key Export Markets . . . . . . . . . . . . . . . . 60
Competitiveness of Soybean Meal Exports in Key Export Markets . . . . . . . . . . . . . 61
Freight Rate Volatility, 1/2001-1/2008 . . . . . . 38
Global Consumption of Soybean Meal by Region, 2007/08 . . . . . . . . . . . . . . . . . . . 9
Global Consumption of Soybean Oil by Region, 2007/08 . . . . . . . . . . . . . . . . . . . 9
Global Consumption of Soybeans by Region, 2007/08 . . . . . . . . . . . . . . . . . . . 8
Global Soybean Export Market . . . . . . . . . . 70
Global Soybean Harvested Area . . . . . . . . . 16
Global Soybean Meal Export Market . . . . . . . 71
Global Soybean Oil Export Market . . . . . . . . 72
Global Soybean Production . . . . . . . . . . . 16
Global Soybean Yields . . . . . . . . . . . . . . 16
Harvested Area, Yields and Production in Major Growing Regions, 1996/97-2007/08 . . . . . . 15
Indian Soybean Supply & Demand . . . . . . . . 77
Location of Soybean Crushing Facilities in the U.S. Operated by Major Companies . . . . . . 13
Major Import Regions for Soybean . . . . . . . . 78
Major Import Regions for Soybean Meal . . . . . 78
Major Import Regions for Soybean Oil . . . . . . 78
Major Origin Percentage of Global Soybean Export Market . . . . . . . . . . . . . . . . 70
Major Origin Percentage of Global Soybean Meal Export Market . . . . . . . . . . . . . . . . 71
Major Origin Percentage of Global Soybean Oil Export Market . . . . . . . . . . . . . . . . 72
Major Soybean Company Crush Capacity, 2007 (Short Tons/Day) . . . . . . . . . . . . 14
Major Soybean Exporters (Million MT) . . . . . . 7
Major Soybean Oil Importers 2006/07 . . . . . . 55
Map of Trading Desks for Major Grain Companies 56
NOPA Soybean Meal Specifications . . . . . . . . 26Palm and Soybean Oil Production . . . . . . . . 10Primary Global Soybean Producer Countries . . . 8Primary Global Soybean Production Countries,
2007/08 . . . . . . . . . . . . . . . . . . . 18Projected Soybean Production, 2007/08 . . . . . 5Shipping Days Between Key Soybean Production
Countries and Destination Markets for Given Speed . . . . . . . . . . . . . . . . . 40
Soybean Crush by Major Countries . . . . . . . . 52Soybean Meal Imports by Region,
1997/97 - 2006/07 . . . . . . . . . . . . . . 53Soybean Meal Imports by Region 2006/07 . . . . 53Soybean Meal Trade Flow Map 2003 (1,000 MT) . . 65Soybean Meal Trade Flow Map 2007 (1,000 MT) . . 65Soybean Oil Exports by Major Origin . . . . . . . 54Soybean Oil Imports, 1996/97 - 2006/07 . . . . . 55Soybean Oil Trade Flow Map 2003 (1,000 MT). . . 67Soybean Oil Trade Flow Map 2007 (1,000 MT). . . 67Soybean Processing . . . . . . . . . . . . . . . 51Soybean Trade Flow Map 2003 (1,000 MT) . . . . 63Soybean Trade Flow Map 2007 (1,000 MT) . . . . 63Summary of Export Credit Guarantee Program
Activity for GSM-102 . . . . . . . . . . . . . 62Top Ten Destinations for Soybean in 2007 . . . . 79Top Ten Destinations for Soybean Meal in 2007 . . 79Top Ten Destinations for Soybean Oil in 2007 . . . 79Top Ten Soybean Destinations, 2003-2007 . . . . 64Top Ten Soybean Meal Destinations, 2003-2007 . . 66Top Ten Soybean Oil Destinations, 2003-2007. . . 68U.S. and Global Production of Soybean Meal
and Oil, 1996/97-2007/08 (Million MT). . . . . 15U.S. and South American Harvested Hectares . . . 17U.S. and South American Production . . . . . . . 17U.S. Containerized Grain and Oilseed Exports . . . 39U.S. Soybean Supply and Demand . . . . . . . . 77USDA Baseline Projections for Soybean
Production . . . . . . . . . . . . . . . . . . 6Vegetable Protein Meal Consumption in the
U.S. (Million MT) . . . . . . . . . . . . . . . 11World Soybean Supply & Demand . . . . . . . . 75