Embed Size (px)
Citation preview

the future of workInternational Symposium for Employers on
l avenir du travailSymposium international des employeurs sur
el futuro del trabajoColoquio internacional de empleadores sobre
DecemberDécembreDiciembre2 0 1 3G e n e v aG e n è v eG i n e b r a
5-6
w w w . i l o . o r g / e m p l o y e r s y m p o s i u m
How the world of work is changing: a review of the evidence Maarten Goos

i
How the world of work is changing: a review of
the evidence
Written by: Maarten Goos
Bureau for Employers' Activities, International Labour Office
2013

ii
Copyright © International Labour Organization 2013
First published 2013
Publications of the International Labour Office enjoy copyright under Protocol 2 of the Universal Copyright
Convention. Nevertheless, short excerpts from them may be reproduced without authorization, on condition that
the source is indicated. For rights of reproduction or translation, application should be made to ILO Publications
(Rights and Permissions), International Labour Office, CH-1211 Geneva 22, Switzerland, or by email:
[email protected]. The International Labour Office welcomes such applications.
Libraries, institutions and other users registered with reproduction rights organizations may make copies in
accordance with the licences issued to them for this purpose. Visit www.ifrro.org to find the reproduction rights
organization in your country.
ILO Cataloguing in Publication Data
Goos, Maarten
How the world of work is changing: a review of the evidence / Maarten Goos ; International Labour Office, Bureau
for Employers' Activities.- Geneva: ILO, 2013
ISBN 9789221281610; 9789221281627 (web pdf)
International Labour Office and Bureau for Employers' Activities; ILO International Symposium on the Future of
Work (2013, Geneva, Switzerland)
work / employment / wages / industrial development / history
13.01.1
Also available in French: Comment le monde du travail est en train de changer: un examen des éléments
d'information (ISBN 978-92-2-228161-9) Geneva, [2013] in Spanish: Cómo está cambiando el mundo del trabajo:
análisis de los datos (ISBN 978-92-2-328161-8), Geneva, [2013].
ILO Cataloguing in Publication Data
The designations employed in ILO publications, which are in conformity with United Nations practice, and the
presentation of material therein do not imply the expression of any opinion whatsoever on the part of the
International Labour Office concerning the legal status of any country, area or territory or of its authorities, or
concerning the delimitation of its frontiers.
The responsibility for opinions expressed in signed articles, studies and other contributions rests solely with their
authors, and publication does not constitute an endorsement by the International Labour Office of the opinions
expressed in them.
Reference to names of firms and commercial products and processes does not imply their endorsement by the
International Labour Office, and any failure to mention a particular firm, commercial product or process is not a
sign of disapproval.
ILO publications and electronic products can be obtained through major booksellers or ILO local offices in many
countries, or direct from ILO Publications, International Labour Office, CH-1211 Geneva 22, Switzerland.
Catalogues or lists of new publications are available free of charge from the above address, or by email:
Visit our website: www.ilo.org/publns
Printed in Switzerland
iii
How the world of work is changing: a review of
the evidence
Maarten Goos1
October 2013
Abstract
This paper presents an overview of some of the recent literature
about the long-run changes in labour market outcomes in advanced
economies. It shows that the First and Second Industrial Revolutions,
with inventions in the second half of the 19th
century that had a
lasting impact up to 1980, resulted in skill upgrading and decreasing
overall wage inequality. To the contrary, the Computer Revolution that
started in the 1980s is no longer unambiguously skill-upgrading but
characterized by an underlying process of job polarization and an
increase in upper-tail and overall wage inequality. However, the paper
concludes by providing arguments in favour of optimism about future
computerization as long as our labour markets are able to provide the
necessary worker skills to support such changes.
JEL Classifications: J23, J24, N10
Keywords: Technological progress, Skills, Employment Structure, Wage
Inequality
1
Goos: [email protected]. I would like to thank Anna Salomons for her continuous and invaluable
feedback while writing this paper. This paper has been written in preparation for the ILO Symposium for Employers
on the Future of Work, Geneva, 5-6 December 2013.
iv
Table of Contents
1 Introduction .............................................................................................. 1
2 The past (1820-1980) ................................................................................ 3
2.1 The First Industrial Revolution (1820-1870) .......................................... 3
2.2 The Second Industrial Revolution (1870-1980) ...................................... 4
2.3 Evidence of changes in the job structure before 1980 ........................... 6
2.4 Evidence of changes in relative wages before 1980 ............................. 13
3 The present (1980-2014) ......................................................................... 21
3.1 The Computer Revolution ................................................................... 21
3.2 The task approach to labour markets and firms .................................. 23
3.3 Evidence of recent changes in relative employment ............................ 26
3.4 Evidence of recent changes in relative wages ...................................... 35
3.5 Evidence for other countries ............................................................... 38
4 The future ............................................................................................... 42
5 Conclusions ............................................................................................. 45
6 Bibliography ............................................................................................ 47
1
1 Introduction
Labour markets are constantly changing. These changes, which have important
consequences for individual workers, are reflected in compositional changes in
employment and changes in wage inequality, and help shape labour market
institutions. As such, understanding them is important for academics and
policymakers alike. This paper therefore provides an overview of changes in
employment and wage structures, starting with the birth of modern economies,
through the First and Second Industrial Revolutions, to the ongoing Computer
Revolution. Drawing on a recent literature, it outlines the content of these
different episodes of development and highlights how each have had different
impacts on labour markets, depending on how they interacted with the existing
job structure, skill supply, product demand and the organization of production.
Section 2 of the paper first provides a brief general background to the First and
Second Industrial Revolutions which took place in today’s advanced economies
between 1820 and 1900, with follow-up inventions up to 1980. The invention
of, among other things, steam power, electricity, the automobile, modern
chemistry and the telephone in the 19th
century caused a sea change in
manufacturing and led to a rise in services. In manufacturing, large plants
replaced small artisanal workshops. On the new factory floors, economies of
scale came from capital deepening and workers operating purpose-built
machinery. Because machine operators required some but not much training,
the gains from specialization provided many unskilled farm labourers with
opportunities to move into better-paid medium-skilled blue-collar jobs.
Together with an increase in medium-skilled and skilled white-collar
employment in manufacturing and services, this led to skill-upgrading in the
overall economy. Moreover, this skill upgrading was characterized by an
expansion of the education system to such an extent that the increase in the
supply of skills outpaced its increase in demand due to industrialization. Hence,
skills were relatively abundant, thus reducing the skill premium and overall
wage inequality. In this way, the First and Second Industrial Revolutions
resulted in economic growth, skill-upgrading, mass education and lower overall
wage inequality.
Section 3 of the paper then explains how the Computer Revolution, which
began in advanced economies in the 1980s, is different. Although there still is a
net skill-upgrading, computerization is also leading to job polarization with
rising employment shares for skilled and unskilled jobs at the expense of
medium-skilled employment. The reason for this is that computers can codify
and perform more efficiently routine tasks mainly done by medium-skilled
workers, such as machine operators and office clerks. But the tasks done by
unskilled workers, such as waiters or cleaners, and skilled workers, such as
managers and computer programmers, are non-routine in nature and therefore
not easily codified and performed by computers. At the same time, growth in
2
educational attainment rates has faltered in many advanced economies since
1980, reducing growth in skill supplies, thereby increasing the skill premium
and upper-tail and overall wage inequality. In short, the impact of the Computer
Revolution is different from that of previous episodes of development.
Underlying skill-upgrading there is job polarization and upper-tail and overall
wage inequality is rising not falling. To get a better understanding of these
aggregate changes, Section 3 goes on to document the impact of
computerization by outlining its impact on the firm’s organizational design and
human resource practices. It points to the importance of system-wide
complementarities and the need for computerization to allow high
performance work practices, such as setting up problem solving teams, job
rotation, information sharing and intensive training. Section 3 also discusses,
among other things, the importance of a task-based approach to labour
markets and firms, and the existence of wage polarization. It also briefly
documents recent employment changes in developing economies.
Section 4 of the paper then draws from our understanding of past and present
labour market developments to think briefly about the future. It conjectures
about the future pace of computerization to argue that, on balance, the relative
demand for skilled workers will continue to increase in the future. To the extent
that this increase will be met by continued investment in education and on-the-
job training, there can be further skill-upgrading and economic growth without
increasing, and possibly even decreasing, upper-tail and overall wage
inequality, as was the case in advanced economies before 1980. Moreover, the
section argues why job polarization does not justify fears of a digital invasion
but calls for optimism about future computerization as long as labour markets
are able to provide the necessary skills to support such changes.
3
2 The past (1820-1980)
This section discusses the impact of the First and Second Industrial Revolutions
on labour markets. Section 2.1 gives some general background to the First
Industrial Revolution that took place between 1820 and 1870 in today’s
advanced economies. Section 2.2 does the same for the Second Industrial
Revolution between 1870 and 1900, with follow-up inventions up to 1980.
Section 2.3 then discusses empirical evidence of the impacts of the First and
Second Industrial Revolutions on the structure of employment. For
manufacturing, it shows the shift away from the smaller artisanal shop to the
larger factory. For the aggregate economy, there was skill-upgrading because of
a shift away from unskilled farm labourers to medium-skilled blue-collar
workers such as machine operators and medium-skilled and skilled white-collar
employment in manufacturing and services. Finally, Section 2.4 looks at
changes in relative wages that, together with changes in relative employment,
are informative about shifts in the relative demand for and supply of differently
skilled workers. It is shown that the skill premium and overall wage inequality
decreased because the increase in the demand for skills due to industrialization
was met by an even stronger increase in the supply of skilled workers due to
the rapid expansion of the education system.
2.1 The First Industrial Revolution (1820-1870)
Before the start of the First Industrial Revolution, most people were
employed either in agriculture as farmers or in a town or city as members of a
guild. Guilds were organizations formed by craftsmen based on their trades,
mainly textile and wood industries, each of which controlled the “arts” or
“mysteries” of their crafts. Master artisans enjoyed a higher social status
because of their level of expertise and because they owned small shops in
which they employed and trained apprentices. The early stages of a craft
worker’s career mainly consisted of applying the finishing touches to an almost
final good. The training needed to progress to the status of craftsman or even
master mostly involved learning how to use a simple set of tools as dictated by
the guild. Guilds also imposed entry restrictions, making it difficult for those
lacking the capital or approval to gain access to the profession even as
apprentices. In many cities, guilds united to protect their common interest, thus
shaping institutions (Laing 2011). As such, work defined a person’s role in
society, and there was little social mobility. Wars were rationalized by a
mercantilist philosophy that motivated colonial expansion and barriers to trade.
The First Industrial Revolution put an end to the political economy of
mercantilism and marked an important turning point towards a free-market
philosophy. Its transition gained momentum between 1820 and 1870 with the
widespread adoption of steam-powered boats, ships and railways, the large
scale manufacture of machine tools and the increasing use of steam-powered
factories. Individual tasks began to be carried out by special-purpose machinery
4
instead of by human or animal effort alone. Unskilled agricultural labourers
moved to the factory floor to become better-paid medium-skilled machine
operators. Moreover, the factory floor also demanded skilled workers such as
supervisors to organize and monitor machine operators, and engineers and
mechanics to develop, build and implement new machinery (Katz and Margo
2013). In short, the First Industrial Revolution increased the living standards of
many workers even in poor households. Together with the rapid increase in
agricultural output due to the invention of soil fertilizers, industrialization made
it possible for societies to grow and escape their Malthusian poverty trap for
the first time in history.
However, despite the large societal gains from the First Industrial Revolution,
life expectancy in the advancing economies was still only 45 years in 1870.
Indeed, living and working conditions still needed much improvement. Houses
were dark and smoky and did not have any electricity. The enclosed iron stove
had only recently been invented and much cooking was still done in the open
hearth. Only the proximity of the stove or hearth was warm and bedrooms were
unheated. There was no running water or indoor plumbing such that water for
laundry, cooking, and indoor chamber pots had to be carried in, and
wastewater carried out. Coal or wood had to be carried in and ashes had to be
collected and carried out. Many workers still had to work long hours while
barely earning a decent living, opportunities for education were very limited,
and child labour was common. Although railroads began connecting cities,
steam power was not practical within them so inner-city traffic still relied on
horses (Gordon 2012).
2.2 The Second Industrial Revolution (1870-1980)
The key inventions of the Second Industrial Revolution took place between
1870 and 1900 and can be grouped into five categories: (1) electricity and all
its spin-offs; (2) the internal combustion engine and the automobile; (3) running
water, indoor plumbing, and central heating; (4) rearranging molecules,
including everything to do with petroleum, chemicals, plastics, and
pharmaceuticals; and (5) the range of communication and entertainment
devices including the telephone, the phonograph, popular photography, radio
and motion pictures. Widespread adoption of these inventions as well as
additional “follow-up” inventions continued and are believed to have had a
lasting impact as late as the 1970s (Gordon 2012).
Running water replaced carrying water and waste; oil and gas replaced coal and
wood; electric hand tools became common by 1920; and household appliances
began to proliferate with the first washers and refrigerators being introduced in
the 1920s. Reading was easier with electric light, and pollution was reduced as
natural gas began to be used instead of wood or coal. Communication and
entertainment blossomed with the telegraph, telephone, phonograph, recorded
5
music and, by 1920, the first commercial radio station. Television was
introduced in 1929 and the first TV stations began broadcasting in 1936.
Antibiotics became commercially available in 1932. In terms of transportation,
the horse-drawn tram was replaced by the electric tram and the motorbus
within a few years, and underground railway systems appeared in large cities.
But probably none of the transportation inventions of the period 1870-1900
was more important than the automobile. Prior to its invention, workers
necessarily had to live close to their jobs. The arrival of the automobile meant
the decentralization of business and residential patterns leading to a suburban
real estate boom, the rise of out-of-city centre department stores,
supermarkets, and mail-order catalogues. The automobile was a remedy for
rural isolation, led to improved roads and thus medical assistance, and
expanded recreational opportunities. Other modes of transportation continued
to develop. Barely two decades after the Wright Brothers’ first flight in 1903,
the first commercial airline flight took place in 1926. By 1958, travellers were
winging their way at 550 miles an hour in a Boeing 707 (Gordon 2012).
As a result of these inventions, the labour market had been utterly changed by
1970. The transition from agriculture and the artisanal shop to the factory that
had started in the First Industrial Revolution accelerated. In factories, the
introduction of electricity enabled further gains from task specialization by
introducing “continuous processing” and “mass production” methods (Katz and
Margo 2013). As early as 1799, Eli Whitney had introduced an assembly line to
produce muskets. The key innovation underlying Whitney’s system was to
assemble each musket in stages using dedicated machinery that could be
operated by workers with minimal training. This resulted in a more uniform
product that met precise tolerance standards. Over the course of the 19th
century, this assembly-line method rapidly spread into other industries. A
famous example is the introduction of Henry Ford’s automated car assembly
line in the late 19th
century. In 1913, Ford took the idea one step further by
introducing moving assembly methods to manufacture the Ford Model T
automobile. Partially assembled automobile chassis were continuously moved
along a conveyor belt from one production stage to the next – hence the name
“continuous processing” – until their assembly was complete. The
accompanying increase in productivity made it possible to reduce costs and
thereby the price of automobiles, leading to an increase in demand for them
and mass production. Consequently, Ford’s automated assembly line was
rapidly adopted by other industries (Laing 2011). A similar profound change in
production methods would not occur until the 1950s and 1960s, when firms
gradually began replacing the specialized equipment used in assembly-line
production with more flexible robotic equipment for “flexible” or “lean”
technologies, an issue that we will return to below.
During the Second Industrial Revolution, further specialization and capital
deepening continued to increase productivity and therefore the demand for
medium-skilled machine operators in iron, steel and metal processing
6
industries, manufacture of bricks and glass products, as well as in mining and
construction. At the same time the demand for skilled workers in
manufacturing, such as supervisors, electrical engineers and chemists,
continued to rise (Katz and Margo 2013). Besides increasing economies of scale
from the division of labour on the factory floor, there were gains from trade
following expanded market access as a result of the improvements in transport
and communication. This need for market expansion led to the rapid growth of
a service sector and an increased demand for non-production workers of
different skill levels. There was an increase in employment of unskilled service
workers in recreation, culture and personal services, but also of medium-skilled
and skilled white-collar workers such as office clerks and salespersons in
wholesale and retail and business services such as finance and real estate
(Gordon 2012).
The Second Industrial Revolution had an important impact not only on
employment, but also on wages and wage inequality. Initially, the skill
premium, the earnings of skilled or educated workers relative to less-skilled or
less-educated workers, increased because the supply of skilled workers was
relatively limited. Consequently, from the second half of the 19th
century to the
early 20th
century, wage inequality increased. However, the relative scarcity of
skilled workers was gradually squeezed out by the expansion of the high school
and college system, beginning from the early 20th
century in the US, with Europe
lagging a few decades behind, which decreased the skill premium and overall
wage inequality between 1915 and 1980 (Goldin and Katz 2008).
2.3 Evidence of changes in the job structure before 1980
This section provides empirical evidence in support of the relative employment
impacts of the First and Second Industrial Revolutions. The summarized data
are taken from Katz and Margo (2013) for the US, but their findings seem
similar to those for other industrializing economies. In their paper, Katz and
Margo (2013) document the transition in manufacturing from the artisanal shop
to larger manufacturing plants between 1850 and 1880, and how the First and
Second Industrial Revolutions led to skill-upgrading in the overall economy from
1850 to 1980. First the period 1850-1880 is discussed, then the period 1920-
1980.
1850-1880
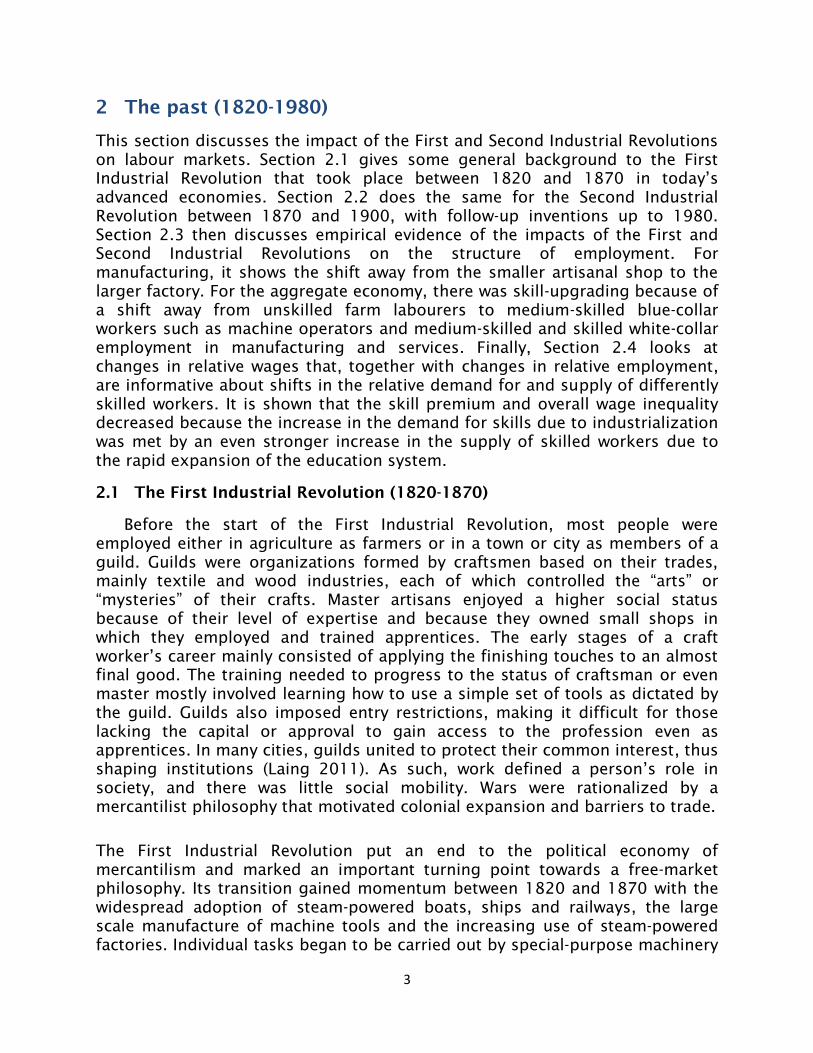
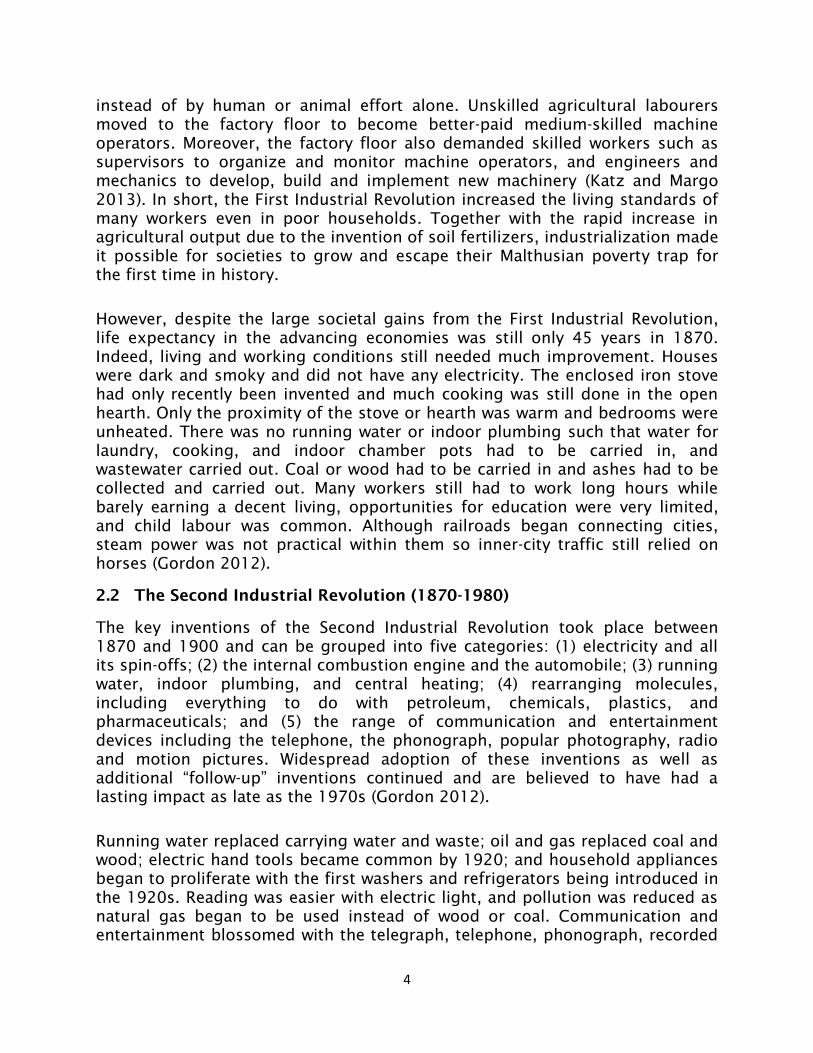
Firstly, Panel A of Figure 1 uses the US Census of Manufacturing from 1850 and
1880 to show the percentage change in the capital-labour ratio by the size (in
terms of employment) of manufacturing plants. Because of the widespread
adoption of steam-powered machinery in the second half of the 19th
century,
one would expect to see an increase over time in the average capital-labour
7
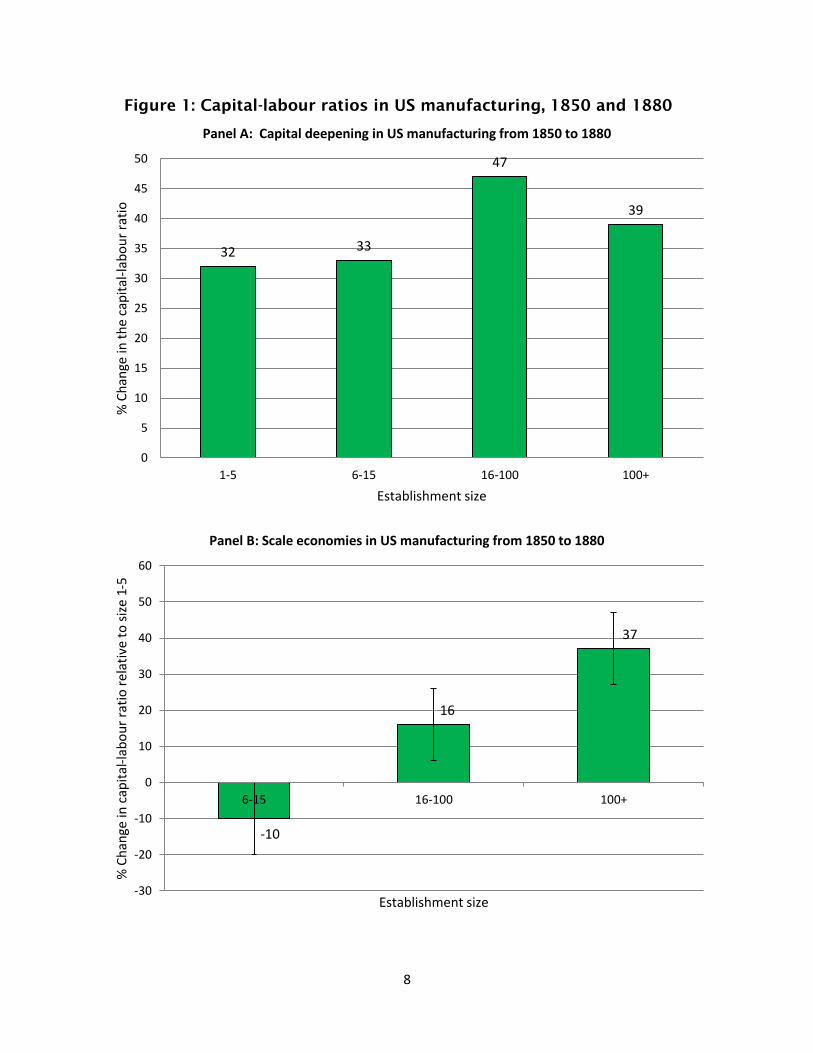
ratio, a process also known as capital deepening. Panel A shows that capital
deepening indeed took place between 1850 and 1880. For example, the capital-
labour ratio in plants employing 1 to 5 employees increased by 32% over this
period. Moreover, one would also expect there to be economies of scale from
industrialization resulting in more capital deepening in larger plants. Panel B of
Figure 1 therefore shows the amount of capital deepening for firms of different
sizes relative to the amount of capital deepening observed in the smallest
firms. The reported percentage point differences monitor, for example, the
firm’s location or sector, so that they capture differences in capital deepening
that are most probably explained by changes in production technologies, such
as the introduction of machinery and the division of labour on the factory floor.
Panel B shows that, in plants employing 16 to 100 employees, the capital-labour
ratio increased 16 percentage points faster than in smaller plants employing 1-
5 employees. For firms with more than 100 employees, this difference stands at
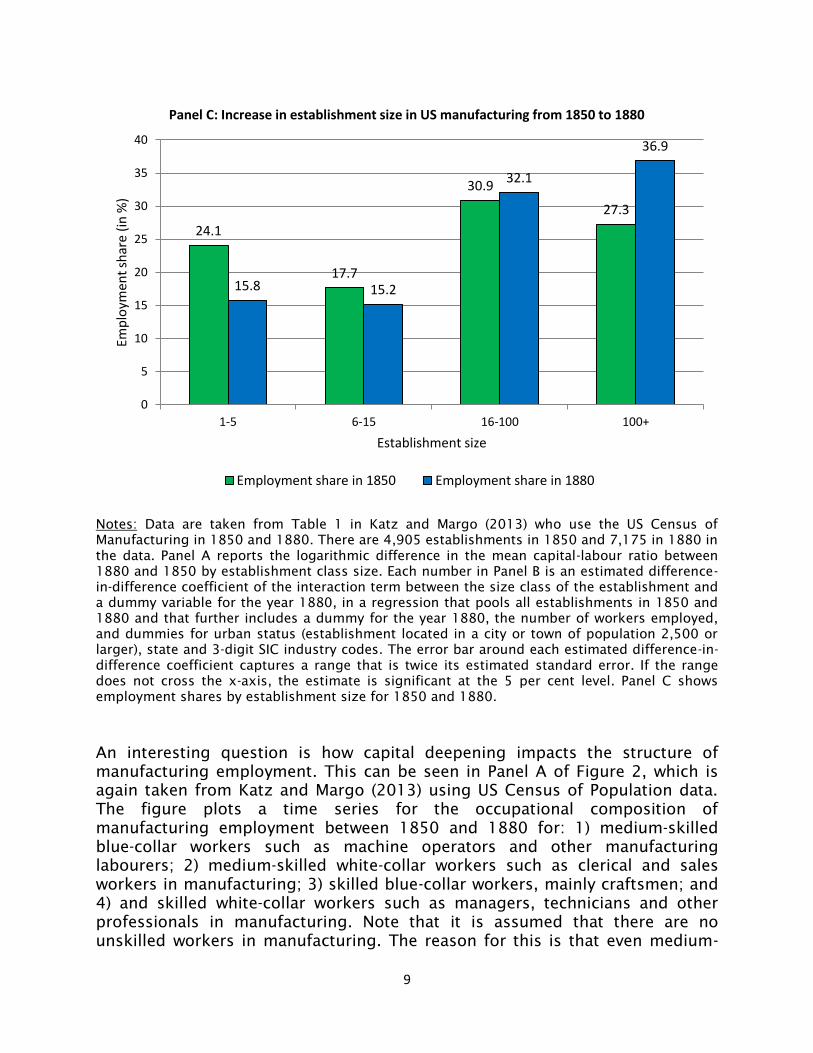
an even larger 37%. Finally, Panel C of Figure 1 provides further evidence in
support of the view that the First and Second Industrial Revolutions changed
the business landscape and organization of production. The panel shows that
employment became increasingly concentrated in larger establishments,
indicative of an important shift from the small artisanal shop towards the larger
factory floor occurring between 1850 and 1880.
8
Figure 1: Capital-labour ratios in US manufacturing, 1850 and 1880
32 33
47
39
0
5
10
15
20
25
30
35
40
45
50
1-5 6-15 16-100 100+
% C
han
ge in
th
e ca
pit
al-l
abo
ur
rati
o
Establishment size
Panel A: Capital deepening in US manufacturing from 1850 to 1880
-10
16
37
-30
-20
-10
0
10
20
30
40
50
60
6-15 16-100 100+
% C
han
ge in
cap
ital
-lab
ou
r ra
tio
re
lati
ve t
o s
ize
1-5
Establishment size
Panel B: Scale economies in US manufacturing from 1850 to 1880
9
Notes: Data are taken from Table 1 in Katz and Margo (2013) who use the US Census of
Manufacturing in 1850 and 1880. There are 4,905 establishments in 1850 and 7,175 in 1880 in
the data. Panel A reports the logarithmic difference in the mean capital-labour ratio between
1880 and 1850 by establishment class size. Each number in Panel B is an estimated difference-
in-difference coefficient of the interaction term between the size class of the establishment and
a dummy variable for the year 1880, in a regression that pools all establishments in 1850 and
1880 and that further includes a dummy for the year 1880, the number of workers employed,
and dummies for urban status (establishment located in a city or town of population 2,500 or
larger), state and 3-digit SIC industry codes. The error bar around each estimated difference-in-
difference coefficient captures a range that is twice its estimated standard error. If the range
does not cross the x-axis, the estimate is significant at the 5 per cent level. Panel C shows
employment shares by establishment size for 1850 and 1880.
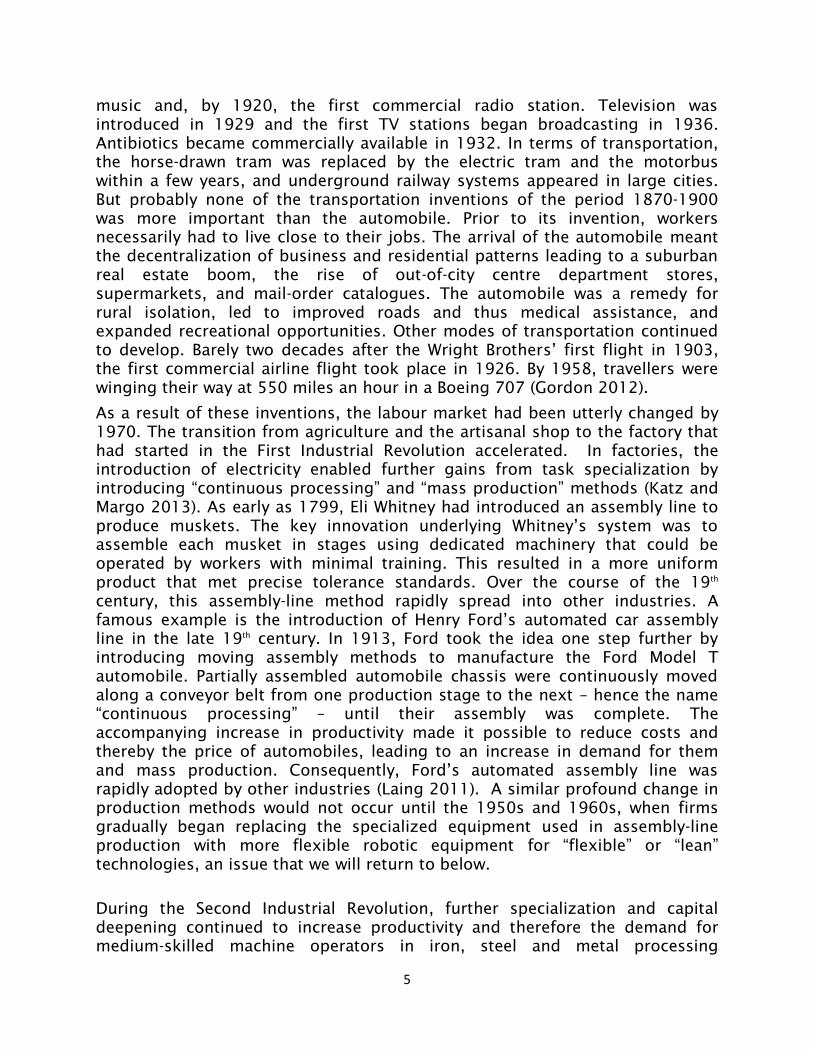
An interesting question is how capital deepening impacts the structure of
manufacturing employment. This can be seen in Panel A of Figure 2, which is
again taken from Katz and Margo (2013) using US Census of Population data.
The figure plots a time series for the occupational composition of
manufacturing employment between 1850 and 1880 for: 1) medium-skilled
blue-collar workers such as machine operators and other manufacturing
labourers; 2) medium-skilled white-collar workers such as clerical and sales
workers in manufacturing; 3) skilled blue-collar workers, mainly craftsmen; and
4) and skilled white-collar workers such as managers, technicians and other
professionals in manufacturing. Note that it is assumed that there are no
unskilled workers in manufacturing. The reason for this is that even medium-
24.1
17.7
30.9
27.3
15.8 15.2
32.1
36.9
0
5
10
15
20
25
30
35
40
1-5 6-15 16-100 100+
Emp
loym
ent
shar
e (i
n %
)
Establishment size
Panel C: Increase in establishment size in US manufacturing from 1850 to 1880
Employment share in 1850 Employment share in 1880
10
skilled blue-collar machine operators, the least skilled among manufacturing
workers, require some, albeit limited, training. This makes the least skilled
manufacturing workers more skilled than unskilled service workers and farm
labourers. These latter categories will be added later when non-manufacturing
employment is included to look at employment changes for the aggregate
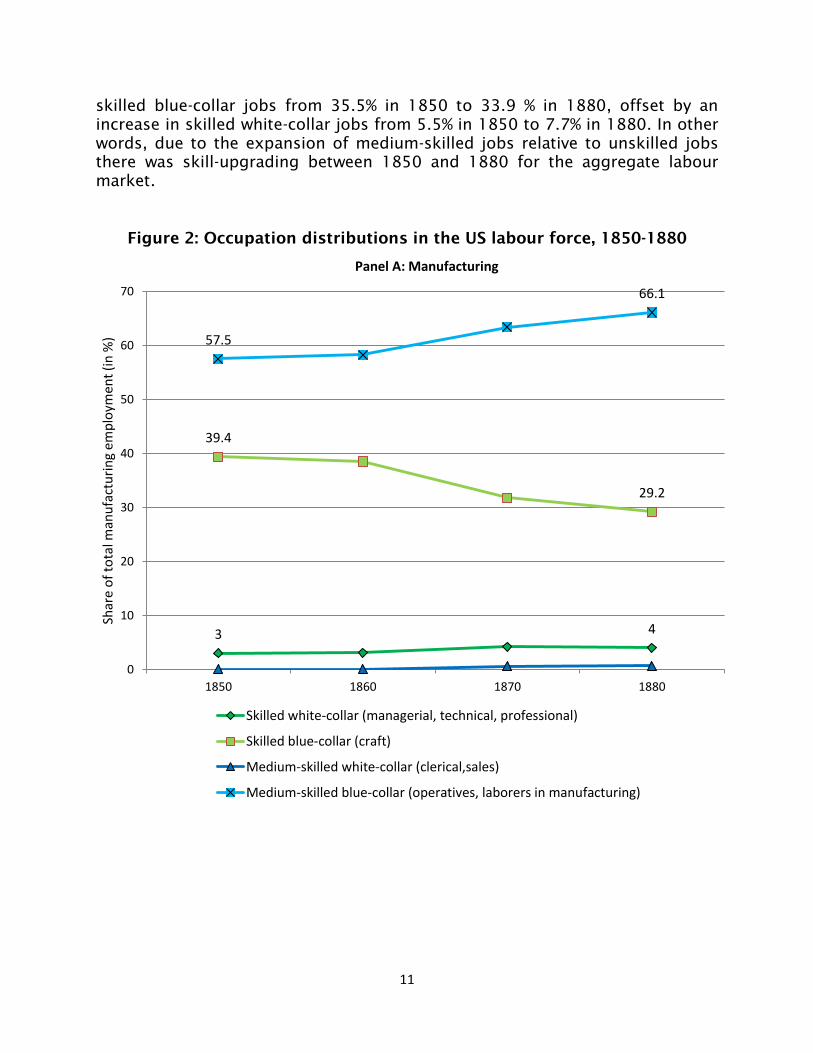
economy. Panel A of Figure 2 shows that, of all manufacturing workers in 1850,
3% were skilled white-collar (managers, technicians and other professionals),
39.4% were skilled blue-collar (craftsmen), 0.1% were medium-skilled white-
collar (clerical and sales) and 57.5% were medium-skilled blue-collar workers
(machine operators and other manufacturing). By 1880, these numbers were
4.7%, 29.2%, 0.7% and 67.8% respectively. That is, the employment share of
skilled white-collar but also of medium-skilled jobs increased, at the expense of
skilled blue-collar jobs paying middling wages in manufacturing. These findings
support the hypothesis that technological progress in the 19th
century increased
the relative demand for medium-skilled machine operators, clerical and sales
workers compared with skilled blue-collar craftsmen. Although this suggests
that there was de-skilling in manufacturing, Katz and Margo (2013) also point
to the relative increase in skilled white-collar employment and suggest that a
more nuanced view would be to say that manufacturing employment was
“hollowing-out” rather than “de-skilling”.
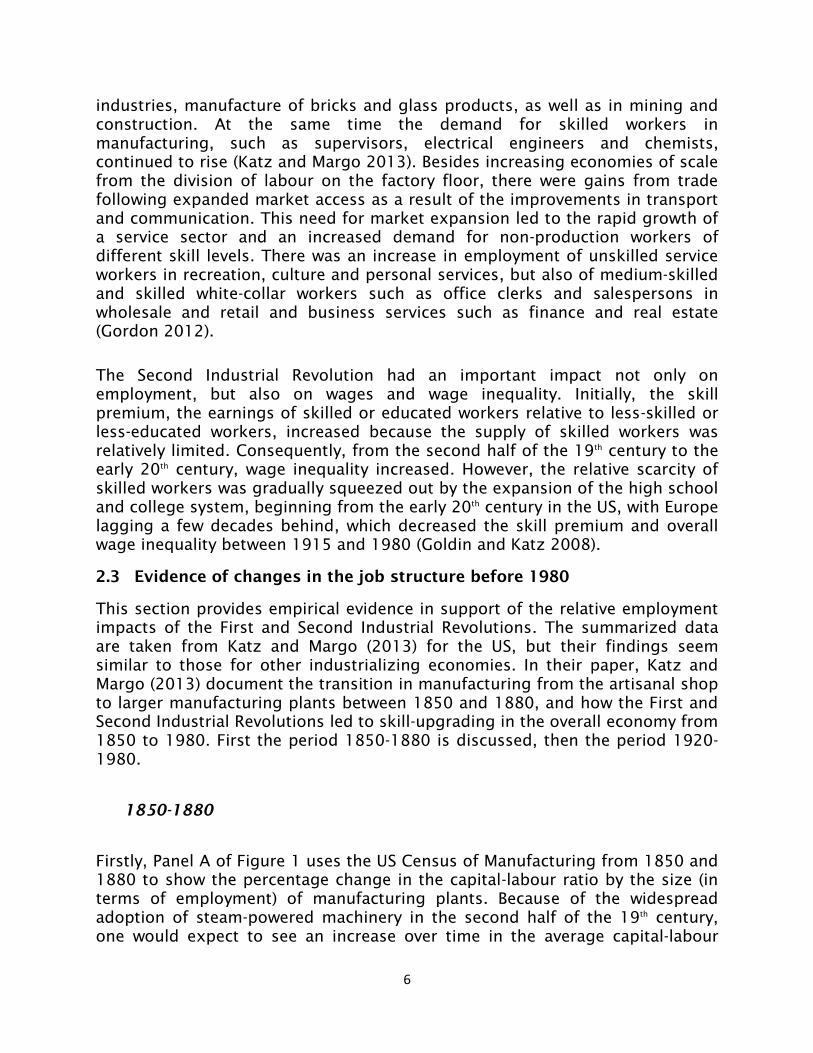
The hollowing-out of manufacturing employment between 1850 and 1880,
however, does not mean this must also be true for the economy as a whole. In
particular, we argue above that the second half of the 19th
century was also
characterized by the rise of a service sector. This created jobs for unskilled
service workers (in recreation, culture and personal services), medium-skilled
white-collar workers in services (clerical and sales occupations in services), and
skilled white-collar workers in business services (finance and real estate).
Moreover, in 1850 most workers were still employed in agriculture, and the
expansion of large manufacturing plants and the service sector provided many
with the opportunity of moving into better-paid jobs. To see this more clearly,
Panel B of Figure 2 adds jobs in services and agriculture to the analysis of the
manufacturing sector in Panel A. More specifically, it reworks data reported in
Katz and Margo (2013) to add unskilled service workers and unskilled farm
labourers as separate occupation groups; clerical and sales workers in services
are added to the group of medium-skilled white-collar employment; skilled
farmers are added to the group of skilled blue-collar jobs; and skilled service
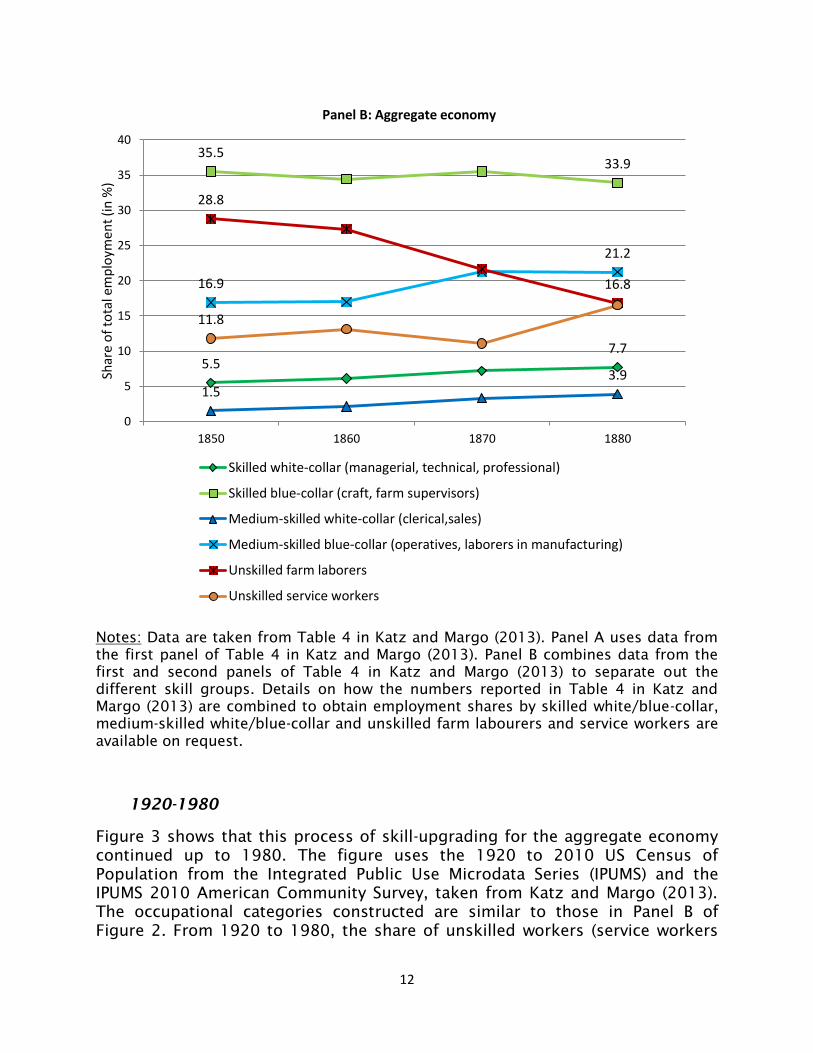
workers are included in the skilled white-collar category. Panel B clearly shows
that, for the economy as a whole, technological progress between 1850 and
1880 led to skill-upgrading: Despite the increase in unskilled service jobs from
11.8% in 1850 to 16.5% in 1880, the share of unskilled workers as a whole fell,
due to the sharp decline in unskilled farm labourers from 28.8% in 1850 to
16.8% in 1880. The share of medium-skilled blue-collar and white-collar jobs
taken together increased from a total of 18.4% in 1850 to 25.1% in 1880,
whereas the share of skilled workers was stable overall due to a decrease in
11
skilled blue-collar jobs from 35.5% in 1850 to 33.9 % in 1880, offset by an
increase in skilled white-collar jobs from 5.5% in 1850 to 7.7% in 1880. In other
words, due to the expansion of medium-skilled jobs relative to unskilled jobs
there was skill-upgrading between 1850 and 1880 for the aggregate labour
market.
Figure 2: Occupation distributions in the US labour force, 1850-1880
3 4
39.4
29.2
57.5
66.1
0
10
20
30
40
50
60
70
1850 1860 1870 1880
Shar
e o
f to
tal m
anu
fact
uri
ng
emp
loym
ent
(in
%)
Panel A: Manufacturing
Skilled white-collar (managerial, technical, professional)
Skilled blue-collar (craft)
Medium-skilled white-collar (clerical,sales)
Medium-skilled blue-collar (operatives, laborers in manufacturing)
12
Notes: Data are taken from Table 4 in Katz and Margo (2013). Panel A uses data from
the first panel of Table 4 in Katz and Margo (2013). Panel B combines data from the
first and second panels of Table 4 in Katz and Margo (2013) to separate out the
different skill groups. Details on how the numbers reported in Table 4 in Katz and
Margo (2013) are combined to obtain employment shares by skilled white/blue-collar,
medium-skilled white/blue-collar and unskilled farm labourers and service workers are
available on request.
1920-1980
Figure 3 shows that this process of skill-upgrading for the aggregate economy
continued up to 1980. The figure uses the 1920 to 2010 US Census of
Population from the Integrated Public Use Microdata Series (IPUMS) and the
IPUMS 2010 American Community Survey, taken from Katz and Margo (2013).
The occupational categories constructed are similar to those in Panel B of
Figure 2. From 1920 to 1980, the share of unskilled workers (service workers
5.5 7.7
35.5 33.9
1.5 3.9
16.9
21.2
28.8
16.8
11.8
0
5
10
15
20
25
30
35
40
1850 1860 1870 1880
Shar
e o
f to
tal e
mp
loym
ent
(in
%)
Panel B: Aggregate economy
Skilled white-collar (managerial, technical, professional)
Skilled blue-collar (craft, farm supervisors)
Medium-skilled white-collar (clerical,sales)
Medium-skilled blue-collar (operatives, laborers in manufacturing)
Unskilled farm laborers
Unskilled service workers
13
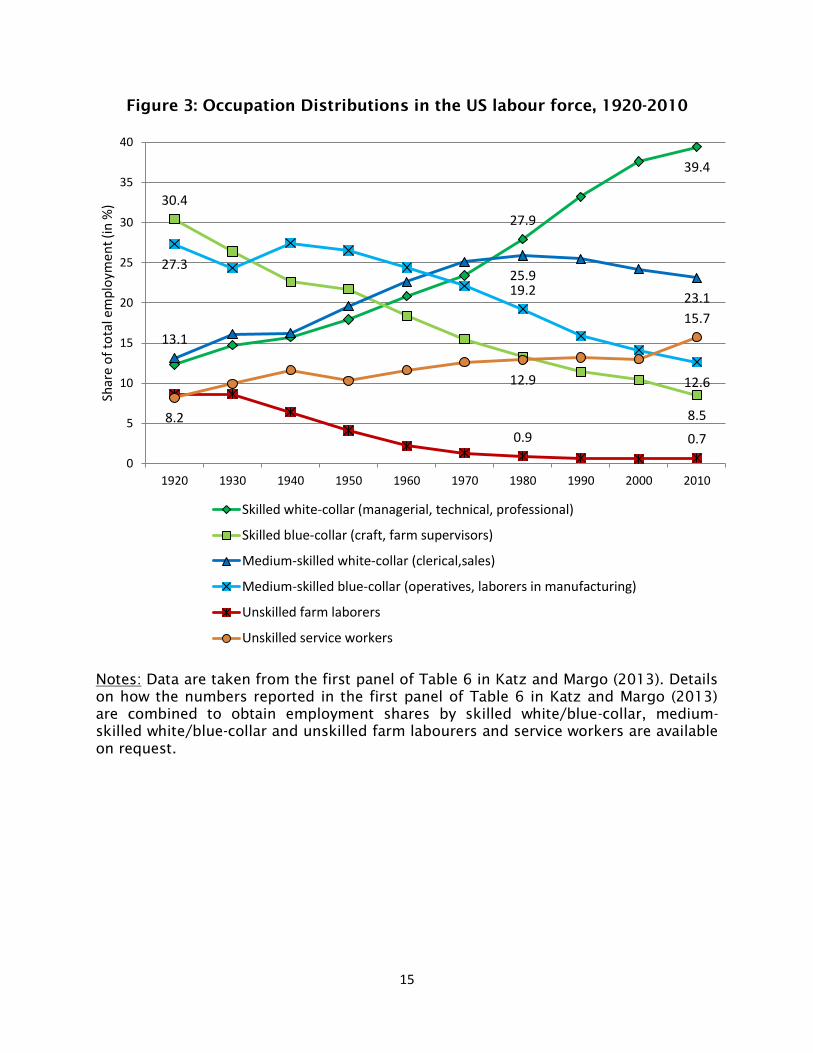
and farm labourers taken together) fell from 16.8% in 1920 to 13.8% in 1980.
The figure also shows that this decline is explained exclusively by the sharp fall
in unskilled farm labourers (from 8.6% in 1920 to 0.9% in 1980) despite the rise
in unskilled service jobs (from 8.2% in 1920 to 12.9% in 1980). Medium-skilled
employment (blue-collar and white-collar taken together) increased from 40.4%
in 1920 to 45.1% in 1980. This rise in medium-skilled jobs was driven by the
steady increase in white-collar clerical and sales jobs from 13.1% in 1920 to
25.9% in 1980 (after which its share fell to 23.1% in 2010, as discussed in
Section 3 below), whereas the employment of medium-skilled blue-collar jobs
was about 27% in both 1920 and 1950 but declined after that to 19.2% in 1980
(and further to 12.6% in 2010, which is another trend change discussed in
Section 3 below). Figure 3 also shows that the relative employment of skilled
workers (blue-collar and white-collar taken together) did not change much
between 1920 and 1980, but that this is the net effect of an important shift of
17.1 percentage points (34.4% in 1920 minus 13.3% in 1980) away from skilled
blue-collar and an increase of 15.6 percentage points (27.9% in 1980 minus
12.3% in 1920) towards skilled white-collar jobs.
In short, the shift from artisanal shops to manufacturing plants provided many
unskilled farm labourers with the opportunity to move into medium-skilled blue
collar jobs such as machine operators. Together with an increase in medium-
skilled and skilled white-collar employment in manufacturing and services,
industrialization led to skill-upgrading in the aggregate economy.
2.4 Evidence of changes in relative wages before 1980
One way to see whether skill-upgrading is mainly because of an increase in the
relative demand for skills due to industrialization, or because of an increase in
the relative supply of skilled workers, is to combine relative employment with
wage changes using a simple supply-demand framework. This is what this
section does. First the period 1850-1915 is discussed, then the period 1915-
1980.
1850-1915
Panel B of Figure 2 shows that there was skill-upgrading in aggregate
employment between 1850 and 1880. To know whether this skill-upgrading
was driven mainly by an increase in the relative demand for skilled workers, due
to industrialization, or by an increase in the relative supply of skilled workers,
due to education, one can look at the skill premium. The assumption is simple:
the skill premium increases if growth in demand for skilled workers outpaces
growth in supply. Conversely, the skill premium falls if growth in the supply of
skilled workers outpaces growth in demand for it. That is to say, we can use a
simple supply-demand framework to get a better understanding of the drivers
of skill-upgrading and changes in the skill premium or wage inequality.
14
One difficulty in doing this for years before 1915 is obtaining good information
on wages. Some evidence is found in Katz and Margo (2013) who use the
Reports of Persons and Articles Hired for army forts in the US to generate a
time series of wages for unskilled workers, skilled artisans, and medium-skilled
clerical workers between 1866 and 1880. Their estimates suggest that wages of
clerical workers increased relative to wages of unskilled workers and skilled
artisans. Together with the increase in clerical employment compared with
skilled artisans and unskilled workers shown in Panel B of Figure 2, this
suggests that the increase in the relative demand for clerical workers, due to
industrialization, outpaced supply in the second half of the 19th
century.
However, the wage data analysed in Katz and Margo (2013) also have some
important limitations. Firstly, the Census employment data presented in Figure
2 are more comprehensive than the wage data derived from army fort reports.
For example, child and female labour were important in the civilian labour
market but not at army forts. Secondly, the economic organization of forts was
not the same as, for example, the typical manufacturing establishment and
therefore wages paid at forts might not be good proxies for civilian labour
market conditions. Better wage data are available for years after 1915, but then
the forces of supply and demand probably also changed, as we discuss next.
1915-1980
From 1915 until 1980 there was further skill-upgrading in the aggregate
economy, as shown in Figure 3. However, in contrast to the years before 1915,
the skill premium fell between 1915 and 1950, increased in the 1950s and
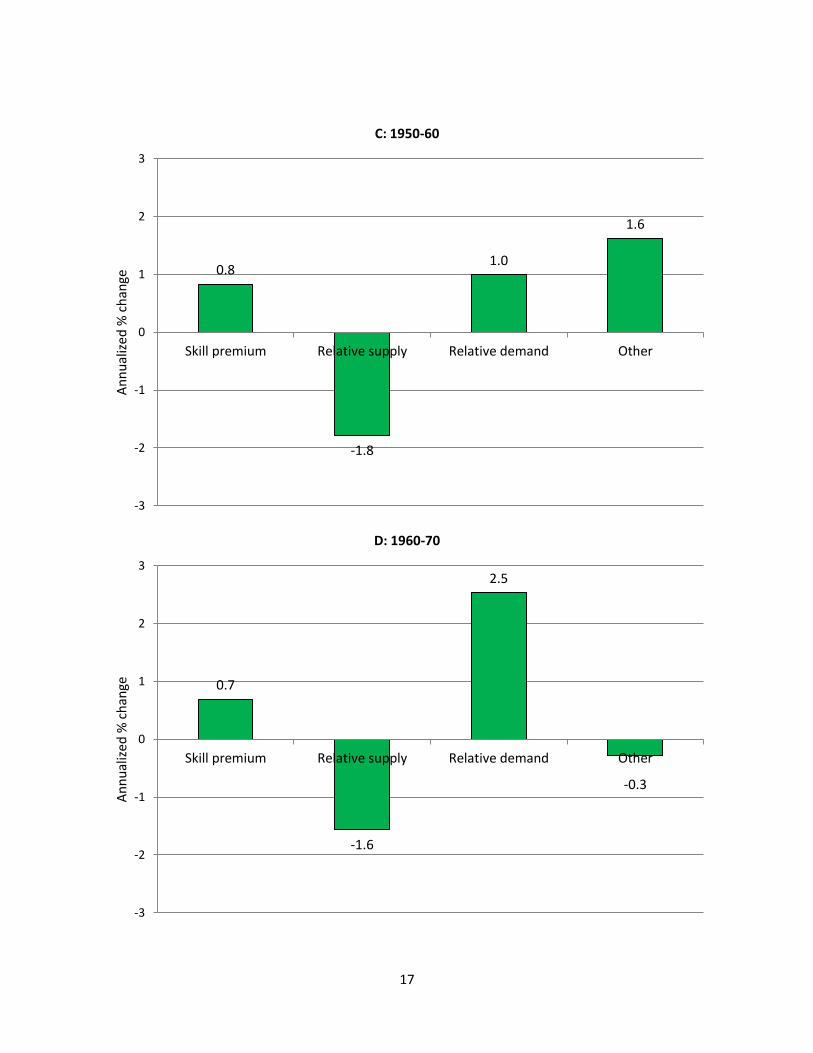
1960s, and fell again in the 1970s, at least in the US. To illustrate this, Figure 4
uses the US 1915 Iowa State Census, the IPUMS 1940 to 2000 Census, and the
1980 to 2005 CPS MORG taken from Goldin and Katz (2008). The first bar in
every panel shows the annualized percentage change in the skill premium
which is the ratio of the average wage of college over non-college workers. For
example, between 1915 and 1940, the skill premium fell by 14% over 25 years
or 0.6% annually. In the 1940s the skill premium decreased at an even faster
pace of 1.9% annually, whereas in the 1950s and 1960s it increased at an
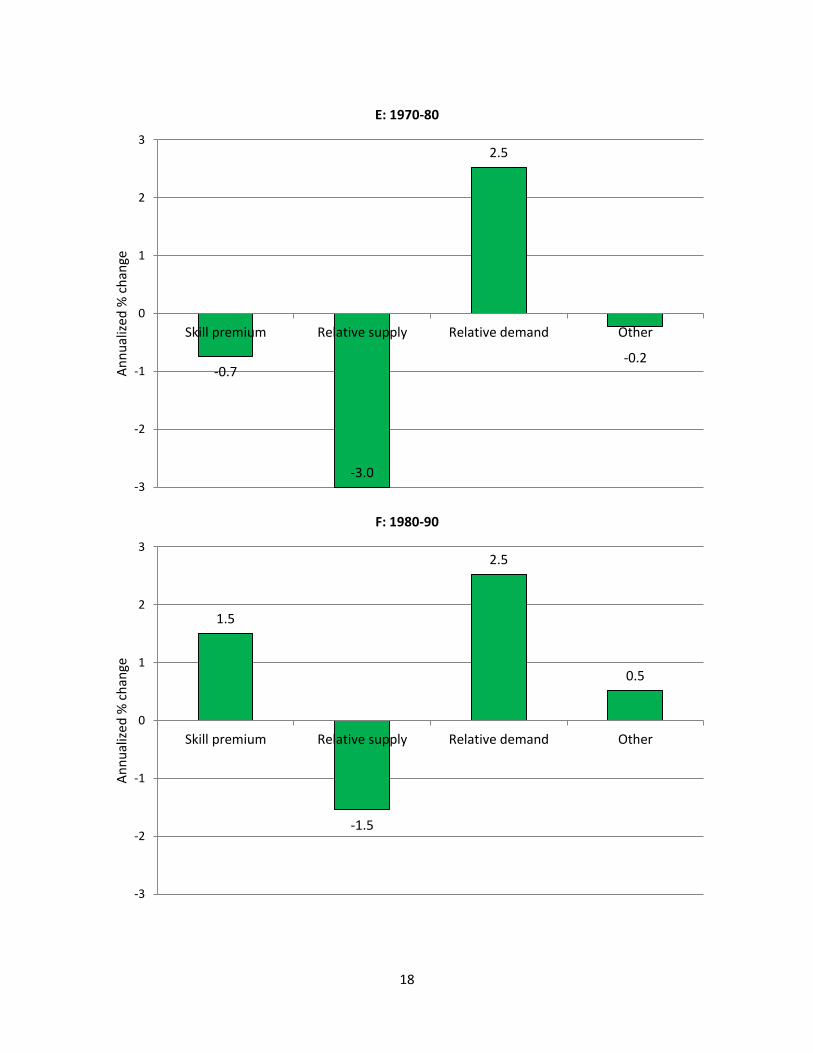
annual rate of 0.8% and 0.7%, respectively. In the 1970s the skill premium fell
by 0.7% per year, after which it increased rapidly at an annual rate of 1.5% in
the 1980s and somewhat slower afterwards.
15
Figure 3: Occupation Distributions in the US labour force, 1920-2010
Notes: Data are taken from the first panel of Table 6 in Katz and Margo (2013). Details
on how the numbers reported in the first panel of Table 6 in Katz and Margo (2013)
are combined to obtain employment shares by skilled white/blue-collar, medium-
skilled white/blue-collar and unskilled farm labourers and service workers are available
on request.
27.9
39.4
30.4
8.5
13.1
25.9
23.1
27.3
19.2
12.6
0.9 0.7
8.2
12.9
15.7
0
5
10
15
20
25
30
35
40
1920 1930 1940 1950 1960 1970 1980 1990 2000 2010
Shar
e o
f to
tal e
mp
loym
ent
(in
%)
Skilled white-collar (managerial, technical, professional)
Skilled blue-collar (craft, farm supervisors)
Medium-skilled white-collar (clerical,sales)
Medium-skilled blue-collar (operatives, laborers in manufacturing)
Unskilled farm laborers
Unskilled service workers

16
Figure 4: The US skill premium, relative supply and demand, and
institutions, 1915-2005
-0.6
-1.9
1.0
0.4
-3
-2
-1
0
1
2
3
Skill premium Relative supply Relative demand Other
An
nu
aliz
ed %
ch
ange
A: 1915-40
-1.9
-1.4
1.0
-1.4
-3
-2
-1
0
1
2
3
Skill premium Relative supply Relative demand Other
An
nu
aliz
ed %
ch
ange
B: 1940-50
17
0.8
-1.8
1.0
1.6
-3
-2
-1
0
1
2
3
Skill premium Relative supply Relative demand Other
An
nu
aliz
ed %
ch
ange
C: 1950-60
0.7
-1.6
2.5
-0.3
-3
-2
-1
0
1
2
3
Skill premium Relative supply Relative demand Other
An
nu
aliz
ed %
ch
ange
D: 1960-70
18
-0.7
-3.0
2.5
-0.2
-3
-2
-1
0
1
2
3
Skill premium Relative supply Relative demand Other
An
nu
aliz
ed %
ch
ange
E: 1970-80
1.5
-1.5
2.5
0.5
-3
-2
-1
0
1
2
3
Skill premium Relative supply Relative demand Other
An
nu
aliz
ed %
ch
ange
F: 1980-90
19
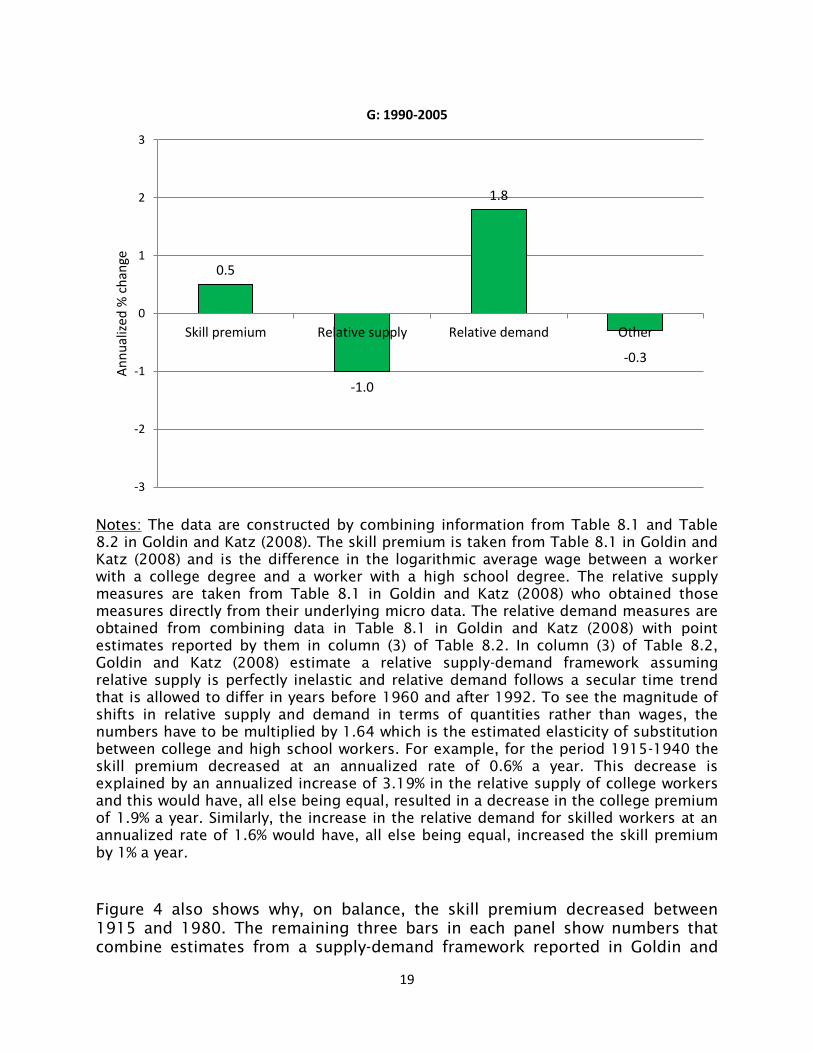
Notes: The data are constructed by combining information from Table 8.1 and Table
8.2 in Goldin and Katz (2008). The skill premium is taken from Table 8.1 in Goldin and
Katz (2008) and is the difference in the logarithmic average wage between a worker
with a college degree and a worker with a high school degree. The relative supply
measures are taken from Table 8.1 in Goldin and Katz (2008) who obtained those
measures directly from their underlying micro data. The relative demand measures are
obtained from combining data in Table 8.1 in Goldin and Katz (2008) with point
estimates reported by them in column (3) of Table 8.2. In column (3) of Table 8.2,
Goldin and Katz (2008) estimate a relative supply-demand framework assuming
relative supply is perfectly inelastic and relative demand follows a secular time trend
that is allowed to differ in years before 1960 and after 1992. To see the magnitude of
shifts in relative supply and demand in terms of quantities rather than wages, the
numbers have to be multiplied by 1.64 which is the estimated elasticity of substitution
between college and high school workers. For example, for the period 1915-1940 the
skill premium decreased at an annualized rate of 0.6% a year. This decrease is
explained by an annualized increase of 3.19% in the relative supply of college workers
and this would have, all else being equal, resulted in a decrease in the college premium
of 1.9% a year. Similarly, the increase in the relative demand for skilled workers at an
annualized rate of 1.6% would have, all else being equal, increased the skill premium
by 1% a year.
Figure 4 also shows why, on balance, the skill premium decreased between
1915 and 1980. The remaining three bars in each panel show numbers that
combine estimates from a supply-demand framework reported in Goldin and
0.5
-1.0
1.8
-0.3
-3
-2
-1
0
1
2
3
Skill premium Relative supply Relative demand Other
An
nu
aliz
ed %
ch
ange
G: 1990-2005
20
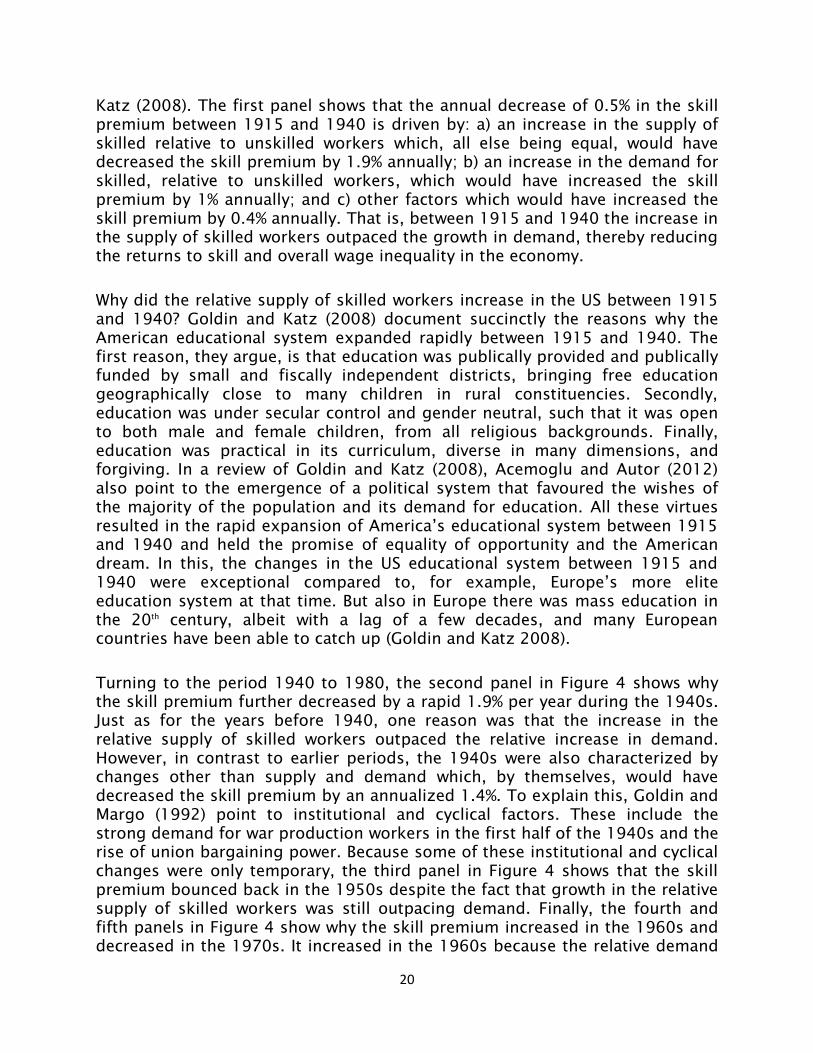
Katz (2008). The first panel shows that the annual decrease of 0.5% in the skill
premium between 1915 and 1940 is driven by: a) an increase in the supply of
skilled relative to unskilled workers which, all else being equal, would have
decreased the skill premium by 1.9% annually; b) an increase in the demand for
skilled, relative to unskilled workers, which would have increased the skill
premium by 1% annually; and c) other factors which would have increased the
skill premium by 0.4% annually. That is, between 1915 and 1940 the increase in
the supply of skilled workers outpaced the growth in demand, thereby reducing
the returns to skill and overall wage inequality in the economy.
Why did the relative supply of skilled workers increase in the US between 1915
and 1940? Goldin and Katz (2008) document succinctly the reasons why the
American educational system expanded rapidly between 1915 and 1940. The
first reason, they argue, is that education was publically provided and publically
funded by small and fiscally independent districts, bringing free education
geographically close to many children in rural constituencies. Secondly,
education was under secular control and gender neutral, such that it was open
to both male and female children, from all religious backgrounds. Finally,
education was practical in its curriculum, diverse in many dimensions, and
forgiving. In a review of Goldin and Katz (2008), Acemoglu and Autor (2012)
also point to the emergence of a political system that favoured the wishes of
the majority of the population and its demand for education. All these virtues
resulted in the rapid expansion of America’s educational system between 1915
and 1940 and held the promise of equality of opportunity and the American
dream. In this, the changes in the US educational system between 1915 and
1940 were exceptional compared to, for example, Europe’s more elite
education system at that time. But also in Europe there was mass education in
the 20th
century, albeit with a lag of a few decades, and many European
countries have been able to catch up (Goldin and Katz 2008).
Turning to the period 1940 to 1980, the second panel in Figure 4 shows why
the skill premium further decreased by a rapid 1.9% per year during the 1940s.
Just as for the years before 1940, one reason was that the increase in the
relative supply of skilled workers outpaced the relative increase in demand.
However, in contrast to earlier periods, the 1940s were also characterized by
changes other than supply and demand which, by themselves, would have
decreased the skill premium by an annualized 1.4%. To explain this, Goldin and
Margo (1992) point to institutional and cyclical factors. These include the
strong demand for war production workers in the first half of the 1940s and the
rise of union bargaining power. Because some of these institutional and cyclical
changes were only temporary, the third panel in Figure 4 shows that the skill
premium bounced back in the 1950s despite the fact that growth in the relative
supply of skilled workers was still outpacing demand. Finally, the fourth and
fifth panels in Figure 4 show why the skill premium increased in the 1960s and
decreased in the 1970s. It increased in the 1960s because the relative demand
21
for skilled workers accelerated, whereas it decreased in the 1970s following a
large increase in the relative supply of skilled workers.
To sum up, between 1915 and 1980, skill-upgrading resulted from increases in
the relative demand for skills due to industrialization, but also from increases
in the relative supply of skilled workers due to an expansion of the education
system. From 1915 to 1960, growth in the relative supply of skilled workers
outpaced the increase in demand for it, thereby decreasing the skill premium
and overall wage inequality. This decrease was amplified during the so-called
Great Compression of the 1940s, when institutional factors were also at play,
followed by a partial reversal of their impact in the 1950s. The 1960s were
characterized by stronger growth in the relative demand for skill thereby
increasing the skill premium, whereas in the 1970s the skill premium fell
because of exceptionally strong growth in the relative supply of educated
workers. Overall, the skill-premium fell between 1915 and 1980, thereby
reducing overall wage inequality.
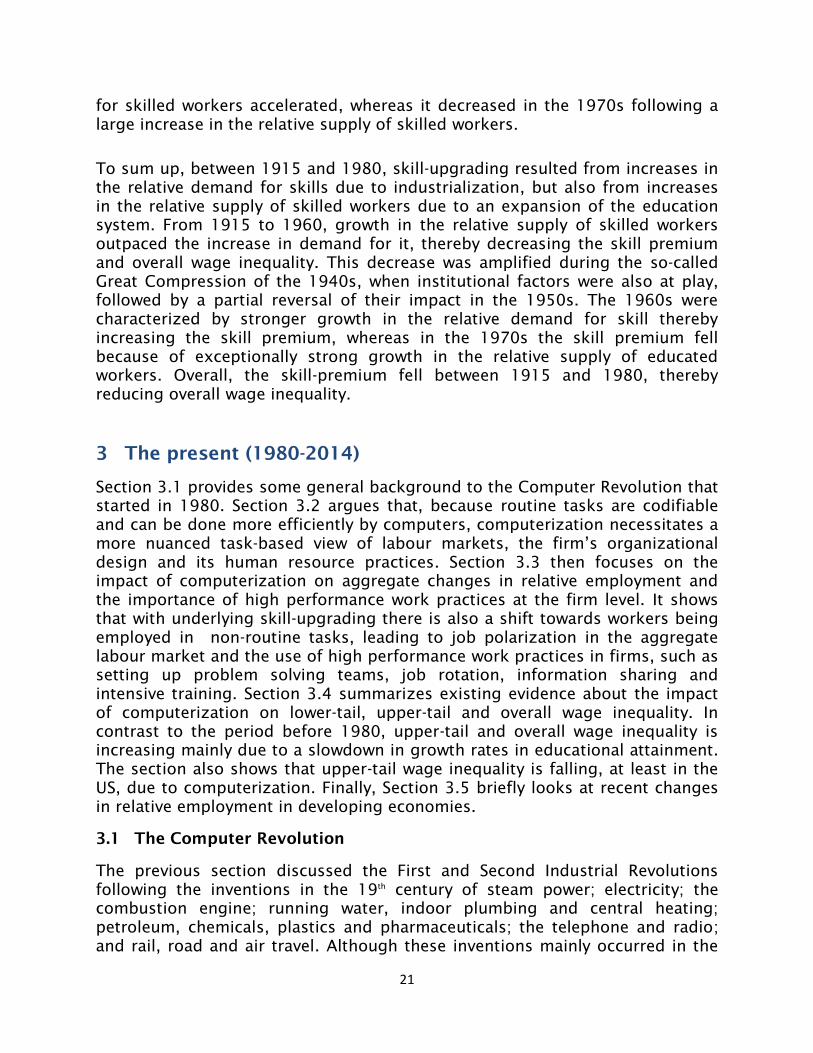
3 The present (1980-2014)
Section 3.1 provides some general background to the Computer Revolution that
started in 1980. Section 3.2 argues that, because routine tasks are codifiable
and can be done more efficiently by computers, computerization necessitates a
more nuanced task-based view of labour markets, the firm’s organizational
design and its human resource practices. Section 3.3 then focuses on the
impact of computerization on aggregate changes in relative employment and
the importance of high performance work practices at the firm level. It shows
that with underlying skill-upgrading there is also a shift towards workers being
employed in non-routine tasks, leading to job polarization in the aggregate
labour market and the use of high performance work practices in firms, such as
setting up problem solving teams, job rotation, information sharing and
intensive training. Section 3.4 summarizes existing evidence about the impact
of computerization on lower-tail, upper-tail and overall wage inequality. In
contrast to the period before 1980, upper-tail and overall wage inequality is
increasing mainly due to a slowdown in growth rates in educational attainment.
The section also shows that upper-tail wage inequality is falling, at least in the
US, due to computerization. Finally, Section 3.5 briefly looks at recent changes
in relative employment in developing economies.
3.1 The Computer Revolution
The previous section discussed the First and Second Industrial Revolutions
following the inventions in the 19th
century of steam power; electricity; the
combustion engine; running water, indoor plumbing and central heating;
petroleum, chemicals, plastics and pharmaceuticals; the telephone and radio;
and rail, road and air travel. Although these inventions mainly occurred in the
22
relatively short time span between 1850 and 1915, most economic historians
believe their impacts lasted up to the 1970s (Gordon 2012). The previous
section also outlined the strong skill-upgrading in employment that took place
between 1850 and 1915 due to an increase in both the supply of and demand
for skilled rather than unskilled workers. Moreover, because growth in the
relative supply of skilled workers, driven by the rapid expansion of the
education system, outpaced growth in demand, the skill premium and therefore
overall inequality fell between the early 20th
century and 1980. Industrialization,
the consequent wage increases for many workers and the compression in wage
dispersion all contributed towards strong economic growth and the rise of a
middle class. But this section shows that, with the arrival of the Computer
Revolution, things changed significantly from the 1980s onwards.
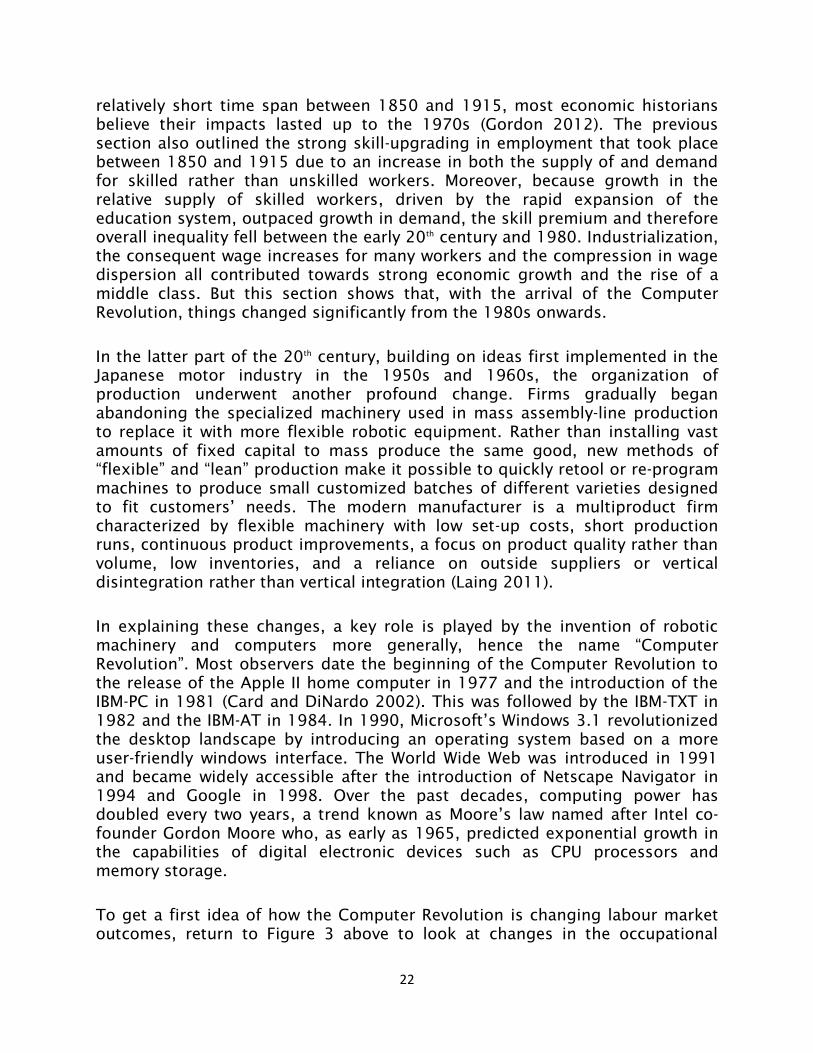
In the latter part of the 20th
century, building on ideas first implemented in the
Japanese motor industry in the 1950s and 1960s, the organization of
production underwent another profound change. Firms gradually began
abandoning the specialized machinery used in mass assembly-line production
to replace it with more flexible robotic equipment. Rather than installing vast
amounts of fixed capital to mass produce the same good, new methods of
“flexible” and “lean” production make it possible to quickly retool or re-program
machines to produce small customized batches of different varieties designed
to fit customers’ needs. The modern manufacturer is a multiproduct firm
characterized by flexible machinery with low set-up costs, short production
runs, continuous product improvements, a focus on product quality rather than
volume, low inventories, and a reliance on outside suppliers or vertical
disintegration rather than vertical integration (Laing 2011).
In explaining these changes, a key role is played by the invention of robotic
machinery and computers more generally, hence the name “Computer
Revolution”. Most observers date the beginning of the Computer Revolution to
the release of the Apple II home computer in 1977 and the introduction of the
IBM-PC in 1981 (Card and DiNardo 2002). This was followed by the IBM-TXT in
1982 and the IBM-AT in 1984. In 1990, Microsoft’s Windows 3.1 revolutionized
the desktop landscape by introducing an operating system based on a more
user-friendly windows interface. The World Wide Web was introduced in 1991
and became widely accessible after the introduction of Netscape Navigator in
1994 and Google in 1998. Over the past decades, computing power has
doubled every two years, a trend known as Moore’s law named after Intel co-
founder Gordon Moore who, as early as 1965, predicted exponential growth in
the capabilities of digital electronic devices such as CPU processors and
memory storage.
To get a first idea of how the Computer Revolution is changing labour market
outcomes, return to Figure 3 above to look at changes in the occupational
23
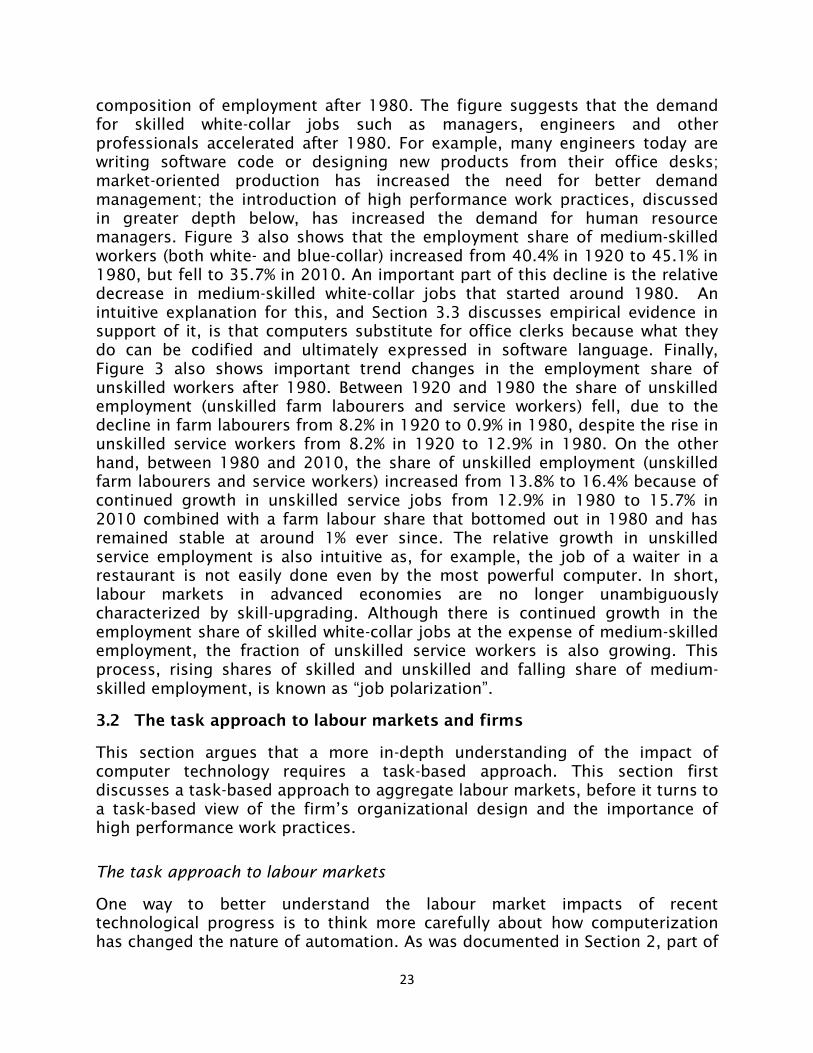
composition of employment after 1980. The figure suggests that the demand
for skilled white-collar jobs such as managers, engineers and other
professionals accelerated after 1980. For example, many engineers today are
writing software code or designing new products from their office desks;
market-oriented production has increased the need for better demand
management; the introduction of high performance work practices, discussed
in greater depth below, has increased the demand for human resource
managers. Figure 3 also shows that the employment share of medium-skilled
workers (both white- and blue-collar) increased from 40.4% in 1920 to 45.1% in
1980, but fell to 35.7% in 2010. An important part of this decline is the relative
decrease in medium-skilled white-collar jobs that started around 1980. An
intuitive explanation for this, and Section 3.3 discusses empirical evidence in
support of it, is that computers substitute for office clerks because what they
do can be codified and ultimately expressed in software language. Finally,
Figure 3 also shows important trend changes in the employment share of
unskilled workers after 1980. Between 1920 and 1980 the share of unskilled
employment (unskilled farm labourers and service workers) fell, due to the
decline in farm labourers from 8.2% in 1920 to 0.9% in 1980, despite the rise in
unskilled service workers from 8.2% in 1920 to 12.9% in 1980. On the other
hand, between 1980 and 2010, the share of unskilled employment (unskilled
farm labourers and service workers) increased from 13.8% to 16.4% because of
continued growth in unskilled service jobs from 12.9% in 1980 to 15.7% in
2010 combined with a farm labour share that bottomed out in 1980 and has
remained stable at around 1% ever since. The relative growth in unskilled
service employment is also intuitive as, for example, the job of a waiter in a
restaurant is not easily done even by the most powerful computer. In short,
labour markets in advanced economies are no longer unambiguously
characterized by skill-upgrading. Although there is continued growth in the
employment share of skilled white-collar jobs at the expense of medium-skilled
employment, the fraction of unskilled service workers is also growing. This
process, rising shares of skilled and unskilled and falling share of medium-
skilled employment, is known as “job polarization”.
3.2 The task approach to labour markets and firms
This section argues that a more in-depth understanding of the impact of
computer technology requires a task-based approach. This section first
discusses a task-based approach to aggregate labour markets, before it turns to
a task-based view of the firm’s organizational design and the importance of
high performance work practices.
The task approach to labour markets
One way to better understand the labour market impacts of recent
technological progress is to think more carefully about how computerization
has changed the nature of automation. As was documented in Section 2, part of
24
the gains from automation in the First and Second Industrial Revolutions came
from the increased employment of medium-skilled blue-collar machine
operators. However, computerization is now displacing these workers because
their tasks can be codified and performed more efficiently by computers.
Moreover, recent automation means that computers can substitute for many of
the routine tasks done by medium-skilled white-collar workers, such as office
clerks. In a nutshell, contrary to the increase in the relative demand for
medium-skilled white-collar and blue-collar jobs in the First and Second
Industrial Revolutions, demand for these jobs is now decreasing because of the
routine nature of the tasks done and the fact that they can be codified and
more efficiently performed by computers.
Whereas computers can substitute for labour in routine tasks, they have
difficulty doing non-routine tasks such as managing a team or waiting tables in
a restaurant. This is because whereas routine tasks are mainly done in middling
jobs by medium-skilled workers, non-routine tasks are concentrated in skilled
white-collar jobs and unskilled service work. So far, computers cannot easily
manage teams or wait tables. This non-monotonic relationship between task-
routineness and skill necessitates a “task approach” to labour markets. In a
task-based framework, workers supply a pre-market set of skills, most notably
their education. Based on their comparative advantage, these workers are then
sorted across jobs that differ in their task demands. Crucially, computerization
changes these task demands and therefore also the sorting of differently skilled
workers across jobs accordingly. Most notably, Autor, Levy and Murnane (2003)
were the first to analyse such a task-based framework and they argue
convincingly, using data from the US, that computers have been displacing
workers from routine tasks. Goos and Manning (2007) then showed that for the
UK this leads to job polarization because computerization decreases the
demand for medium-skilled labour relative to both skilled and unskilled labour.
Some of the results in Autor, Levy and Murnane (2003) and Goos and Manning
(2007) are summarized below. More recently, a number of studies have
successfully used a task approach to get a better understanding of labour
markets. The studies are too numerous to summarize here, but see Autor
(2013) for an overview and some additional references.
Organizational design and high performance work practices
Whereas the task approach is useful to get a better understanding of the
aggregate labour market, computerization is also having profound impacts on
the design of organizations and human resource practices within firms. In a
series of pioneering papers, Milgrom and Roberts (1990, 1995) and Holmstrom
and Milgrom (1994) examine the relationship between a firm’s production
technology and its organizational structure. Specifically, they argue that
important system-wide complementarities exist among various business
activities. For example, assume a firm that initially uses mass-production
25
methods and traditional human resource practices. Next assume that the firm
wants to change from its mass-production technology to a more flexible and
lean production method, perhaps by substituting flexible robotic equipment for
its existing machinery. However, the productivity gains from so doing might be
limited if the firm does not also change the way it organizes its workers. When
the firm was using mass production methods, workers did not require much
training to operate machinery. However, using a more flexible production
method, workers have to be better skilled and cross-trained in order to
understand why machinery operates the way it does and what are its
capabilities. To this end, the firm can implement high performance work
practices such as setting up problem solving teams in which non-managerial
workers participate in problem solving and decision making; job rotation so
that workers are trained to perform a wide variety of different tasks; better
screening of job applicants who have desirable attributes such as the ability to
cooperate with others; information sharing among themselves and their
management; more intensive training to enhance their decision-making and
problem-solving skills; incentive pay and profit sharing; and it can also provide
implicit guarantees of job security to increase worker involvement (Laing 2011).
In short, only by also changing its human resource management will the firm be
able to successfully implement the flexible and lean production methods that
the Computer Revolution allows.
The existence of system-wide complementarities also points to a potential risk
that firms face when implementing new technologies. Because
complementarities are often unknown, wrong investments can easily lead to
failure. For example, Milgrom and Roberts (1995) discuss the failed attempt by
General Motors, once a leading example of mass-production, to emulate the
flexible production systems of its Japanese competitors. In the 1980s, General
Motors spent vast amounts of money on robotic and other capital equipment to
upgrade its assembly line. It did not, however, make equally important
investments in its human resource policies, its decision systems, and other
aspects of its organizational design. Consequently, in the early 1990s General
Motors had assembly lines that should have been the most flexible and lean in
the world but that produced only a single model, while the corporation as a
whole lost money at unprecedented rates (Laing 2011). Similar evidence is
provided in a series of papers that examine differences in human resource
practices across similar steel plants (Ichniowski, Shaw and Prennushi 1997;
Boning, Ichniowski and Shaw 2007; Bartel, Ichniowski and Shaw 2007). A
common theme that emerges from these studies is that a plant’s productivity
positively depends on the presence of high performance work practices, but
also that some plants are slow to adopt these practices because of their
inherent risk of failure.
26
3.3 Evidence of recent changes in relative employment
This section begins by summarizing some existing evidence about the impact
of computerization on the overall employment structure. It then turns to
evidence about the impact of computerization on human resource practices
within firms.
Recent changes in the job structure
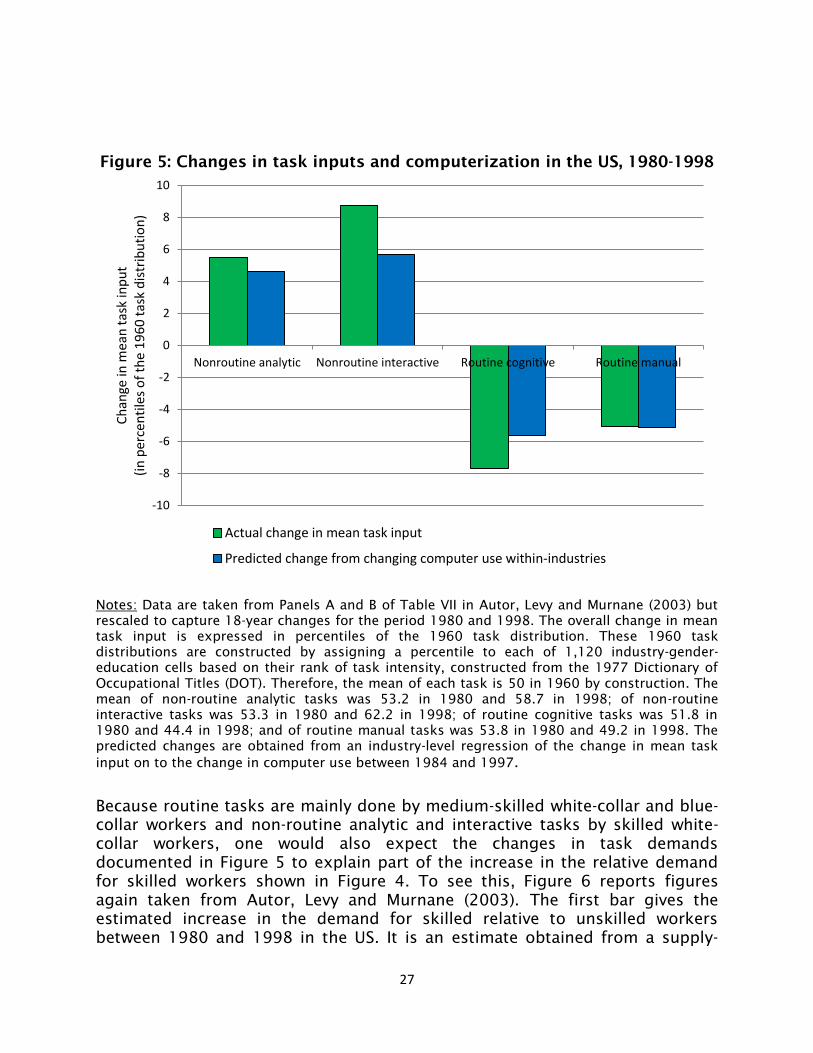
This section summarizes some of the existing empirical evidence about the
impact of computerization on the structure of employment. Figure 5 is
constructed from Autor, Levy and Murnane (2003) and uses the 1977 Dictionary
of Occupational Titles (DOT) to measure the task content of occupations and US
CPS MORG data between 1980 and 1998 to measure employment. Figure 5
shows four different task measures: 1) non-routine analytic tasks are high in
occupations that require high levels of education, and are done by skilled white-
collar workers; 2) non-routine interactive tasks generally capture the degree of
responsibility for direction, control and planning, and are also done by skilled
white-collar workers; 3) routine cognitive tasks extend to occupations that
require the precise attainment of set limits, tolerances or standards, and are
done by medium-skilled white-collar workers; and 4) routine manual tasks
capture the ability to manipulate small objects with fingers, rapidly or
accurately, and are done by medium-skilled blue-collar workers. For each task
measured in Figure 5, the first bar shows the change in its mean between 1980
and 1998. In line with our discussion in Sections 3.1 and 3.2, it is clear from
the figure that there has been a shift away from both types of routine task
(cognitive and manual) towards both types of non-routine task (analytic and
interactive). That is, in 1998 the labour market was assigning workers to very
different and more non-routine tasks than it was in 1980. However, to know
whether this reallocation was mainly driven by technological progress and
changing tasks demands, one would like to relate it to measures of
computerization. This is done in the second bar for each task measure in Figure
5. Here, the changes in mean task inputs predicted from a regression of task
changes on to changes in computer use within industries are reported. These
second bars are close to the first bars in Figure 5, suggesting that computers
adopted in most industries in the 1980s or 1990s indeed left workers doing
less routine and more non-routine tasks. Similar shifts in task demands within
industries have also been found for other countries (Michaels, Natraj and Van
Reenen, 2013). To summarize, as computers have increasingly been adopted in
our workspaces, they have taken over many of the routine tasks, leaving
workers to perform non-routine tasks.
27
Figure 5: Changes in task inputs and computerization in the US, 1980-1998
Notes: Data are taken from Panels A and B of Table VII in Autor, Levy and Murnane (2003) but
rescaled to capture 18-year changes for the period 1980 and 1998. The overall change in mean
task input is expressed in percentiles of the 1960 task distribution. These 1960 task
distributions are constructed by assigning a percentile to each of 1,120 industry-gender-
education cells based on their rank of task intensity, constructed from the 1977 Dictionary of
Occupational Titles (DOT). Therefore, the mean of each task is 50 in 1960 by construction. The
mean of non-routine analytic tasks was 53.2 in 1980 and 58.7 in 1998; of non-routine
interactive tasks was 53.3 in 1980 and 62.2 in 1998; of routine cognitive tasks was 51.8 in
1980 and 44.4 in 1998; and of routine manual tasks was 53.8 in 1980 and 49.2 in 1998. The
predicted changes are obtained from an industry-level regression of the change in mean task
input on to the change in computer use between 1984 and 1997.
Because routine tasks are mainly done by medium-skilled white-collar and blue-
collar workers and non-routine analytic and interactive tasks by skilled white-
collar workers, one would also expect the changes in task demands
documented in Figure 5 to explain part of the increase in the relative demand
for skilled workers shown in Figure 4. To see this, Figure 6 reports figures
again taken from Autor, Levy and Murnane (2003). The first bar gives the
estimated increase in the demand for skilled relative to unskilled workers
between 1980 and 1998 in the US. It is an estimate obtained from a supply-
-10
-8
-6
-4
-2
0
2
4
6
8
10
Nonroutine analytic Nonroutine interactive Routine cognitive Routine manual
Ch
ange
in m
ean
tas
k in
pu
t
(in
per
cen
tile
s o
f th
e 1
96
0 t
ask
dis
trib
uti
on
)
Actual change in mean task input
Predicted change from changing computer use within-industries
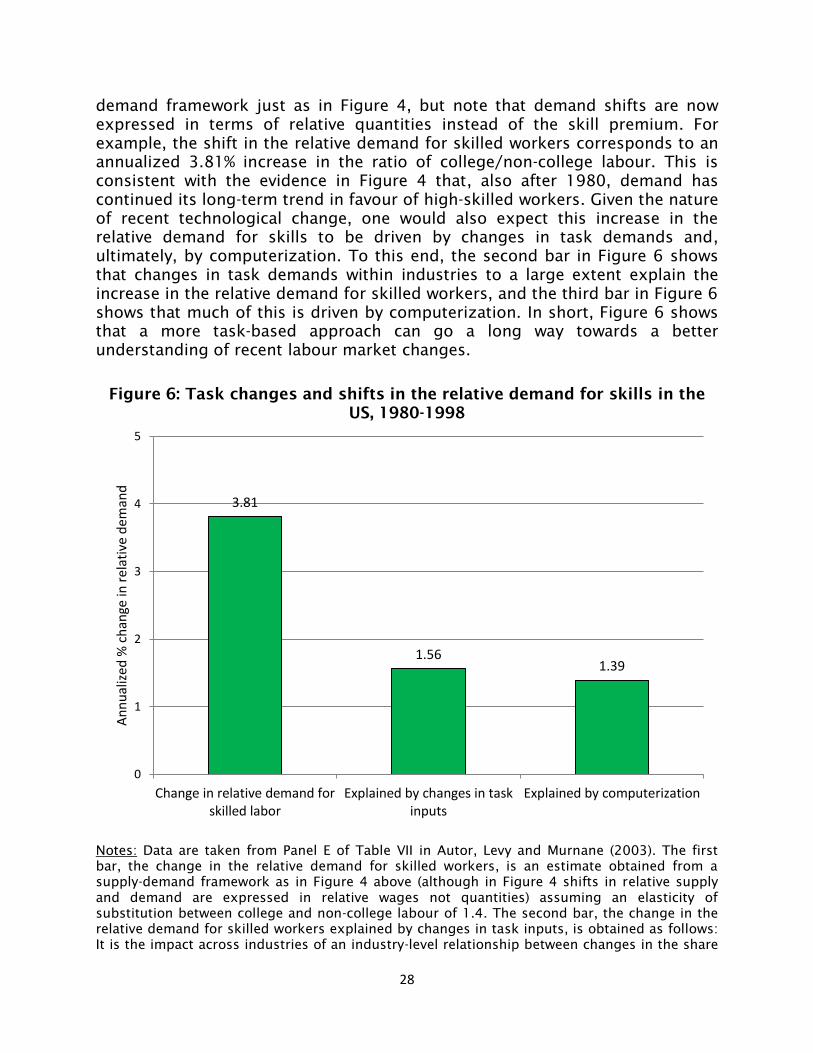
28
demand framework just as in Figure 4, but note that demand shifts are now
expressed in terms of relative quantities instead of the skill premium. For
example, the shift in the relative demand for skilled workers corresponds to an
annualized 3.81% increase in the ratio of college/non-college labour. This is
consistent with the evidence in Figure 4 that, also after 1980, demand has
continued its long-term trend in favour of high-skilled workers. Given the nature
of recent technological change, one would also expect this increase in the
relative demand for skills to be driven by changes in task demands and,
ultimately, by computerization. To this end, the second bar in Figure 6 shows
that changes in task demands within industries to a large extent explain the
increase in the relative demand for skilled workers, and the third bar in Figure 6
shows that much of this is driven by computerization. In short, Figure 6 shows
that a more task-based approach can go a long way towards a better
understanding of recent labour market changes.
Figure 6: Task changes and shifts in the relative demand for skills in the
US, 1980-1998
Notes: Data are taken from Panel E of Table VII in Autor, Levy and Murnane (2003). The first
bar, the change in the relative demand for skilled workers, is an estimate obtained from a
supply-demand framework as in Figure 4 above (although in Figure 4 shifts in relative supply
and demand are expressed in relative wages not quantities) assuming an elasticity of
substitution between college and non-college labour of 1.4. The second bar, the change in the
relative demand for skilled workers explained by changes in task inputs, is obtained as follows:
It is the impact across industries of an industry-level relationship between changes in the share
3.81
1.56 1.39
0
1
2
3
4
5
Change in relative demand forskilled labor
Explained by changes in taskinputs
Explained by computerization
An
nu
aliz
ed %
ch
ange
in r
ela
tive
dem
and
29
of college workers and the sum of task measures where each task measure is multiplied by a
fixed coefficient. These fixed coefficients are obtained by estimating a fixed-coefficients model
of educational requirements in industries as a function of their task inputs in 1980 and 1984.
The third bar, the change in the relative demand for skilled workers explained by
computerization, does the same as the second bar but uses predicted rather than actual task
changes at the industry level as in the second bar of Figure 5 above.
The analysis in Figures 5 and 6 shows how computerization has shifted labour
demand away from routine medium-skilled towards non-routine skilled labour,
but it does not account for the increasing employment share of unskilled
service jobs, shown in Figure 3. Examples of unskilled service jobs are food
service workers, security guards, janitors and gardeners, cleaners, home health
aides, child care workers, hairdressers and beauticians, and leisure
occupations. Many of these jobs make intensive use of non-routine manual
tasks based on eye-hand-foot coordination that humans find easy but
computers find difficult. Consequently, computerization is increasing the
demand for unskilled service workers relative to medium-skilled workers.
Although on balance there is still skill-upgrading, as the first bar in Figure 6
shows, there is also job polarization: an increasing fraction of workers is
employed in either high-paying or low-paying occupations at the expense of
medium-skilled employment. Goos and Manning (2007) were the first to
rigorously analyse the process of job polarization for the UK and link it to the
impact of computerization. Today, the process of job polarization has been
documented for many advanced economies (see, for example, Autor, Katz and
Kearney 2006, 2008 and Autor and Dorn 2013 for the US; Goos, Manning and
Salomons 2009, 2013 for 16 European countries).
To illustrate job polarization, Figure 7 reports estimates from Goos, Manning
and Salomons (2013) for 16 Western-European countries based on, among
other data, the European Union Labour Force Survey. The first bar shows
changes in employment shares between 1993 and 2010 for 1) low-paying non-
routine manual; 2) middling routine; and 3) high-paying non-routine analytic
and cognitive occupations, pooled across 16 Western-European countries. The
figure shows that the share of low-paying occupations increased by 3.6
percentage points, from 21.6% in 1993 to 25.2% in 2010; the share of workers
employed in middling occupations fell by 9.3 percentage points, from 47.7% in
1993 to 38.4% in 2010; and the share of employment in high-paying
occupations increased by 5.6 percentage points from 31.7% in 1993 to 37.3% in
2010. Moreover, Goos, Manning and Salomons (2013) provide a task-based
framework to explain this job polarization. Specifically, they use the DOT task
measures from Autor, Levy and Murnane (2003) to predict job polarization both
within and between industries, given by the second and third bar for each
occupation group in Figure 7 respectively. Just as computer use changes within
industries shown in Figures 5 and 6, the within-industry changes in Figure 7
capture the profound nature of changing task demands when adopting new
30
production methods. For example, an important part of the overall and within-
industry decrease in middling occupations is explained by the relative
displacement of office clerks and machine operators from performing routine
tasks in many industries. But computerization is also expected to have an
impact that goes beyond the mere reallocation of capital and labour at the
workplace. One such approach is that investment in new technologies is often
intended to make the firm more competitive in product markets by lowering the
price for its good or increasing its quality. If different industries do this to
different degrees, computerization also results in changes in relative product
demand. For example, it is not unrealistic to think that consumers today are
buying more consumer electronics because their real prices have fallen or their
quality has improved, at the expense of clothing, for example. This increase in
the relative demand for consumer electronics then feeds back to the labour
market by increasing the demand for highly-paid designers of consumer
electronics relative to middling machine operators in textiles. The third bars in
Figure 7 show that these between-industry shifts away from middling towards
high-paying occupations are qualitatively important and contribute to the
process of job polarization. Also note the large between-industry increase in the
relative demand for low-paying occupations which mainly captures the shift in
consumer demand towards personal service activities, thereby increasing the
relative demand for unskilled service workers. Autor and Dorn (2013) provide
similar evidence for the US of the rise in low-skill services and its contribution
to job polarization. In short, although there is skill-upgrading on average,
labour markets in advanced economies are also polarizing into high-skilled and
low-skilled jobs due to computerization.
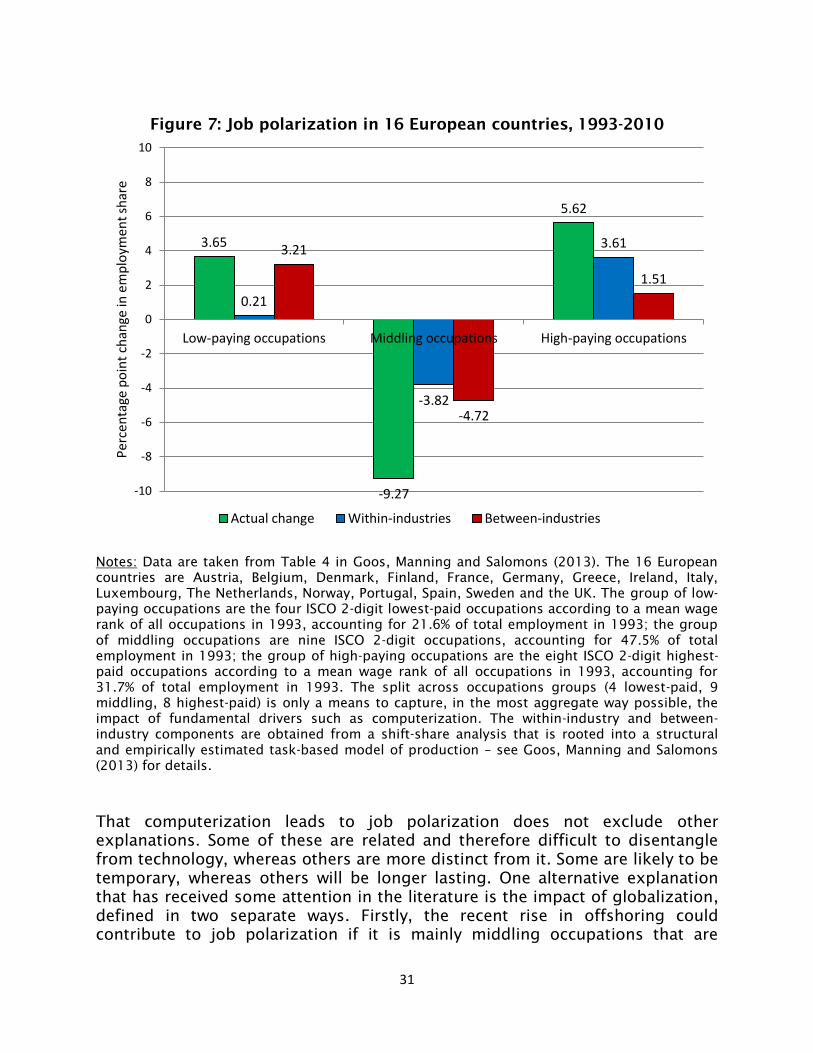
31
Figure 7: Job polarization in 16 European countries, 1993-2010
Notes: Data are taken from Table 4 in Goos, Manning and Salomons (2013). The 16 European
countries are Austria, Belgium, Denmark, Finland, France, Germany, Greece, Ireland, Italy,
Luxembourg, The Netherlands, Norway, Portugal, Spain, Sweden and the UK. The group of low-
paying occupations are the four ISCO 2-digit lowest-paid occupations according to a mean wage
rank of all occupations in 1993, accounting for 21.6% of total employment in 1993; the group
of middling occupations are nine ISCO 2-digit occupations, accounting for 47.5% of total
employment in 1993; the group of high-paying occupations are the eight ISCO 2-digit highest-
paid occupations according to a mean wage rank of all occupations in 1993, accounting for
31.7% of total employment in 1993. The split across occupations groups (4 lowest-paid, 9
middling, 8 highest-paid) is only a means to capture, in the most aggregate way possible, the
impact of fundamental drivers such as computerization. The within-industry and between-
industry components are obtained from a shift-share analysis that is rooted into a structural
and empirically estimated task-based model of production – see Goos, Manning and Salomons
(2013) for details.
That computerization leads to job polarization does not exclude other
explanations. Some of these are related and therefore difficult to disentangle
from technology, whereas others are more distinct from it. Some are likely to be
temporary, whereas others will be longer lasting. One alternative explanation
that has received some attention in the literature is the impact of globalization,
defined in two separate ways. Firstly, the recent rise in offshoring could
contribute to job polarization if it is mainly middling occupations that are
3.65
-9.27
5.62
0.21
-3.82
3.61 3.21
-4.72
1.51
-10
-8
-6
-4
-2
0
2
4
6
8
10
Low-paying occupations Middling occupations High-paying occupations
Per
cen
tage
po
int
chan
ge in
em
plo
ymen
t sh
are
Actual change Within-industries Between-industries
32
affected by it. For example, Goos, Manning and Salomons (2013) find some
evidence that offshoring is displacing medium-skilled blue-collar machine
operators because firms can set up new production lines abroad and import
intermediate tasks. But their data also show that offshoring cannot explain the
large fall in the employment share of medium-skilled white-collar office clerks.
Moreover, if vertical disintegration is part of a new organizational design with
its system-wide complementarities, the decision to offshore part of the
production process is most likely related to computerization on the factory
floor at home. Secondly, globalization also captures the increasing openness of
some large countries, like Brazil or China. For example, Autor, Dorn and
Hanson (2013) argue that import competition from China alone explains one-
quarter of the decline in US manufacturing between 1990 and 2007. In an
accompanying paper, however, they argue that this mainly reflects a between-
industry effect that does not explain the pervasiveness of job polarization
across occupations within industries. Yet other explanations for job polarization
exist. For example, the job polarization literature in part originates from the
discussion concerning to what extent it is a cyclical phenomenon, worsening
during recessions (see, for example, Wright and Dwyer 2003 and Manning
2003). Reasons for a cyclical component to job polarization could be the
collapse of housing demand, export demand, or aggregate income affecting
middling jobs disproportionately during recessions. If this is the case, many of
the middling jobs lost are expected to return once the economy recovers.
However, if job polarization is stronger during recessions because the market is
forcing more firms into rethinking their organizational design, the changes
made are irreversible and displaced workers do not possess the necessary skills
to move into new jobs, the recovery will be jobless. Recent work in the US
suggests that the latter may be the case (Jaimovich and Siu 2012).
The importance of high performance work practices
At the firm level, computerization implies the introduction of flexible and lean
production methods. However, these investments cannot be carried out in
isolation because of the existence of system-wide complementarities in the
firm’s organizational design. This is perhaps most important for the successful
harmonization of modern production methods with human resource practices.
When using specific purpose-built machinery to mass produce, the firm does
not need to think much about incentivizing its workers to elicit effort: a worker
moulding metal parts on a car assembly line would slow down production the
moment he starts shirking. But when using a more flexible and lean production
method, individual effort is often more difficult to measure and elicit. For
example, assume that team involvement to improve a product’s quality or
design becomes more important to the firm. How does the firm measure each
worker’s individual contribution to the team? If the firm can better observe
team performance than individual effort, one solution to elicit effort from
workers is to tie incentive pay to team performance, but this can lead to free-
33
rider problems. Indeed, exactly because adopting new technologies requires
substantial changes in the way employees work, decision-making should be
more decentralized to allow employees to experiment which requires further
adjustment to people management. Generally, therefore, when introducing new
production technologies, the firm also needs to rethink its human resource
practices.
Modern human resource management is diverse and depends on finding the
right mix of policies that fit the firm’s overall organizational design. For
example, to elicit team effort, some firms use team incentive payment schemes
together with a high effort culture to counteract free-riding. Examples of
policies to create a high effort culture are careful employee selection,
indoctrination and orientation at the time of entry, team-oriented work groups,
and other opportunities for workers to meet managers. Complementary to this,
firms also use subjective performance appraisals and team problem-solving
initiatives to build trust among workers. A final example is an employment (but
not task) security policy that is a necessity if the firm depends on workers’
ideas about improving productivity that may result in the elimination of jobs
(Ichniowski, Shaw and Prennushi 1997).
To illustrate this, Figure 8 examines the impact of human resource practices on
the productivity of US steel plants. The data are taken from Ichniowski, Shaw
and Prennushi (1997) and are based on interviews that were conducted at 26
steel finishing lines. Because the technology used is very similar across the
different plants but there was substantial variation in their human resource
practices, the authors can assess the impact of those human resource practices
on a finishing line’s productivity. To this end, four different regimes are
identified based on seven human resource practices. The seven practices are 1)
worker involvement in teams; 2) information sharing and regular meetings with
management; 3) regular training; 4) extensive screening of new hires; 5)
incentive pay; 6) employment security; and 7) job flexibility/rotation. The first
regime is “Traditional Work Practices” and has none of these seven policies. The
second regime is “Moderate 1” and has low levels of practices 1) and 2) but
little else. The third regime is “Moderate 2” and has more of 1) and 3) and one
or two other practices from 4), 5) or 6). Finally, “High Performance Work
Practices” have all seven. The coefficients in Figure 8 then give the impact on a
steel finishing line’s uptime of Moderate 1, Moderate 2 and High Performance
Work Practices relative to Traditional Work Practices. For example, in a finishing
line in a plant using High Performance Work Practices, scheduled operation time
is 6.7 percentage points longer than a finishing line using Traditional Work
Practices. The estimates for Moderate 2 and Moderate 1 are 3.2 and 1.4
percentage points respectively, and all three point estimates in Figure 8 are
statistically significant. In follow-up research, the authors also find that IT
investment in flexible and lean production methods also allows the firm to
adopt modern human resource practices (Boning, Ichniowski and Shaw 2007;
Bartel, Ichniowski and Shaw 2007).
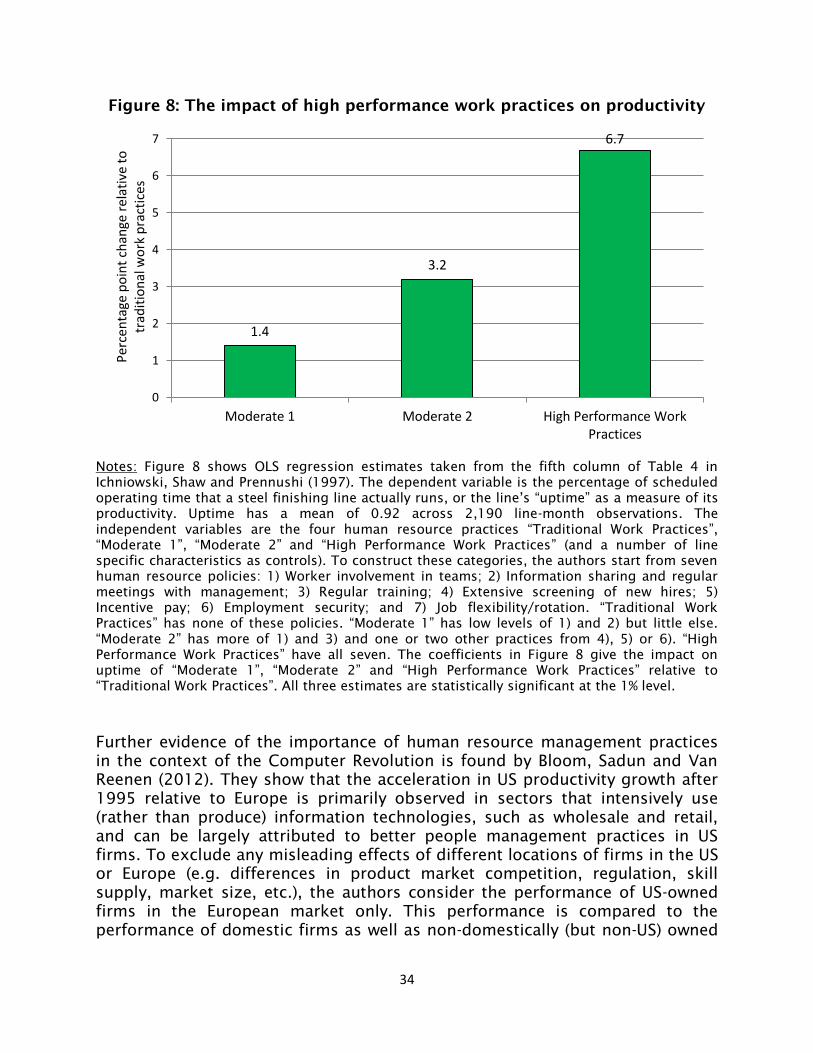
34
Figure 8: The impact of high performance work practices on productivity
Notes: Figure 8 shows OLS regression estimates taken from the fifth column of Table 4 in
Ichniowski, Shaw and Prennushi (1997). The dependent variable is the percentage of scheduled
operating time that a steel finishing line actually runs, or the line’s “uptime” as a measure of its
productivity. Uptime has a mean of 0.92 across 2,190 line-month observations. The
independent variables are the four human resource practices “Traditional Work Practices”,
“Moderate 1”, “Moderate 2” and “High Performance Work Practices” (and a number of line
specific characteristics as controls). To construct these categories, the authors start from seven
human resource policies: 1) Worker involvement in teams; 2) Information sharing and regular
meetings with management; 3) Regular training; 4) Extensive screening of new hires; 5)
Incentive pay; 6) Employment security; and 7) Job flexibility/rotation. “Traditional Work
Practices” has none of these policies. “Moderate 1” has low levels of 1) and 2) but little else.
“Moderate 2” has more of 1) and 3) and one or two other practices from 4), 5) or 6). “High
Performance Work Practices” have all seven. The coefficients in Figure 8 give the impact on
uptime of “Moderate 1”, “Moderate 2” and “High Performance Work Practices” relative to
“Traditional Work Practices”. All three estimates are statistically significant at the 1% level.
Further evidence of the importance of human resource management practices
in the context of the Computer Revolution is found by Bloom, Sadun and Van
Reenen (2012). They show that the acceleration in US productivity growth after
1995 relative to Europe is primarily observed in sectors that intensively use
(rather than produce) information technologies, such as wholesale and retail,
and can be largely attributed to better people management practices in US
firms. To exclude any misleading effects of different locations of firms in the US
or Europe (e.g. differences in product market competition, regulation, skill
supply, market size, etc.), the authors consider the performance of US-owned
firms in the European market only. This performance is compared to the
performance of domestic firms as well as non-domestically (but non-US) owned
1.4
3.2
6.7
0
1
2
3
4
5
6
7
Moderate 1 Moderate 2 High Performance WorkPractices
Per
cen
tage
po
int
chan
ge r
elat
ive
to
trad
itio
nal
wo
rk p
ract
ices
35
firms: US-owned firms are found to be more productive due to a better
exploitation of information technologies resulting from people management
practices (concerning promotions, rewards, hiring and firing) which are more
complementary with these technologies. These results also hold up in a
comparison of US takeovers of previously non-US owned firms in the European
market: after US takeover, such firms show evidence of higher information
technology productivity although no such difference was found before the
takeover took place. Importantly, the complementarity between computer
technology and human resource management practices is found even after
controlling for the complementary between computer technology and worker
skills. This indicates that the effect of the Computer Revolution on the
organization of work is not driven solely by the higher skill levels required of
workers for working with new technologies, but truly captures a need to
manage and organize labour differently in the workplace when using these
technologies.
In short, computerization is having profound impacts on the structure of
employment in aggregate labour markets and within firms. Since 1980, labour
markets have been polarizing into “lousy” and “lovely” jobs that are non-routine
task-intensive at the expense of middling employment that is routine task-
intensive. That the labour market has been reallocating employment towards
non-routine jobs is also evident from the recent emergence of high
performance work practices, particularly those concerning human resource
management. Next we turn to what has happened to relative wages after 1980.
3.4 Evidence of recent changes in relative wages
It was shown in Section 2.4 that wage inequality fell between 1915 and 1980
and Panels A to E of Figure 4 show why this was the case: the relative supply of
skills due to the high school and college movements outpaced the relative
demand for skilled workers due to skill-biased technological progress. However,
Panels F and G of Figure 4 also show that, more recently, the skill premium
increased, especially in the 1980s. As the panels suggest, much of this increase
in the skill premium can be accounted for by a deceleration in the relative
supply of college-educated workers, from an annualized -3% in the 1970s to -
1.5% in the 1980s to -1% in the 1990s and early 2000s, combined with a
continued increase in the relative demand for skills. Card and Lemieux (2001)
show that there was indeed a slowdown in growth rates of educational
attainment for workers born around 1955 and starting work in the mid-1970s.
This slowdown made educated workers scarcer in these cohorts, thereby
reducing the relative supply of skills and increasing the skill premium. Autor
and Katz (1999), Goldin and Katz (2008), Autor, Katz and Kearney (2008) and
Acemoglu and Autor (2011) provide similar evidence in support of the
hypothesis that a slowdown in the relative supply of skilled workers, combined
with continued growth in their relative demand, is an important explanation for
the rise in the skill premium and therefore overall wage inequality after 1980.
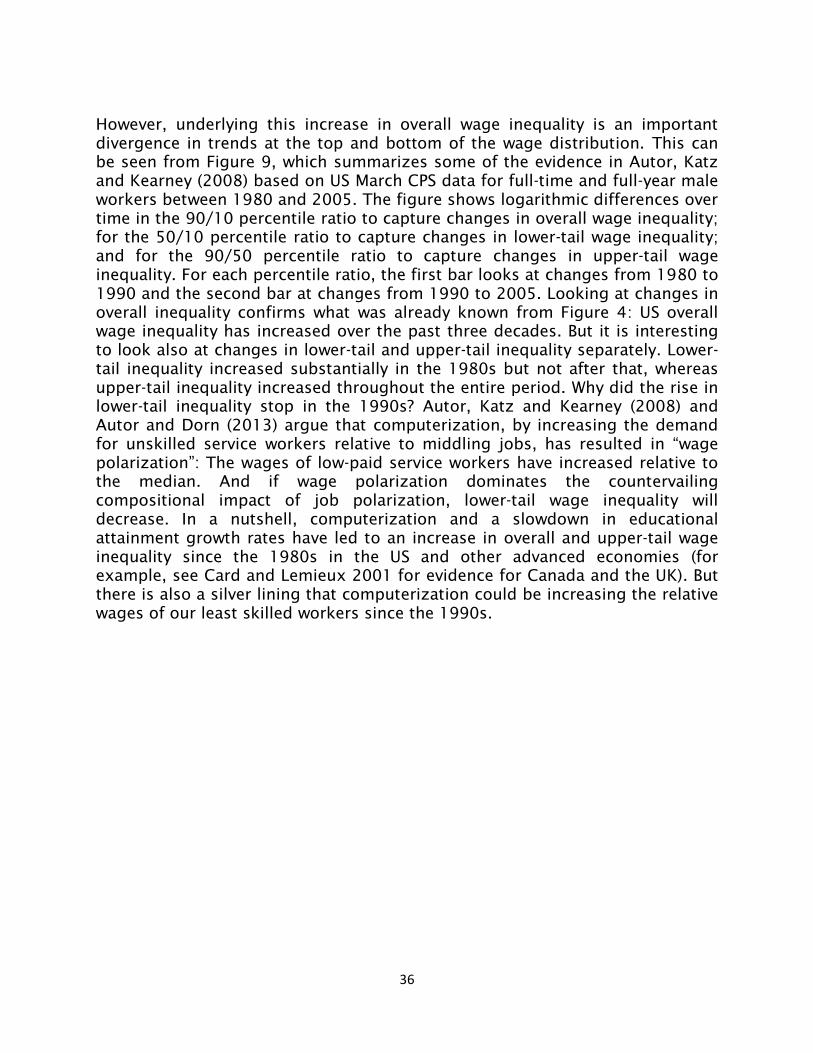
36
However, underlying this increase in overall wage inequality is an important
divergence in trends at the top and bottom of the wage distribution. This can
be seen from Figure 9, which summarizes some of the evidence in Autor, Katz
and Kearney (2008) based on US March CPS data for full-time and full-year male
workers between 1980 and 2005. The figure shows logarithmic differences over
time in the 90/10 percentile ratio to capture changes in overall wage inequality;
for the 50/10 percentile ratio to capture changes in lower-tail wage inequality;
and for the 90/50 percentile ratio to capture changes in upper-tail wage
inequality. For each percentile ratio, the first bar looks at changes from 1980 to
1990 and the second bar at changes from 1990 to 2005. Looking at changes in
overall inequality confirms what was already known from Figure 4: US overall
wage inequality has increased over the past three decades. But it is interesting
to look also at changes in lower-tail and upper-tail inequality separately. Lower-
tail inequality increased substantially in the 1980s but not after that, whereas
upper-tail inequality increased throughout the entire period. Why did the rise in
lower-tail inequality stop in the 1990s? Autor, Katz and Kearney (2008) and
Autor and Dorn (2013) argue that computerization, by increasing the demand
for unskilled service workers relative to middling jobs, has resulted in “wage
polarization”: The wages of low-paid service workers have increased relative to
the median. And if wage polarization dominates the countervailing
compositional impact of job polarization, lower-tail wage inequality will
decrease. In a nutshell, computerization and a slowdown in educational
attainment growth rates have led to an increase in overall and upper-tail wage
inequality since the 1980s in the US and other advanced economies (for
example, see Card and Lemieux 2001 for evidence for Canada and the UK). But
there is also a silver lining that computerization could be increasing the relative
wages of our least skilled workers since the 1990s.
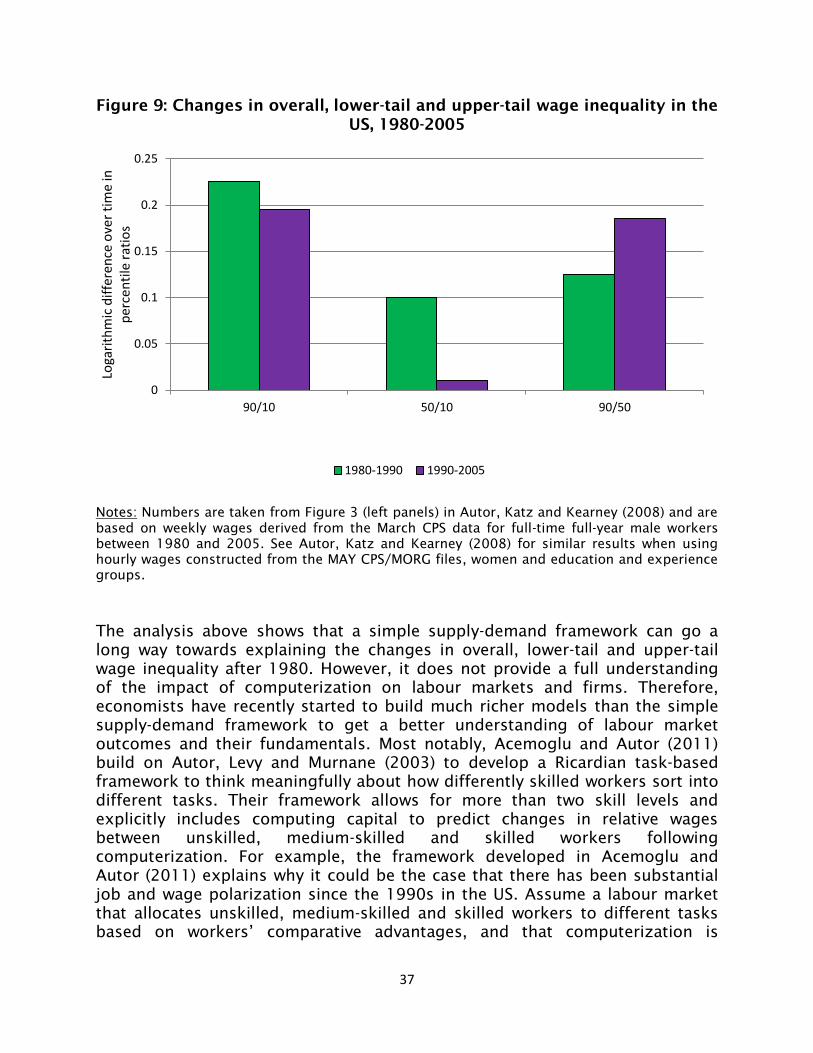
37
Figure 9: Changes in overall, lower-tail and upper-tail wage inequality in the
US, 1980-2005
Notes: Numbers are taken from Figure 3 (left panels) in Autor, Katz and Kearney (2008) and are
based on weekly wages derived from the March CPS data for full-time full-year male workers
between 1980 and 2005. See Autor, Katz and Kearney (2008) for similar results when using
hourly wages constructed from the MAY CPS/MORG files, women and education and experience
groups.
The analysis above shows that a simple supply-demand framework can go a
long way towards explaining the changes in overall, lower-tail and upper-tail
wage inequality after 1980. However, it does not provide a full understanding
of the impact of computerization on labour markets and firms. Therefore,
economists have recently started to build much richer models than the simple
supply-demand framework to get a better understanding of labour market
outcomes and their fundamentals. Most notably, Acemoglu and Autor (2011)
build on Autor, Levy and Murnane (2003) to develop a Ricardian task-based
framework to think meaningfully about how differently skilled workers sort into
different tasks. Their framework allows for more than two skill levels and
explicitly includes computing capital to predict changes in relative wages
between unskilled, medium-skilled and skilled workers following
computerization. For example, the framework developed in Acemoglu and
Autor (2011) explains why it could be the case that there has been substantial
job and wage polarization since the 1990s in the US. Assume a labour market
that allocates unskilled, medium-skilled and skilled workers to different tasks
based on workers’ comparative advantages, and that computerization is
0
0.05
0.1
0.15
0.2
0.25
90/10 50/10 90/50
Loga
rith
mic
dif
fere
nce
ove
r ti
me
in
per
cen
tile
rat
ios
1980-1990 1990-2005
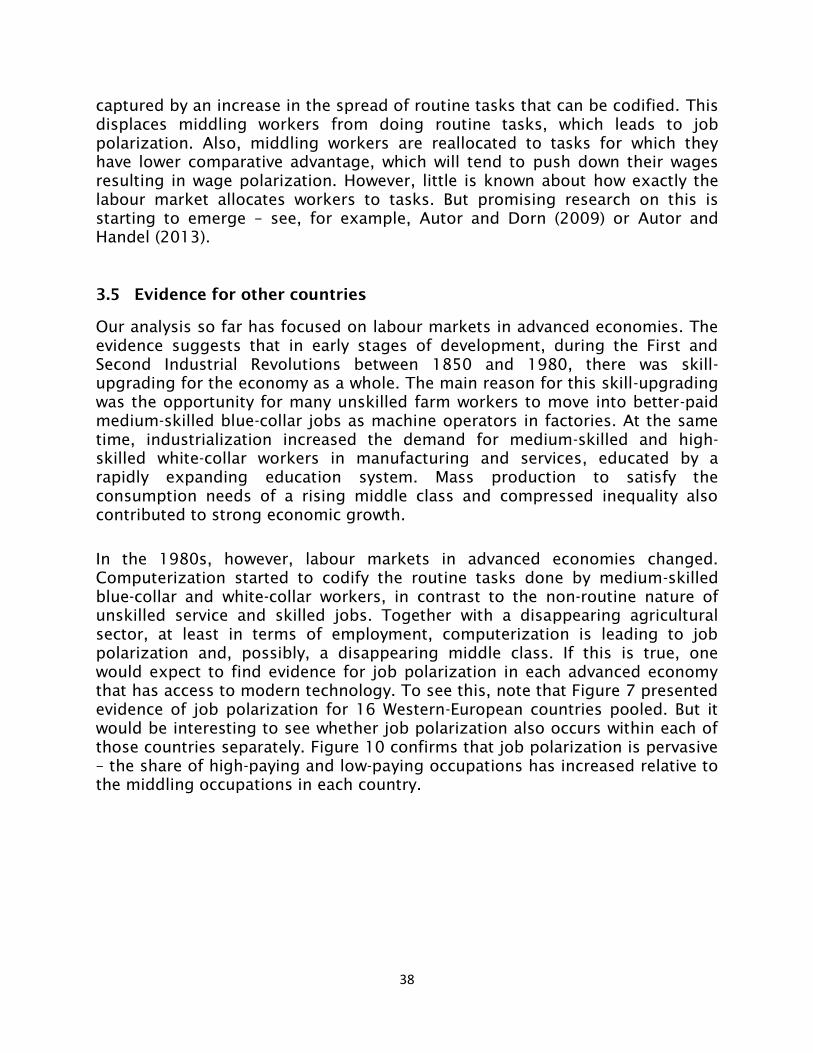
38
captured by an increase in the spread of routine tasks that can be codified. This
displaces middling workers from doing routine tasks, which leads to job
polarization. Also, middling workers are reallocated to tasks for which they
have lower comparative advantage, which will tend to push down their wages
resulting in wage polarization. However, little is known about how exactly the
labour market allocates workers to tasks. But promising research on this is
starting to emerge – see, for example, Autor and Dorn (2009) or Autor and
Handel (2013).
3.5 Evidence for other countries
Our analysis so far has focused on labour markets in advanced economies. The
evidence suggests that in early stages of development, during the First and
Second Industrial Revolutions between 1850 and 1980, there was skill-
upgrading for the economy as a whole. The main reason for this skill-upgrading
was the opportunity for many unskilled farm workers to move into better-paid
medium-skilled blue-collar jobs as machine operators in factories. At the same
time, industrialization increased the demand for medium-skilled and high-
skilled white-collar workers in manufacturing and services, educated by a
rapidly expanding education system. Mass production to satisfy the
consumption needs of a rising middle class and compressed inequality also
contributed to strong economic growth.
In the 1980s, however, labour markets in advanced economies changed.
Computerization started to codify the routine tasks done by medium-skilled
blue-collar and white-collar workers, in contrast to the non-routine nature of
unskilled service and skilled jobs. Together with a disappearing agricultural
sector, at least in terms of employment, computerization is leading to job
polarization and, possibly, a disappearing middle class. If this is true, one
would expect to find evidence for job polarization in each advanced economy
that has access to modern technology. To see this, note that Figure 7 presented
evidence of job polarization for 16 Western-European countries pooled. But it
would be interesting to see whether job polarization also occurs within each of
those countries separately. Figure 10 confirms that job polarization is pervasive
– the share of high-paying and low-paying occupations has increased relative to
the middling occupations in each country.
39
Figure 10: Percentage point changes in employment shares by occupation
group and country, 1993-2010
Notes: Numbers are taken from Table 2 in Goos, Manning and Salomons (2013). See Figure 7
for further details on the data underlying this chart.
However, the process of job polarization is unlikely to be pervasive in
developing economies. Instead, one may expect to see a change from unskilled
jobs, mainly in agriculture, to middle class employment, mainly in
manufacturing, as was the case for today’s advanced economies at earlier
stages of development. Unfortunately, evidence on employment dynamics by
skill, sector or occupation in developing economies is scant. Perhaps most
relevant is recent work by Kapsos and Bourmpoula (2013) who carefully define
five economic classes of workers based on an absolute measure of per capita
household income in developing countries: 1) “extreme working poor” for a
-20 -15 -10 -5 0 5 10 15 20
Austria
Belgium
Denmark
Finland
France
Germany
Greece
Ireland
Italy
Luxembourg
Netherlands
Norway
Portugal
Spain
Sweden
UK
Low-paying occupations Middling occupations High-paying occupations
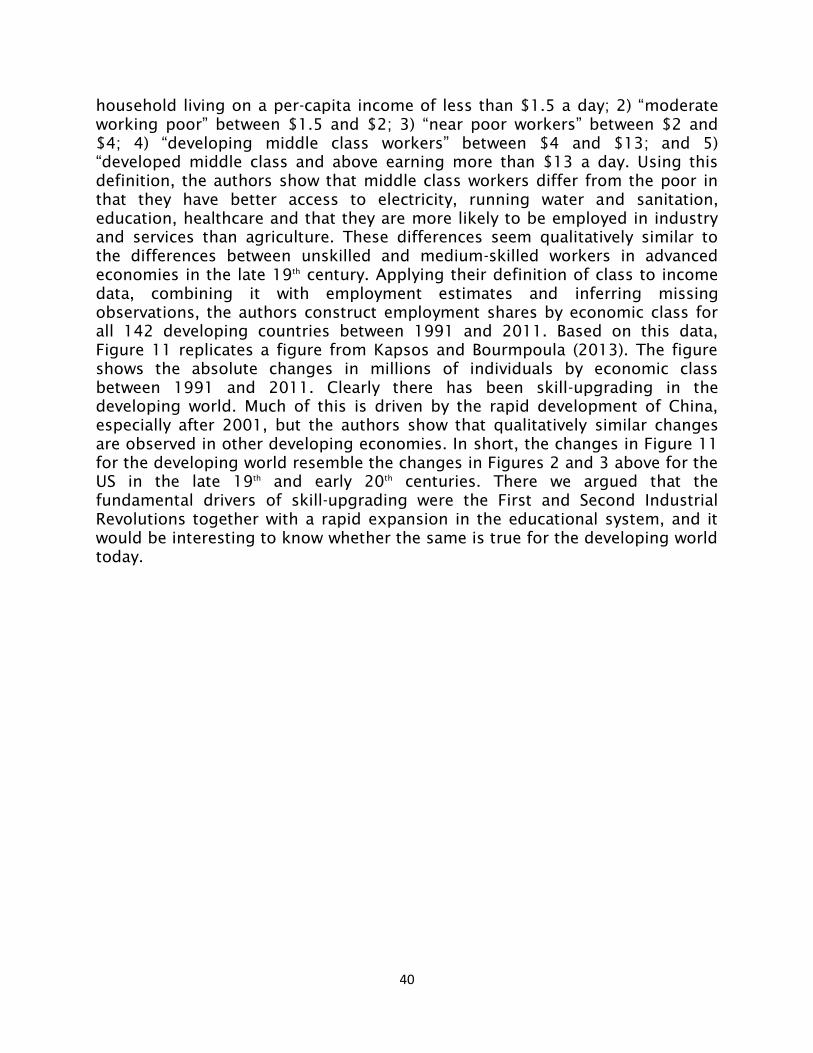
40
household living on a per-capita income of less than $1.5 a day; 2) “moderate
working poor” between $1.5 and $2; 3) “near poor workers” between $2 and
$4; 4) “developing middle class workers” between $4 and $13; and 5)
“developed middle class and above earning more than $13 a day. Using this
definition, the authors show that middle class workers differ from the poor in
that they have better access to electricity, running water and sanitation,
education, healthcare and that they are more likely to be employed in industry
and services than agriculture. These differences seem qualitatively similar to
the differences between unskilled and medium-skilled workers in advanced
economies in the late 19th
century. Applying their definition of class to income
data, combining it with employment estimates and inferring missing
observations, the authors construct employment shares by economic class for
all 142 developing countries between 1991 and 2011. Based on this data,
Figure 11 replicates a figure from Kapsos and Bourmpoula (2013). The figure
shows the absolute changes in millions of individuals by economic class
between 1991 and 2011. Clearly there has been skill-upgrading in the
developing world. Much of this is driven by the rapid development of China,
especially after 2001, but the authors show that qualitatively similar changes
are observed in other developing economies. In short, the changes in Figure 11
for the developing world resemble the changes in Figures 2 and 3 above for the
US in the late 19th
and early 20th
centuries. There we argued that the
fundamental drivers of skill-upgrading were the First and Second Industrial
Revolutions together with a rapid expansion in the educational system, and it
would be interesting to know whether the same is true for the developing world
today.
41
Figure 11: Changes in employment by economic class in developing
countries, 1991-2011
Notes: Data are taken from the left panel of Figure 8 in Kapsos and Bourmpoula (2013). The five
economic classes of workers are based on an absolute measure of household per-capita
income: 1) “Extreme working poor” for a household living on a per capita income of less than
$1.5 a day; 2) “Moderate working poor” between $1.5 and $2; 3) “Near poor workers” between
$2 and $4; 4) “Developing middle class workers” between $4 and $13; and 5) “Developed
middle class and above earning more than $13 a day. There are 142 developing countries in the
sample.
-400
-300
-200
-100
0
100
200
300
400
Extremely poor Moderately poor Near poor Developingmiddle class
Developedmiddle class and
above
Ch
ange
in m
illio
ns
of
wo
rker
s
1991-2001 2001-2011
42
4 The future
Gordon (2012) cites four classic examples of bad predictions concerning
technology: 1) In 1876, Western Union, the monopolist at the time for
delivering wire messages in the US, wrote in an internal memo: “The telephone
has too many shortcomings to be considered as a serious means of
communication.”; 2) In 1927, the head of Warner Brothers said: “Who the hell
wants to hear people talk?”; 3) In 1943, Thomas Watson, chairman of IBM, said:
“I think there is a world market for maybe five computers”; and 4) In 1981, Bill
Gates said: “640kB ought to be enough for anybody”, although this last
prediction is believed to be an urban myth. It is clear from these examples that
predicting the future is difficult, especially when it comes to technological
progress. Despite these reservations, this section conjectures on the future of
our labour markets by drawing from the analyses outlined in the previous
sections of this paper. It briefly focusses on 1) the future pace of
computerization; and 2) the need for continued investment in education and
on-the-job training.
The pace of computerization
Economists are divided about how the Computer Revolution will continue to
unfold. For example, Gordon (2012) points out that the economic impact of the
recent Computer Revolution need not be as prosperous as that of the earlier
First and Second Industrial Revolutions. He argues that the three industrial
revolutions in advanced economies have been episodic, each with their one-
time only inventions and their specific impacts on our economies. Therefore,
the fact that the First and Second Industrial Revolutions resulted in large
improvements in living standards does not imply that the same must
necessarily be true for the Computer Revolution. One reason for this, Gordon
(2012) argues, could be that the First and Second Industrial Revolutions had
follow-up inventions that increased productivity up to the 1970s, but that this
follow-up process from the Computer Revolution is already fading. However,
Brynjolfsson and McAfee (2011) call on Moore’s law to argue that most of the
impact from computerization is still to come. To illustrate this, the authors
refer to the driverless car, an achievement that seemed impossible ten years
ago but not today. These diverging views highlight that the pace at which future
inventions belonging to the Computer Revolution continue to be made is
difficult to forecast.
Related to the discussion about the future impact of computerization is the
impact of globalization, partially driven by computerization (for example,
through improvements in communication and information technologies which
enable the offshoring of certain parts of the production process) but perhaps
partly also as an independent force due to declining man-made barriers to
trade. For example, Blinder and Krueger (2013) argue that 25% of US jobs are
offshorable. Autor, Dorn and Hanson (2013) find that import competition from
43
China alone explains one-quarter of the decline in US manufacturing between
1990 and 2007. In an accompanying paper, however, they argue that this
mainly reflects an industry-specific effect that does not fully explain the
changing occupational composition within manufacturing. That is, there is no
reason to believe that manufacturing employment would vanish in the long-run.
To illustrate this, assume that US steel plants, perhaps in response to import
competition from China, introduce flexible production lines and high
performance work practices to increase productivity. Although this might result
in less total employment, it also implies that steel workers will specialize in
non-routine tasks, like working in teams to improve uptime or getting trained
to work rotation. Consequently, it is not clear a priori that manufacturing
employment would have to vanish or even decrease, given the existence of
system-wide complementarities, the sorting of skills into tasks based on
comparative advantage (as modelled in Autor, Levy and Murnane 2003 and
Acemoglu and Autor 2011) and occupational task-bundling (the fact that
occupations are partially indivisible bundles of tasks is a point also made by
Autor 2013 and analysed more formally in Autor and Handel 2013). In this
respect, the impact of computerization is most likely to be very different
compared to the rapid increase, starting in the late 19th
century, in the
productivity of farm land due to soil fertilizers and farming machinery, and the
consequent near disappearance of farm labourers.
In short, the effects of future technological progress on the employment and
wage structures cannot be easily extrapolated. Future inventions will affect
employment and wage structures differently depending on which tasks derive a
comparative advantage from this new technological capital vis-à-vis human
labour, as well as the distribution of these tasks across the wage structure.
However, changes in skill supply as well as on institutional factors are also
shown to be capable of counteracting or reinforcing the labour market effects
of technological advances. In particular, strong increases in skill supplies have
contributed to strong skill-upgrading in employment and less upper-tail and
overall wage inequality before 1980. After 1980, however, less strong growth in
relative skill supply has increased upper-tail and overall wage dispersion. In this
light, the need for continued investment in education and on-the-job training is
briefly discussed below.
The need for continued investment in education and on-the-job training
This section argues that continued investment in skills will: a) contribute to
future economic growth; b) reduce future growth in top-income inequality; and
c) protect workers against the adverse effects of job polarization.
a) On balance and for the economy as a whole, there has been skill-
upgrading in advanced economies since the start of industrialization in the mid-
19th
century. Goldin and Katz (2008) follow an extensive literature that
44
estimates the impact of this skill-upgrading on US economic growth between
1915 and 2005. They use a simple equation that relates growth in output per
worker to capital deepening, growth in educational attainment rates (measured
in efficiency units to capture quantitative as well as qualitative changes) and a
residual. The authors find that 14% of the growth rate in output per worker can
be explained by the increase in average time at school by almost 6 years
between 1915 and 2005. Although this contribution of education to economic
growth differs somewhat between decades, there is little sign that its impact is
fading over time. More investment in education and on-the-job training will not
only improve labour market outcomes, but also contribute to economic growth
more generally. Moreover, Goldin and Katz (2008) and Acemoglu and Autor
(2012) argue that these numbers most likely underestimate the true impact of
human capital on economic growth. For example, the equation used in Goldin
and Katz (2008) does not account for the fact that higher income leads to
higher savings and more investment, which leads to capital deepening. It also
does not account for the fact that an educated workforce invents more or that
there might exist important complementarities between a worker’s education or
on-the-job training and changes in task demands from computerization. Indeed,
Bloom et al (2012) find a strong positive association across firms and industries
between the intensity of college-educated employees and better human
resource management practices, providing empirical evidence for such
complementarities.
b) The analysis in Section 3.4 showed that overall and upper-tail inequality
is rising in some advanced economies and that this, in part, can be explained
by a lack of education. The analysis of historical developments in the US college
wage premium has shown that wage inequality increased during periods where
the supply of highly skilled labour was outpaced by demand for it: increasing
investment in human capital can therefore act to attenuate a tendency for
increased inequality resulting from technological progress. Furthermore, if
college attainment rates rise, it might become increasingly difficult to provide
the quantity and quality of education that the labour market increasingly
requires. For the US, Goldin and Katz (2008) and Acemoglu and Autor (2012)
point to the lack of inclusiveness of the education system and its failure to
provide basic education for poor, minority and immigrant children, who are
most likely to drop out of the education system at an early age. Also Europe,
with its relatively exclusive and unforgiving education system, could benefit
from a further increase in its high school completion rates.
c) Employment growth in advanced economies has recently been polarizing
into low-paid and high-paid occupations at the expense of middling jobs. The
rise in low-paid relative to middling employment, however, does not mean that
less education or on-the-job training is needed or that there is a problem of
“over-education”. Firstly, it is unlikely that middle skills will entirely disappear
due to system-wide complementarities and task bundling in jobs, as was argued
above. Secondly, Autor and Handel (2009) show that there is a positive skill
premium even in low-paid jobs. One explanation for this could be that firms,
45
including those employing low-paid workers, adopt modern human resource
practices and that skilled workers are better at them (Bloom et al 2012).
In summary, it is most likely that, on balance, the relative demand for skilled
workers will continue to increase due to computerization. To the extent that
there is continued investment in education and on-the-job training to match the
increased demand for skills, there will be further skill-upgrading and economic
growth without further increasing or even decreasing upper-tail and overall
wage inequality, as was the case in advanced economies before 1980.
Moreover, job polarization does not justify fears of a digital invasion for two
reasons. Firstly, it is unlikely that computerization will displace medium-skilled
workers entirely because of system-wide complementarities in organizational
design, the complex play of selection based on comparative advantages and
task-bundling in jobs. Secondly, there is evidence that computerization leads to
wage polarization, thereby increasing the relative wages of the least-paid
workers and reducing lower-tail wage inequality. To conclude, this section calls
for optimism towards future computerization as long as our policies can
provide the necessary skills to support such changes.
5 Conclusions
It is undoubtedly true that economic progress is increasing average living
standards in developing and developed economies, and that an important part
of this happens through adjustment in work. However, inventions are one-time
only events and the impact of different episodes of technological progress on
labour markets is not the same.
The First and Second Industrial Revolutions, that took place between 1820 and
1900 with follow-up inventions up to 1980, introduced steam power, electricity,
the automobile, modern chemistry and the telephone, among other things. The
consequent rise of manufacturing provided many unskilled farm labourers with
the opportunity to move into medium-skilled blue-collar jobs. Together with an
increase in the relative demand for medium-skilled and skilled white-collar
employment in manufacturing and services, there was skill-upgrading. However,
the skill premium, and therefore overall inequality, decreased because of mass
education that led to an increase in the supply of skills that outpaced its
increase in demand. In this way, the First and Second Industrial Revolutions
resulted in economic growth, skill-upgrading, mass education and lower overall
wage inequality.
The Computer Revolution that began in advanced economies in the 1980s is
different. Underlying skill-upgrading there is also job polarization: rising
employment shares for skilled and unskilled workers at the expense of
medium-skilled employment. At the same time, growth in educational
46
attainment rates has slowed in many advanced economies since 1980, reducing
growth in skill supplies and increasing the skill premium and upper-tail and
overall wage inequality. Within firms, computerization is characterized by the
adoption of flexible and lean production methods based on robotic equipment
and the existence of system-wide complementarities with, for example, high
performance work practices such as setting up problem solving teams, job
rotation, information sharing and intensive training.
It would seem, therefore, that computerization has not emulated the prolonged
economic success of the First and Second Industrial Revolutions. However,
today’s marriage of computerization to human resources within the firm is
much more complex than the machine-skill complementarity that characterized
the period before 1980. Together with ongoing and future technological
advances, this complexity implies that it will take time for firms and labour
markets to fully digest and reap the benefits of the Computer Revolution and
only if our labour markets can provide the necessary skills to support such
progress.
47
6 Bibliography
Daron Acemoglu and David H. Autor, "What Does Human Capital Do? A Review
of Goldin and Katz’s “The Race Between Education and Technology", Journal of
Economic Literature, 50:2, 426-463, (2012).
Daron Acemoglu and David H. Autor, "Skills, Tasks and Technologies:
Implications for Employment and Earnings", Handbook of Labor Economics,
Orley Ashenfelter and David E. Card (eds.), Amsterdam, Elsevier, Vol 4B, 1043-
1171, (2011).
David H. Autor, , "The Task Approach to Labor Markets: An Overview", Journal
of Labour Market Research, 46: 185-199, (2013).
David H. Autor and David Dorn, "Inequality and Specialization: The Growth of
Low-Skill Service Jobs in the United States", American Economic Review, 103(5):
1553-1597, (2012).
David H. Autor and David Dorn, “This Job is “Getting Old”: Measuring Changes in
Job Opportunities using Occupational Age Structure”, American Economic
Review Papers and Proceedings, 99(2), May 2009, 45-51, (2009).
David H. Autor, David Dorn and Gordon H. Hanson, "Untangling Trade and
Technology: Evidence from Local Labor Markets", NBER Working Paper No.
18938, (2013).
David H. Autor, David Dorn and Gordon H. Hanson, "The China Syndrome: Local
Labor Market Effects of Import Competition in the United States", forthcoming
American Economic Review, (2013).
David H. Autor, and Michael J. Handel, “Putting Tasks to the Test: Human
Capital, Job Tasks and Wages”, Journal of Labor Economics, 31(2 pt2), S59-96,
(2013).
David H. Autor, Lawrence F. Katz, and Melissa S. Kearney, "Trends in US Wage
Inequality: Revising the Revisionists", Review of Economics and Statistics, 90(2):
300-323, (2008).
David H. Autor, Lawrence F. Katz, and Melissa S. Kearney, "The Polarization of
the US Labor Market", American Economic Review Papers and Proceedings, 96:
189-194, (2006).
David H. Autor and Lawrence F. Katz, "Changes in the Wage Structure and
Earnings Inequality", Handbook of Labor Economics, Orley Ashenfelter and
David E. Card (eds.), Amsterdam, Elsevier, Vol 3A: 1463-1555, (1999).
David H. Autor, Frank Levy and Richard J. Murnane, "The Skill-Content of Recent
Technological Change: An Empirical Investigation", Quarterly Journal of
Economics, 118: 1279-1333, (2003).
Ann Bartel, Casey Ichniowski and Kathryn Shaw, “How Does Information
Technology Affect Productivity? Plant-Level Comparisons of Product Innovation,
48
Process Improvement, and Worker Skills”, Quarterly Journal of Economics,
122(4), 1721-1758, (2007).
William J. Baumol, "Macroeconomics of Unbalanced Growth: Anatomy of an
Urban Crisis", American Economic Review, 57: 415-426, (1967).
Alan S. Blinder and Alan B. Krueger, "Alternative Measures of Offshorability: A
Survey Approach", Journal of Labor Economics, 31(2): S97-128, (2013).
Nicholas Bloom, Raffaella Sadun and John Van Reenen, “Americans Do IT Better:
US Multinationals and the Productivity Miracle,” American Economic Review
102(1): 167-201, (2012).
Brent Boning, Casey Ichniowski and Kathryn Shaw, “Opportunity Counts: Teams
and the Effectiveness of Production Incentives”, Journal of Labor Economics,
25(4): 613-650, (2007),.
Erik Brynjolfsson and Andrew McAfee, The Race Against the Machine, MIT Press,
(2011).
David Card and John E. DiNardo, “Skill-Biased Technological Change and Rising
Wage Inequality: Some Problems and Puzzles”, Journal of Labor Economics,
20:4, 733-783, (2002).
David Card and Thomas Lemieux, “Can Falling Supply Explain the Rising Return
to College for Younger Men? A Cohort-Based Analysis”, Quarterly Journal of
Economics, 116:2, 705-746, (2001).
Claudia Goldin and Lawrence F. Katz, The Race Between Education and
Technology, Harvard University Press, Cambridge, Mass., (2008).
Claudia Goldin and Robert A. Margo, “The Great Compression: The Wage
Structure in the United States at Mid-Century”, Quarterly Journal of Economics,
107: 1-34, (1992).
Maarten Goos, and Alan Manning, "Lousy and Lovely Jobs: The Rising
Polarization of Work in Britain", Review of Economics and Statistics, 89: 118-
133, (2007).
Maarten Goos, Alan Manning and Anna Salomons, "", mimeo, University of
Leuven, October 2013.
Maarten Goos, Alan Manning and Anna Salomons, "The Polarization of the
European Labor Market", American Economic Review Papers and Proceedings,
99:58-63, (2009).
Robert J. Gordon, “Is US Economic Growth Over? Faltering Innovation Confronts
the Six Headwinds”, Policy Insight No. 63, Centre for Economic Policy Research,
(2012).
Bengt Holstrom and Paul Milgrom, “The Firm as an Incentive System”, American
Economic Review, 84:4, 972-991, (1994).
49
Casey Ichniowski, Kathryn Shaw and Giovanna Prennushi, “The Effects of
Human Resource Management Practices on Productivity: A Study of Steel
Finishing Lines”, American Economic Review, 86: 296-313, (1997).
Torben Iversen and Anne Wren, “Equality, Employment and Budgetary
Restraint: The Trilemma of the Service Economy”, World Politics, 50(4), (1998).
Nir Jaimovich, and Henry E. Siu, “The Trend is the Cycle: Job Polarization and
Jobless Recoveries”, mimeo, Duke University, June 2013.
Lawrence F. Katz, and Robert A. Margo, “Technical Change and the Relative
Demand for Skilled Labor: The United States in a Historical Perspective”, NBER
Working Paper No. 18752, (2013).
Steven Kapsos and Evangelia Bourmpoula, “Employment and Economic Class
in the Developing World”, ILO Research Paper No.6, June 2013.
Derek Laing, “Labor Economics: Introduction to Classic and the New Labor
Economics,” Norton, (2011).
Alan Manning, "Comment on: “The Patterns of Job Expansion in the USA: A
Comparison of the 1960s and 1990s”, by Erik Olin Wright and Rachel E. Dwyer",
Socio-Economic Review, 1, 327-333, (2003).
Guy Michaels Ashwini Natraj, and John Van Reenen, "Has ICT Polarized Skill
Demand?: Evidence from Eleven Countries over 25 Years", forthcoming Review
of Economics and Statistics, (2013).
Paul Milgrom and John Roberts, “Complementarities and Fit: Strategy,
Structure and Organizational Change in Manufacturing”, Journal of Accounting
and Economics, 19 (2-3), March-May, 1995: 179-208, (1995).
Paul Milgrom and John Roberts, “The Economics of Modern Manufacturing:
Technology, Strategy, and Organization”, American Economic Review, 80:3,
511-528, (1990).
Erik Olin Wright and Rachel Dwyer, “The Patterns of Job Expansion in the
United States: A Comparison of the 1960s and 1990s”, Socio-Economic Review,
1, 289-325, (2003).