Embed Size (px)
Citation preview
In: P.Brusilovsky, M. Grigoriadou, K. Papanikolaou (Eds.): Proceedings of Workshop on Personalisation in E-Learning Environments at Individual and Group Level, 11th International Conference on User Modeling, 2007, pp. 65-70
How to Adapt the Visualization of Programs?
Andrés Moreno1, Roman Bednarik1, and Michael Yudelson2
1 Dpt. of Computer Science and Statistics, University of Joensuu, Finland
2 School of Information Sciences, University of Pittsburgh, USA
1 Introduction
Adaptation becomes a common resource in education. In educational environments, it is understood that as the student progresses, the learning material should be adapted to the student's changing needs, both knowledge-wise and cognitive-wise. Many different techniques to adapt educational materials have been proposed based on the student's knowledge , but they mostly address the textual content issues, that is, which material should be presented to a student at a given time. In this report we consider the case of adaptation of program animations. We also present a prototype implementation of the adaptive visualization of programs, and we discuss future directions of this research.
2 Program Animation Research
Program animation and algorithm animation are both active sub-fields of software visualization research. They aim to leverage the difficulties inherent to computer science education, and learning programming in particular.
Hundhausen et al. [1] performed a meta-study that revealed that algorithm animation has not be shown to be generally effective. Unfortunately, algorithm animation tools have not been widely adopted by educators yet. Naps et al. [2] report the findings of a survey carried out amongst educators to determine the factors of this low adoption level. In the survey, educators listed the benefits and disadvantages of visualization tools. Two of the factors they mentioned were 1) the time it takes to develop visualizations (90% responses), and 2) the time it takes to adapt visualizations to their teaching approach and/or to their course content (79%).
Program animation tools often visualize programs as graphical and animated representation of program execution. The graphical depiction of the execution can be based on metaphors, e.g., a robot moving according to the method calls of the students' code. It also can be faithful representation of what happens in a computer or virtual machine when that code is executed. Jeliot 3, the tool we discuss in this paper, is an example of the latter approach.
2.1 Jeliot 3
Jeliot 3 [3] animates execution of almost any code written in Java, an imperative object-oriented language. Jeliot 3 produces automatically the animation. This animation, in the present version of the system, will always be the same for given source code. Jeliot 3 is the successor of Jeliot 2000 [4]. Jeliot 3 and Jeliot 2000 share the same visual animations, but Jeliot 3 includes support for objects and other Java constructs. Furthermore, Jeliot 3 features a new architecture design that permits to add new characteristics the system [5].
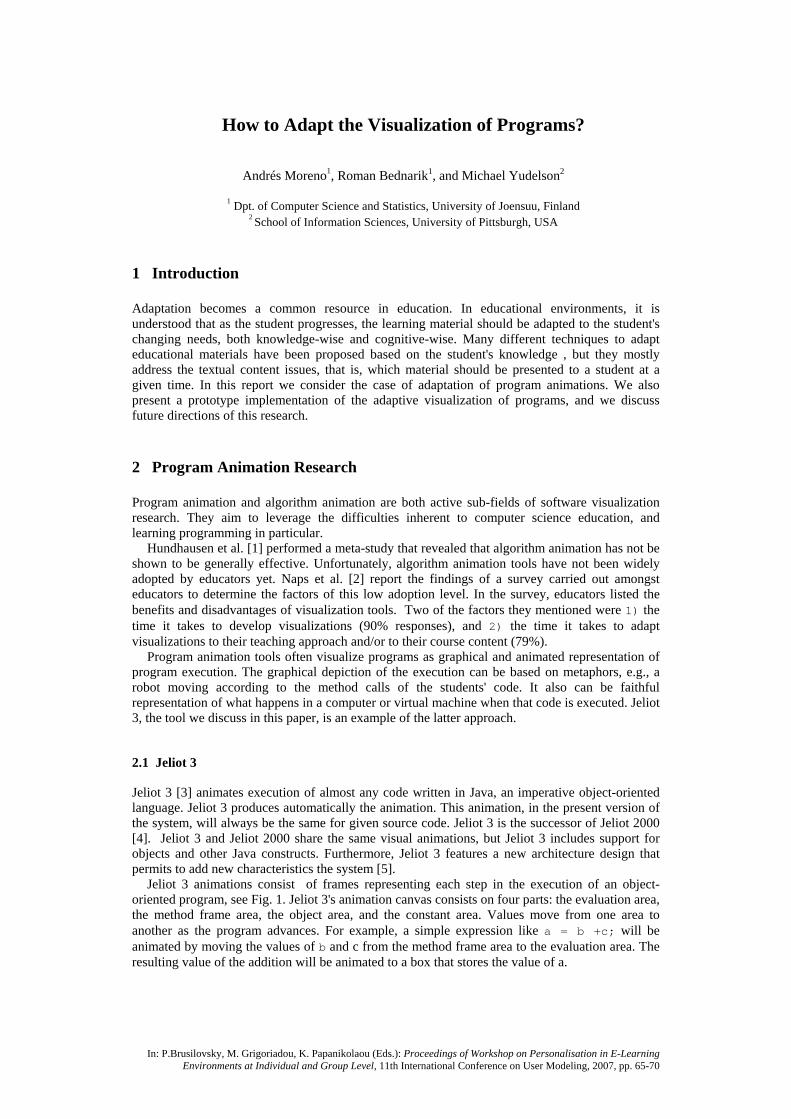
Jeliot 3 animations consist of frames representing each step in the execution of an object-oriented program, see Fig. 1. Jeliot 3's animation canvas consists on four parts: the evaluation area, the method frame area, the object area, and the constant area. Values move from one area to another as the program advances. For example, a simple expression like a = b +c; will be animated by moving the values of b and c from the method frame area to the evaluation area. The resulting value of the addition will be animated to a box that stores the value of a.
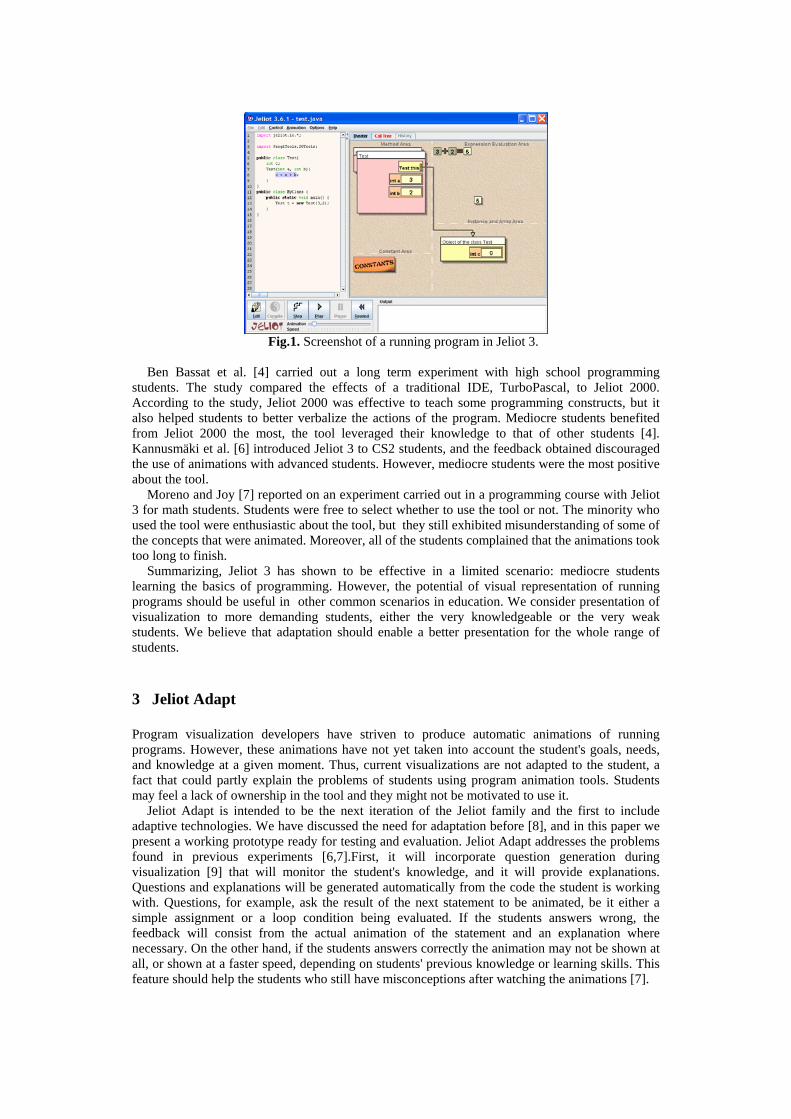
Fig.1. Screenshot of a running program in Jeliot 3.
Ben Bassat et al. [4] carried out a long term experiment with high school programming students. The study compared the effects of a traditional IDE, TurboPascal, to Jeliot 2000. According to the study, Jeliot 2000 was effective to teach some programming constructs, but it also helped students to better verbalize the actions of the program. Mediocre students benefited from Jeliot 2000 the most, the tool leveraged their knowledge to that of other students [4]. Kannusmäki et al. [6] introduced Jeliot 3 to CS2 students, and the feedback obtained discouraged the use of animations with advanced students. However, mediocre students were the most positive about the tool.
Moreno and Joy [7] reported on an experiment carried out in a programming course with Jeliot 3 for math students. Students were free to select whether to use the tool or not. The minority who used the tool were enthusiastic about the tool, but they still exhibited misunderstanding of some of the concepts that were animated. Moreover, all of the students complained that the animations took too long to finish.
Summarizing, Jeliot 3 has shown to be effective in a limited scenario: mediocre students learning the basics of programming. However, the potential of visual representation of running programs should be useful in other common scenarios in education. We consider presentation of visualization to more demanding students, either the very knowledgeable or the very weak students. We believe that adaptation should enable a better presentation for the whole range of students.
3 Jeliot Adapt
Program visualization developers have striven to produce automatic animations of running programs. However, these animations have not yet taken into account the student's goals, needs, and knowledge at a given moment. Thus, current visualizations are not adapted to the student, a fact that could partly explain the problems of students using program animation tools. Students may feel a lack of ownership in the tool and they might not be motivated to use it.
Jeliot Adapt is intended to be the next iteration of the Jeliot family and the first to include adaptive technologies. We have discussed the need for adaptation before [8], and in this paper we present a working prototype ready for testing and evaluation. Jeliot Adapt addresses the problems found in previous experiments [6,7].First, it will incorporate question generation during visualization [9] that will monitor the student's knowledge, and it will provide explanations. Questions and explanations will be generated automatically from the code the student is working with. Questions, for example, ask the result of the next statement to be animated, be it either a simple assignment or a loop condition being evaluated. If the students answers wrong, the feedback will consist from the actual animation of the statement and an explanation where necessary. On the other hand, if the students answers correctly the animation may not be shown at all, or shown at a faster speed, depending on students' previous knowledge or learning skills. This feature should help the students who still have misconceptions after watching the animations [7].
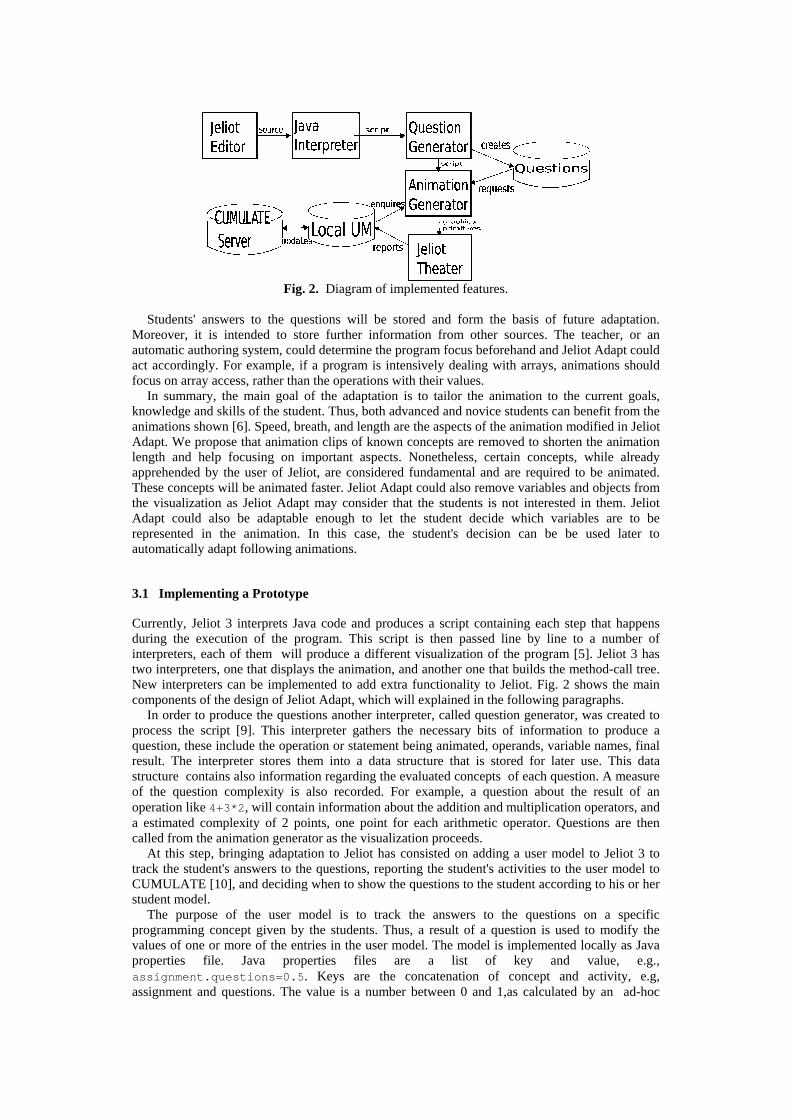
Fig. 2. Diagram of implemented features. Students' answers to the questions will be stored and form the basis of future adaptation.
Moreover, it is intended to store further information from other sources. The teacher, or an automatic authoring system, could determine the program focus beforehand and Jeliot Adapt could act accordingly. For example, if a program is intensively dealing with arrays, animations should focus on array access, rather than the operations with their values.
In summary, the main goal of the adaptation is to tailor the animation to the current goals, knowledge and skills of the student. Thus, both advanced and novice students can benefit from the animations shown [6]. Speed, breath, and length are the aspects of the animation modified in Jeliot Adapt. We propose that animation clips of known concepts are removed to shorten the animation length and help focusing on important aspects. Nonetheless, certain concepts, while already apprehended by the user of Jeliot, are considered fundamental and are required to be animated. These concepts will be animated faster. Jeliot Adapt could also remove variables and objects from the visualization as Jeliot Adapt may consider that the students is not interested in them. Jeliot Adapt could also be adaptable enough to let the student decide which variables are to be represented in the animation. In this case, the student's decision can be be used later to automatically adapt following animations.
3.1 Implementing a Prototype
Currently, Jeliot 3 interprets Java code and produces a script containing each step that happens during the execution of the program. This script is then passed line by line to a number of interpreters, each of them will produce a different visualization of the program [5]. Jeliot 3 has two interpreters, one that displays the animation, and another one that builds the method-call tree. New interpreters can be implemented to add extra functionality to Jeliot. Fig. 2 shows the main components of the design of Jeliot Adapt, which will explained in the following paragraphs.
In order to produce the questions another interpreter, called question generator, was created to process the script [9]. This interpreter gathers the necessary bits of information to produce a question, these include the operation or statement being animated, operands, variable names, final result. The interpreter stores them into a data structure that is stored for later use. This data structure contains also information regarding the evaluated concepts of each question. A measure of the question complexity is also recorded. For example, a question about the result of an operation like 4+3*2, will contain information about the addition and multiplication operators, and a estimated complexity of 2 points, one point for each arithmetic operator. Questions are then called from the animation generator as the visualization proceeds.
At this step, bringing adaptation to Jeliot has consisted on adding a user model to Jeliot 3 to track the student's answers to the questions, reporting the student's activities to the user model to CUMULATE [10], and deciding when to show the questions to the student according to his or her student model.
The purpose of the user model is to track the answers to the questions on a specific programming concept given by the students. Thus, a result of a question is used to modify the values of one or more of the entries in the user model. The model is implemented locally as Java properties file. Java properties files are a list of key and value, e.g., assignment.questions=0.5. Keys are the concatenation of concept and activity, e.g, assignment and questions. The value is a number between 0 and 1,as calculated by an ad-hoc
asymptotic formula .The local user model is synchronized with the one the student has at CUMULATE server, hence activities done with different tools that also make use of the centralized user model will also affect the use of Jeliot Adapt by such students. For example, a user could follow an introduction to logical expressions in a tool such as WADEIn II [11] and later use Jeliot Adapt to animate complex programs. In this case Jeliot Adapt would tailor the animation to focus on flow statements rather than logical expressions.
3.2 User Modeling Backend
Jeliot Adapt relies on [10,12]. CUMULATE is a centralized user modeling server. It infers user knowledge of domain concepts based on evidence supplied by external applications,such as Jeliot Adapt. The internal structure of CUMULATE consists of users whose knowledge is modeled in terms of concepts that belong to one or several problem domains (in our case domain is Java programming); learning objects are external entities that supply evidence. CUMULATE also maintains indexing of learning objects in terms of domain concepts.
CUMULATE implements a number of communication protocols called ADAPT2 (Advanced Distributed Architecture for Personalized Teaching and Training). These protocols describe the format of communication between user modeling server, in our case CUMULATE, and a client application. When the application reports user activities to CUMULATE it sends the user login data, and more importantly, information about the activity. The information about the activity consist of an learning object identifier of the activity and its result. In our case the main identifier would be question, and further identified by a sub-activity parameter that refers to which programming concept is the activity about.
When a new evidence arrives, CUMULATE “propagates” it to concepts through the links of learning object to concepts [12]. There are several algebraic formulas that are used to propagate evidence in CUMULATE. Jeliot Adapt has been configured to use ad hoc asymptotic formula. This formula makes larger increments for first evidences of successful interaction with learning objects and gradually decreases the amount of increment for each following successful result. There is no penalty for unsuccessful results.
Inference about user knowledge is performed on the server as soon as new evidence arrives. At this moment the user model can be queried for the inferred knowledge. To receive a report of the inferred knowledge Jeliot Adapt sends a query to a report manager servlet in the form of HTTP GET request and specifies the following: user identity (login), identity of a requesting application, problem domain (concepts of which were modeled), list of concepts of interest (can be omitted when the whole domain is of interest). Jeliot Adapt will only ask for the inferred knowledge once per animation session, to reduce the load on the server, and the wait in the client application. In order to speed up the processing of the response, Jeliot Adapt requests the server to reply in the form of a Java serialized object. An example of query for user model could be of the following format: http://kt1.exp.sis.pitt.edu:8080/ReportManager?typ=con&frm=dat&usr=mike&app=jeliot &dom=java_topics. Here Jeliot is requesting the progress report of user mike regarding concepts (typ=con) from domain java_topics in the form of Java serialized objects (frm=dat).
4 Evaluating the Adaptivity in Program Visualization
Similarly as in the previous cycles of Jeliot development, we consider the evaluation of the new adaptive program visualization system an indivisible part of our research agenda. In past, non-adaptive versions of Jeliot 3 have been empirically evaluated both in classroom and laboratory experiments, as summarized, e.g., in [13]. However, as the empirical evaluations of adaptive systems are no so frequent [14,15], we believe it is a topic worth discussing in this paper.
Evaluation of an adaptive system is, agreeably, a non-trivial task. Brusilovsky et al. [16] proposed that an adaptive system evaluation shall be approached in a layered fashion. That means that the evaluation of content and the evaluation of interface shall be conducted separately. We also find this approach useful, and plan to investigate effects of the interface adaptation (adaptive navigation) and the effects of content adaptation separately. For a recent comprehensive review of evaluation techniques, see [17].
Previously, we have also suggested that evaluations of adaptive interfaces could have benefited from recording users patterns of visual attention [18]. Based on an eye-mind hypothesis, eye-movement tracking can provide deeper insights into users cognitive processing. We plan to conduct such evaluations also with the proposed adaptive program visualization. This type of data shall help us to discover and compare the underlying cognitive processing wit or without adaptation; thus, the effects of the adaptive interventions we described above can be studied not only on the level of eventual learning improvements, but also on a lower level of detail. Shall the results discover positive effects of adaptivity, in future, also eye-movement data can serve as a source of adaptivity for program visualization, similarly as in [19].
As far as the choice of evaluation methodology is considered, in our previous work we have learned that both qualitative and quantitative approaches to evaluation are needed to study the interaction with program visualization systems [20]. Chin [14] claims that adding a user model to an existing system is likely to increase the system's complexity and therefore unforeseen interactions between the components can appear and present new challenges. This might also be the case with the adaptive version of Jeliot, already a complex system —all to design, use, and evaluate— even without the user model. We plan to approach the design-evaluation cycle of the adaptive program visualization system by small incremental changes in each design stage. This, in turn, will allow us to target the evaluation in each stage to the effects of the small interventions. We believe that this approach could maximize our chances to discover important effects while it minimizes the increasing complexity of the overall system.
5 Discussion and Future Work
In this paper we have presented our views on what can be a complete adaptive visualization environment for programming topics and introduced its user modeling solution. Jeliot Adapt could be regarded as an extension to WADEIn II [11]. WADEIn II animates logical and arithmetic expressions. On the contrary, Jeliot Adapt is not limited to expressions or a narrow set of programing constructs but, as students can code their own solutions to Java exercises, the adaptive animation can be used for debugging and problem solving scenarios. Brusilovsky et al. [21] made a case for adaptive program animation, but criticized Jeliot 3 as “shallow” for not being specific to any programming topic. The questions and explanations to be included in Jeliot Adapt should make it profound, while still keeping the universality property of Jeliot 3.
The combined user model of Jeliot Adapt includes the centralized user-model, in CUMULATE, and a local one, which allows for on-line and off-line learning. Students can use Jeliot Adapt from different computers, and be able to access to their on-line user model. However, this solution brings up an issue on synchronization between the user models. Both user models should have a date stamp for every item, so synchronization will only affect those which have been modified recently.
We see individual level personalization as a first step towards adapting the program visualization to group level. There are probably as many scenarios in which program visualization is being currently employed by a group of users as it is used by an individual. For example, students often work in pairs or small group during exercise sessions. In this case, adaptation cannot be done based exclusively on the knowledge of the individuals, but also based on other factors that the teacher or, even better, the system should set up for each session or programming assignment. Examples of factors could be topics covered in the exercise, or common bugs introduced by students. In the current implementation, Jeliot Adapt is integrated in Moodle as a module, where teachers can set up exercises to do with Jeliot. The module could gather contextual information from the learning objects surrounding the Jeliot Adapt activity.
Finally, the open design of Jeliot Adapt allows for future addition of activities from within or outside Jeliot, which can be tracked in the user model and serve as a basis for better adaptation. WadeIn II [11] is an example of activities from an external source. Within Jeliot Adapt, new activities could be designed that increase the students' level of engagement with the tool and at the same time provide useful data for future adaptation.
Acknowledgments. The authors would like to thank Prof. Peter Brusilovsky for his valuable encouragement and Niko Myller for his support and developing key features in Jeliot 3.
References
1. Hundhausen, C.D., Douglas, S.A., Stasko, J.T.: A meta-study of algorithm visualization effectiveness. Journal of Visual Languages and Computing 13(3) (2002) 259–290
2. Naps, T., Cooper, S., Koldehofe, B., Leska, C., Rößling, G., Dann, W., Korhonen, A., Malmi, L., Rantakokko, J., Ross, R.J., Anderson, J., Fleischer, R., Kuittinen, M., McNally, M.: Evaluating the educational impact of visualization. In: ITiCSE-WGR ’03: Working group reports from ITiCSE, New York, NY, USA, ACM Press (2003) 124–136
3. Moreno, A., Myller, N., Sutinen, E., Ben-Ari, M.: Visualizing programs with Jeliot 3. In: AVI. (2004) 373–376
4. Ben-Bassat Levy, R., Ben-Ari, M., Uronen, P.A.: The Jeliot 2000 program animation system. Computers & Education 40(1) (2003) 1–15
5. Bednarik, R., Moreno, A., Myller, N.: Various Utilizations of an Open-Source Program Visualization Tool, Jeliot 3. Informatics in Education 5(2) (2006) 195–206
6. Kannusmäki, O., Moreno, A., Myller, N., Sutinen, E.: What a novice wants: Students using a program visualization in distance programming course. In Korhonen, A., ed.: Proceedings of the Third Program Visualization Workshop, The University of Warwick, UK (July 2004) 126–133
7. Moreno, A., Joy, M.: Jeliot 3 in a Demanding Educational Setting. In: Proceedings of the Fourth International Program Visualization Workshop, Florence, Italy (2006) 48–53
8. Bednarik, R., Moreno, A., Myller, N., Sutinen, E.: Smart program visualization technologies: Planning a next step. In: Proceedings of the 5th IEEE International Conference on Advanced Learning Technologies, Kaohsiung, Taiwan (2005) 717–721
9. Myller, N.: Automatic Prediction Question Generation during Program Visualization. In: Proceedings of the Fourth International Program Visualization Workshop, Florence, Italy (2006) 89–93
10. Brusilovsky, P., Sosnovsky, S., Shcherbinina, O.: User modeling in a distributed e-learning architecture. In L. Ardissono, P.B., Mitrovic, A., eds.: Proceedings of 10th International User Modeling Conference, Springer Verlag 387–391
11. Brusilovsky, P., Loboda, T.D.: Wadein II: a case for adaptive explanatory visualization. SIGCSE Bull. 38(3) (2006) 48–52
12. Yudelson, M., Brusilovsky, P., Zadorozhny, V.: A user modeling server for contemporary adaptive hypermedia: an evaluation of push approach to evidence propagation. In: Proceedings of the 11th International User Modeling Conference (UM 2007). (July 2007)
13. Bednarik, R., Moreno, A., Myller, N.: Program visualization for programming education - case of Jeliot 3. Association for Computing Machinery New Zealand Bulletin (2006)
14. Chin, D.N.: Empirical evaluation of user models and user-adapted systems. User Model. User-Adapt. Interact. 11(1-2) (2001) 181–194
15. Gena, C.: Evaluation methodologies and user involvement in user modeling and adaptive systems. In: Simposium on Human-Computer Interaction, HCITALY’2003, RT75/2003. (2003) 74–78
16. Brusilovsky, P., Karagiannidis, C., Sampson, D.: The benefits of layered evaluation of adaptive applications and services. In: Empirical Evaluation of Adaptive Systems. Proceedings of workshop at the Eighth International Conference on User Modeling (UM’01). (2001) 1–8
17. Gena, C.: Methods and techniques for the evaluation of user-adaptive systems. Knowl. Eng. Rev. 20(1) (2005) 1–37
18. Bednarik, R.: Potentials of eye-movement tracking in adaptive systems. In: Proceedings of the Fourth Workshop on the Evaluation of Adaptive Systems. (July 2005) 1–8
19. Conati, C., Merten, C., Muldner, K., Ternes, D.: Exploring eye tracking to increase bandwidth in user modeling. In: Proceedings of the Fourth Workshop on the Evaluation of Adaptive Systems. (July 2005)
20. Myller, N., Bednarik, R.: Methodologies for studies of program visualization. In: Proceedings of Methods, Materials and Tools for Programming Education (MMT2006). (May 2006) 37–42
21. Brusilovsky, P., Grady, J., Spring, M., Lee, C.H.: What should be visualized?: faculty perception of priority topics for program visualization. SIGCSE Bull. 38(2) (2006) 44–48
22. Kumar, A.: Generation of problems, answers, grade, and feedback case study of a fully automated tutor. 5(3) (September 2005) Article 3