Embed Size (px)
Citation preview

NOTE: The use of
the following opening
title slide is
MANDATORY in
each PowerPoint
presentation for in-
show continuity and
post-show on-
demand web
viewing. Please
include seminar title,
sponsor logo and
speaker names/titles.
Presented by:
Jim Barnes, President & CEO
How to Apply Lean Principles to a DC
Your Logo
Goes Here!
© 2016 MHI® Copyright claimed for audiovisual works and sound recordings of seminar sessions. All rights reserved.

Implementation and Benefits of
Lean Thinking for the Supply Chain • Lean practices are all too often associated with
manufacturing, when in reality the tools and training are ideal for any environment, including the Supply Chain execution market. Considering that logistics cost as a percent of company sales is on the rise and now over 9%, utilizing the fundamentals of Lean tools can save millions of dollars in operating costs, which will go right to your bottom line profitability.
• This learning session will discuss the uses of Lean tools for the Supply Chain that takes in the range of operations such as warehousing & distribution, transportation, inventory management, and labor.

Takeaways from this session
include: An overview of Lean practices and why they will
work for you
The importance of gaining stakeholder buy-in
Learning why data is the key
Common Lean tools and how to use them
Why implementation doesn’t have to be expensive or complex
Best practice recommendations for Lean project implementation teams
How to plan & execute a Kaizen event
Example savings and case studies

Agenda
• What is Lean & Six Sigma
• Lean Methodology
• Key Lean Tools
• Case Studies
• Q/A

What is Lean?
• Set of Principles to Remove Waste and
Inefficiency from the Process
“…we concluded that Lean Thinking can be summarized in
five principles: precisely specify value by specific product,
identify the value stream for each product, make value
flow without interruptions, let the customer pull value
from the producer, and pursue perfection.”
James P. Womack and Daniel T. Jones: “Lean Thinking”

What is Lean Six Sigma?
• To achieve Six Sigma, a process must not produce more than 3.4 defects per million opportunities. A Six Sigma defect is defined as anything outside of customer specifications.
• Six Sigma at many organizations simply means a measure of quality that strives for near perfection. Six Sigma is a disciplined, data-driven approach and methodology for eliminating defects (driving toward six standard deviations between the mean and the nearest specification limit) in any process – from manufacturing to transactional and from product to service.
“…If you can not measure it, you can not improve it” Lord Kelvin


Evolution of Quality-Timeline
Industrial Revolution
Americans to Japan
Japanese Concepts
Post Japan’s Industrial Success

Lean Principles 1. Base your management decisions on a long term philosophy, even at the
expense of short-term financial goals.
2. Create a continuous process flow to bring problems to the surface.
3. Use “pull” systems to avoid overproduction.
4. Level out the workload (work like the tortoise, not the hare).
5. Build a culture of stopping to fix problems, to get quality right the first time.
6. Standardized tasks and processes are the foundation for continuous
improvement and employee empowerment.
7. Use visual controls so no problems are hidden.
8. Use only reliable, thoroughly tested technology that serves your people
and process.

Lean Principles- cont’d 9. Grow leaders who thoroughly understand the work, live the philosophy, and
teach it to others.
10.Develop exceptional people and teams who follow your company’s
philosophy.
11.Respect your extended network of partners and suppliers by challenging
them and helping them improve.
12.Go and see for yourself to thoroughly understand the situation.
13.Make decisions slowly by consensus, thoroughly considering all options;
implement rapidly.
14.Become a learning organization through the relentless reflection and
continuous improvement.

Kaizen A Kaizen is the organized use of common sense to improve cost,
quality, delivery and responsiveness to your customers needs. Kaizen
assembles small cross-functional teams aimed at improving a process
or problem identified within a specific area in a very short period of
time “Quick Wins”.
Most Kaizen events will drive savings of 10 times and greater the
cost of the event in a very short period of time.
A Kaizen event would focus on:
• What adds value to the end customer
• Consider problems and solutions end to end
• Base all decisions on facts
• Maintain a strong bias toward action
• Use the three actions (People, Place & Process)

Kaizen Event Road Map
Effort
Benefit
.5
1.5
1.0
2.0
2.5
.5
3.0
3.5
4.0
4.5
5.0
1.0 1.5 2.0 2.5 3.0 3.5 4.0 4.5 5.0
1 2
3
4
5
8 9
10
7 6
Brainstorm Solutions
Team Training
Final Presentation Action Items Test Plans
What Who When How
Discovery And Observation
Prioritize Solutions
Celebrate
Cause and Effect VA and NVA
Cause & Effect
Tuesday &
Wednesday Wednesday
Thursday
Monday
Friday

Test Plans and Action Items Action Items / Test Plans
What Who When How
What/Problem Statement
Solution/Hypothesis
"What's the plan"
Action Plan/Test Verify/Measure
"What action is being taken" "What results do we expect"
Detail Action Plan Insights/Observations Why/Cause & Effect

Returns - Receiving Observations/Opportunity
• Returns cartons are transported to a
sorting area and then sorted and
counted and scanned before staged
in return lanes.
Possible Solution/Recommendations
• Eliminate the double handling of cases by moving pallets directly to
return lanes.
• Eliminate 1st scan by sorter. If required, scan when placing cartons on
the return rollers maintaining a 24 hour processing standard.

Lean Team Review your facility to identify areas for improvement.
Use Lean Process Improvement Teams (6-10 members)
to support projects that are more complex than a Kaizen
event “quick hits”.
Why a Lean Process Improvement Teams: • To increase participation and buy-in
• To encourage trust, open communications and a spirit of respect and cooperation
• To reduce costs and improve productivity
Lean Team Focus: • Aggressive questioning of all business practices
• The elimination of all non-value added activities (waste, variability, constraints)
• Destroy all barriers that prohibit the pursuit of total customer satisfaction (internal and
external customers)

Lean Filter
Build a culture that involves everybody in a quest for perfection
“Every time the material is handled something is added to its cost but not necessarily its value”
-Henry Royce,
-co founder of Rolls-Royce

Activities that are required by the business but add no real value from a customer standpoint
Activities that are required by the business but add no real value from a customer standpoint
Activities which are not required to meet or exceed customer needs and are not required by the business
Waste
TIMWOOD - 7 Types of Waste
Exercise
• Using the 7-Types of Waste – TIMWOOD
– Pick one process that you understand in your
operations that you believe has some
opportunities
– See if you can come up with one example for
each type
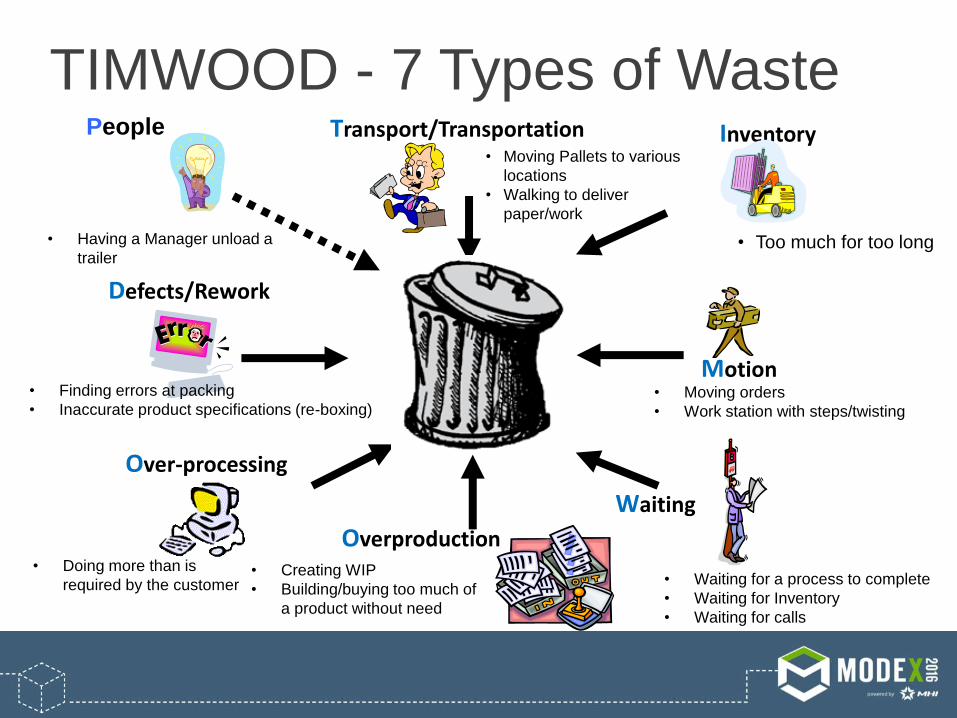
TIMWOOD - 7 Types of Waste
Overproduction
Inventory
Waiting
People
Over-processing
Defects/Rework
• Creating WIP
• Building/buying too much of
a product without need
• Too much for too long
• Waiting for a process to complete
• Waiting for Inventory
• Waiting for calls
• Moving Pallets to various
locations
• Walking to deliver
paper/work
• Moving orders
• Work station with steps/twisting
• Doing more than is
required by the customer
• Finding errors at packing
• Inaccurate product specifications (re-boxing)
• Having a Manager unload a
trailer
Transport/Transportation
Motion

5S
A3 Form and Format
Buffer and Safety Stock
Cellular Layout: U-Shaped Design
Continuous Information Flow
Change Over
Cycle Time
Employee Engagement
Gemba
Heijunka – Load Leveling
Jidoka
Just-In-Time
KaizenKanban (Pull Systems)
Lean Assessment
Lean Basics (Philosophy, History)
Lean Communication
Lean Metrics
Lean Reporting
Line Balancing
Paced Withdrawl
PDCA
Pitch
Poka-Yoke (Mistake Proofing)
Predictable Output
Problem Solving
Process Mapping Pull Systems
Quick Changeover
Resistors and Constraints
Six Sigma
SMED
Standard Work
Story Board
Takt Time
The Scorecard and Goal Display
Tool Management
TPM
Value Stream Management
Value Stream Mapping
Visual Controls
Visual Factory
Waste (Muda)
Work Load Balancing
Lean Tools

Map the Process
Log-In to Defective Menu
Check-in
Obtain product off cart
View label to determine action
required1 RTN?
Place in Q/A cart
Yes
NoScan label & Select
defective dispositionApply label to
productYes
Location for Vendor?
Write Vendor # on label
No
Liquidate?
Place to gayload/pallet
(Soft/Hard & Bulk)
Yes
Place on No location pallet
Start
Is it scrap
No
Place to scrap pallet
Yes
Place to RTV cart by aisle
NoIs RTV cart full?Place on put-a-way
cart Yes
Travel to stock location
Is location full?
Notify RTV Associate
Yes
Start
NoMore to put a
way?
No
Yes No
Start
Layout – Create more of a “U” shape
design to reduce walking to gaylords/
bulk pallet
Have disposition and location printed on
return label
Replace RTV cart by aisle with put-way carts for each aisle

Seven Basic Quality Tools 1. Pareto Analysis
– What are the Big Problems
2. Cause and Effect Diagram Fishbone
– What’s Causing the Problems?
3. Stratification – How is the Data Made Up?
4. Check Sheets – How often Does it Occur?

Seven Basic Quality Tools 5. Histograms
– What is the Overall Variation?
6. Scatter Charts
– What are the Relationships between the
Factors?
7. Process Control Chart
– Which Variations to Control and How?

5-S Layout
Sorting (Seiri)
Stabilizing or Straightening Out (Seiton)
Sweeping or Shining (Seiso)
Standardizing (Seiketsu)
Sustaining the Practice (Shitsuke)

Before Lean Thinking
Door Door
Spaghetti Diagram
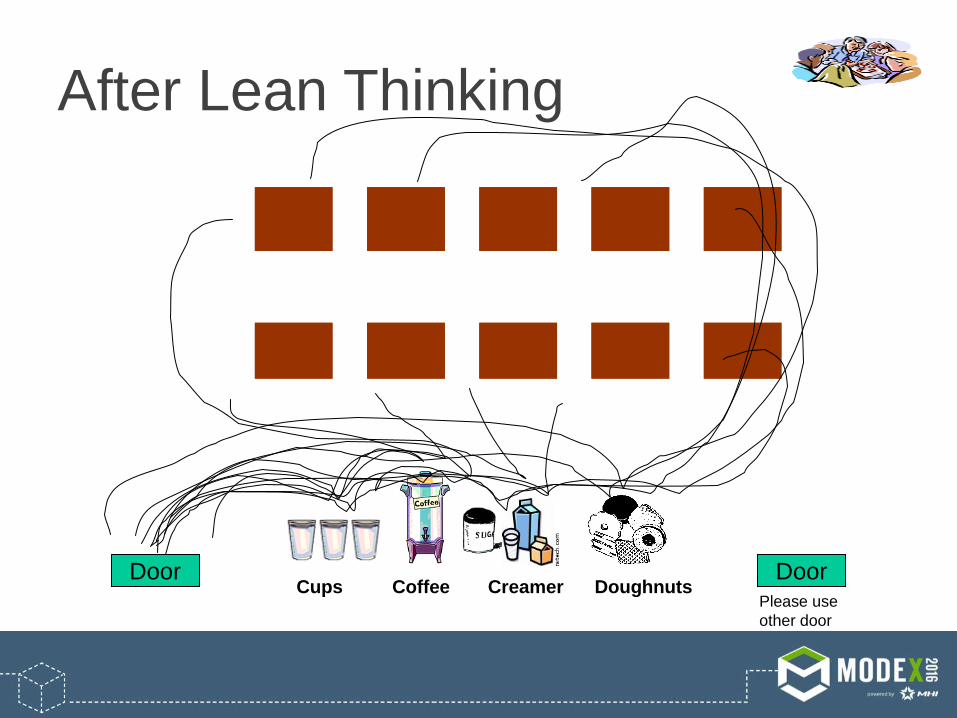
After Lean Thinking
Cups Coffee Creamer DoughnutsDoor Door
Please use
other door

Purpose: • A questioning technique for getting beyond
symptoms and uncovering root causes. How it works: • When you are working with a cause-and-
effect diagram and have identified a probable cause, ask, "Why is that true?“
• When you have an answer, ask, "Why is that true?“
• Continue asking “why” five times.
27
LEAN Tools – 5 WHYS Cause & Effect

Cause and Effect • Fishbone Diagrams
Cause & Effect

U-Shape Work Cell

Value Stream Mapping Definition • Special type of flow chart that uses
symbols known as "the language of Lean" to
depict and improve the flow of inventory
and information.

Why Create a VSM? • Many organizations pursuing “lean” conversions have
realized that improvement events alone are not enough
• Improvement events create localized improvements,
value stream mapping & analysis strengthens the gains
by providing vision and plans that connect all
improvement activities
• Value stream mapping & analysis is a tool that allows
you to see waste, and plan to eliminate it


Did we cover the takeaways from
this session? An overview of Lean practices and why they will
work for you
The importance of gaining stakeholder buy-in
Learning why data is the key
Common Lean tools and how to use them
Why implementation doesn’t have to be expensive or complex
Best practice recommendations for Lean project implementation teams
How to plan & execute a Kaizen event
Example savings and case studies

Case Studies are next
• Retail DC/Stores – VSM • Store Delivery Method • Retail Web Orders Network
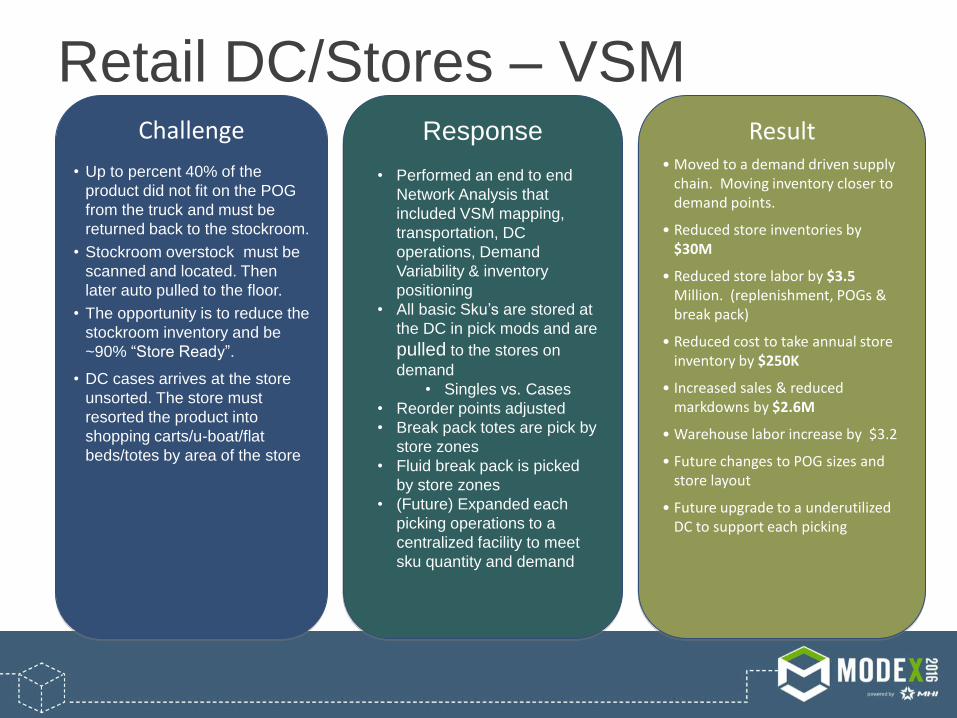
Retail DC/Stores – VSM Challenge
Response
• Performed an end to end
Network Analysis that
included VSM mapping,
transportation, DC
operations, Demand
Variability & inventory
positioning
• All basic Sku’s are stored at
the DC in pick mods and are
pulled to the stores on
demand
• Singles vs. Cases
• Reorder points adjusted
• Break pack totes are pick by
store zones
• Fluid break pack is picked
by store zones
• (Future) Expanded each
picking operations to a
centralized facility to meet
sku quantity and demand
Result • Moved to a demand driven supply
chain. Moving inventory closer to demand points.
• Reduced store inventories by $30M
• Reduced store labor by $3.5 Million. (replenishment, POGs & break pack)
• Reduced cost to take annual store inventory by $250K
• Increased sales & reduced markdowns by $2.6M
• Warehouse labor increase by $3.2
• Future changes to POG sizes and store layout
• Future upgrade to a underutilized DC to support each picking
• Up to percent 40% of the
product did not fit on the POG
from the truck and must be
returned back to the stockroom.
• Stockroom overstock must be
scanned and located. Then
later auto pulled to the floor.
• The opportunity is to reduce the
stockroom inventory and be
~90% “Store Ready”.
• DC cases arrives at the store
unsorted. The store must
resorted the product into
shopping carts/u-boat/flat
beds/totes by area of the store


DC and Network Analysis
37
DC Locations and Site Count
DC Space and Cube Capacity
Transportation Delivery Method
Transportation Delivery
Frequency
DC Processing Throughput
Inventory Positioning
Demand Driven Planograms
Store Analysis
Inventory Analysis
Demand Variability
Store Operations
Transportation
Analysis
1
2
3
0
1
2
3
4
1 10 100 1000 10000 100000 1000000 10000000
SKU
Vel
oci
ty C
V
Velocity
Bakeware
Bakeware
1a 1b 1c
2a 2b 2c
3a 3b 3c

Demand Variability Demand Variability
104 Total Departments
Sale
s R
evenue b
y D
epart
ment Departments
plotted by CV vs. Demand.
Most Depts. are High CV & Low
Demand

Fluid Break - Extend conveyor down
• Low capital cost option – quick change
Fluid Break HBA #1
Fluid Break HBA #1
Fluid Break Apparel
#2
Fluid Break Apparel
#2
Fluid Break Hard/ Home
#3
Fluid Break CE/Toys
#4
Fluid Break Shoes #5/ Seasonal
#6
Fluid Pallets Staging
6 zones
3C 3D 4A 4B 4C 4D 5A 5B 5C 5D 6A 6B 6C 6D 7A 7B 7C 7D 1E 1F 1G 1H 1A 1B 1C 1D 2A 2B 2C 2D 3A 3B
P P P P
Extend conveyor down or up
32 pallet positions (14 - 16 store zones – A/B)

New sequence of store zones
based on adjacency Sequence Fluid Zone Store Zone Store Zone Description
1 1 1 HBA
2 1 5 Health Aids/OTC
3 6 15 School/Office
4 1 2 Candy/Grocery/Dollar Store
5 1 4 Pet Supplies
6 1 3 Household/Chemicals
7 3 6 Hardware/Auto
8 3 12 Home Décor
9 3 13 Candles
10 3 7 Housewares
11 3 11 Domestics
12 6 8 Furniture/Seasonal
13 6 9 Sporting Goods
14 4 10 Toys
15 4 14 Electronics
16 2 18 Women’s
17 2 20 Jewelry
18 2 16 Children’s
19 2 17 Men’s
20 5 19 Active Shoes
HBA Sequence
Hard/Home Sequence
Electronic/Toys Sequence
Apparel Sequence
Active Shoes

Break Case - Centralized
Small Format
Large Format

Automated Waving to support floor loaded shipping

Store Delivery Method
Challenge
Response
• Test different methods on delivering cases and totes to stores to reduce delivery time
• Deliver cases and totes on pallets
• Deliver cases in carts and totes on dollies
• Work with DC procedures to implement both methods, lean out each process
• Conduct time studies at DC & store level to measure results
Result
• Initial test results resulted in significant DC labor cost to build a trailer.
• DC cost was reduced significantly by observing and using LEAN techniques to improve the process
• Both test (Dollies/Carts and Pallets) reduced the delivery time at stores and store labor
• Delivery on Pallets reduced delivery time to 45 minutes, thus turning the trailer 3.5 hours faster
• Store delivery are live offloads and the trailers are floor loaded and take up to 2 hours to unload
• Driver can only deliver 3 stores per day
• Delivery times vary by day and are highly variable making it difficult for the store to staff the unload

Flow Charting the Process
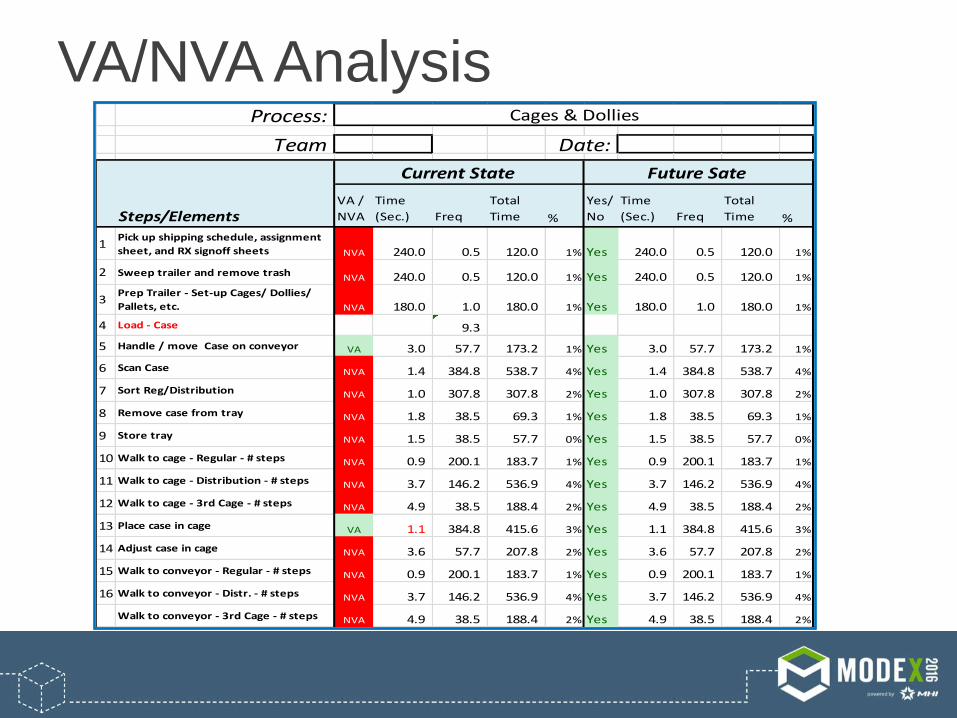
VA/NVA Analysis Process:
Team Date:
Steps/ElementsVA /
NVA
Time
(Sec.) Freq
Total
Time %
Yes/
No
Time
(Sec.) Freq
Total
Time %
1Pick up shipping schedule, assignment
sheet, and RX signoff sheets NVA 240.0 0.5 120.0 1% Yes 240.0 0.5 120.0 1%
2 Sweep trailer and remove trash NVA 240.0 0.5 120.0 1% Yes 240.0 0.5 120.0 1%
3Prep Trailer - Set-up Cages/ Dollies/
Pallets, etc. NVA 180.0 1.0 180.0 1% Yes 180.0 1.0 180.0 1%
4 Load - Case 9.3
5 Handle / move Case on conveyor VA 3.0 57.7 173.2 1% Yes 3.0 57.7 173.2 1%
6 Scan Case NVA 1.4 384.8 538.7 4% Yes 1.4 384.8 538.7 4%
7 Sort Reg/Distribution NVA 1.0 307.8 307.8 2% Yes 1.0 307.8 307.8 2%
8 Remove case from tray NVA 1.8 38.5 69.3 1% Yes 1.8 38.5 69.3 1%
9 Store tray NVA 1.5 38.5 57.7 0% Yes 1.5 38.5 57.7 0%
10 Walk to cage - Regular - # steps NVA 0.9 200.1 183.7 1% Yes 0.9 200.1 183.7 1%
11 Walk to cage - Distribution - # steps NVA 3.7 146.2 536.9 4% Yes 3.7 146.2 536.9 4%
12 Walk to cage - 3rd Cage - # steps NVA 4.9 38.5 188.4 2% Yes 4.9 38.5 188.4 2%
13 Place case in cage VA 1.1 384.8 415.6 3% Yes 1.1 384.8 415.6 3%
14 Adjust case in cage NVA 3.6 57.7 207.8 2% Yes 3.6 57.7 207.8 2%
15 Walk to conveyor - Regular - # steps NVA 0.9 200.1 183.7 1% Yes 0.9 200.1 183.7 1%
16 Walk to conveyor - Distr. - # steps NVA 3.7 146.2 536.9 4% Yes 3.7 146.2 536.9 4%
Walk to conveyor - 3rd Cage - # steps NVA 4.9 38.5 188.4 2% Yes 4.9 38.5 188.4 2%
Cages & Dollies
Current State Future Sate

Test & Adjust • Work the layout and adjusting
after each test
Or
Dollies
8
6
Wrap Pallets
4
12
4 6
6
4
1 2
3
Dist 5
3
3
Totes 5
4 4
5
5
Totes 6
5
6
All Pallets
Inside Trailer
Reg
Cos
Food
RX
Wrap Pallets
Pallets Pallets
Regular
40 88
Staging 6
18 414
# 6Jack
4
21 2
3 4
DistReg
Totes
Wrap Pallets
Stage Pallets Stage Pallets Stage Pallets

Process Changes Made/Tested
• Placement of pallets to conveyor
• Angle of pallets
• Building pallets inside a trailer
• Defining what sorts were required
• Where to strap totes – Outside the trailer/inside the trailer
• Positioning of conveyor
• Proper staffing
• Flexing the staff
• Types of cages and positioning
• Training of drivers
• Order in which to unload
• Store staffing and support

DC Productivity Leaning out the Process after each test will lead from an unsuccessful test to successful test
Store Productivity Leaning out the Process after each test will lead from an unsuccessful test to successful test

Dollies vs. Pallets - Loading • Dollies took significantly more time to strap
and transport than on pallets Test Cases/Hour
Totes on Dollies 101
Totes on Pallets 169
Observation
Test
Dollies vs. PalletsOverall
Units/Hr Man Hrs
Units/
Hr Man Hrs
Units/
Hr Man Hrs
Units/
Hr Man Hrs
Units/
Hr Man Hrs
Units/
Hr Man Hrs
Units/
Hr Man Hrs
Units/
Hr
Totes on Dollies100 1.1 96 1.8 103 0.6 130 1.8 89
Totes on Pallets (wo Load 8)169 0.9 190 1.1 137 0.6 194
Pallets &
Dollies
Pallets &
Dollies Pallets Pallets
Pallets &
Dollies
Pallets &
Dollies Pallets
Load 7Load 1 Load 2 Load 3 Load 4 Load 5 Load 6
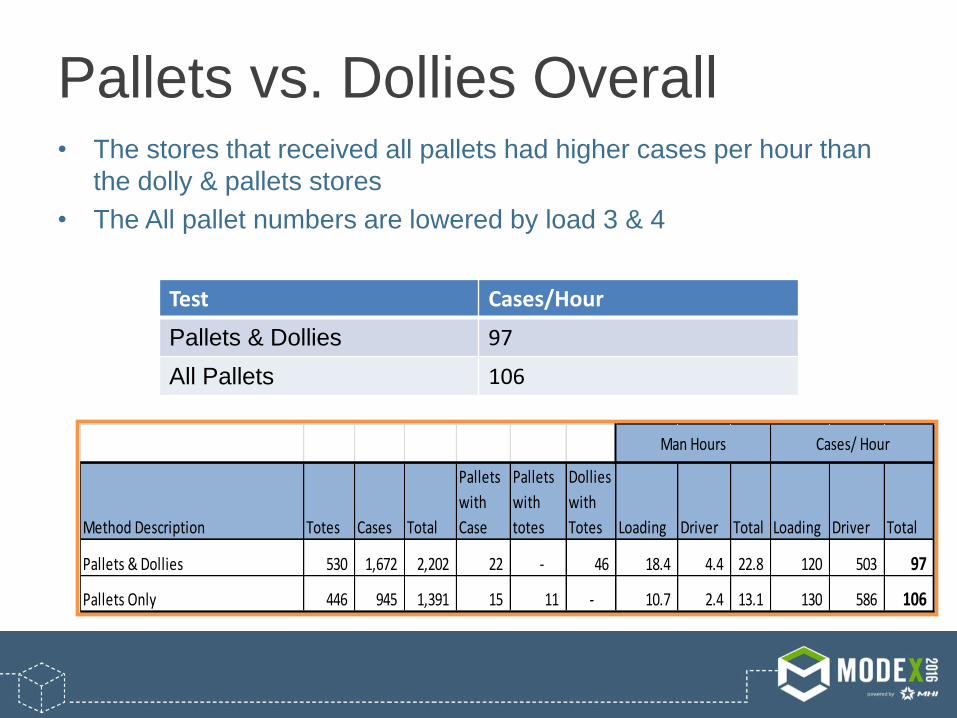
Pallets vs. Dollies Overall • The stores that received all pallets had higher cases per hour than
the dolly & pallets stores
• The All pallet numbers are lowered by load 3 & 4
Test Cases/Hour
Pallets & Dollies 97
All Pallets 106
Method Description Totes Cases Total
Pallets
with
Case
Pallets
with
totes
Dollies
with
Totes Loading Driver Total Loading Driver Total
Pallets & Dollies 530 1,672 2,202 22 - 46 18.4 4.4 22.8 120 503 97
Pallets Only 446 945 1,391 15 11 - 10.7 2.4 13.1 130 586 106
Man Hours Cases/ Hour

Retail Web Orders Network
Challenge
Response
• Develop network costing model to understand network cost and options
• Use ship from store to handle single and non split orders
• Update fulfillment algorithm to ship from the closest store with the highest risk inventory
• Use “Auto Parts” model to move orders from store to store to fulfill multiple units/sku orders to reduce split shipments(Test in high density store area)
Result
• Moved 70% of orders from fulfillment center(peak season) to ship from store.
• Reduced transit days from 2.95 days to 1.4 days
• Improved margin dollars ($ millions) by moving at risk inventory out of the stores
• Parcel cost up slightly which was offset by lower pick and pack cost at stores.
• Store order volume doubled without major labor impact – Used store labor during down time
• Split shipments increased
• Web orders growing at 30% annually supported by 1 fulfillment center & 1 DC
• Holiday period creates a spike in business that is 100% greater than normal weeks
• Customers are demanding/expecting faster delivery time – 1 day service
• What would same day delivery look like and what it would cost
• Free delivery expectations adding additional pressure to reduce fulfillment cost

Network Strategy

25% of the store hours are idle/coverage hours that can be used to fulfill orders
“Auto part” model, cost drops as orders go up
Ship from Store model

50% of the orders are within 20 miles from the store Note that 14% of customers and 6% of orders are outside of 100 miles from stores and are not shown
Peak season doubles/triple compared to avg. week
Understand demand by hour
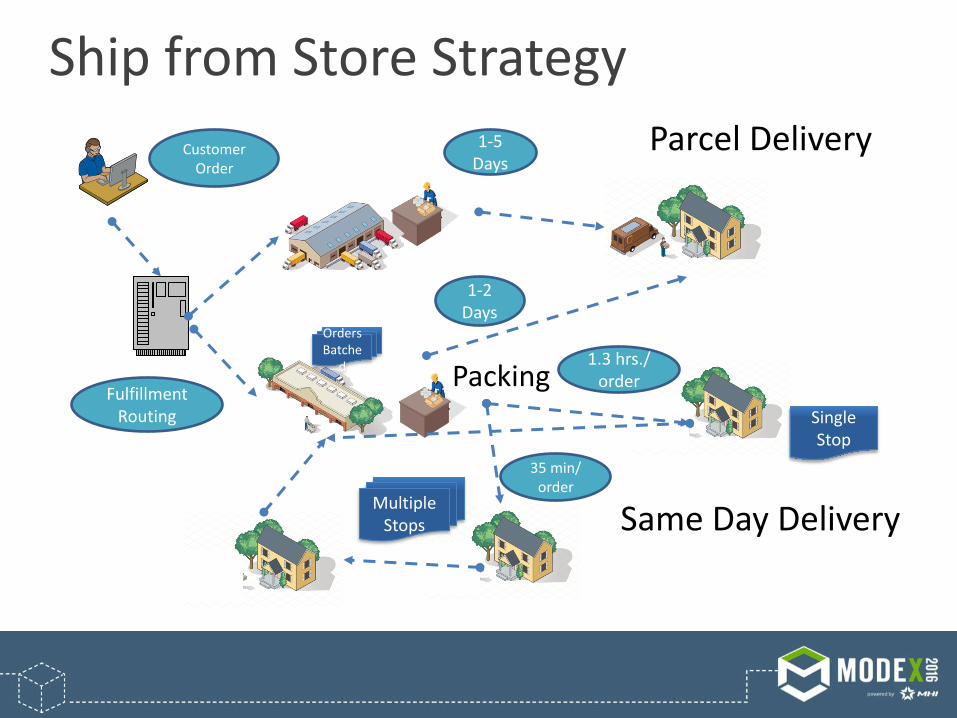
1-2 Days
1-5 Days
35 min/ order
1.3 hrs./ order
Same Day Delivery
Parcel Delivery Customer Order
Fulfillment Routing
Orders Batche
d
Single Stop
Multiple Stops
Packing
Ship from Store Strategy


![[2019-03-14] Benetton T-Shirts overproduction · [2019-03-14] Benetton T-Shirts overproduction. Page 3/30. Code Color Size Quantity 1D75 Orange XS 4 S 9 M 5 L 1 Darkblue XS 10 S 15](https://img.pdfslide.net/doc/110x75/5f07b3457e708231d41e4d00/2019-03-14-benetton-t-shirts-overproduction-2019-03-14-benetton-t-shirts-overproduction.jpg)