Embed Size (px)
Citation preview
1
How To Become a Data Scientist With Spotfire 5
Dr. Brand NiemannDirector and Senior Enterprise Architect – Data Scientist
Semantic Communityhttp://semanticommunity.info/
AOL Government Bloggerhttp://gov.aol.com/bloggers/brand-niemann/
May 30, 2012
2
Data Scientist• A data scientist is a job title for an employee or business intelligence (BI)
consultant who excels at analyzing data, particularly large amounts of data, to help a business gain a competitive edge.
• The title data scientist is sometimes disparaged because it lacks specificity and can be perceived as an aggrandized synonym for data analyst. Regardless, the position is gaining acceptance with large enterprises who are interested in deriving meaning from big data, the voluminous amount of structured, unstructured and semi-structured data that a large enterprise produces.
• A data scientist possesses a combination of analytic, machine learning, data mining and statistical skills as well as experience with algorithms and coding. Perhaps the most important skill a data scientist possesses, however, is the ability to explain the significance of data in a way that can be easily understood by others.
Source: http://searchbusinessanalytics.techtarget.com/definition/Data-scientist
3
Spotfire
• TIBCO Spotfire is a comprehensive software platform that allows customers to analyze data, using predictive and complex statistics in the analysis. TIBCO Spotfire customers include Fortune 500 customers from a variety of industries, including: Life Sciences, Energy, Financial Services, and the Defense and Government.
• The latest release of TIBCO Spotfire is 4.0 which includes seamless integration with "Statistics Services" and the ability to quickly develop dynamic analytic applications that run on the web through a zero footprint client called TIBCO Spotfire Web Player.
Source: http://en.wikipedia.org/wiki/Spotfire
4
Brand Niemann
• How I Became a Data Scientist With Spotfire:– Trained in data science, statistics, and visualization– Worked with Ben Shneiderman and Christopher Ahlberg on
very wide tables from EPA with forerunner of Spotfire– Used the original S-Plus and Spotfire before they were acquired
by TIBCO– Used Spotfire Professional 3.1 on EPA and Federal Data Science
Products– Encouraged development of Silver Spotfire 1 and 2– Built MindTouch Knowledgebase and Spotfire Library of Data
Science Blogging and Journalism for AOL Government and Semantic Community
http://semanticommunity.info/#Data_Science_Products
5
My Expert Advice• Use Spotfire on Spotfire Content for Business Intelligence and
Business Analytics:– Trends and Outliers: TIBCO Spotfire's Business Intelligence Blog– Demo and Template Gallery – Reuse Data from Individual Spotfire Files
• Show Spotfire Blogging Team How to Build Data Science Products:– Pre-condition Data Sets– Value Added Data Sets That Use Spotfire Analytics– New Data Types: Text, APIs, RDF, etc.
• A New Way to Market Spotfire:– Big Data in Memory in the Cloud Front-End– Open Government and Social Media Data Analysis Tool– Faceted Search Web Browser-like Embedded Widgets
6
Spotfire BI Blog Best Practice Example
• 06/08/2010: The 2010 FIFA World Cup – Can You Predict the Winner?– http://spotfireblog.tibco.com/?p=2709#more-2709
• TIBCO has put together World Cup data trends dating back to 1930 and developed a neat analytic solution. It allows you to examine country statistics, including World Cup appearances, wins, games played, goals scored, penalties, attendance rates, referee nationality, and more. The application, which uses the TIBCO Spotfire WebPlayer, combined with its Spotfire Server and Statistic Services, also predicts the bracket finalists. You can take TIBCO’s word for it, or you can go one step further and upgrade or downgrade particular teams to impact the results based on your own set of opinions or hunches.
• Have some fun checking out all the data and visual displays. Who knows – you might be able to predict the winner for yourself, and win a million Euro.
7
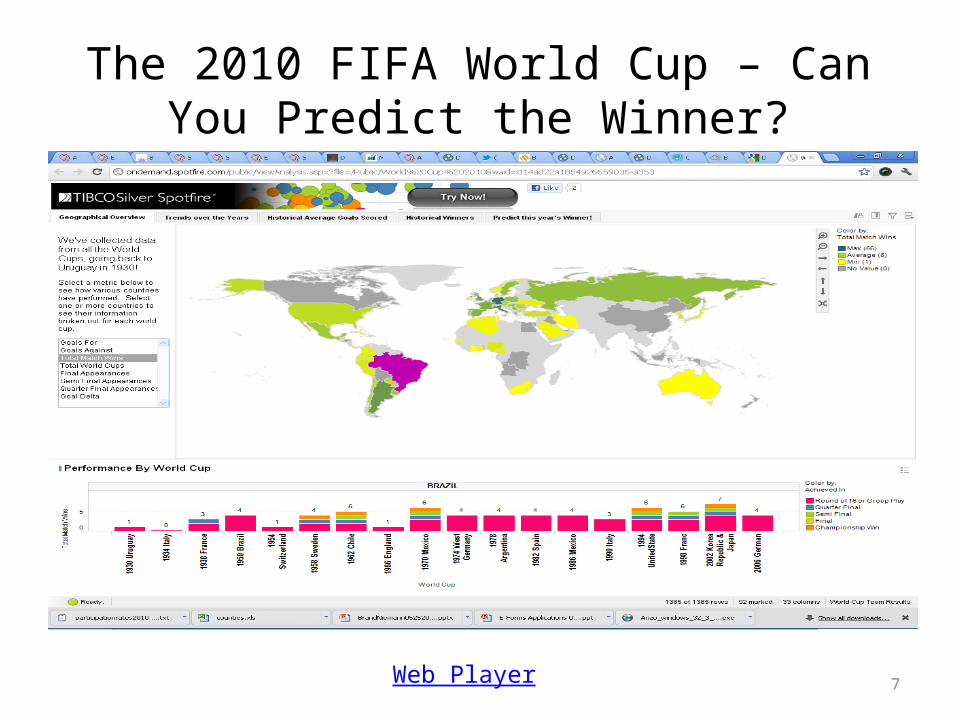
The 2010 FIFA World Cup – Can You Predict the Winner?
Web Player
8
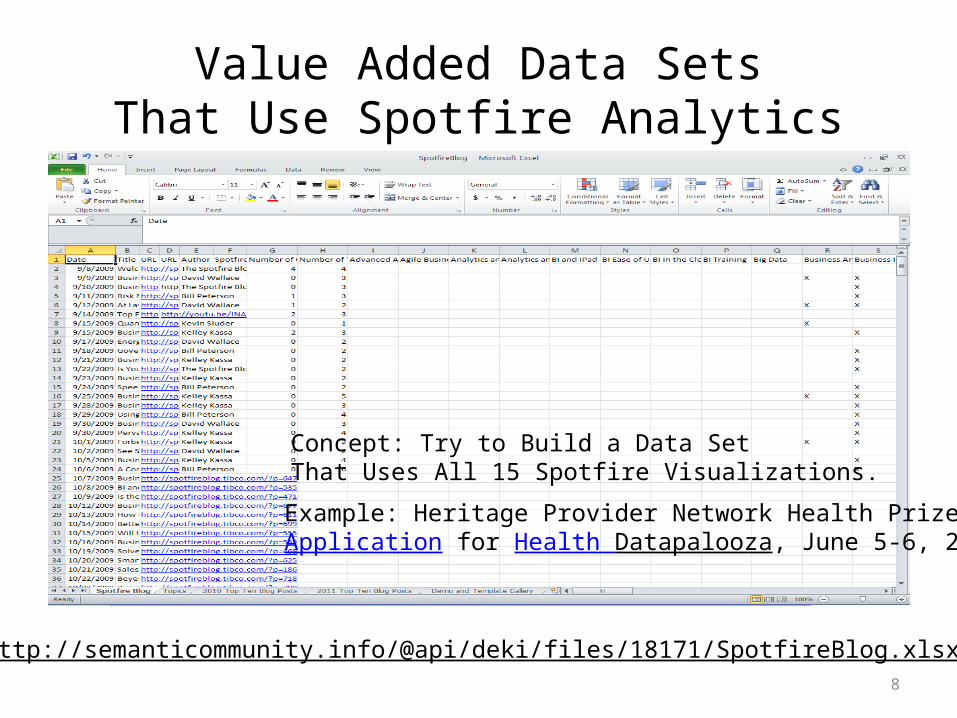
Value Added Data SetsThat Use Spotfire Analytics
http://semanticommunity.info/@api/deki/files/18171/SpotfireBlog.xlsx
Concept: Try to Build a Data SetThat Uses All 15 Spotfire Visualizations.
Example: Heritage Provider Network Health PrizeApplication for Health Datapalooza, June 5-6, 2012.
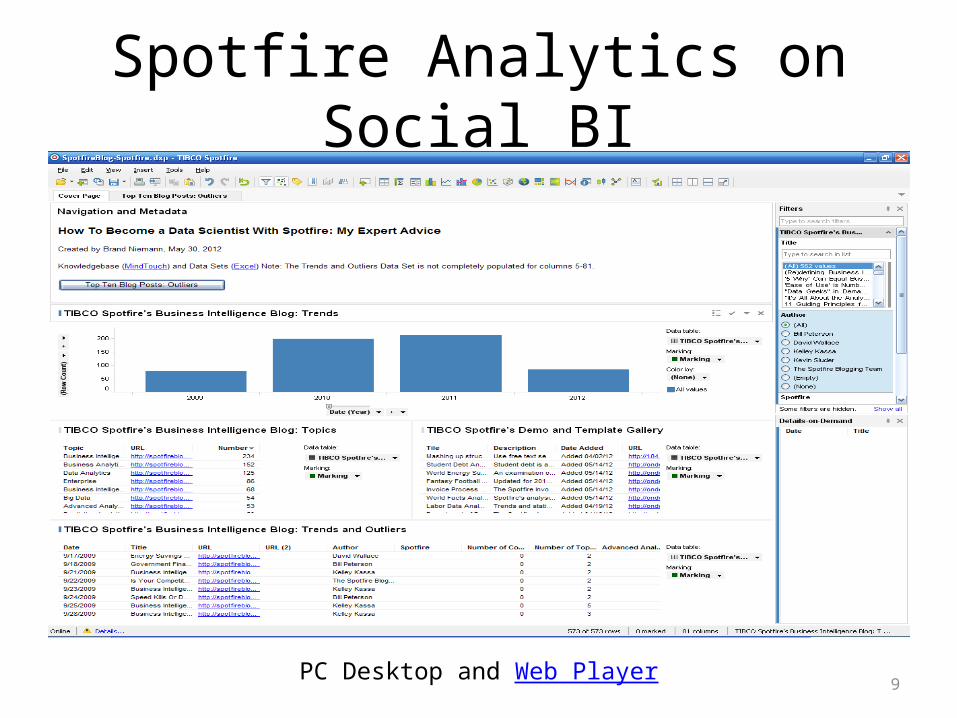
9
Spotfire Analytics on Social BI
PC Desktop and Web Player
10
Broader Perspectives
• TIBCO Software: SocialBPM - Hype or Reality? The Evidence (Not Products) Presented, Ian Gotts, TIBCO VP, 27 April 2012, 09:15 AM to 10:15 AM, Gartner Business Process Management Summit 2012:– Social media seems to be gathering momentum, but is
this the boom before the bust? Is there a justifiable case for using social media approaches for the "business of business improvement"? This session will draw on client examples to see how SocialBPM is being deployed and the critical questions you should ask before you dive in.
11
History: From Business Objects to Be Informed
• 1990: BusinessObjects launches Skipper SQL 2.0.x.• 2001: SAP signs an OEM and reseller agreement to bundle Crystal
Reports.• 2007: In October, SAP AG's Chief Executive Henning
Kagermann announced a $6.8 billion deal to acquire Business Objects.• 2010: Vendors in the business intelligence space are often categorized
into:– The consolidated big four "megavendors", include SAP BusinessObjects as
well as IBM Cognos, Oracle Hyperion, and Microsoft BI.– The independent "pure-play" vendors, the largest being MicroStrategy and
SAS.• 2012: Gartner and Forrester classify Be Informed as Dynamic Case
Management and Be Informed releases version 4.0.Source: http://en.wikipedia.org/wiki/Business_Objects and http://www.beinformed.com/
12
Business Intelligence
• SAP BusinessObjects 4.0:– Common services (deployment and management of BI
tools)– Enterprise Reporting (querying and analysis)– Data Visualization (dashboard design)– Universe Designer (information design tool)– Enterprise Information Management (extract and integrate)– Enterprise Performance Management (dashboards,
scorecards, etc.)– InfoView web portal (BI workspaces)– On-demand BI software (cloud service hosted on the web)
Source: http://en.wikipedia.org/wiki/Business_Objects
13
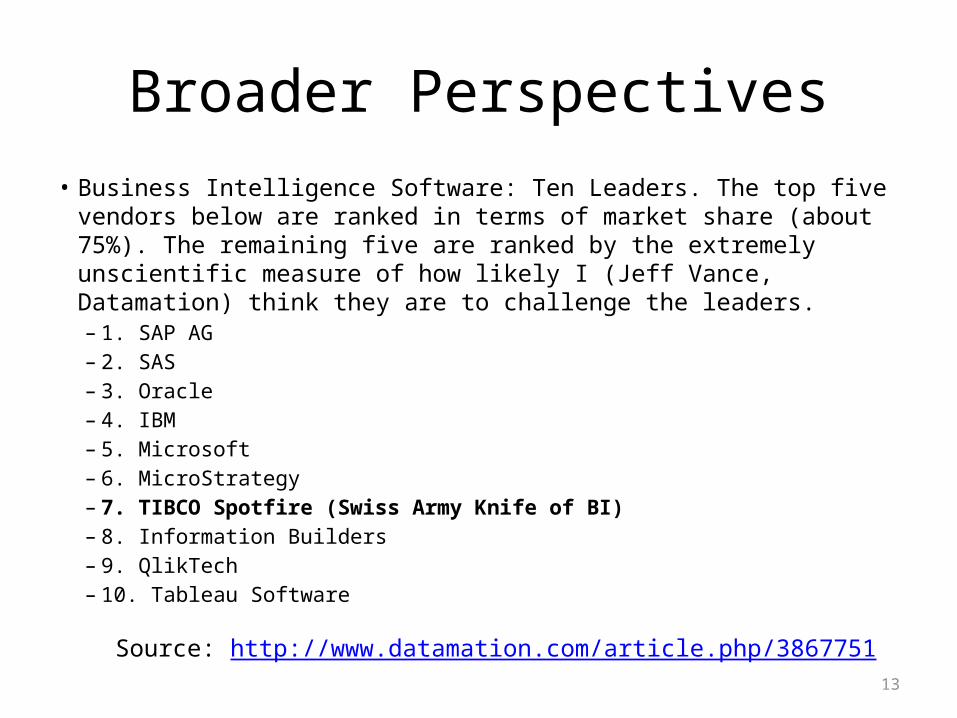
Broader Perspectives• Business Intelligence Software: Ten Leaders. The top five vendors
below are ranked in terms of market share (about 75%). The remaining five are ranked by the extremely unscientific measure of how likely I (Jeff Vance, Datamation) think they are to challenge the leaders.– 1. SAP AG– 2. SAS– 3. Oracle– 4. IBM– 5. Microsoft– 6. MicroStrategy– 7. TIBCO Spotfire (Swiss Army Knife of BI)– 8. Information Builders– 9. QlikTech– 10. Tableau SoftwareSource: http://www.datamation.com/article.php/3867751
14
Recommendations
• Spotfire Version 5.0 for the Data Scientist:– Implement My Expert Advice (recall previous)– Works with Nine Other BI Software Formats– Works with Advanced Processing Frameworks (e.g.
Cray Graph Computer, Hadoop, Watson, etc.)– Works with Be Informed for Dynamic Case
Management– Works with Social BPM for Semantic Analytics for
Big Social Data
15
Student Debt Analysis
• Business Process:– The Problem– See The Data– Map The Data– Exploratory Data Analysis: State Data– Exploratory Data Analysis: School Data– Facet Search and Curve Fitting
16
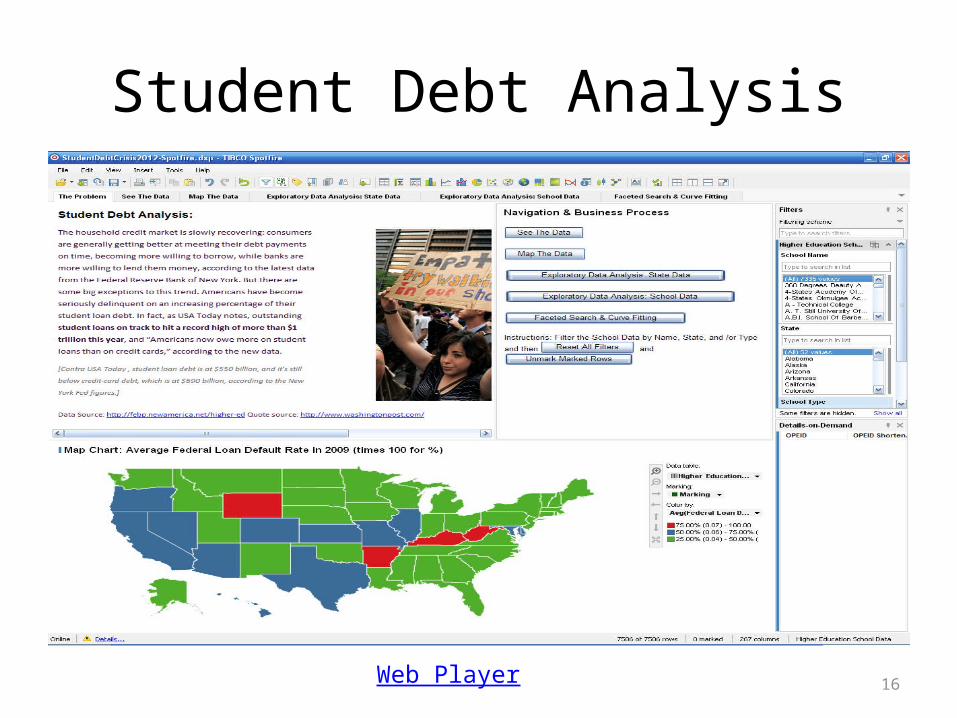
Student Debt Analysis
Web Player
17
Model Economic Capital Based on Two Risk Factors: Market Risk and Mortality Risk
• Business Process:– The Problem, EDA, and Faceted Search and Curve
Fitting– See The Data
18
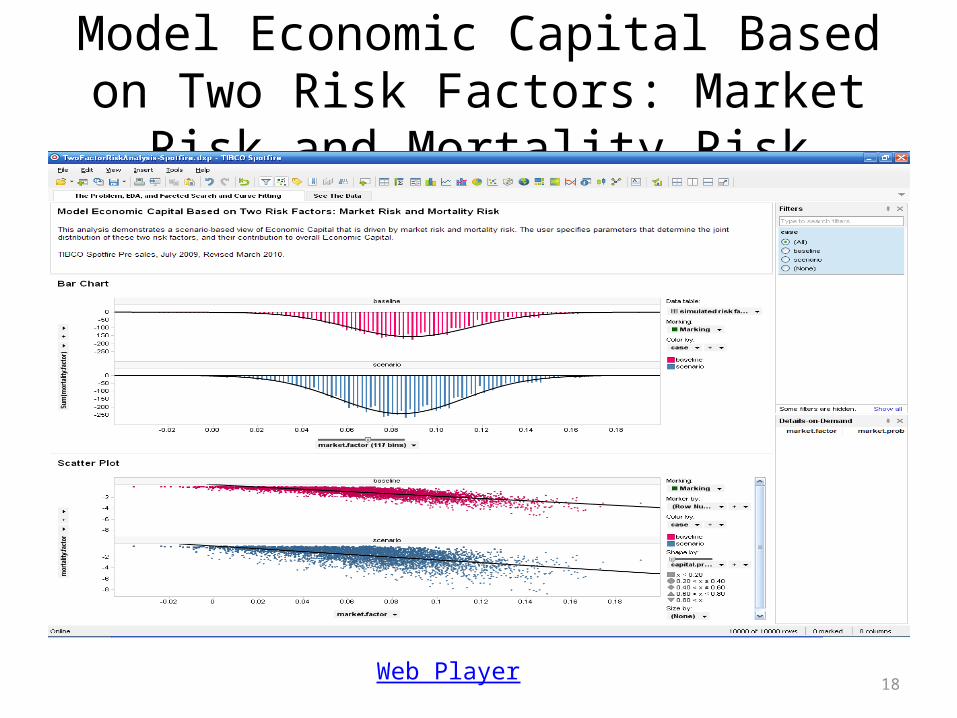
Model Economic Capital Based on Two Risk Factors: Market Risk and Mortality Risk
Web Player
19
S+ Integration Example: Loess
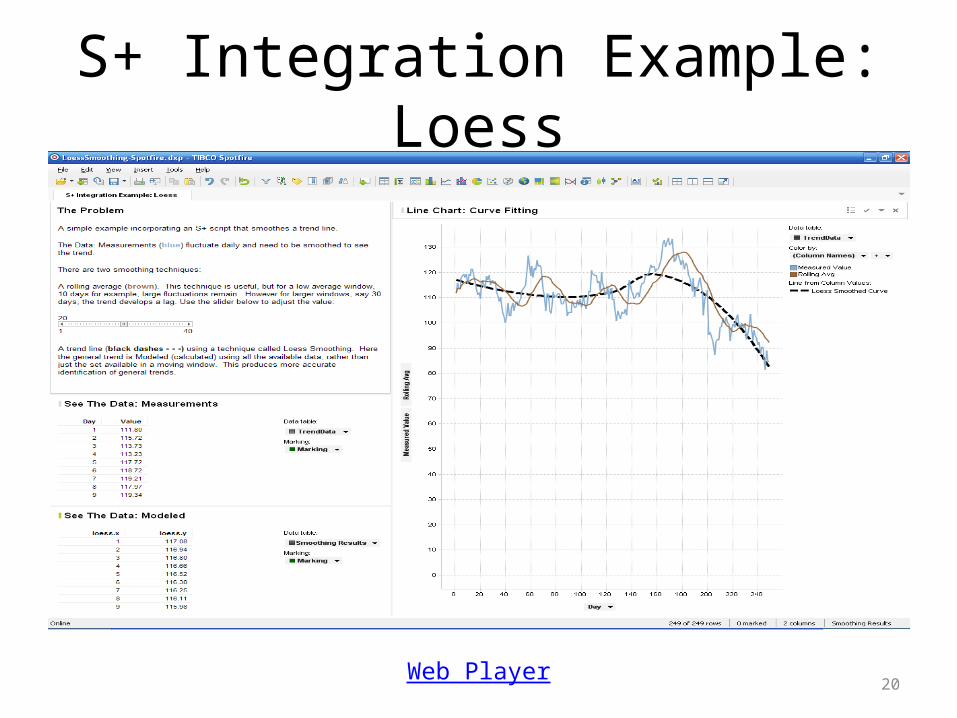
• A simple example incorporating an S+ script that smoothes a trend line.
• The Data: Measurements (blue) fluctuate daily and need to be smoothed to see the trend.
• There are two smoothing techniques:– A rolling average (brown). This technique is useful, but for a low
average window, 10 days for example, large fluctuations remain. However for larger windows, say 30 days, the trend develops a lag. Use the slider below to adjust the value.
– A trend line (black dashes - - -) using a technique called Loess Smoothing. Here the general trend is Modeled (calculated) using all the available data, rather than just the set available in a moving window. This produces more accurate identification of general trends.
20
S+ Integration Example: Loess
Web Player
21
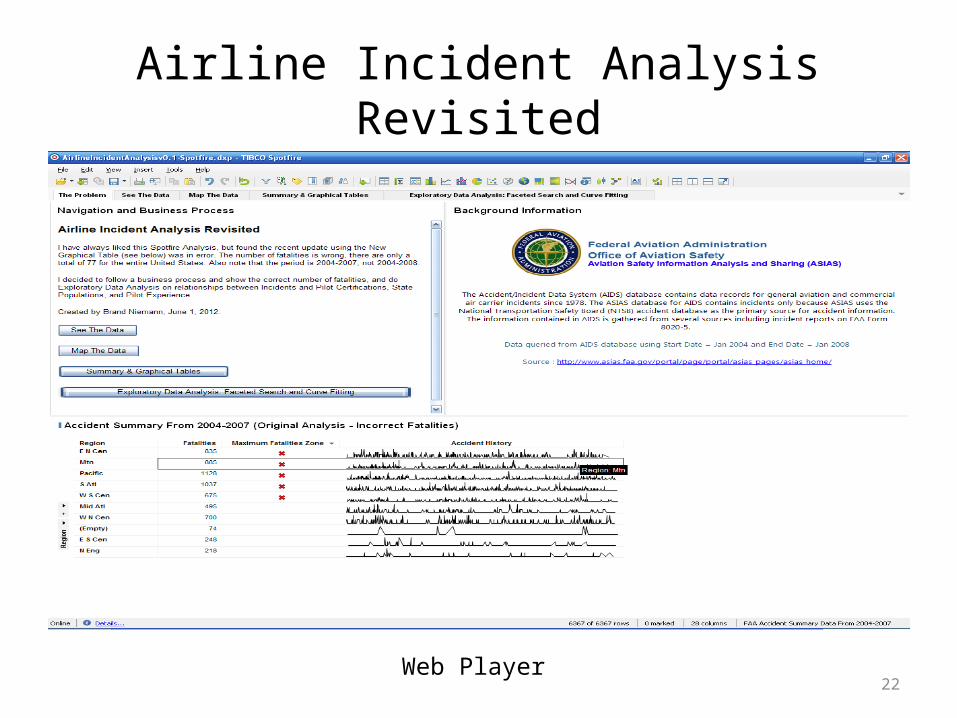
Airline Incident Analysis Revisited• I have always liked this Spotfire Analysis, but found the recent update
using the New Graphical Table (see below) was in error. The number of fatalities is wrong, there are only a total of 77 for the entire United States. Also note that the period is 2004-2007, not 2004-2008.
• I decided to follow a business process and show the correct number of fatalities, and do Exploratory Data Analysis on relationships between Incidents and Pilot Certifications, State Populations, and Pilot Experience.
• Business Process:– The Problem– See The Data– Map The Data– Summary & Graphical Tables– Exploratory Data Analysis: Faceted Search and Curve Fitting
22
Airline Incident Analysis Revisited
Web Player
23
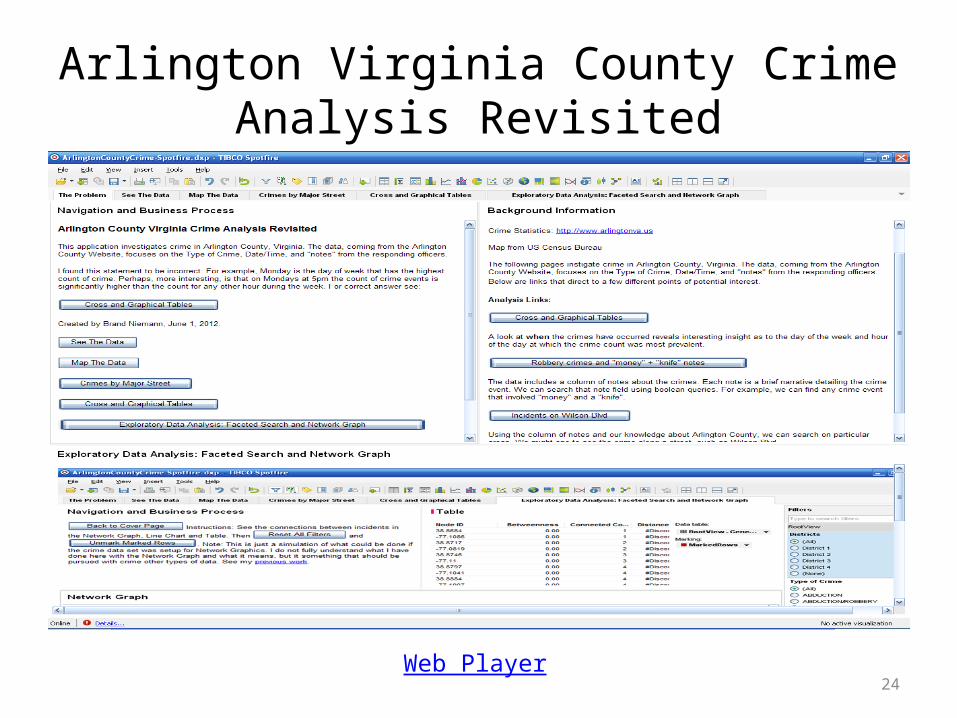
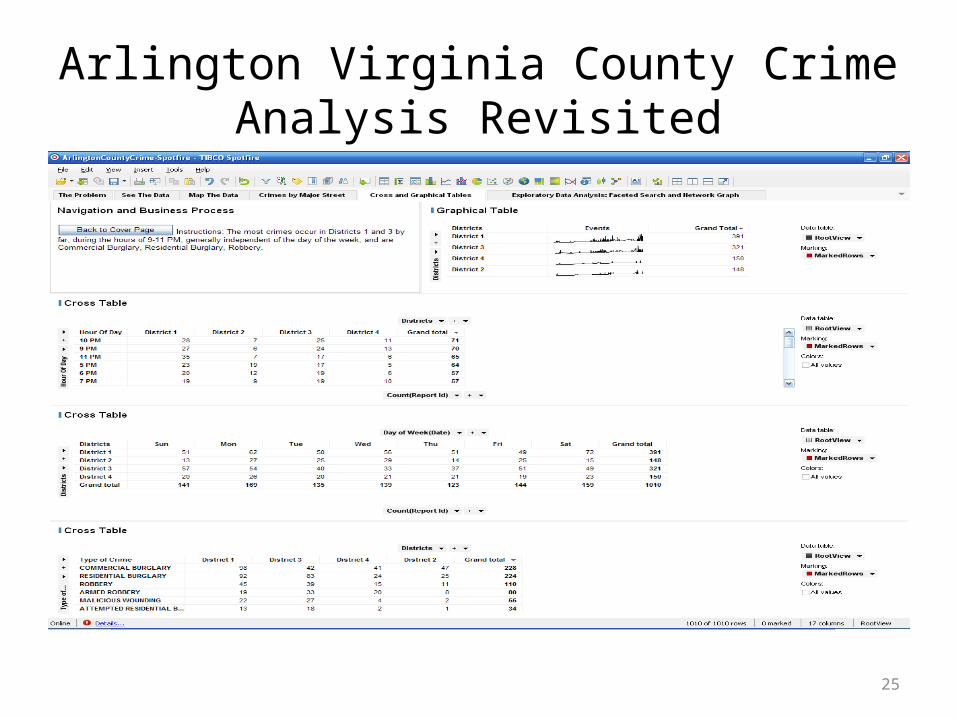
Arlington Virginia County Crime Analysis Revisited
• This application investigates crime in Arlington County, Virginia. The data, coming from the Arlington County Website, focuses on the Type of Crime, Date/Time, and "notes" from the responding officers.
• I found this statement to be incorrect: For example, Monday is the day of week that has the highest count of crime. Perhaps, more interesting, is that on Mondays at 5pm the count of crime events is significantly higher than the count for any other hour during the week. For correct answer see: Cross and Graphical Tables.
• The Business Process:– See The Data– Map The Data– Crimes by Major Street– Cross and Graphical Tables– Exploratory Data Analysis: Faceted Search and Network Graph
24
Arlington Virginia County Crime Analysis Revisited
Web Player
25
Arlington Virginia County Crime Analysis Revisited
26
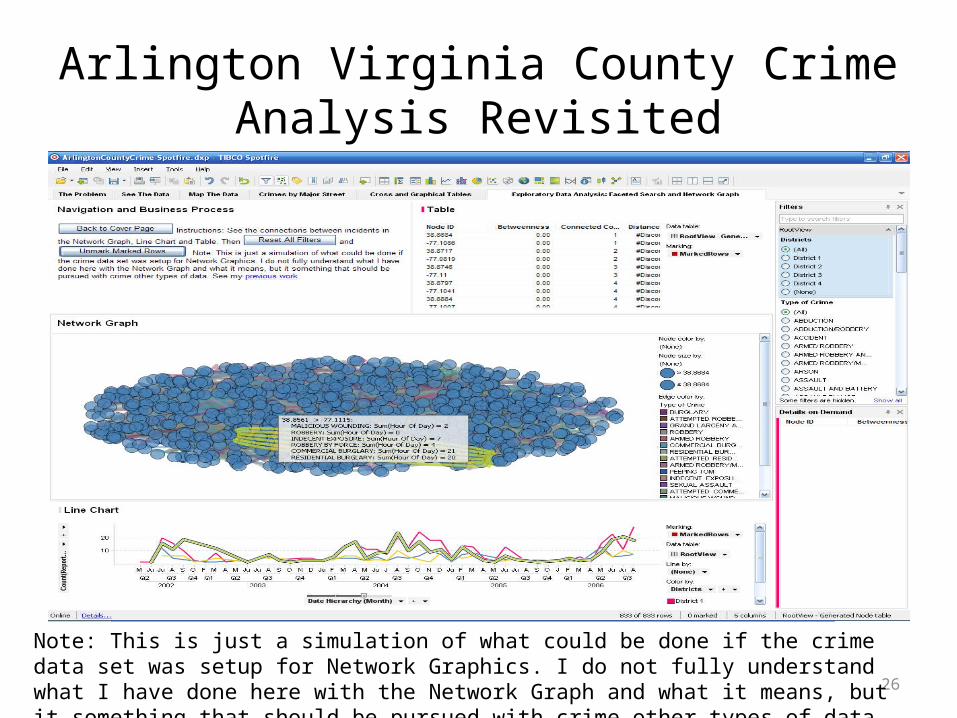
Arlington Virginia County Crime Analysis Revisited
Note: This is just a simulation of what could be done if the crime data set was setup for Network Graphics. I do not fully understand what I have done here with the Network Graph and what it means, but it something that should be pursued with crime other types of data. See my previous work.
27
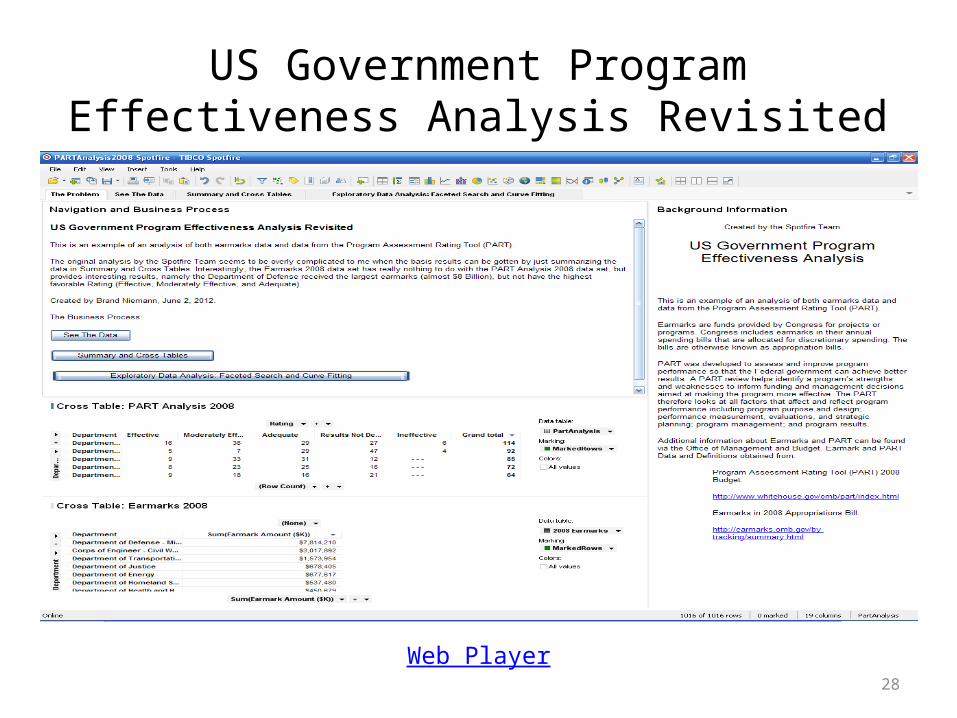
US Government Program Effectiveness Analysis Revisited
• This is an example of an analysis of both earmarks data and data from the Program Assessment Rating Tool (PART).
• The original analysis by the Spotfire Team seems to be overly complicated to me when the basis results can be gotten by just summarizing the data in Summary and Cross Tables.
• Interestingly, the Earmarks 2008 data set has really nothing to do with the PART Analysis 2008 data set, but provides interesting results, namely the Department of Defense received the largest earmarks (almost $8 Billion), but not have the highest favorable Rating (Effective, Moderately Effective, and Adequate).
• The Business Process:– See The Data– Summary and Cross Tables– Exploratory Data Analysis: Faceted Search and Curve Fitting
28
US Government Program Effectiveness Analysis Revisited
Web Player
29
Global Distribution of Natural Disasters (Earthquakes, Tsunamis, and Volcanic Eruptions) Revisited
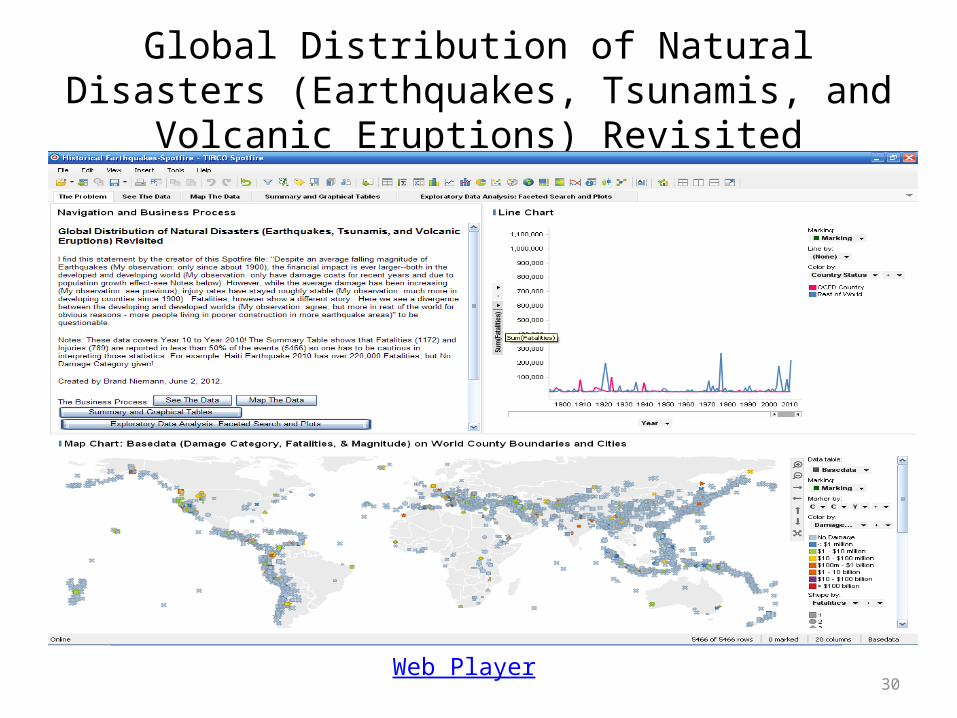
• I find this statement by the creator of this Spotfire file: "Despite an average falling magnitude of Earthquakes (My observation: only since about 1900), the financial impact is ever larger--both in the developed and developing world (My observation: only have damage costs for recent years and due to population growth effect-see Notes below). However, while the average damage has been increasing (My observation: see previous), injury rates have stayed roughly stable (My observation: much more in developing counties since 1900). Fatalities, however show a different story. Here we see a divergence between the developing and developed worlds (My observation: agree, but more in rest of the world for obvious reasons - more people living in poorer construction in more earthquake areas)“ to be questionable.
• Business Process:– See The Data– Map The Data– Summary and Graphical Tables– Exploratory Data Analysis: Faceted Search and Plots
30
Global Distribution of Natural Disasters (Earthquakes, Tsunamis, and Volcanic Eruptions) Revisited
Web Player
31
H1N1 Spread
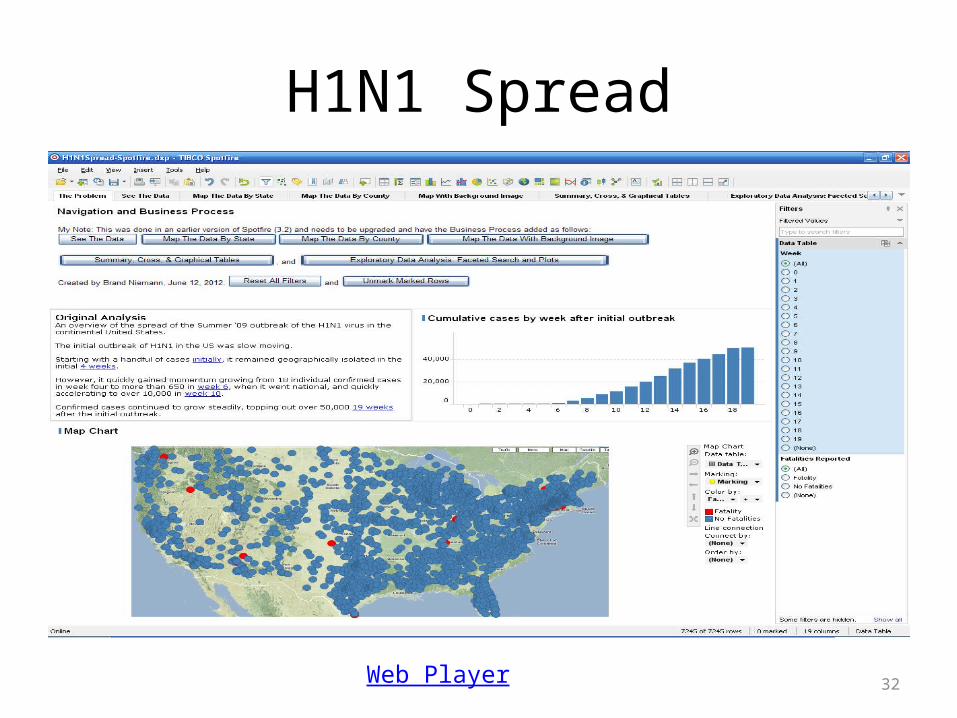
• An overview of the spread of the Summer '09 outbreak of the H1N1 virus in the continental United States.
• This was done in an earlier version of Spotfire (3.2) and needs to be upgraded and have the Business Process added as follows:– See The Data– Map The Data By State– Map The Data By County– Map The Data With Background Image– Summary, Cross, & Graphical Tables– Exploratory Data Analysis: Faceted Search & Plots
32
H1N1 Spread
Web Player
33
World Energy Survey Analysis Revisited
• The Problem: I thought this Spotfire analysis should be done with a business process in mind to answer the questions below as follows: – See The Data– Map The Data– Summary, Cross, and Graphical Tables– Exploratory Data Analysis: Faceted Search and
Plots
34
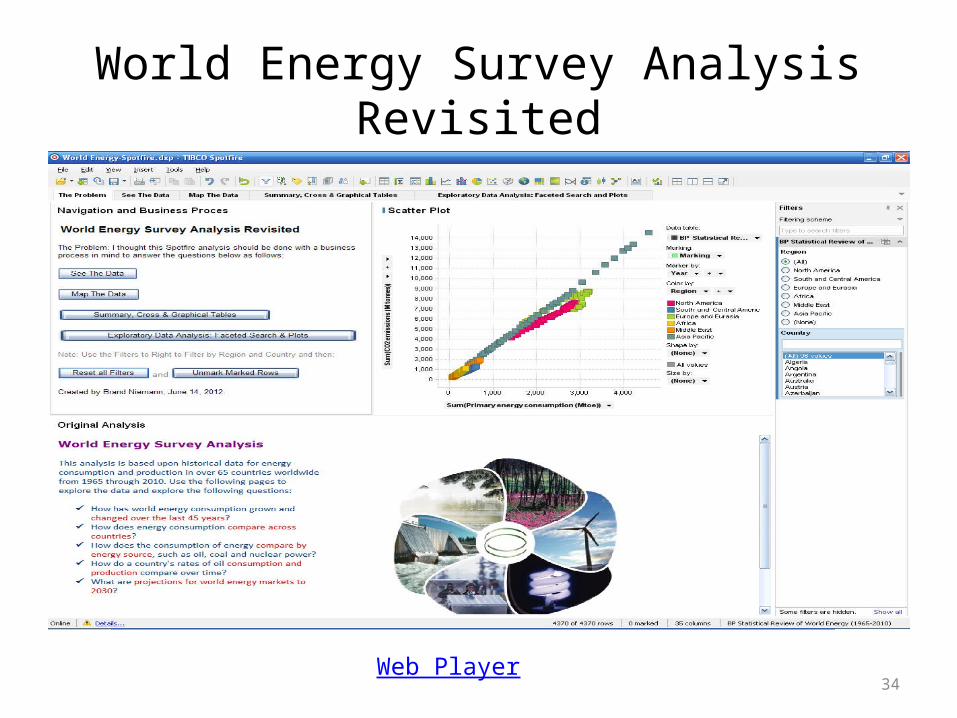
World Energy Survey Analysis Revisited
Web Player