Embed Size (px)
Citation preview
University of South FloridaScholar Commons
Graduate Theses and Dissertations Graduate School
October 2018
How to Build a Climate of Quality in a Small toMedium Enterprise: An Action Research ProjectDesmond M. Bishop IIIUniversity of South Florida, [email protected]
Follow this and additional works at: https://scholarcommons.usf.edu/etd
Part of the Business Administration, Management, and Operations Commons
This Dissertation is brought to you for free and open access by the Graduate School at Scholar Commons. It has been accepted for inclusion inGraduate Theses and Dissertations by an authorized administrator of Scholar Commons. For more information, please [email protected].
Scholar Commons CitationBishop, Desmond M. III, "How to Build a Climate of Quality in a Small to Medium Enterprise: An Action Research Project" (2018).Graduate Theses and Dissertations.https://scholarcommons.usf.edu/etd/7476

How to Build a Climate of Quality in a Small to Medium Enterprise: An Action Research Project
by
Desmond M. Bishop III
A dissertation submitted in partial fulfillment
of the requirements for the degree of
Doctor of Business Administration
Department of Management
Muma College of Business
University of South Florida
Co-Major Professor: Paul Spector, Ph.D
Co-Major Professor: Anol Bhattacherjee, Ph.D
Paul Solomon, Ph.D
Rebecca Smith, DBA
Date of Approval:
August 17, 2018
Keywords: Quality management, action research, quality climate, SME
Copyright © 2018, Desmond M. Bishop III
Table of Contents
List of Tables ................................................................................................................................... i
List of Figures ................................................................................................................................. ii
Introduction ..................................................................................................................................... 1
Literature Review............................................................................................................................ 5 Quality Management’s Applicability for SMEs ................................................................. 5
Critical to Success Factors for SMEs................................................................................ 11 Barriers to Implementation ............................................................................................... 13
Are QM Practices Universal? ........................................................................................... 15 The Current Study ............................................................................................................. 18
Research Method .......................................................................................................................... 22 Action Research ................................................................................................................ 22
Action Research Process and Outcomes ........................................................................... 24 Intervention 1 .................................................................................................................... 25 Intervention 1: Step 1 - Diagnosing: ..................................................................... 25
Intervention 1: Step 2 - Action planning............................................................... 27
Intervention 1: Step 3 - Action Taking ................................................................. 28 Top Management Support..................................................................................... 29 Collaboration......................................................................................................... 31
Data centered decision making ............................................................................. 33 Process focus ......................................................................................................... 34
Intervention 1: Step 4 - Evaluating ....................................................................... 34 Intervention 1: Step 5 - Specified Learning .......................................................... 37 Intervention 2 .................................................................................................................... 39 Intervention 2: Step 1 - Diagnosing ...................................................................... 39 Intervention 2: Step 2 - Action Planning .............................................................. 40
Intervention 2: Step 3 - Action Taking ................................................................. 41
Intervention 2: Step 4 - Evaluating ....................................................................... 43
Intervention 2: Step 5 - Specifying Learning ........................................................ 44
Discussion ..................................................................................................................................... 46 Unexpected Findings ........................................................................................................ 47 Generalizability ................................................................................................................. 50
Limitations of the Research .............................................................................................. 52 Implications for Practice ................................................................................................... 52

Future Research ............................................................................................................................ 53
Conclusions ................................................................................................................................... 54
References ..................................................................................................................................... 55
Appendix: IRB Approval .............................................................................................................. 66

i
List of Tables
Table 1 A comparison of the characteristics of large organizations vs SMEs - Source
adapted from Ghobadian and Gallear 1997 ................................................................... 6
Table 2 A comparison of the usefulness of quality management in SMEs ................................. 8
Table 3 The growth of QM SME research since 2014 - Adapted from Murphy 2016.
NOTE: Bolded sources were added by the author. ...................................................... 10
Table 4 A comparison of critical to success factors from prominent studies ............................ 12
Table 5 Summary of the factors, methods and results of Intervention 1 ................................... 29
Table 6 Results from Intervention 1 .......................................................................................... 35
Table 7 Results from Intervention 2 .......................................................................................... 45

ii
List of Figures
Figure 1 Contributing factors to QM in SMEs ........................................................................... 18
Figure 2 A comparison of research methods for QM SME research .......................................... 19
Figure 3 The global reach of QM SME research from 1990-2017 ............................................. 20
Figure 4 Action Research Cycle (ARC) ..................................................................................... 24
1
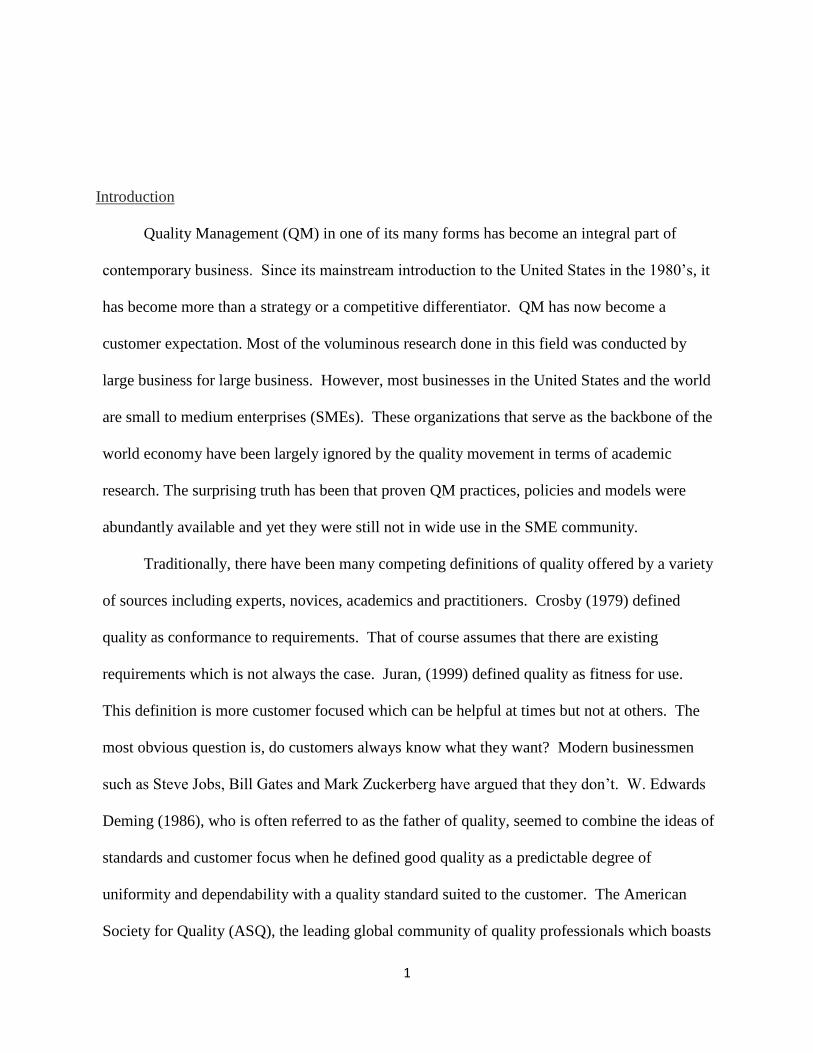
Introduction
Quality Management (QM) in one of its many forms has become an integral part of
contemporary business. Since its mainstream introduction to the United States in the 1980’s, it
has become more than a strategy or a competitive differentiator. QM has now become a
customer expectation. Most of the voluminous research done in this field was conducted by
large business for large business. However, most businesses in the United States and the world
are small to medium enterprises (SMEs). These organizations that serve as the backbone of the
world economy have been largely ignored by the quality movement in terms of academic
research. The surprising truth has been that proven QM practices, policies and models were
abundantly available and yet they were still not in wide use in the SME community.
Traditionally, there have been many competing definitions of quality offered by a variety
of sources including experts, novices, academics and practitioners. Crosby (1979) defined
quality as conformance to requirements. That of course assumes that there are existing
requirements which is not always the case. Juran, (1999) defined quality as fitness for use.
This definition is more customer focused which can be helpful at times but not at others. The
most obvious question is, do customers always know what they want? Modern businessmen
such as Steve Jobs, Bill Gates and Mark Zuckerberg have argued that they don’t. W. Edwards
Deming (1986), who is often referred to as the father of quality, seemed to combine the ideas of
standards and customer focus when he defined good quality as a predictable degree of
uniformity and dependability with a quality standard suited to the customer. The American
Society for Quality (ASQ), the leading global community of quality professionals which boasts

2
approximately 80,000 members, seems to agree with Deming’s definition when it describes
quality as an excellence in goods and services, especially to the degree that they conform to
requirements and satisfy customers. For the purposes of this dissertation, the author will use
ASQ’s definition. No matter how it is defined, the management of quality, in one if its various
forms (Total Quality Management (TQM), Six Sigma, ISO 9000 etc.), has received intense
academic and practitioner focus for nearly 40 years. A few of the more popular methods are
discussed below:
Total Quality Management (TQM) is a term or methodology first used to describe a
management approach to quality improvement. Since its introduction in the 1970’s
it has come to have many different meanings. In its most fundamental form, TQM
is a management approach for long term success through the use of customer
satisfaction. TQM is based on all members of a company, group, team, or
community being actively engaged in the improvement effort by improving
processes, policies, practices, products, services, and the culture in which they
operate. The methods used in the improvement effort are based on the teachings of
Deming, Juran and Crosby among others (Westcott 2013).
Six Sigma is a multifunctional, organization-wide method to improve process
effectiveness and customer satisfaction. It was originally developed as tool to
reduce the variation in processes at Motorola in the 1980’s by engineer Bill Smith.
Its focus on data and bottom line results have made six sigma a popular quality
improvement program globally (Juran 1999).
ISO 9000 is an international quality management standard developed to help guide
companies to effectively document the quality system elements that should be

3
implemented to maintain an efficient quality system. It was created in 1987 by the
International Organization for Standardization (ISO) and is not specific to any
particular industry, product or service. It was an effort to standardize the many
competing national standards that were in use at the time. ISO 9000 is quite popular
in practice and many companies use this standard as evidence of an effective quality
management system. As a result, the ISO 9000 system is often contractually flowed
from prime organizations to smaller sub-tier suppliers. Currently, there are over
100 countries that use the ISO system (Jaffrey 2004).
Prior research on quality was often started by and tailored for large organizations. In
comparison, there has been relatively little research related to the application or implementation
of QM in SMEs. This lack of attention is quite surprising when one contemplates that the vast
majority of workers in the United States and the world are employed by SMEs. In fact,
according to the United States Small Business Administration, 99.9% of American businesses
consisted of SMEs with fewer than 500 employees and employee approximately 48% of the
American workforce (United States Small Business Profile, 2018). With SMEs representing
such a large percentage of the American and global economy, an explicit focus on how to make
these organizations more competitive, resilient and successful could potentially be of significant
value to both the practitioner and academic communities.
Recently, researchers from across the globe have recognized the opportunity and have
begun to take a concentrated look into this very problem. Murphy (2016a) published a review
of the extant literature in this space from the years 1990-2014. Most of the studies he reviewed
centered on whether SMEs were embracing QM; the critical to success factors (CSF) that were
thought to be associated with that effort; and gaps or barriers remaining to those SMEs that

4
chose the QM route. Bishop (2018) built on the work of Murphy and identified gaps in the
current research. These gaps included an under representation of qualitative research in the
SME QM literature, a scarcity of recent SME QM studies in the United States and a shortage of
action research projects in this field. Specifically, Bishop proposed to narrow the gap by
conducting an investigation into the process of how a SME laid the foundations to build a
climate of quality management within an organization. In this instance, he recommended the
action research method.
Action research was first introduced by Kurt Lewin in the 1940’s to denote a pioneering
approach toward social research which combined generation of theory with changing the social
system through the researcher acting on or in the social system (Lewin, 1946). The act itself is
presented as a means of both changing the system and generating critical knowledge about it
(Susman and Evered, 1978). Action research aims to contribute both to the practical concerns of
people in an immediate problematic situation and to the goals of social science by joint
collaboration within a mutually acceptable ethical framework (Rapoport, 1970). This type of
research is particularly well suited to the DBA (Doctor or Business Administration) model
because the engaged scholar is typically a working professional imbedded in the organization
under study and seeks to make some change to propel the organization forward (Van de Ven,
2007). This project will attempt to narrow the gaps in the literature by conducting a action
research project in the Unites States of a SME that has the goal of building a climate of quality.

5
Literature Review
The literature review includes articles published in the last twenty-eight years which
builds on the fifty-five articles reviewed by Murphy (2016a) and adds eighteen articles that
were published from 2014 to 2017 for a total of seventy-three articles. The author used the
same search terms and database employed by Murphy. Specifically, Google Scholar was
searched with the following terms: TQM, QM or ISO 9000 accompanied with SME, Small
Business or Medium Business. The literature review is intended to review the following
topics:
1. Explore QM’s applicability for SMEs;
2. Discuss possible critical to success factors for QM implementation
3. Explore possible barriers to implementation
4. Deliberate on the universal nature of QM
5. Expose a gap in the present literature and propose a method to narrow that gap
Quality Management’s Applicability for SMEs:
One of the most pressing questions for the past few decades has been whether QM is
applicable to SMEs based on their unique set of circumstances. As Welsh and White (1981,
p.18) point out, “A small business is not a little big business”. SMEs have their own set of
unique strengths and weaknesses. Ghobadian and Gallear (1996, 1997) clearly articulate these
differences which is the culmination of in depth case studies conducted in the UK. These
differences were primarily concerned with the structure, procedures, behavior, processes,
people and external contacts of the organization. The goal for SMEs is to minimize the effects

6
of the disadvantages such as inferior resources, know-how and training budgets while fulling
optimizing the advantages such as the flat management structure, short decision-making chain
and low resistance to change. The author adapted Ghobadian and Gallear’s work in Table 1.
Based on the literature from 1990-2014, Murphy (2016a) unequivocally stated that
“There is near consensus among QM researchers that QM is both possible and right for SMEs”.
However, Murphy did not explicitly state which articles were for or against QM
implementation. As a result, the author gathered the data to show what a near consensus looks
like (Table 2).
Table 1- A comparison of the characteristics of large organizations vs SMEs - Source
Adapted from Ghobadian and Gallear 1997
Category Large Organizations SMEs
Organizational Framework
Hierarchical. Several layers
of management
Flat. Few layers of
management
Rigid framework and
information flows
Flexible framework and
information flows
Top management away from
point of delivery
Top management close to
point of delivery
Top management’s visibility
limited
Top management highly
visible
Multi-sited possibly
multinational
Single-sited
Low innovativeness High innovativeness
Systems
High degree of
standardization and
formalization
Low degree of
standardization and
formalization
System dominated People dominated
Data centered decision
making
“Gut feel” decision making
Rigid processes Flexible processes

7
Table 1 (Continued)
Culture
Cultural diversity Unified culture
Departmental/functional
mindset
Corporate mindset
Cultural inertia Fluid culture
Meritocratic Patronage
Processes
Long decision-making chain Short decision-making chain
Formal evaluation, control
and reporting procedures
Informal evaluation, control
and reporting procedures
Control-oriented Results-oriented
Human Resources
Personal authority mainly low Personal authority mainly
high
Dominated by professional Dominated by entrepreneurs
Individuals usually cannot see
the results of their work
Individuals usually can see
the results of their work
Ample resources (human,
capital, financial)
Modest resources (human,
capital, financial)
Specified training budget Non-specified training budget
Resistance to change Negligible resistance to
change
Customer Focus
Extensive external contacts Limited external contacts
Large customer base Small customer base
Wide span of activities Narrow span of activities
8
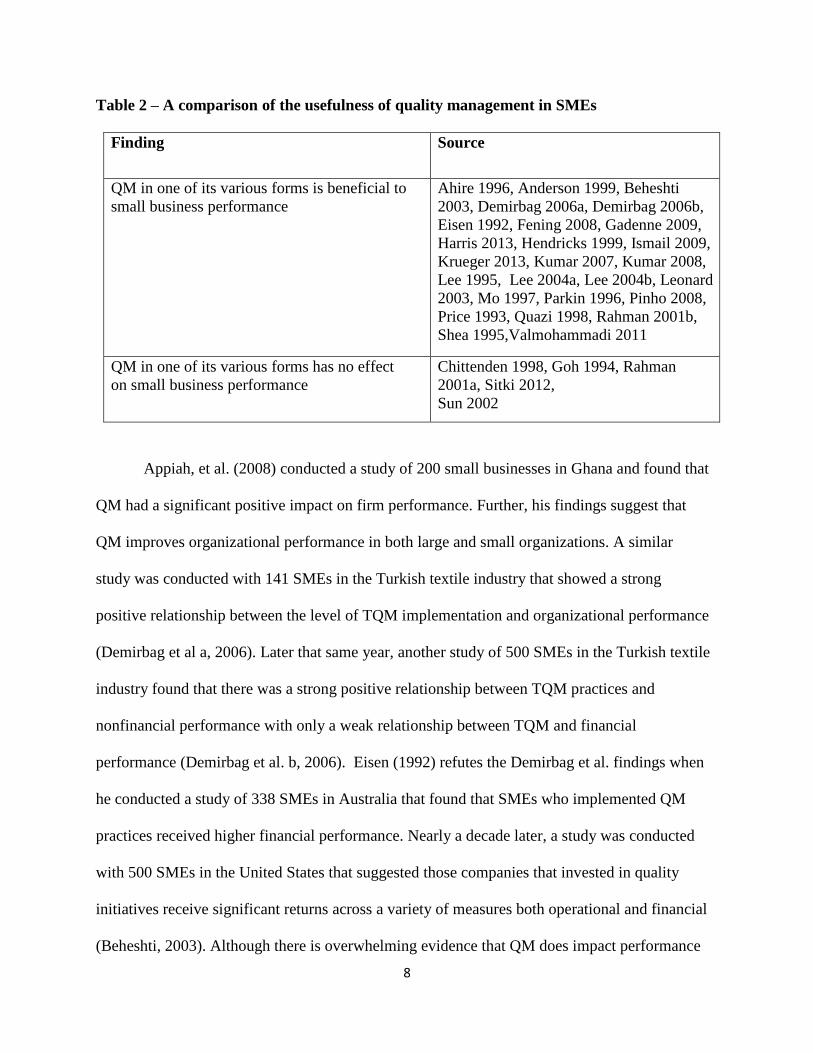
Table 2 – A comparison of the usefulness of quality management in SMEs
Finding Source
QM in one of its various forms is beneficial to
small business performance
Ahire 1996, Anderson 1999, Beheshti
2003, Demirbag 2006a, Demirbag 2006b,
Eisen 1992, Fening 2008, Gadenne 2009,
Harris 2013, Hendricks 1999, Ismail 2009,
Krueger 2013, Kumar 2007, Kumar 2008,
Lee 1995, Lee 2004a, Lee 2004b, Leonard
2003, Mo 1997, Parkin 1996, Pinho 2008,
Price 1993, Quazi 1998, Rahman 2001b,
Shea 1995,Valmohammadi 2011
QM in one of its various forms has no effect
on small business performance
Chittenden 1998, Goh 1994, Rahman
2001a, Sitki 2012,
Sun 2002
Appiah, et al. (2008) conducted a study of 200 small businesses in Ghana and found that
QM had a significant positive impact on firm performance. Further, his findings suggest that
QM improves organizational performance in both large and small organizations. A similar
study was conducted with 141 SMEs in the Turkish textile industry that showed a strong
positive relationship between the level of TQM implementation and organizational performance
(Demirbag et al a, 2006). Later that same year, another study of 500 SMEs in the Turkish textile
industry found that there was a strong positive relationship between TQM practices and
nonfinancial performance with only a weak relationship between TQM and financial
performance (Demirbag et al. b, 2006). Eisen (1992) refutes the Demirbag et al. findings when
he conducted a study of 338 SMEs in Australia that found that SMEs who implemented QM
practices received higher financial performance. Nearly a decade later, a study was conducted
with 500 SMEs in the United States that suggested those companies that invested in quality
initiatives receive significant returns across a variety of measures both operational and financial
(Beheshti, 2003). Although there is overwhelming evidence that QM does impact performance

9
(see Table 1) it is not all positive. Sitki (2012) surveyed 255 SMEs in Turkey to investigate
whether ISO certification affected performance. His study concluded that the result of achieving
certification showed no statistical difference in terms of performance for the SMEs who
responded. In the UK, Chittenden (1998) found that this may be due to the complexity of ISO
9000 and that many SMEs considered it inappropriate to the SME environment. Conversely,
more recent studies in Ghana (Kwamega, 2015), Australia (O’Neil, 2016) and Spain (del
Alonso-Almeida, 2015) reassert that QM practices do increase performance and result in
positive outcomes.
Murphy (2016a) found that there were at least fifty-five studies conducted from sixteen
countries around the world which implies that the application of QM to SMEs is of global
interest. As stated earlier, that study was conducted from literature published from 1990 to
2014. Since that time, the findings suggest that interest in QM practices for SMEs is growing,
narrowing on consensus and becoming more global. Table 3 shows a selection of at least
seventy-three studies from twenty-six countries around the world in the past twenty-eight years
(Table 3). Again, the clear majority (Table 2) of these findings suggest that QM is applicable to
the SME environment and that performance improvement, both operational and financial, is
likely to follow.

10
Table 3 – The growth of QM SME research since 2014 - Adapted from Murphy 2016.
NOTE: Bolded sources were added by the author.
Country Source Country Source
USA (Shea and Gobeli 1995;
Ahire et al. 1996; Hendricks
and Singhal 1999; Kuratko,
Goodale and Hornby 2001;
Beheshti and Lollar 2003,
Zhou 2016)
United
Kingdom
(Goh and Ridgway 1994;
Parking and Parkin 1996;
Ghobadian and Gallear
1996; Ghobadian and
Gallear 1997; Chittenden et
al. 1998; Yusof and
Aspinwall 2000; Sousa
2001; Antony et al. 2005;
Kumar 2007; Kumar and
Antony 2008; Antony et al.
2008; Kumar et al. 2009;
Kumar et al.2011; Kumar et
al. 2014; McAdam et al.
2014)
Canada (Ahire et al. 1996) Vietnam (Nguyen 2015)
USA &
Canada
(Briscoe et al. 2005;
Murphy 2016a;
Murphy 2016b)
Australia (Eisen et al. 1992; Wiele
and Brown 1998; Anderson
and Sohal 1999; Husband
1999; Rahman 2001a,
2001b; Gadenne and
Sharma 2009; Kumat et al.
2014; O'Neil 2016
India (Alamelu and
Balasubramanian 2011;
Majumdar 2016; Sinha
2016)
Turkey (Demirbag et al. 2006a;
Demirbag et al. 2006b;
Sitki 2012)
Brazil (Sousa-Mendes et al. 2016) Finland (Gunasekaran et al. 1996)
Ethiopia (Temtime and Solomon
2002)
Italy (Azzone and Cainarca 1993)
Ghana (Fening et al. 2008;
Kwamega 2015)
Norway (Sun and Cheng 2002)

11
Table 3 (Continued)
Iran (Valmohammadi 2011) Portugal (Pinho 2008; Mendes and
Lourenco 2014; Teixeira
2015)
Qatar (Salaeldin 2009) Sweden (Hansson and Klefsjo 2003)
Kenya (Wanjau et al 2015) Spain (Claver and Tari 2008; Del
Alonoso- Almeida 2015;
Heras-Saizarbitoria 2015)
China (Lee 2004a, 2004b) Greece (Sainis et al. 2016)
Korea (Lee 1998) Slovakia (Satanova et al. 2015)
Malaysia (Abdullah 2010; Talib et
al. 2014; Isa 2016)
Pakistan (Malik et al. 2011; Hussain
2015)
Singapore (Quazi and Padibio 1998) NA NA
Critical to Success Factors for SMEs:
As can be seen in table 1, there is overwhelming support for the idea of QM
implementation into SMEs. However, that doesn’t mean the process will be quick, easy or
necessarily guarantee positive results. Murphy (2016a) does state that SMEs should commit to
QM and that business improvement seems certain to follow. Kumar (2011) states that following
a process for SME QM engagement makes improvement more likely, with preparation pivotal
to success. If one were to follow a process, logic would dictate that there would need to be a set
of common critical to success factors (CSF) that could be measured to allow the organization to
assess performance. There is debate as to what the CSF should be in an SME and if those
factors should be hard (tools and systems) or soft (people) focused. Lewis (2006) synthesized
literature from developing economies that indicated soft factors such as customer focus and
customer satisfaction were frequently studied QM criteria. Quazi (1998) conducted a study of
41 SMEs in Singapore and found a set of seven CSF that proved to be beneficial in an SME

12
environment. They include leadership, information and analysis, strategic planning, human
resource utilization, management of process quality, quality results and customer satisfaction.
Two years later Yusof (1999) compared and contrasted at least five prominent studies of CSF in
1999. Strikingly, there was a large degree of commonality among the models, specifically top
leadership commitment, supplier quality management, human resources management and
training and education. Yusof (1999), who proposed his own unique model (Table 4), added
systems and processes, continuous improvement systems, measurement and feedback,
improvement tools and techniques, resources and work environment, and culture to the common
elements to produce a list of ten factors.
Table 4 - A comparison of critical to success factors from prominent studies
Generic Critical Factor
(Saraph 1989, Ahire 1996,
Black
and Porter 1999)
Quazi's Model
(Quazi 1998)
Yusof's Model
(Yusof 1999)
Management leadership Leadership Management leadership
Organization Strategic planning Continuous improvement
system
Education and training NA Education and training
Quality in design NA NA
Quality in suppliers NA Supplier quality management
Quality in process Management of process
quality
Systems and processes
Fact based management Quality results Measurement and feedback
Human resource
management
Human resource utilization Human resource management

13
Table 4 (Continued)
Customer focus Customer satisfaction NA
Tools and techniques Information and analysis Improvement tools and
techniques
NA NA Resources
NA NA Work environment and
culture
Yusof (2000) conducted a study of his proposed CSF with UK automotive parts SMEs.
He validated that the CSF enhanced QM in an SME and that the CSF for an SME were
different from those of a large organization. This finding contrasts with Ahire et al. (1996)
who conducted a similar study in the US and Canada in 1996. They found that QM did lead to
better product quality and there were no operational differences attributable to firm size for
TQM implementation and that both types of firms (SMEs and large organization) implement
the elements of TQM equally effectively. Sila (2002) conducted a literature review of the
TQM literature from 1989 to 2000 and found twenty-five TQM factors (CSF) that were most
common across seventy-six studies. Once again leadership, customer satisfaction and
employee involvement featured prominently. He suggested that other lesser known factors
such as strategic quality planning, product and service design, communication, social
responsibility and employee appraisal, rewards and recognition be considered for future
research.
Barriers to Implementation:
If we are to accept that critical success factors are important to SME QM performance,
we must be aware of what the common barriers to implementation may be. As Murphy

14
(2016a) stated, there has been research attention in this specific area. A study conducted in the
US and Canada found that ISO implementation was more successful when management
internalized ISO practices, reduced the behaviors that inhibit adoption and performed a
readiness analysis (Briscoe et al., 1995). A major part of that analysis is to determine what the
likely QM barriers could be. There seems to be widespread agreement that a lack of resources
(human and financial), employee training and top management commitment are the most
common barriers to implementation (Antony 2005, Mendes 2014, Kumar 2008,
Valmohammadi 2011, Alamelu 2011, Anderson 1999, Antony 2008, Gadenne 2009, Hasson
2003, Kumar 2007, etc.). Representative of this type of work, Mendes and Lourenco (2014),
conducted a study in Portugal that asked 95 manufacturing SMEs this very question. Their
study highlighted seven different but common factors affecting quality programs. In no
particular order:
1. Top management training education/training levels priorities
2. Costs and actual performance
3. Lack of support from external agents
4. Human resources overload
5. Aversion to change
6. Lack of resources
7. Culture and training (workforce)
In other cases, some SMEs can be compromised by the mechanistic and formalization of
some of the improvement models that they see as adding bureaucracy (McAdam, 2000). For
example, in the UK, SMEs struggled with accurately measuring and recording the quality costs
which led the management team of these organizations to believe that TQM was not appropriate

15
to the needs of small business (Goh, 1994).
Hu et al. (2015) examined the problem of barriers to QM by identifying both inhibitors
and enablers to QM implementation. Hu and his team were particularly focused on Lean
implementation in SMEs. The list of inhibitors included the previously mentioned lack of top
management commitment, lack of resources and a lack of training. He also added to that list
supplier and customer market forces such as SMEs lacking the market power to influence their
network of suppliers to adopt Lean. Perhaps more beneficial to SMEs, Hu identified enablers
that could make SMEs more competitive versus large organization in the adoption of QM. They
include an owner’s long-term commitment, a cross functional workforce, high levels of
teamwork and ease of communication.
Are QM Practices Universal?
From nearly the beginning of the American quality revolution in the 1980’s there has
been the belief that the principles and practices of QM are universal in nature. This view has
been propagated by the gurus of quality management which include Walter Deming (1986),
Joseph Juran (1989) and Philip Crosby (1979) to name a few. For example, Juran (1989, p.3)
stated that “All organizations can achieve superior results through the application of the
universal methods to manage quality, which design, maintain, and continually improve the
quality of goods and services.”
In his review Murphy (2016a) discussed evidence that QM could be more context
related. Those contextual factors could include country factors ranging from leadership skills to
national culture to government and could potentially affect QM implementation and outcomes
(Murphy, 2016a). An article that was not included in Murphy’s review was a study conducted
by Sousa and Voss (2001), in the UK that questioned the universality of QM and had evidence

16
that there were certain contextual factors, manufacturing strategy in this case, that affected the
implementation of QM in SMEs. Aldowaisan and Youssef (2004) suggested the idea of a
tailored framework that utilized an incremental approach to implementing QM, the ISO
framework in this case, in small organizations. Assarlind and Gremyr (2016) seem to agree
with that suggestion and conducted an interesting study in Sweden from 2009-2012 that found
firm size among other factors was critical to QM adoption. The study found that SMEs often
contend with scarce resources and as a result it could be beneficial to implement QM in a
gradual manner rather than attempting to implement everything at once. These recent insights
make a powerful argument that contextual factors should at least be considered when SMEs
approach the implementation of QM.
The existing literature shows that there is now wide-spread agreement that QM is
appropriate to the SME environment. This agreement is global and not constrained to any
geographic area. There are several critical success factors (CSF) and barriers to QM
implementation that should be considered by SMEs. It has also been determined that QM is not
universal as previously thought but context dependent. One of these contextual factors is firm
size. The challenge going forward for SMEs is how to best utilize what is known about the CSF
and the associated barriers to maximize business performance. One possible answer to this
question is to create a menu of all the factors (CSF, barriers, enablers and inhibitors) and allow
the specific SME to choose among the factors that are most closely aligned with their goals and
unique situation. From the existing research, a logical path forward could be to combine the
work of Ghobadian and Gallear (1996) with the work of Yusof (1999), Hu (2015), Medes and
Lourenco (2014) and Assarlind and Gremyr (2016). See Figure 1 for a visual representation.
Further described, Figure 1 intends to:

17
1. Determine the strengths and weaknesses of SMEs in general
2. Determine the critical to success factors of SMEs in general
3. Consider the common barriers to implementation for commonly found in SMEs
4. Consider the enablers and inhibitors of SMEs
5. Determine the specific contextual factors likely to most affect the SME under study
6. Gradually implement QM based on the factors identified in steps 1-5
A reasonable quantity of the factors (3-5 for example) could be chosen for the team to focus
their energies on with a specific goal of not overloading the team since a resource constraint
is likely to take place. Reducing the number of factors that will be considered will save time
and money (a key barrier for SMEs) and increase the probability for success since only a
few and not all factors will be included in the model.

18
Figure 1 Contributing factors to QM in SMEs
The Current Study
Although there was a significant amount of agreement concerning the use of QM in
the SME environment there were areas in the literature that offer opportunities for future
research. The clear majority (48/73 = 66%) of the surveyed literature (N=73) are survey
studies. Qualitative studies account for 22% (16/73) of this literature, and all of these
qualitative studies are case studies. There is no experimental study identified that assisted in
the evaluations of the effects of a quality improvement program, nor was there any action
research study identified that could do the same. Given that many quality improvement
programs have failed in the past, and in particular, their implementation in small SMEs are
unstudied and unknown, therefore, it is important to conduct a qualitative action research

19
study to both observe the effects of quality improvement program and identify opportunities
by which the program can be improved or customized to the needs of the implementing
organization. See Figure 2.
Figure 2 – A comparison of research methods for QM SME research
An additional area that offered opportunities for future research was geography. Table 3
clearly shows that QM SME research is becoming more widespread and more global. The
eighteen studies that were added since Murphy’s (2016a) publication attest to this growing
interest. Strikingly, there seems to be relatively little research that is being conducted in the
world’s largest economy, the United States. Figure 3 illustrates this discrepancy and shows that
of the QM SME research that was considered in the article only thirteen percent originated in
the United States. That means eighty-seven percent of the existing research has been conducted
elsewhere. Therefore, an opportunity to conduct QM SME research in the United States is
indicated.
0
10
20
30
40
50
60
Survey Case Study Literature Review Mixed Method
Research Method

20
Figure 3 – The global reach of QM SME research from 1990-2017
This study will narrow these gaps by conducting a mixed methods action research project
in the Unites States of a SME with the goal of building a quality management climate within
their organization. The proposed research questions would be the following:
RQ: How did a SME build a quality management climate?
The value of this research is significant for both the academic and practitioner
communities. For the academic community, there is the opportunity to add to the body of
knowledge of SME QM research, to focus in a particular geographic area (the USA) and to use
a research methodology (action research) that is underrepresented in the existing literature. For
the practitioner, the benefits are perhaps greater. There is the opportunity to conduct research
that could potentially result in a guide detailing how to implement QM in a SME. The guide
could be especially useful when considering that SMEs make up 99.9% of American businesses
and nearly 48% of the work force and that QM is known to increase business performance. As a
note, this research is was limited to a single company, however, the author believes that this
The Global Reach of QM SME Research 1990-
2017
16
14
12
10
8
6
4
2
0

21
limitation will be outweighed by the potential benefit, as there are currently no existing action
research studies in this particular arena. A guide or a collection of best practices from one SME
implementing QM could serve as a catalyst for other similar SMEs to join the quality
movement and propel their organizations forward.

22
Research Method
Action Research
One approach to solve this problem would be to investigate the process of how a SME
laid the foundations to build a climate of quality within an organization. In this instance, the
researcher utilized the action research method. As described in the introduction, action research
(AR) was first popularized by Kurt Lewin in the 1940’s to denote a creative approach toward
social research which combined generation of theory with altering the social system through the
researcher acting on or in the social system. The act itself is presented as a means of both
adjusting the system and developing critical knowledge about it (Susman and Evered, 1978).
AR aspires to contribute both to the practical concerns of people in an immediate problematic
situation and to the goals of social science by joint collaboration within a mutually acceptable
ethical framework (Rapoport, 1970).
Action research was chosen as the research method for a number of reasons. Lewin
(1946) coined the term “action research” in 1946 and described the type of problems that would
most be suited for this approach. Ideally, the situation would call for the team to answer
questions about the current situation, the dangers that the team could or would face and most
important of all what course of action that the team should take. It is an approach that has stood
the test of time with organizations of all types and sizes adopting the model. Some of these
organizations include civic groups, schools, businesses and hospitals to name a few. Gummeson
(2000) provides an updated list of reasons that are particularly intriguing for practicing
managers. Some of those reasons pertinent to this study include:

23
1. Action researchers take action
2. Action research always involves 2 goals: solve a problem and contribute to science
3. Action research is interactive
4. Action research aims at developing holistic understanding during a project and
recognizing complexity
5. Action research is fundamentally about change
6. Action research requires an understanding of the ethical framework, values and norms
within which it is used in a particular context
7. Action research can include all types of data gathering methods
8. Action research requires a breadth of pre-understanding of the business environment
For this action research project, the five-step action research cycle (ARC) first described by
Susman and Evered (1978) and was used as a template. The steps include:
1. Diagnosing
2. Action Planning
3. Action Taking
4. Evaluating
5. Specified Learning
Figure 4 highlights the action research cycle steps for the two interventions in this study.

24
Figure 4 - Action Research Cycle (ARC)
Action Research Process and Outcomes
The sponsor organization was founded in 1966 and has spent over forty-five years
designing and implementing cutting-edge solutions for the toughest communications challenges
in the world. In addition to the U.S. military, its customers include foreign governments and
Diagnosing - Step 1
Intervention 1 - Lack of collaboration and
communication. Low quality climate.
Intervention 2 - Significant holes discovered in the
training process. No easy way to monitor
employees training record.
Action planning - Step 2
Intervention 1 - Team chose to build a climate
based on top management support, collaboration,
data based decision making and a process focus
Intervention 2 – Build a robust training system with
unique roles and functions
Action taking – Step 3
Intervention 1 – Allocate resources, cross functional
meeting, quality database, revised processes
Intervention 2 – Implement training database and
update training system
Evaluating – Step 4
Intervention 1 – Significant defect reduction ~1.3
million dollars saved in year versus year comparison
Intervention 2 – Approximately 60% reduction of
NC’s post training
Specifying learning – Step 5
Intervention 1 – an increase of overall quality climate
observed. Need more and better training to consolidate
and solidify gains in performance
Intervention 2 – Improved training resulted in a
reduction of overall NC’s and an increased quality
climate. Further automation of the training database
planned

25
militaries across the globe. Additionally, the sponsor organization provides remote
communication solutions to the commercial sector, including some of the world’s largest energy
companies. It is a wholly owned subsidiary of a larger company and is the world leader in
digital communications systems. These advanced communication systems use elements (such as
water, vapor, dust or atmospheric variations) in the lowest level of the atmosphere to scatter a
small portion of transmitted energy forward in a predictable manner. A point to point link that
requires a terminal on each end and is capable of both transmitting and receiving signals is used
to create a dependable, compact, and low cost communication solution. These systems are an
ideal alternative to expensive satellite communication and can be deployed in the harshest
locations.
Intervention 1
The research project follows the adapted five stage Action Research model described
in Susman Evered (1978).
Intervention 1: Step 1 - Diagnosing:
This stage, which involves identifying or defining a problem in the organization, was
performed through unstructured interviews with participants, a review of documented data and
observation. The organization as a whole was not satisfied with the current state of the quality
system and therefore desired a change to a new level of performance. The desire to change
and common agreement that change was needed exemplified the unfreezing step. The
participants consisted of members of the senior leadership team, individual contributors
(engineers, assemblers, purchasing, program managers, etc.) and external stakeholders. The
external stakeholders included customers, vendors and third-party auditors.
Approximately thirty interviews, data analysis and observations revealed that the

26
organization held an antiquated view of quality. The team operated in a quality control rather
than quality assurance environment. This meant that focus was on product and defect
identification rather than process and defect prevention. The tools used to collect the data
followed by its analysis supported that conclusion.
Other common themes that emerged in the data collection phase was that there was a
general feeling among the participants that collaboration and communication could and should
be improved. Overall, the team operated in and the organizational structure allowed a ‘hero
mentality’, where individual team members would go to great lengths to get the job done for the
customer and were rewarded to do so. This type of behavior was done at the expense of process
focus which is one of the hallmarks of an ISO 9001 company. According to the International
Standard Organization, the non-governmental body responsible for creating the standard, ISO
9001 sets out the criteria for a quality management system. The standard provides guidance,
tools and best practices that organizations of all sizes can use to ensure that their products and
services consistently meet customer’s requirements and that quality is consistently improved
(“ISO 9001:2015”, 2017). The organization was ‘ISO 9001 certified’. It did have a collection of
processes, known internally as ISO processes, which were created and reviewed by the senior
leadership team. However, a number of these processes were out dated. In the most recent third-
party audit by National Quality Assurance (NQA) which was performed in April of 2015, there
were four audit findings (three minor and one major) that threatened the company’s certification
and the ISO certification was seen as an imperative by the company. Current and future
contracts were predicated on certification. Based on this result, the team chose to build a climate
of quality. According to Ostroff (2012), climate can be described as employees’ perceptions of
what the organization is like in terms of practices, policies, procedures, routines and rewards.
27
Climate is often misinterpreted as culture, which can define why things happen in an
organization. It deals with the ideologies and assumptions developed by the organization.
‘Climate’ was chosen as a focal point over the more popular ‘culture’ because it is more
concrete and easily measured as compared to the more ambiguous ‘culture’. The perceptions of
the employee’s attitude in regard to quality management at the organization were gathered
primarily through unstructured interviews with the sources described previously. The
interviews included questions regarding the policies, practices and results of the organization’s
quality management system. The form of the unstructured interview varied in combination with
both targeted questions as well as encouraged ‘free-thought’ conversation. This approach
facilitated spontaneity which allowed questions to develop during the course of the interview,
which reflected the interviewees' responses.
Intervention 1: Step 2 - Action planning
Action planning is the second stage of the action research cycle. It involves considering
alternative approaches for solving a particular problem. The main problem the research team
faced was how to build a climate of quality (COQ) in a SME. At the time of the study the
company had roughly 80-110 employees with revenues ranging between $30-50-million. Those
statistics qualify the organization as a small to medium business by most definitions (“Make
sure you meet”, 2016). Resources are usually scarce in the small business environment and this
situation was no different. In other words, the research team was tasked with building a climate
of quality at the lowest possible cost. Although there are many definitions that describe how a
company builds a climate of quality, the team relied on internal quality data, intuition and
experience to create a solution that was unique to the situation in question. Ultimately, the
organization chose to build the COQ on four pillars:

28
1. Top management support
a. Quality will be seen as a priority by management, exhibited by words and actions
2. Collaboration
a. Team will operate as a cohesive unit
3. Data centered decision making
a. Decision making will be based on data
b. Tools will be created to facilitate this process
4. Process focus
a. Team’s work will be governed by processes
b. It is everyone’s responsibility to follow or change processes
As discussed in the literature review, the four pillars are all key factors that can become
enablers or inhibitors to the successful adoption of quality management in a SME. The critical
step faced by the team was how to take advantage of the factors that were positively related to
SMEs (top management support and collaboration) and how to best mitigate or minimize the
impact of factors that were seen to be inhibitors (data based decision making and process focus).
Intervention 1: Step 3 - Action Taking
The third phase of the action research cycle is called intervention or action taking. In
this phase, an action is selected and implemented. It is where the organization moves from
the status quo to the desired state. Based on the data sources described previously the primary
factors targeted for intervention were top management support, collaboration, data based
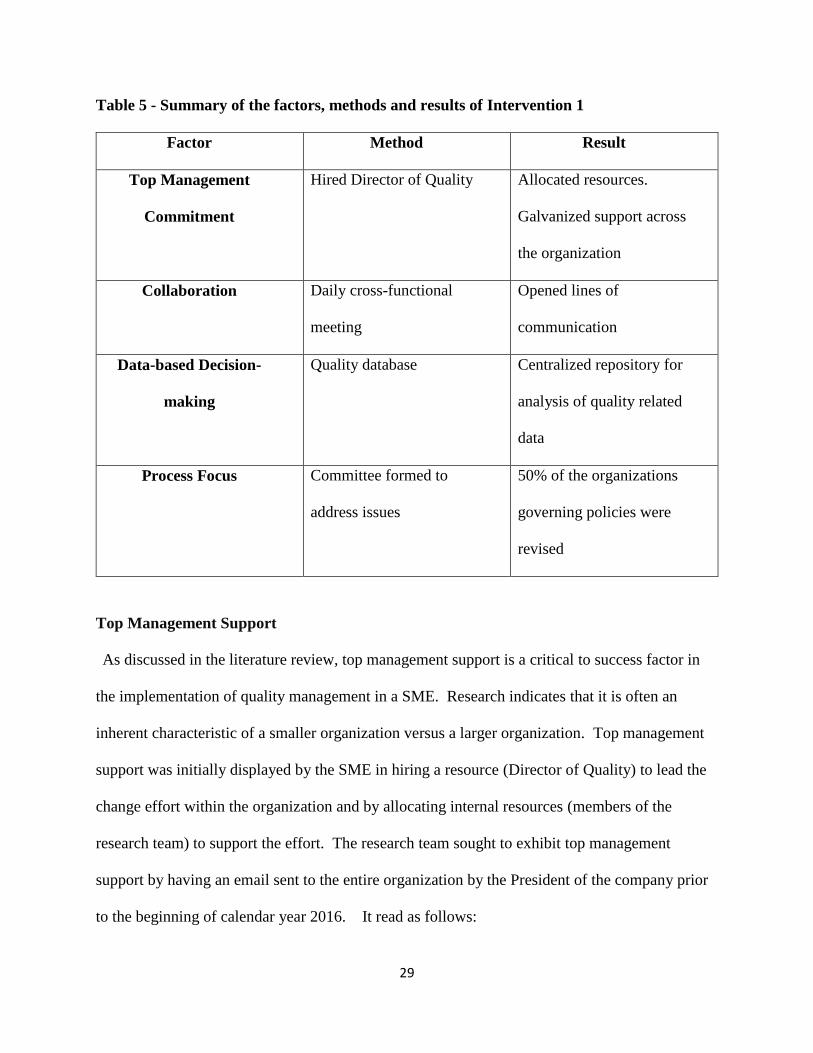
decision making and process focus. Table 5 shows the four factors of quality management,
the method used to express the factors and the result of the method used to express the factor.
Each factor, method and result is expressed in more detail below.
29
Table 5 - Summary of the factors, methods and results of Intervention 1
Factor Method Result
Top Management
Commitment
Hired Director of Quality Allocated resources.
Galvanized support across
the organization
Collaboration Daily cross-functional
meeting
Opened lines of
communication
Data-based Decision-
making
Quality database Centralized repository for
analysis of quality related
data
Process Focus Committee formed to
address issues
50% of the organizations
governing policies were
revised
Top Management Support
As discussed in the literature review, top management support is a critical to success factor in
the implementation of quality management in a SME. Research indicates that it is often an
inherent characteristic of a smaller organization versus a larger organization. Top management
support was initially displayed by the SME in hiring a resource (Director of Quality) to lead the
change effort within the organization and by allocating internal resources (members of the
research team) to support the effort. The research team sought to exhibit top management
support by having an email sent to the entire organization by the President of the company prior
to the beginning of calendar year 2016. It read as follows:

30
“In order to grow, stay competitive and provide work class communications systems to
customers around the world, we must embrace change and continuous improvement
throughout the organization. Continuous improvement is not only a mandate of ISO
9001:2008, it is increasingly a customer expectation. Over decades, our customers and
competitors have adopted many of the continuous improvement initiatives that begun during
Japan’s post-war economic transformation, most famously implemented at Toyota. The
Toyota production process became the model for others to follow. While this organization is
not Toyota, many of the fundamental concepts and best practices can and should be
implemented. Suffice to say, continuous improvement must become the culture within which
we operate every day.”
With a new year upon us and as we move to a new facility, now is the time for change. As
such, the Management Team and I have created a Continuous Improvement Committee (CIC)
led by our Director of Quality. This cross-functional team will drive and direct continuous
improvement initiatives aimed at making us a world class organization. However, none of this
can happen without your active involvement. Each of you will have the opportunity to
participate in Kaizen events (Japanese term for continuous improvement) focused on
obtaining tangible results for the benefit of our current and future customers. We want our
customers to know we want their business. They want to know their products are designed
and built using best practices. The end-user, which is often the military, will know that our
products in their possession are reliable and dependable. After-all, our products protect and
save lives.

31
Please join me as we embark on this new venture. The days of “this is how we have always
done it” are over. Each of you have the opportunity to help us grow the business, make this a
better place to work and show our customers we are the industry leading provider of cutting
edge communications systems in the world. I appreciate your support and look forward to a
successful 2016.”
The result of the email was galvanized support for the overall quality improvement effort. Each
employee now knew and understood that the projects that would be coming in the near future
had the support of the senior leadership team. The email served as the catalyst for change within
the organization. It prepared the organization for change and made it more likely that the team
would encounter allies in the change effort rather than opposition.
Collaboration
The collaboration factor was increased through the use of a short daily meeting with the
cross functional team that was responsible for getting the production work of the company done.
These meetings generally lasted 30 minutes to an hour depending on the volume of issues
discussed. Traditionally, the company had used a monthly program review meeting to resolve
issues. These meetings usually lasted for 3-4 hours and covered all aspects of the programs that
were currently under contract within the organization. Typical topics included financials,
schedule adherence, customer concerns, supply chain issues or any other topic that could not be
resolved at a lower level. It was run by the Vice President of Program Management (VP PMO)
and attended by the senior staff and the pertinent Program Manager (PM) and Project Engineer
(PE). All topics that needed resolution in a more expedited manner were addressed with

32
irregular ad hoc meetings that were topic specific. There were no regular meetings that
addressed the concerns of the manufacturing floor.
To address this issue, the Vice President of Operations (VP OPS) suggested a daily
meeting to discuss these types of issues. It would be cross-functional in nature and include
representatives from Operations (which included manufacturing, supply chain, test),
Engineering, Program Management Office (PMO) and Quality. Any issue that was seen to
impede the progress of manufacturing or testing the product was discussed and resolved on the
spot. If the issue could not be resolved on the spot an off-line meeting was scheduled with the
interested parties.
Initially, these meeting were met with some skepticism. The most frequent compliant
was that there was no time for an additional meeting and that a daily meeting would be repetitive
with little to no added value. The short duration of the meetings and the rapid response to issues
mostly alleviated these concerns. Traditionally, the organization had operated in a ‘functional
fiefdom’ where each function was principally concerned with maximizing the performance of
their particular function rather than working collaboratively to increase the performance of the
overall organization. The research team reasoned that if representatives from the major functions
in the company worked together on a continual basis and were encouraged to solve problems
together, they would be less likely to blame other functions for internal deficiencies.
Additionally, the daily meeting would create functional advocates for the collaborative problem-
solving approach that could articulately speak to the merits of the approach to their functional
colleagues. The success of this assumption would be measured in the total defects metric that
would be reported by the Quality Assurance organization.

33
Data centered decision making
The transition to data-based decision making was more controversial than the first two
factors. The organization used a paper based system to track and document all non-conformances
or NC’s as they were commonly called. This included the following:
Incoming non-conformances which the organization called material variance report or
MVR’s,
In process rejections called squawks, which was a term used by the US military to
identify in process discrepancies
Failure reports which were discrepancies found during the test phase
Corrective action requests for any issues found that did not follow the released ISO
processes
The research team evaluated several different data management systems including the
creation of a ‘home-grown’ system. Ultimately, it was decided that the best overall value
system would be the Quality Database (QDB) offered by West Coast Business Systems. The
key advantages to the system were:
Low cost
o $1100 in total
Ease of use
Process focused
o Followed the ISO 2015 guidelines
All records could transition
The key disadvantages were:
Limited analytics
34
Not customizable
The QDB was purchased in November of 2015, activated in February 2016, piloted
in March of 2016 and the system went live in April 2016.
Process focus
In an effort to inculcate a process-based focus across the entire organization a process
improvement team was formed. This effort was led by the Director of Quality and included
representatives from all major departments. Each member was required to bring ideas to the
team that could improve the organization’s performance. The team created a prioritization
matrix to help focus attention on the most critical items. The matrix was a tool for potential
projects that quantitatively measured how often an issue occurred, the impact the issue had on
the organization and the feasibility that an agreeable solution could be created in a timely
fashion. These items were scored on a basis of 1-10 and then multiplied to create a project
score. The highest scoring items would be worked first. The highest scoring items were:
1. ISO processes
2. Non-conformance Database
3. Supplier Management
As a result of the ranking, the processes were reviewed based on the impact of each
process and sixteen of the thirty-two ISO processes were updated over calendar year 2016.
Intervention 1: Step 4 - Evaluating
The evaluation phase involves studying the consequence of the actions taken. The
researcher conducted informal interviews with the stakeholders described in the diagnosing
section. Of specific concern were the actual users of the new systems and the tools put in
place. Once again, the pertinent records were reviewed, and the researcher noted
35
observations based on experience.
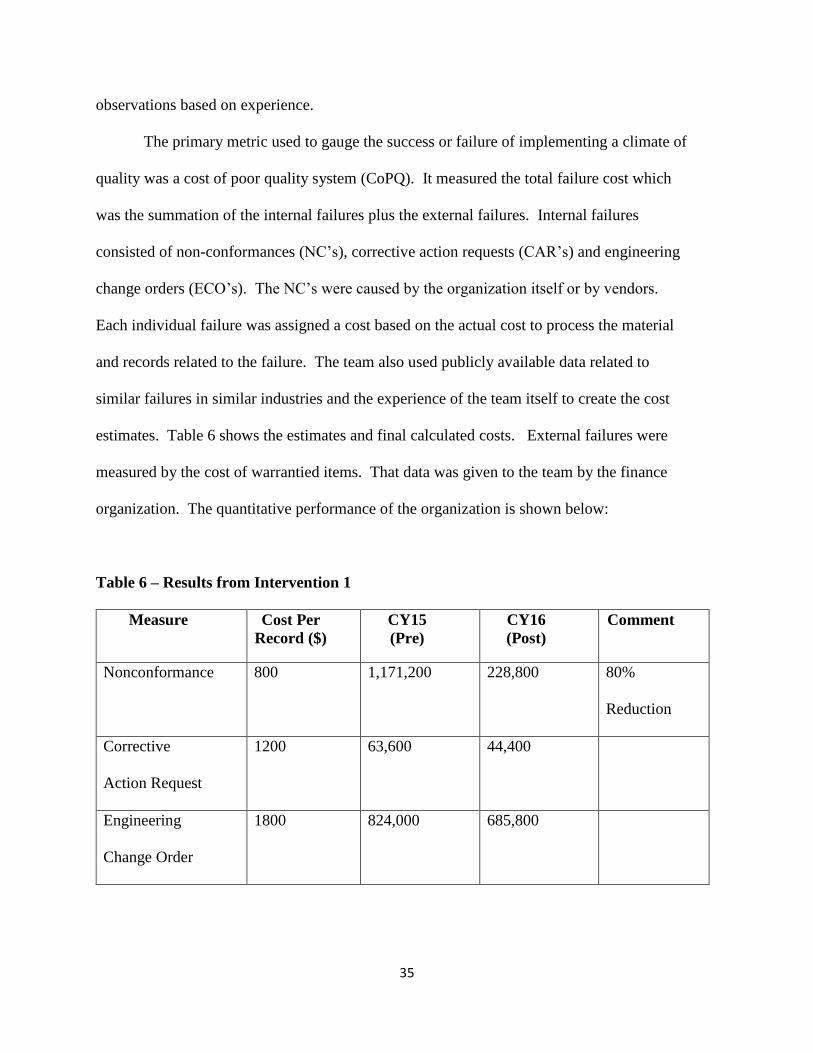
The primary metric used to gauge the success or failure of implementing a climate of
quality was a cost of poor quality system (CoPQ). It measured the total failure cost which
was the summation of the internal failures plus the external failures. Internal failures
consisted of non-conformances (NC’s), corrective action requests (CAR’s) and engineering
change orders (ECO’s). The NC’s were caused by the organization itself or by vendors.
Each individual failure was assigned a cost based on the actual cost to process the material
and records related to the failure. The team also used publicly available data related to
similar failures in similar industries and the experience of the team itself to create the cost
estimates. Table 6 shows the estimates and final calculated costs. External failures were
measured by the cost of warrantied items. That data was given to the team by the finance
organization. The quantitative performance of the organization is shown below:
Table 6 – Results from Intervention 1
Measure Cost Per
Record ($)
CY15
(Pre)
CY16
(Post)
Comment
Nonconformance 800 1,171,200 228,800 80%
Reduction
Corrective
Action Request
1200 63,600 44,400
Engineering
Change Order
1800 824,000 685,800
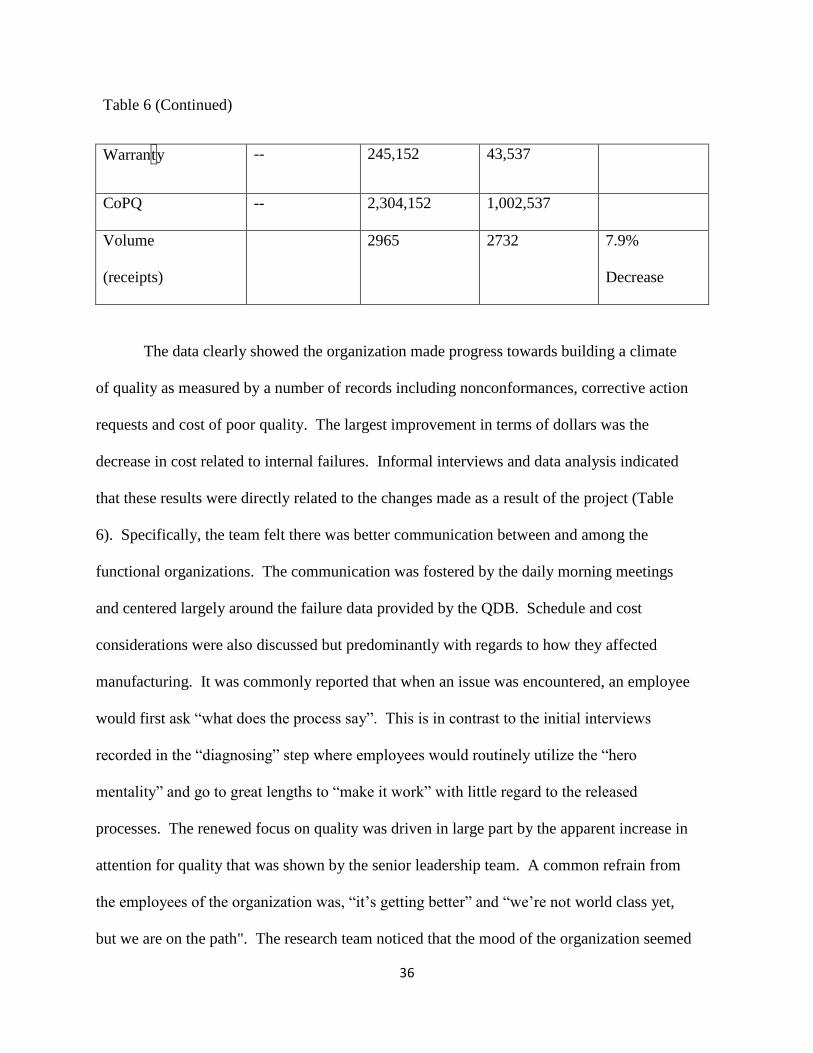
36
Table 6 (Continued)
Warranty -- 245,152 43,537
CoPQ -- 2,304,152 1,002,537
Volume
(receipts)
2965 2732 7.9%
Decrease
The data clearly showed the organization made progress towards building a climate
of quality as measured by a number of records including nonconformances, corrective action
requests and cost of poor quality. The largest improvement in terms of dollars was the
decrease in cost related to internal failures. Informal interviews and data analysis indicated
that these results were directly related to the changes made as a result of the project (Table
6). Specifically, the team felt there was better communication between and among the
functional organizations. The communication was fostered by the daily morning meetings
and centered largely around the failure data provided by the QDB. Schedule and cost
considerations were also discussed but predominantly with regards to how they affected
manufacturing. It was commonly reported that when an issue was encountered, an employee
would first ask “what does the process say”. This is in contrast to the initial interviews
recorded in the “diagnosing” step where employees would routinely utilize the “hero
mentality” and go to great lengths to “make it work” with little regard to the released
processes. The renewed focus on quality was driven in large part by the apparent increase in
attention for quality that was shown by the senior leadership team. A common refrain from
the employees of the organization was, “it’s getting better” and “we’re not world class yet,
but we are on the path". The research team noticed that the mood of the organization seemed

37
to change. People were more positive and the employees were more focused on the issue at
hand and how to solve the problem in a manner where reoccurrence was less likely to occur.
An interesting problem that the research team encountered was tool usage. For
example, corrective action requests (CAR’s) are a tool that organizations use to identify the
root cause of an issue, implement a corrective action to bring the material back into
compliance and a preventative action to reduce the likelihood of reoccurrence. The research
team discovered that CAR’s were seen as punitive by most members of the sponsor
organization. Team members who received CAR’s as a result of operating outside of the ISO
processes took the assignment of a CAR as a personal attack and in rare cases could become
quite emotional. As a result, it was noted that the quality team did not effectively use CAR’s
to resolve issues internally with colleagues or externally with vendors. Consequently, there
were little documented evidence of these problems and more importantly the resolution for
the specific item. Calendar year’s 2015 and 2016 show the transition that took place and a
significant increase in CAR usage which led to improvement. Interviews suggested that as
collaboration increased, the team felt comfortable with constructive criticism and the need to
document issues to prevent re-occurrence which led to an increase in CAR’s.
Intervention 1: Step 5 - Specified Learning
The last phase, specified learning, highlights what was learned during the action research
project or in this case the first iteration of the intervention phase. The leadership team at the
sponsor company identified that quality was an area that was rife for improvement. An
improvement team was formed with the goal to build a climate of quality at the lowest possible
budget due to constraints found in many SME. This climate of quality was built on the pillars of:
1. Top management support

38
2. Collaboration
3. Data centered decision making
4. Process focus
Top management support was galvanized through an email from the President to all
employees in the company. As a result, all lower level leaders communicated the desire to get
better in both actions and words. This effort was reinforced by a relentless focus on process
improvement that actively sought the input from the functions that were most closely involved
in performing the task under study. The collaboration of individual team members was problem
focused instead of people focused and used the data provided by the new quality database to
make decisions. Utilizing this approach, the organization was able to save ~$1,300,000 by
eliminating non-conformances across the board which resulted in a measured 56%
improvement.
The concern the organization now faced was the challenge of consistency; how to lock
in that improvement and not allow regression to the previous level of performance. Lewin
(1947) described this step of the change process as “refreezing” once the organization reached
the new and desired level of performance. He suggested that organizations can ‘lock-in’ this
performance through changing processes and retraining of the work force. A critical element
related to this step is a robust training system that can accurately track the training requirements
and performance of individual employees. After a thorough review of the current training
system and associated records used at the sponsor organization it was determined that there was
a definitive need to overhaul the training system and requirements. This realization informed
the next step of the action research project and directly led to Intervention 2, the second process
cycle.

39
During the time of this study there were a number of items that had the potential to
negatively impact the project. For example, business was down in calendar year 2015, resulting
in layoffs. Business improved during calendar year 2016 but not back to calendar year 2015
levels. As a result, hiring of personnel resumed in 2016, however the total headcount still
remained lower than at the peak prior to the downturn. Ultimately these issues focused the
organization on immediate improvement which can be seen in the final results.
Intervention 2
Intervention 2, like Intervention 1, followed the adapted five stage action research
model described in Susman Evered (1978).
Intervention 2: Step 1 - Diagnosing
Despite the success of Intervention 1 a need was identified that resulted in Intervention
2. Specifically, the training process and associated documentation for that process was felt to
be lacking in the sponsor organization. The organization felt that they had made great strides in
terms of building a quality climate and the quantitative results supported that opinion.
However, the move to a new level of performance required a significant amount of change. To
ensure that the change was digested by the group and the new level of performance became the
status quo, a robust training process was absolutely essential according to the leadership team.
In an effort to validate the general feeling among the team the training records were
examined. As described previously, the sponsor organization’s quality system was governed
by thirty-two ISO processes. During phase 1 of the project, sixteen of the thirty-two processes
were revised. Interviews with the team members indicated that the common thought among the
group was that each of the thirty-two processes was retrained on an annual basis. Examination
of all thirty-two of the processes showed that only two of the processes (Foreign Object Debris

40
(FOD) and Electrostatic Discharge (ESD) called for annual refresher training. The other thirty
did not specify any form of retraining. If a process was updated or changed in any way, it was
the responsibility of the Quality Assurance organization to retrain the team on that specific
process. The evidence that the training had actually taken place was a hard copy form that
listed a description of the training, the Quality Management System (QMS) element, the date
and the signature of the employee and the trainer. For example, if one process was trained to
30 people, the process consisted of each form being manually filled out by the employee with
the data provided. The data could be and was often inconsistent. The QMS element was not
required (it was optional as indicated on the form) and not often included. The descriptions
varied widely, and the trainer was required to sign each form. Once the forms were completed,
the trainer would take the forms to the Human Resources (HR) Manager. HR would then
manually file each record into the employees’ folder. The result of this process was a general
sense of confusion. Records could be and often were misplaced by either the trainer or HR.
Assuming that the record was filed, it was difficult to analyze the records for conformance to
policy and to determine which employee had received what training or what was required in the
near future.
The research team began the process of addressing this issue with expanding the
research team. The newly hired Director of HR was included because she was directly
responsible for this process. Additionally, the IT Manager was added to explore potential
automated solutions for this issue.
Intervention 2: Step 2 - Action Planning
An automated solution was determined to be a key objective for the new training
system. In addition to the time saved from processing the forms, there would likely be

41
increased utility the team reasoned. The goal of the new system would be to provide point and
click access for each employees’ training record. A critical part of that step would require that
the team know exactly what training was required for each employee. Data analysis showed
that the sponsor organization did currently have a training matrix which was an attachment to
the current HR process. Informal interviews indicated that it was commonly thought to be
inadequate within the organization. Employees felt that the training could be more detailed and
cover a wider range of responsibilities. The current matrix included the specific ISO process
and the function that needed training. There was no delineation for different responsibilities
within the function. For example, the engineering function had the same training requirements
for all members of the engineering team. Although, the team consisted of electrical engineers,
mechanical engineers, project engineers, R&D engineers, computer engineers, draftsman etc
the training requirements were the same. Based on these and similar comments from multiple
functions throughout the organization, the research team prioritized adding flexibility to the
matrix that would capture the unique responsibilities for each employee’s specific role. The
QA team would work in tandem with the Humane Resource Department (HR) to build a more
comprehensive training matrix. Once the matrix was created, the IT Manager would use that
input as the basis for the new automated system.
Intervention 2: Step 3 - Action Taking
The first step of the Action Taking process was to define the specific training
requirements for all employees. The current process outlined the training module
requirements. As discussed in the previous section, the team discovered that the level of
training was less than the organization needed. In addition, the amount of annual retraining
was increased. The current process required all employees to be retrained annually on five

42
processes. They were the electrostatic discharge (ESD), foreign object debris (FOD), and
business continuity plan (BCP). Two additional processes were mandated by corporate for
annual review and they were the Foreign Corrupt Practices Act (FCPA) and export control
processes. While these processes were important to how the business was run, they were not
representative of exactly how the products and services that the sponsor organization were
produced. For that reason, the additional processes of engineering, production control, control
of non-conforming product and management information systems or information technology
were added to the annual training requirements. Overall, it was an increase in annual training
of 80%. In addition, control of the training portion of the ISO processes were transitioned from
the HR function to quality. While quality previously was responsible for annually auditing the
HR process which included the training requirements, the senior leadership team wanted to
keep a closer eye on the maintenance of the training function. Quality would now report
monthly on what training had taken place and what was upcoming for the next month. This
action included making sure that the appropriate employees were trained at the appropriate
time. Quality would collaborate with the process owner for each ISO process.
In an effort to streamline the training requirements matrix a training database was
developed. The IT Manager based the design of the training database on the requirements laid
out in the HR training matrix. The Database was designed to forecast employee training
requirements, capture particular training session details, and maintain employee training
records. The system categorized required training by both job position and functional role. It
also provided administrative reports for all employee records. Automated scheduling was
based on course type and course frequency. The front end, or graphical user interface (GUI), of
the system was programed in the language of C Sharp. The back end or data collection and

43
storage of the system was programmed in the language of SQL. When a user needed to access
training related data, he would submit the parameters via the GUI and the system would query
the back end for the specific data needed and report the results.
Intervention 2: Step 4 - Evaluating
Prior to the evaluation of the solution, the management committee (MC) of the
organization were required to review and sign off on the proposed changes. The MC reviewed
the updated HR process and training matrix the last week of April 2018. Training to the new
processes began the first week of May 2018. The team based the success or failure of the
training on direct observations, unstructured interviews with the employees and the occurrence
of non-conformances (NC’s). The NC’s would be compared on a quarter versus quarter basis.
The idea was that the team could compare February through April 2018 versus May through July
2018 (i.e. prior to the training and after the training). The collected data is shown in Table 7. As
can be seen below there was a significant decrease in the total amount of NC’s. The data
collected shows that there was an overall 60% decrease in the amount of NC’s over the measured
time period. Interestingly, there was an increase in volume of 36% which suggests that the
improvement was not affected by volume. The quantitative results exceeded the expectations of
all stakeholders.
The interviews and observations collected during this section were aided by the presence
of a third-party auditor. As discussed earlier, the sponsor company was ISO 9001 certified to the
2008 standard. The transition audit to the 2015 standard occurred during the evaluation phase of
Intervention 2, specifically the audit took place for three and half days in early May 2018. This
allowed members of the research team additional (and unbiased) insight into the company’s
current performance. The auditor assessed the entire quality management system which included

44
the new training database. In large part, he was impressed and stated “he could tell that much
work had been done to improve the quality management system”. He reviewed randomly
selected training records of employees and found no errors or omissions. The employees
themselves indicated that the training tool made it much easier for individual team members and
their managers to access and display their training needs and recent performance (e.g. what
training they had recently received). Overall, the team determined that this was a major
improvement over the last system.
Intervention 2: Step 5 - Specifying Learning
As described in Intervention 1, the specifying learning section describes what was
learned during the action research cycle. For Intervention 2, the data suggests that the
improvement gains can be locked in with an effective training or retraining program. The
improvement that was seen in Intervention 1 was frozen at the new level of performance with
the aid of the new training database that allowed both employees and managers to accurately
and easily access and display their training needs. As a consideration for future improvement,
the team discussed the possibility of further automating the training process. An example
would be to video record particularly difficult manufacturing operations that could be
individually recalled by operators on an as needed basis.

45
Table 7 – Results from Intervention 2
Measure Cost Per
Record ($)
QRT 1 (Pre) QRT 2
(Post)
Comment
Non-
conformance
800 52,000 20,800 60%
improvement
Volume
(Receipts)
NA 1,864 2,333 36% increase

46
Discussion
The goal of this dissertation project was to explore how one SME built a quality
management climate. It was influenced by the work of Bishop (2018), Aldowaisan and Youssef
(2006), Ghobadian and Gallear (1996), Yusof (1999), Hu (2015) and Medes and Lourenco
(2014). In other words, this project attempted to characterize how one SME executed the
following:
1. Determined the strengths and weaknesses of SMEs in general
2. Determined the Critical Success Factor (CSF) of SMEs in general
3. Considered the common barriers to implementation commonly found in SMEs
4. Considered the enablers and inhibitors of SMEs
5. Determined the specific contextual factors likely to most affect the SME under study
6. Gradually implemented a Quality Management (QM) climate based on the factors
identified in steps 1-5
This study used the action research method to exemplify how the change process
occurred in a real-world application. The results from this project show that the organization was
indeed able to build a quality climate as measured by the total defect count and the reduced cost
of poor quality. The remaining portion of the discussion section will be divided into four parts as
follows:
Unexpected findings
Generalizability
Limitations of the Research

47
Implications for Practice
Unexpected Findings:
The organization chose four factors to focus on as a foundation for the improvement
effort. Two of the factors (top management commitment and collaboration) were commonly
found to favor SMEs over larger organizations and the other two factors (data centered decision
making and process focus) were ordinarily found to be less common in SMEs as compared to
their larger counterparts. The research team reasoned that a balanced approach among the
factors, (i.e. two that were favorable among SMEs and two that would need attention) would
likely lead to a positive outcome while not overwhelming the limited resources of the team. The
unexpected finding was that there were two factors for each case, however, they were not the
factors that the team had originally intended. Top management support and data centered
decision making was adopted by the organization with enthusiasm. Collaboration and process
focus were adopted with some trepidation; however, they were both eventually adopted. The
difficulty in establishing collaboration was unexpected primarily because it was supported by the
literature as being more naturally found in smaller organizations.
One possible explanation for this occurrence could have been based on the repeated
efforts by upper management to improve collaboration which met with failure. Consequently, the
team members were anchored to those past efforts. It is not unusual that as improvement
initiatives progress, the initial enthusiasm lessens over time and team members regress into their
previous behavior. The research team opposed this natural tendency with constant
communication. As described in Intervention 1, the collaboration factor was targeted for
improvement with the use of a daily meeting. Individual contributors from various functions
across the organization found this venue helpful when it came to ‘raising the flag’ for production
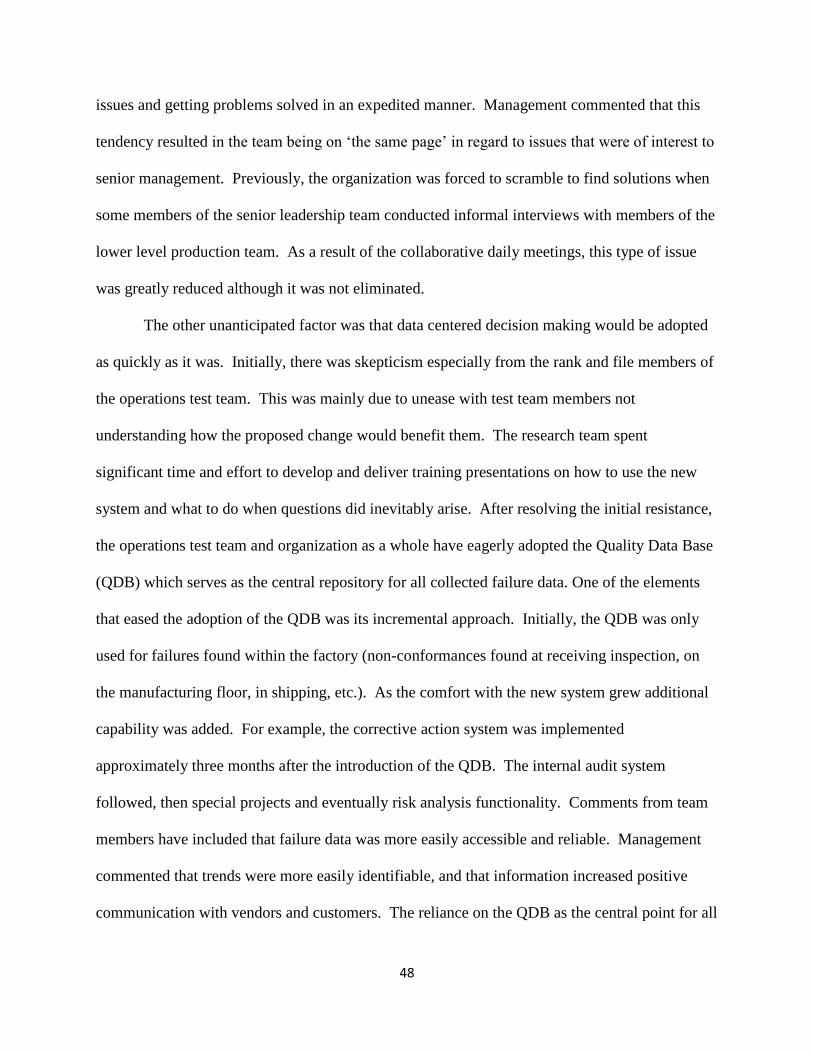
48
issues and getting problems solved in an expedited manner. Management commented that this
tendency resulted in the team being on ‘the same page’ in regard to issues that were of interest to
senior management. Previously, the organization was forced to scramble to find solutions when
some members of the senior leadership team conducted informal interviews with members of the
lower level production team. As a result of the collaborative daily meetings, this type of issue
was greatly reduced although it was not eliminated.
The other unanticipated factor was that data centered decision making would be adopted
as quickly as it was. Initially, there was skepticism especially from the rank and file members of
the operations test team. This was mainly due to unease with test team members not
understanding how the proposed change would benefit them. The research team spent
significant time and effort to develop and deliver training presentations on how to use the new
system and what to do when questions did inevitably arise. After resolving the initial resistance,
the operations test team and organization as a whole have eagerly adopted the Quality Data Base
(QDB) which serves as the central repository for all collected failure data. One of the elements
that eased the adoption of the QDB was its incremental approach. Initially, the QDB was only
used for failures found within the factory (non-conformances found at receiving inspection, on
the manufacturing floor, in shipping, etc.). As the comfort with the new system grew additional
capability was added. For example, the corrective action system was implemented
approximately three months after the introduction of the QDB. The internal audit system
followed, then special projects and eventually risk analysis functionality. Comments from team
members have included that failure data was more easily accessible and reliable. Management
commented that trends were more easily identifiable, and that information increased positive
communication with vendors and customers. The reliance on the QDB as the central point for all

49
defect data reinforced the need for a robust training system that directly led to Intervention 2.
As described in Intervention 2, the team recognized the need for a more robust training
system after Intervention 1, specifically the ability to accurately track what training was needed
for each employee and what training had occurred or was about to come due. The team built and
implemented a new training database that met these needs with the result of approximately a
60% reduction of NCs or recorded defects which exceeded the expectations of the sponsor
company and research team. The team originally believed that due to the renewed focus on
training that there would be an initial increase in NC’s that would be followed by a gradual
decline of NC’s. The team reasoned that the end result would be an overall reduction in the
amount of NC’s recorded. The actual result was an immediate and sharp decline in the number
of NC’s recorded. While the team anticipated that progress would be made, and the total defect
count would be reduced, the research team was surprised by the magnitude of the improvement
for both Intervention 1 (approximately 80% reduction in NC’s) and Intervention 2
(approximately 60% reduction in NC’s).
At first, the team thought that this result may be related to product volume and it did have
a minimal impact for Intervention 1. Product volume was measured in monthly material receipts
as recorded by the organization’s Enterprise Resource Planning (ERP) tool. For calendar year
2015 there was a total volume of 2965 receipts. For calendar year 2016 there was a total of 2732
receipts which corresponded to an approximately 7.9% decline in volume versus an
approximately 80% improvement (reduction) in NC’s. Intervention 2 did not appear to be
impacted by volume. As described previously, Intervention 2 used a quarter (three months prior
to training) versus quarter (three months after training) measurement to gauge performance.
There was a 36% increase in the amount of material received by the organization and a 60%

50
reduction in non-conformances.
Generalizability:
The generalizability of the findings falls into two major categories which are:
Large organizations vs. SMEs
Industry
As mentioned previously, there are many differences between a large organization and
small to medium sized enterprise (SME). A list of some of the major differences is laid out in
table 1. The primary purpose of this study has been to show that the opportunity to build a
climate of quality is not an inherent difference among large organizations and SMEs. However,
there are certain organizational, procedural and systematic differences than can make it easier or
more difficult for an organization to achieve a quality management climate. A distinct focus on
these factors, particularly, which factors aide or impede the organizations progress towards it
desired goal must be considered. For example, top management support is vital for any
improvement project regardless of firm size. It is essential that the organization’s leadership
‘buys into’ the improvement effort and actively supports that effort by allocating the necessary
resources (time, material, expertise, etc.) to increase the probability of success. Both SMEs and
large organizations are equally capable of showing top management support.
The sponsor organization is this project was primarily an engineering and manufacturing
organization. Are the results experienced in this project only applicable to manufacturing
organizations? Are other industries, such as service organizations, exempt from these findings?
There is truth in the assertion that quality management was born in a manufacturing
environment. However, there has recently been intense interest in transferring the positive
benefits originally seen on the manufacturing floor into the ‘back rooms’ of organizations (i.e.

51
those functions traditionally viewed as being more service oriented such as Human Resources,
Finance or Marketing among others). In fact, there is an entire division in the American Society
of Quality (ASQ) dedicated to promoting the benefits of quality management in service
organizations (“What We Do”, 2018). Although the sponsor organization was a manufacturing
firm, the interventions used in the action research cycle could have just as easily been applied to
a service organization. The results may not have been as dramatic but any organization that has
top management support, collaboration among the various teams and departments, used data to
make decisions instead of feelings and focused on the process of building their product or service
will almost certainly see both operational and financial improvement.
The hospitality industry, for example, is primarily thought of as a service industry. The
same factors used in this study of a manufacturing environment could be used to increase
performance in a hotel. For example, if the hotel defined increased performance as return visits
the application of the four factors may look something like the following:
Top management support - the leadership team determines the goal to
increase return visits and allocates the necessary resources for a cross-
functional team to study the problem
Data based decision making - the team develops a survey to get data from
customers who are repeat patrons. An additional survey is used to get data
from customers who are not satisfied and therefore not repeat customers.
Collaboration – the team analyzes the data and collectively develop
strategies that are likely to increase repeat customer visits.
Process focus - the team develops operational processes that based on the
information gleaned from the previous steps

52
Limitations of the Research:
The limitations of this study were that it only took place in one organization. As such, it
is difficult to generalize the results of the project because only one organization and one
industry was studied. However, the benefit of studying one organization is the depth at which
the organization can be studied which was a goal of this dissertation project.
Implications for Practice:
The major takeaway from this project is that any organization, of any size or any industry
can increase the quality climate of the organization by intensely focusing on a minimal number
of high impact factors. The number of factors is important especially in the small to medium
enterprise (SME) world because one of the primary inhibitors of quality management adoption
has been the deluge of information, practices, methodologies or factors that some SMEs may
experience when first beginning the quality management journey. Other factors may be
important, and future research projects should explore that topic, but an organization is sure to
experience some measure of improved operational and financial success if the improvement
project is supported by top management, uses data to make decisions, collaborates cross
functionally and is process focused.

53
Future Research
As a result of this study, three potential future research projects may be of interest.
1. Broaden the scope of this project and conduct this type of project for a larger number of
SMEs which would generate a broader data range to evaluate.
2. Validate that the factors chosen for this project are indeed the most impactful factors for a
SME through the use of a survey. Could there be other factors that are potentially more
impactful?
3. How can a SME sustain a quality management climate?

54
Conclusions
The focus of this project was to answer the question of how a small to medium sized
enterprise (SME) built a quality management climate. It explored the strengths and weaknesses
of SMEs in general, considered critical to success factors as well as common barriers to
implementation. The project reflected on both potential enablers and inhibitors and the
contextual factors for such an operation. A quality management climate was gradually
implemented with the focus on the four key factors of top management commitment,
collaboration, data centered decision-making and a process focus. It used Lewin’s action
research method as the research methodology. In Intervention 1 the project demonstrated that a
significant financial improvement could be made using tools that exhibited the four key factors.
However, the team discovered that when a substantial change takes place a robust training
system is needed to ensure that the change takes hold and behavior does not regress. The design
and implementation of the improved training system was the focus of Intervention two.
Ultimately, both interventions resulted in increased performance for the organization and
improved the quality management climate.
The limitations of this study were that it only took place in one organization. However,
the research team does believe that the findings from this project could be generalizable for a
number of organizations. More succinctly, if SMEs focused on the factors of top management
commitment, collaboration, data centered decision-making and process focus then some measure
of operational or financial improvement is likely to follow. However, the results may not be as
significant as noted in these findings.

55
References
Abdullah, A. (2010). Measuring TQM implementation: A case study of Malaysian SMEs.
Measuring Business Excellence, 14(3), 3-15.
Ahire, S. L., & Golhar, D. Y. (1996). Quality management in large vs small firms.
Journal of small business management, 34(2), 1.
Aldowaisan, T. A., & Youssef, A. S. (2006). An ISO 9001: 2000-based framework for
realizing quality in small businesses. Omega, 34(3), 231-235.
Antony, J., Kumar, M., & Madu, C. N. (2005). Six sigma in small- and medium-sized UK
manufacturing enterprises: Some empirical observations. The International Journal of Quality
& Reliability Management, 22(8), 860-874.
Antony, J., Kumar, M., & Labib, A. (2008). Gearing Six Sigma into UK manufacturing SMEs:
results from a pilot study. Journal of the Operational Research Society, 59(4), 482-493.
Appiah Fening, F., Pesakovic, G., & Amaria, P. (2008). Relationship between quality
management practices and the performance of small and medium size enterprises (SMEs) in
Ghana. International Journal of Quality & Reliability Management, 25(7), 694-708.
Azzone, G., & Cainarca, G. C. (1993). The strategic role of quality in small size firms. Small
Business Economics, 5(1), 67-76.
Assarlind, M., & Gremyr, I. (2016). Initiating quality management in a small company.
TQM Journal, 28(2), 166-179.
Beheshti, H., & Lollar, J. (2003). An empirical study of US SMEs using TQM. Total
Quality Management & Business Excellence, 14(8), 839-847.

56
Bishop, T. (2018). How to build quality management in a small to medium enterprise?
Muma Business Review, (In Process)
Briscoe, J. A., Fawcett, S. E., & Todd, R. H. (2005). The implementation and impact of ISO
9000 among small manufacturing enterprises. Journal of Small Business Management,
43(3), 309-330.
Chittenden, F., Poutziouris, P., & Mukhtar, S. (1998). Small firms and the ISO 9000
approach to quality management. International Small Business Journal, 17(1), 73-88.
Claver, E., & Tarí, J. J. (2008). The individual effects of total quality management on
customers, people and society results and quality performance in SMEs. Quality and
Reliability Engineering International, 24(2), 199-211.
Crosby, P. B. (1979). Quality is free: The art of making quality certain. New York:
McGraw- Hill.
del Alonso-Almeida, M. M., Bagur-Femenías, L., & Llach, J. (2015). The adoption of quality
management practices and their impact on business performance in small service companies: the
case of Spanish travel agencies. Service Business, 9(1), 57-75.
Deming, W. E. (1986). Out of the crisis. Cambridge, Mass: Massachusetts Institute
of Technology, Center for Advanced Engineering Study.
Demirbag, M., Lenny Koh, S. C., Tatoglu, E., & Zaim, S. (2006a). TQM and market
orientation's impact on SMEs' performance. Industrial Management & Data Systems, 106(8),
1206-1228.
Demirbag, M., Tatoglu, E., Tekinkus, M., & Zaim, S. (2006b). An analysis of the relationship
between TQM implementation and organizational performance: evidence from Turkish SMEs.
Journal of manufacturing technology management, 17(6), 829-847.
57
Eisen, H., Mulraney, B. J., & Sohal, A. S. (1992). Impediments to the adoption of modern
quality management practices. International Journal of Quality & Reliability Management, 9(5).
Gadenne, D., & Sharma, B. (2009). An investigation of the hard and soft quality management
factors of Australian SMEs and their association with firm performance. International Journal of
Quality & Reliability Management, 26(9), 865-880.
Ghobadian, A., & Gallear, D. N. (1996). Total quality management in SMEs. Omega, 24(1), 83.
Ghobadian, A., & Gallear, D. (1997). TQM and organization size. International Journal of
Operations & Production Management, 17(2), 121.
Goh, P. L., & Ridgway, K. (1994). The implementation of total quality management in small
and medium-sized manufacturing companies. The TQM magazine, 6(2), 54-60.
Gummesson, E. (2000). Qualitative methods in management research. Sage.
Gunasekaran, A., Okko, P., Martikainen, T., & Yli-Olli, P. (1996). Improving productivity
and quality in small and medium enterprises: cases and analysis. International Small Business
Journal, 15(1), 59-72.
Hansson, J., & Klefsjö, B. (2003). A core value model for implementing total
quality management in small organisations. The TQM Magazine, 15(2), 71-81.
Hendricks, K. B., & Singhal, V. R. (1999). Don't count TQM out. Quality progress, 32(4), 35.
Heras-Saizarbitoria, I., & Boiral, O. (2015). Symbolic adoption of ISO 9000 in small and
medium-sized enterprises: The role of internal contingencies. International Small
Business Journal, 33(3), 299-320.
Hu, Q., Mason, R., Williams, S. J., & Found, P. (2015). Lean implementation within SMEs:
A literature review. Journal of Manufacturing Technology Management, 26(7), 980-1012.

58
Husband and, P. M. (1999). A conceptual model for quality integrated management in small and
medium size enterprises. The International Journal of Quality & Reliability Management, 16(7),
699-713
Hussain, A., Ahmad, Q. W., Haq, I. U., Nazir, A., Imran, S., & Islam, B. U. (2015). Improving
Productivity and Quality in SMEs of Pakistan: A case study. Technical Journal, 20(2), 103-
114.
Isa, M. R., Zaroog, O. S., Sivabalan, A., & Raju, L. (2016). Survey on Total Quality
Management in Small and Medium Manufacturing Industries in Shah Alam. General
Machinery, 9(15.8), 15-8.
Ismail Salaheldin, S. (2009). Critical success factors for TQM implementation and their impact
on performance of SMEs. International journal of productivity and performance management,
58(3), 215-237.
Jaffrey, S. H. (2004). ISO 9001 made easy. Quality Progress, 37(5), 104.
Juran, J. M., & Godfrey, A. B. (1999). Juran's quality handbook. New York: McGraw Hill.
Krueger, T. M., & Wrolstad, M. A. (2013). Is It a Good Investment Strategy to Invest in
Malcolm Baldrige Award Winners?: An Update. Journal of Finance, 12, 1-15.
Kumar, M., & Antony, J. (2008). Comparing the quality management practices in UK SMEs.
Industrial Management & Data Systems, 108(9), 1153-1166.
Kumar, M., Antony, J., & Tiwari, M. K. (2011). Six Sigma implementation framework
for SMEs–a roadmap to manage and sustain the change. International Journal of
Production Research, 49(18), 5449-5467.

59
Kumar, M. (2007). Critical success factors and hurdles to Six Sigma implementation: the case of
a UK manufacturing SME. International Journal of Six Sigma and Competitive Advantage, 3(4),
333-351.
Kuratko, D. F., Goodale, J. C., & Hornsby, J. S. (2001). Quality practices for a
competitive advantage in smaller firms. Journal of Small Business Management, 39(4),
293-311.
Kwamega, M., Li, D., & Ntiamoah, E. B. (2015). Role of Total Quality Management (TQM) as
a Tool for Performance Measurement in Small and Medium-sized Enterprise (SME’S) in
Ghana. British Journal of Economics, Management & Trade, 10(3), 1-10.
Lee, G. L. (1995). The 'pros' and 'cons' of total quality management for smaller firms in
manufacturing: some experiences down the supply chain. Total Quality Management, 6(4),
413- 426.
Lee, C. Y. (1998). Quality management by small manufacturers in Korea: An exploratory study.
Journal of Small Business Management, 36(4), 61-67.
Lee, C. Y. (2004). TQM in small manufacturers: an exploratory study in China.
International Journal of Quality & Reliability Management, 21(2), 175-197.
Lee, C. Y. (2004). Perception and development of total quality management in small
manufacturers: An exploratory study in China. Journal of Small Business Management,
42(1), 102-115.
Lewin, K. (1947). Frontiers in group dynamics: Concept, method and reality in social science;
social equilibria and social change. Human relations, 1(1), 5-41.
Lewin, K. (1946). Action research and minority problems. Journal of social issues, 2(4), 34-46.
Leonard, D., & McAdam, R. (2003). Quality's six life cycle stages. Quality progress, 36(8), 50.

60
Lewis, W. G., Pun, K. F., & Lalla, T. R. M. (2006). Exploring soft versus hard factors for TQM
implementation in small and medium-sized enterprises. International Journal of productivity
and performance management, 55(7), 539-554.
Majumdar, J. P., & Manohar, B. M. (2016). Why Indian manufacturing SMEs are still
reluctant in adopting total quality management. International Journal of Productivity and
Quality Management, 17(1), 16-35.
Malik, S. A., Iqbal, M. Z., Shaukat, R. A. Z. I. A., & Yong, J. (2010). TQM practices
& organizational performance: evidence from Pakistani SMEs. International Journal
of Engineering & Technology, 10(4), 26-31.
McAdam, R., Antony, J., Kumar, M., & Hazlett, S. A. (2014). Absorbing new knowledge in
small and medium-sized enterprises: A multiple case analysis of Six Sigma. International
Small Business Journal, 32(1), 81-109.
McAdam, R. (2000). Quality models in an SME context A critical perspective using a
grounded approach. The International Journal of Quality & Reliability Management, 17(3),
305-323.
Mendes, L., & Lourenço, L. (2014). Factors that hinder quality improvement programs'
implementation in SME. Journal of Small Business and Enterprise Development, 21(4),
690- 715.
Mo, J. P., & Chan, A. M. (1997). Strategy for the successful implementation of ISO 9000
in small and medium manufacturers. The TQM magazine, 9(2), 135-145.
Murphy, W. H. (2016a). Small and mid-sized enterprises (SMEs) quality management (QM)
research (1990–2014): a revealing look at QM's vital role in making SMEs stronger. Journal
of Small Business & Entrepreneurship, 28(5), 345-360.

61
Murphy, W. H., & Leonard, D. (2016b). Quality management (QM) leads to healthier small
businesses. Journal of Small Business and Enterprise Development, 23(4), 1104-1119.
Nguyen, D. M. (2015). A new application model of lean management in small and medium
sized enterprises.
O’Neill, P., Sohal, A., & Teng, C. W. (2016). Quality management approaches and their
impact on firms׳ financial performance–An Australian study. International Journal of
Production Economics, 171, 381-393.
Ostroff, C., Kinicki, A. J., & Muhammad, R. S. (2012). Organizational culture and climate. In I.
B. Weiner (Ed.), Handbook of Psychology, Second Edition (Vol. 12, pp. 643-676). Hoboken,
NJ: John Wiley.
Parkin, M. A., & Parkin, R. (1996). The impact of TQM in UK SMEs. Industrial Management
& Data Systems, 96(4), 6-10.
Pinho, J. (2008). TQM and performance in small medium enterprises: The mediating effect of
customer orientation and innovation. International journal of quality & reliability
management, 25(3), 256-275.
Price, M. J., & Chen, E. E. (1993). Total quality management in a small, high-technology
company. California Management Review, 35(3), 96-117.
Prater, E., & Ghosh, S. (2005). Current Operational Practices of US Small and Medium‐Sized
Enterprises in Europe. Journal of Small Business Management, 43(2), 155-169.
Quazi, H. A., & Padibjo, S. R. (1998). A journey toward total quality management through
ISO 9000 certification-a study on small-and medium-sized enterprises in Singapore.
International Journal of Quality & Reliability Management, 15(5), 489-508.

62
Rahman, S. U. (2001a). A comparative study of TQM practice and organizational performance
of SMEs with and without ISO 9000 certification. International Journal of Quality &
Reliability Management, 18(1), 35-49.
Rahman, S. U. (2001b). Total quality management practices and business outcome:
Evidence from small and medium enterprises in Western Australia. Total Quality
Management, 12(2), 201-210.
Rapoport, R. N. (1970). Three dilemmas in action research: with special reference to the
Tavistock experience. Human relations, 23(6), 499-513.
Robert, C., Probst, T. M., Martocchio, J. J., Drasgow, F., & Lawler, J. J. (2000). Empowerment
and continuous improvement in the United States, Mexico, Poland, and India: Predicting fit on
the basis of the dimensions of power distance and individualism. Journal of applied psychology,
85(5), 643.
Sainis, G., Haritos, G., Kriemadis, A., & Fowler, M. (2016). The willingness of ISO
certified Greek SMEs to continue their quality journey to TQM under crisis conditions: a
systemic approach. International Journal of Applied Systemic Studies, 6(4), 327-348.
Šatanová, A., Závadský, J., Sedliačiková, M., Potkány, M., Závadská, Z., & Holíková, M.
(2015). How Slovak small and medium manufacturing enterprises maintain quality costs: an
empirical study and proposal for a suitable model. Total quality management & business
excellence, 26(11-12), 1146-1160.
Shea, J., & Gobeli, D. (1995). TQM: The experiences of ten small businesses. Business
Horizons, 38(1), 71.

63
Sila, I., & Ebrahimpour, M. (2002). An investigation of the total quality management survey
based research published between 1989 and 2000: A literature review. International Journal of
Quality & Reliability Management, 19(7), 902-970.
Sinha, N., Garg, A. K., & Dhall, N. (2016). Effect of TQM principles on performance of Indian
SMEs: the case of automotive supply chain. The TQM Journal, 28(3), 338-359.
Sıtkı İlkay, M., & Aslan, E. (2012). The effect of the ISO 9001 quality management system on
the performance of SMEs. International Journal of Quality & Reliability Management, 29(7),
753-778.
Sousa, R., & Voss, C. A. (2001). Quality management: Universal or context dependent?
Production and Operations Management, 10(4), 383-404.
Sousa-Mendes, G. H. D., Gomes-Salgado, E., & Moro-Ferrari, B. E. (2016). Prioritization of
TQM practices in Brazilian medical device SMEs using Analytical Hierarchy Process (AHP).
Dyna, 83(197), 194-202.
Sun, H., & Cheng, T. K. (2002). Comparing reasons, practices and effects of ISO 9000
certification and TQM implementation in Norwegian SMEs and large firms. International
Small Business Journal, 20(4), 421-442.
Susman, G. I., & Evered, R. D. (1978). An assessment of the scientific merits of action
research. Administrative science quarterly, 582-603
Talib, F., Rahman, Z., & Qureshi, M. N. (2013). An empirical investigation of relationship
between total quality management practices and quality performance in Indian service
companies. The International Journal of Quality & Reliability Management, 30(3), 280-318.
Temtime, Z. T., & Solomon, G. H. (2002). Total quality management and the planning behavior
of SMEs in developing economies. The TQM magazine, 14(3), 181-191.

64
Teixeira, H. N., Lopes, I., & Sousa, S. (2015). Prioritizing quality problems in SMEs: a
methodology. The TQM Journal, 27(1), 2-21.
United States Small Business Profile. (2018). Retrieved from
https://www.sba.gov/sites/default/files/advocacy/United_States.pdf
Valmohammadi, C. (2011). The impact of TQM implementation on the organizational
performance of Iranian manufacturing SMEs. The TQM Journal, 23(5), 496-509.
Van de Ven, A. H. (2007). Engaged scholarship: A guide for organizational and social
research. Oxford University Press on Demand.
Wanjau, K. L., Gakure, R. W., Magutu, P. O., & Kahiri, J. (2013). The Role Of Quality
Adoption In Growth And Management Of Small & Medium Enterprises In Kenya.
European Scientific Journal, ESJ, 9(7).
Welsh, J.A. and White, J.F. (1981), “A small business is not a little big business”, Harvard
Business Review, Vol. 59 No. 4, pp. 18-27.
Westcott, R. T. (Ed.). (2013). The certified manager of quality/organizational excellence
handbook. ASQ Quality Press.
What We Do. (2018). Retrieved from http://asqservicequality.org/what-we-do/
Wiele, T. V. D., & Brown, A. (1998). Venturing Down the TOM Path for SME's.
International Small Business Journal, 16(2), 50-68.
Yusof, S. R. M., & Aspinwall, E. (1999). Critical success factors for total quality
management implementation in small and medium enterprises. Total Quality Management,
10(4-5), 803-809.
Yusof, S. R. M., & Aspinwall, E. M. (2000). Critical success factors in small and medium
enterprises: survey results. Total quality management, 11(4-6), 448-462.

65
Zhou, B. (2016). Lean principles, practices, and impacts: a study on small and medium-sized
enterprises (SMEs). Annals of Operations Research, 241(1-2), 457-474.
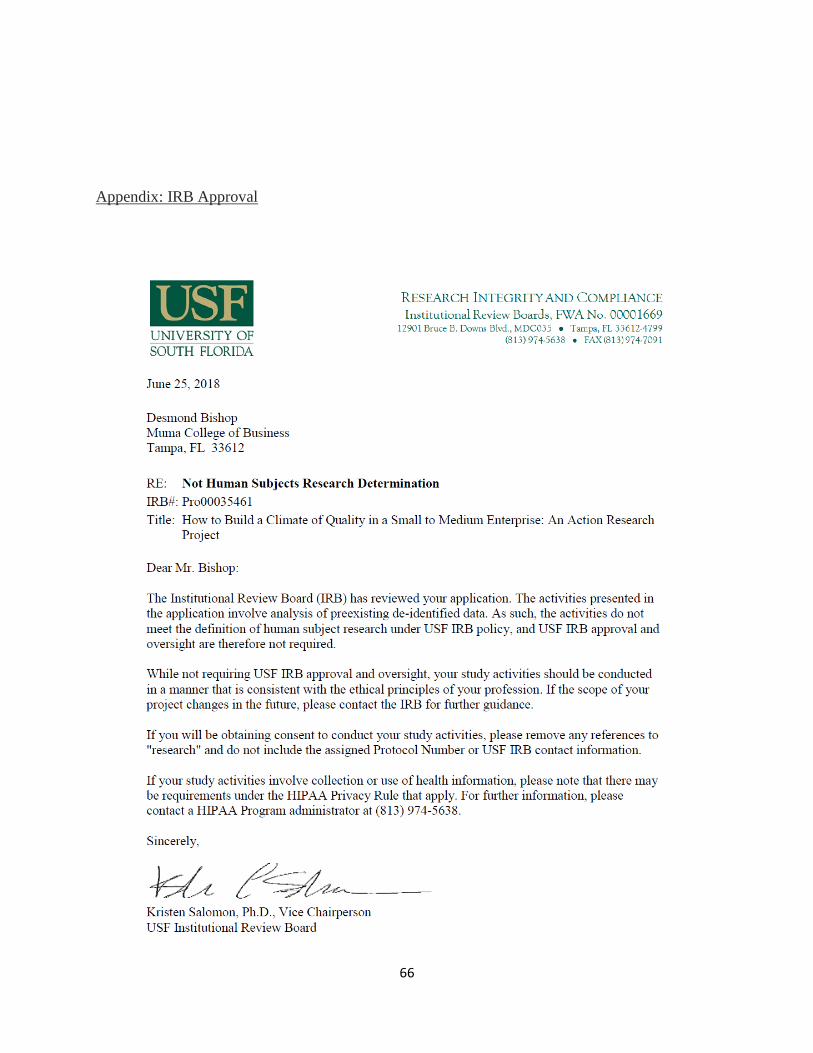
66
Appendix: IRB Approval