Embed Size (px)
Citation preview
Financial planning and financial modelling
How to Build a Corporate ImmuneSystem in Response to COVID-19
29/04/ 2020

2EaSI Technical Assistance to the European Microcredit Sector
Webinar house keeping rules
European Code of Good
Conduct
Capacity Building
The webinar is recorded
It will be available at mfc.org.pl
•Please switch off yourwebcam
•Please swith off your microphoneduring the presentation
•Please write your questions in the chatbox

3EaSI Technical Assistance to the European Microcredit Sector
Programme Snapshot 2020
EaSI Technical Assistance to the European Microcredit Sector
European Commission
DG Employment, Social Affairs and Inclusion
This project has received financial support from the European Union Programme for Employment and Social Innovation "EaSI" (2014-2020).
4EaSI Technical Assistance to the European Microcredit Sector
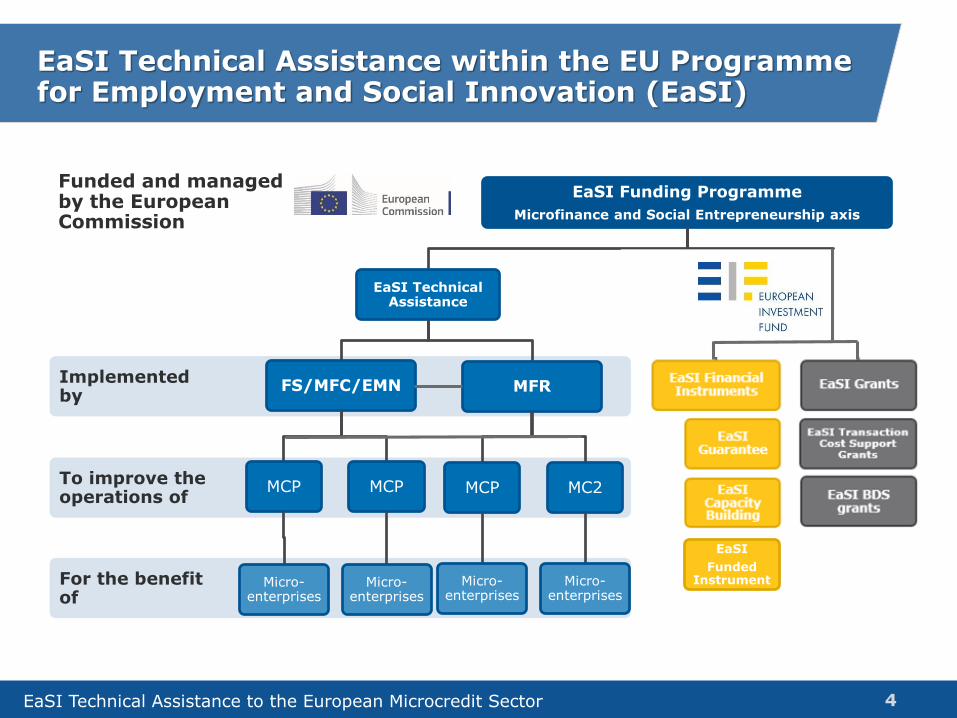
For the benefit of
To improve the operations of
Implemented by
Funded and managed by the European Commission
EaSI Funding Programme
Microfinance and Social Entrepreneurship axis
EaSI Technical Assistance
FS/MFC/EMN
MCP
Micro-enterprises
MCP
Micro-enterprises
MFR
MCP
Micro-enterprises
MC2
Micro-enterprises
EaSI Financial Instruments
EaSI Grants
EaSI Technical Assistance within the EU Programme for Employment and Social Innovation (EaSI)
EaSI Guarantee
EaSI Capacity Building
EaSI Transaction Cost Support
Grants
EaSI BDS grants
EaSI
Funded Instrument
5EaSI Technical Assistance to the European Microcredit Sector
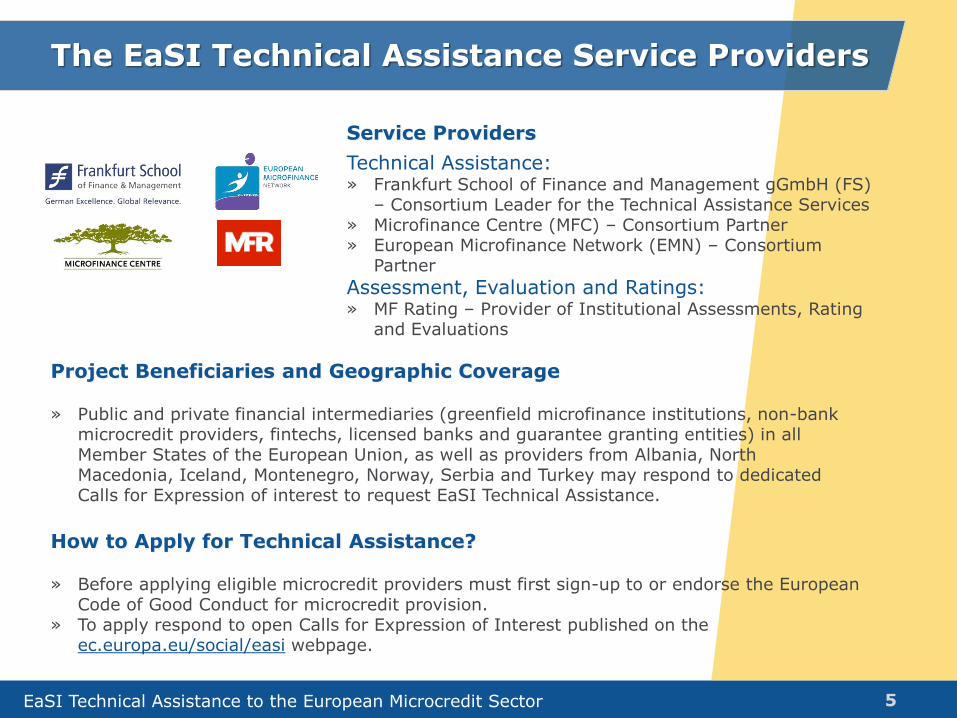
The EaSI Technical Assistance Service Providers
Service Providers
Technical Assistance:» Frankfurt School of Finance and Management gGmbH (FS)
– Consortium Leader for the Technical Assistance Services» Microfinance Centre (MFC) – Consortium Partner» European Microfinance Network (EMN) – Consortium
Partner
Assessment, Evaluation and Ratings:» MF Rating – Provider of Institutional Assessments, Rating
and Evaluations
Project Beneficiaries and Geographic Coverage
» Public and private financial intermediaries (greenfield microfinance institutions, non-bank microcredit providers, fintechs, licensed banks and guarantee granting entities) in all Member States of the European Union, as well as providers from Albania, NorthMacedonia, Iceland, Montenegro, Norway, Serbia and Turkey may respond to dedicated Calls for Expression of interest to request EaSI Technical Assistance.
How to Apply for Technical Assistance?
» Before applying eligible microcredit providers must first sign-up to or endorse the European Code of Good Conduct for microcredit provision.
» To apply respond to open Calls for Expression of Interest published on the ec.europa.eu/social/easi webpage.
6EaSI Technical Assistance to the European Microcredit Sector
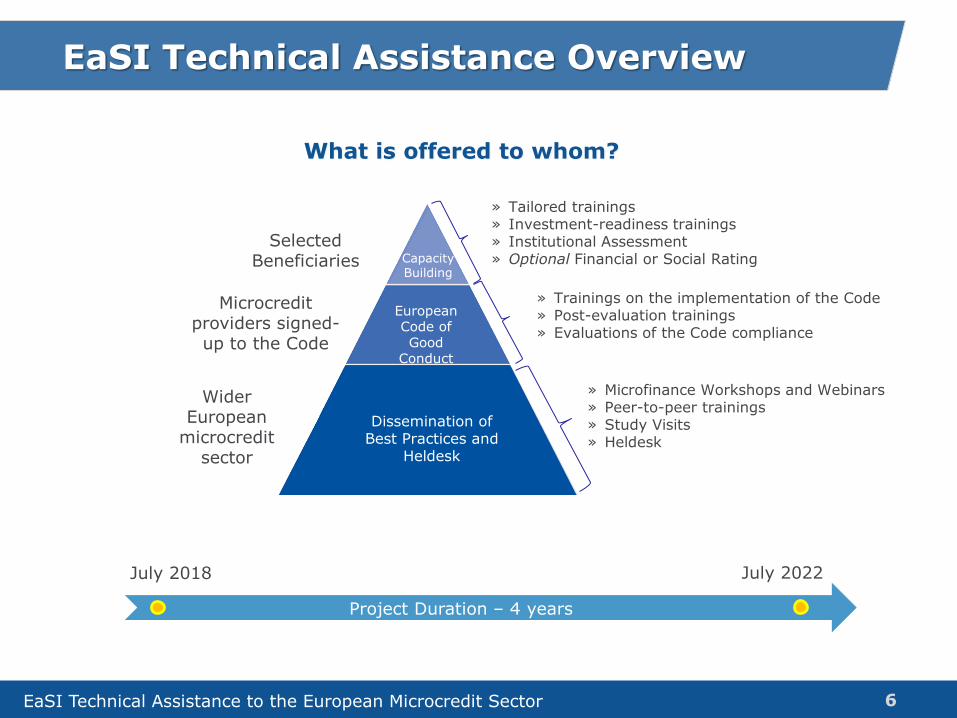
EaSI Technical Assistance Overview
July 2018
Project Duration – 4 years
What is offered to whom?
July 2022
Selected Beneficiaries
Wider European
microcredit sector
Microcredit providers signed-up to the Code
Dissemination of Best Practices and
Heldesk
European Code of Good
Conduct
Capacity Building
» Tailored trainings » Investment-readiness trainings» Institutional Assessment » Optional Financial or Social Rating
» Trainings on the implementation of the Code» Post-evaluation trainings» Evaluations of the Code compliance
» Microfinance Workshops and Webinars» Peer-to-peer trainings » Study Visits» Heldesk

For more information, about:
Technical Assistance, contact:[email protected]
Ratings and Evaluations, contact: [email protected]
The EaSI Programme, visit:ec.europa.eu/social/microfinance
EaSI Technical Assistance
This project has received financial support from the European Union Programme for Employment and Social Innovation "EaSI" (2014-2020).
The author of this presentation takes full responsibility for its contents. The opinions expressed do not necessarily reflect the view of the European Commission.

8EaSI Technical Assistance to the European Microcredit Sector
Artur Munteanu
Entrepreneur, Finance Executive and Enterprise Development Expert
Kinga Dąbrowska,
Programs Manager, MFC
Financial planning
EaSI Technical Assistance
Webinar 6
Artur Munteanu, MBA
29 April 2020, online Zoom
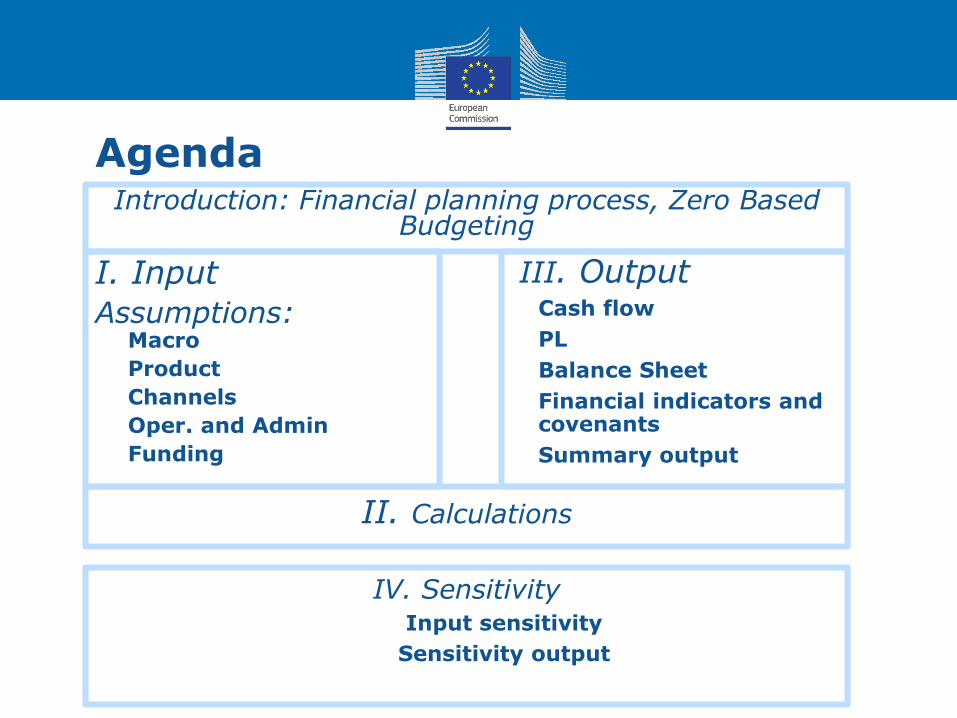
Agenda
I. Input
Assumptions:Macro
Product
Channels
Oper. and Admin
Funding
III. Output Cash flow
PL
Balance Sheet
Financial indicators and covenants
Summary output
Introduction: Financial planning process, Zero Based Budgeting
II. Calculations
IV. Sensitivity Input sensitivity
Sensitivity output
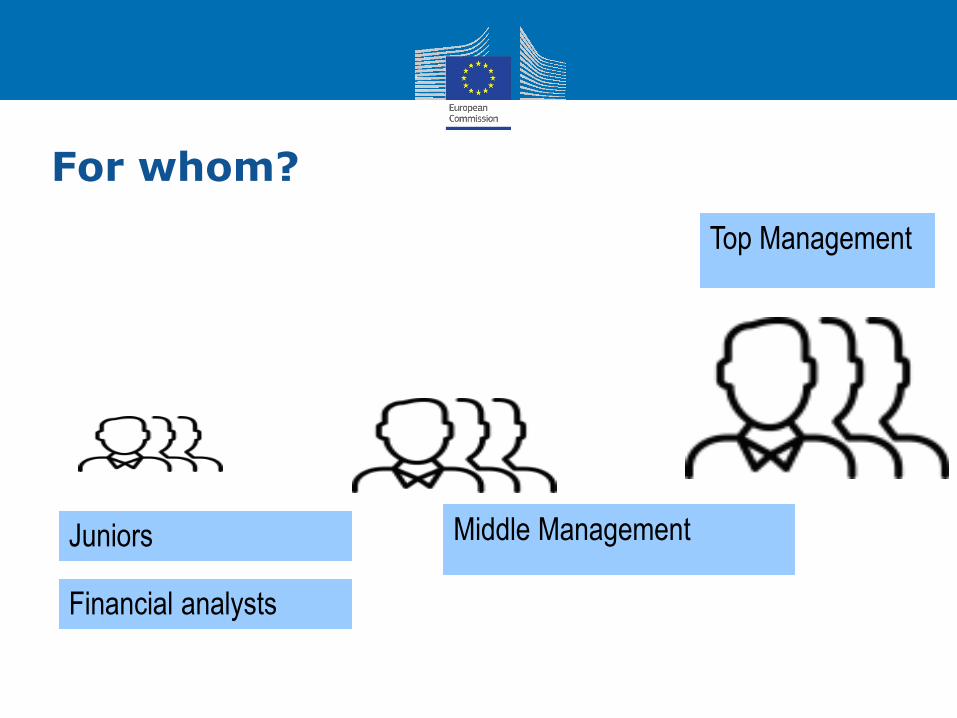
For whom?
Top Management
Middle Management Juniors
Financial analysts
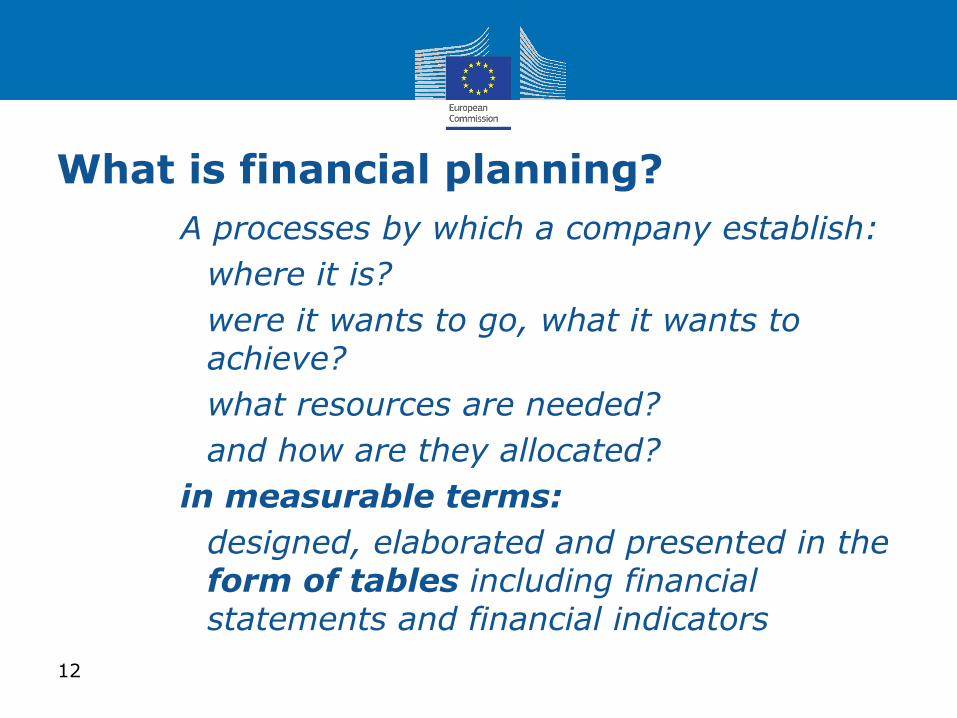
What is financial planning?
A processes by which a company establish:
o where it is?
o were it wants to go, what it wants to achieve?
o what resources are needed?
o and how are they allocated?
in measurable terms:
• designed, elaborated and presented in the form of tables including financial statements and financial indicators
12
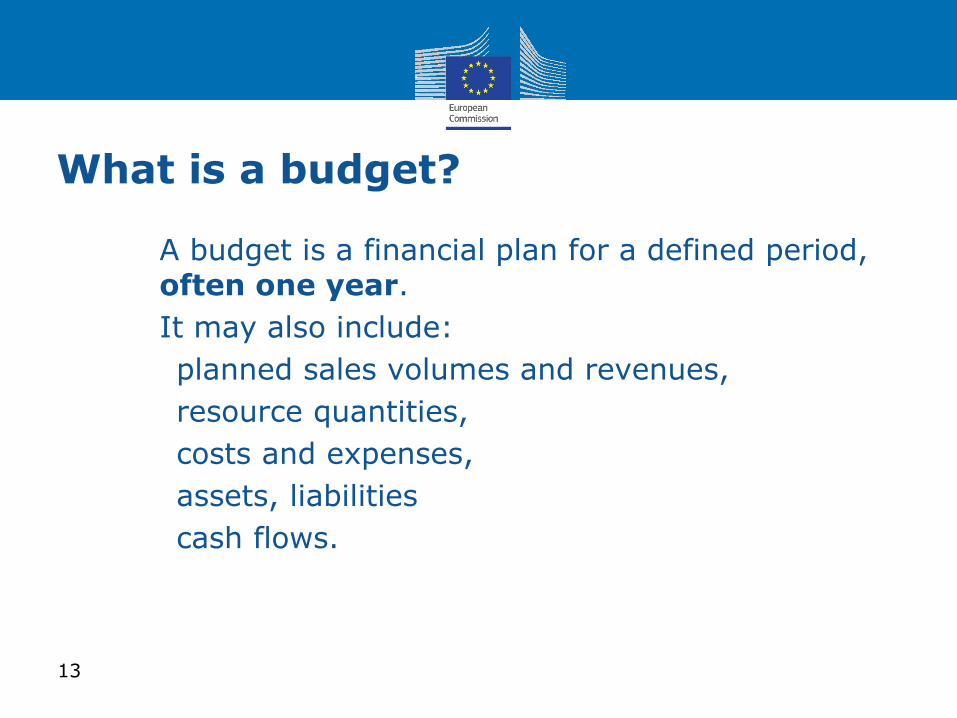
What is a budget?
A budget is a financial plan for a defined period, often one year.
It may also include:
planned sales volumes and revenues,
resource quantities,
costs and expenses,
assets, liabilities
cash flows.
13
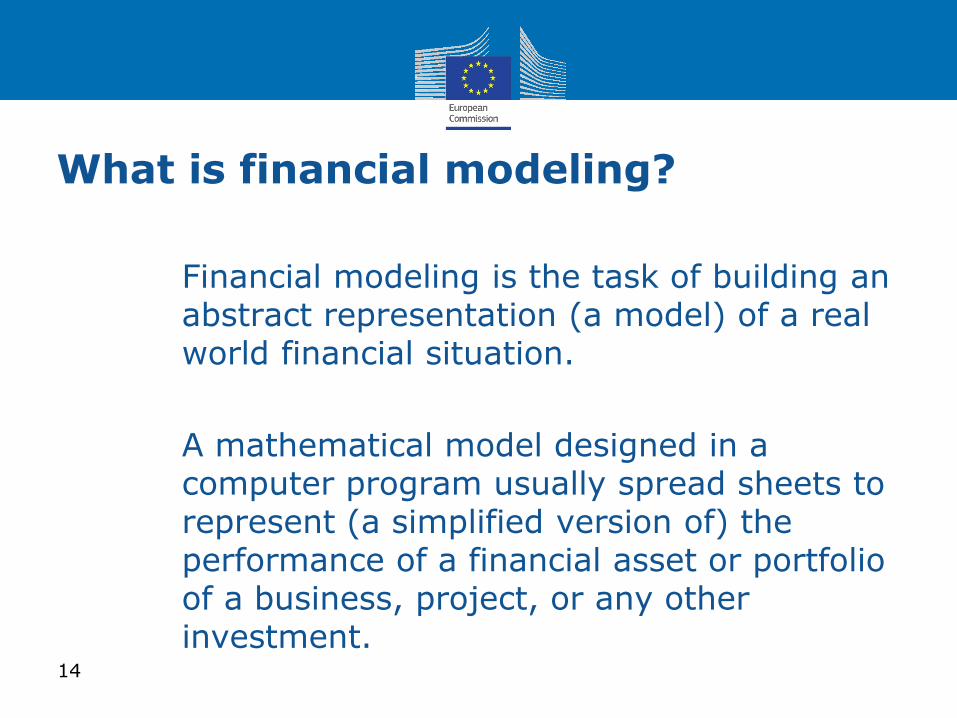
What is financial modeling?
• Financial modeling is the task of building an abstract representation (a model) of a real world financial situation.
• A mathematical model designed in a computer program usually spread sheets to represent (a simplified version of) the performance of a financial asset or portfolio of a business, project, or any other investment.
14

Financial planning process
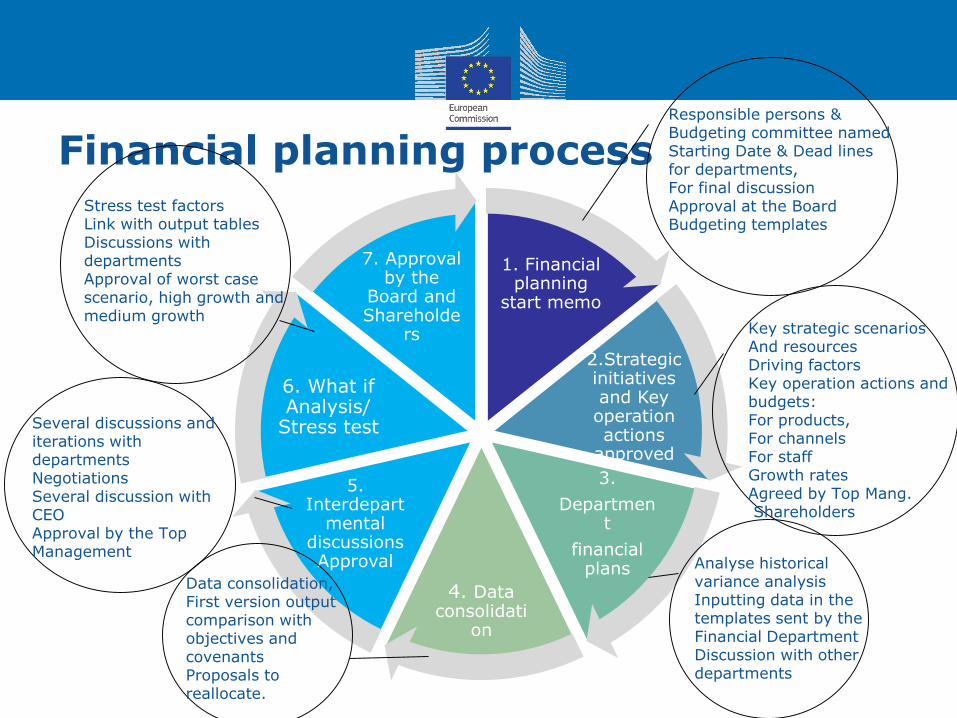
Financial planning process
1. Financial planning
start memo
2.Strategic initiatives and Key operation actions
approved
3.
Department
financial plans
4. Data consolidati
on
5. Interdepart
mental discussions Approval
6. What if Analysis/
Stress test
7. Approval by the
Board and Shareholde
rs
Analyse historical variance analysis Inputting data in the templates sent by the Financial DepartmentDiscussion with other departments
Data consolidation, First version output comparison with objectives and covenantsProposals to reallocate.
Key strategic scenariosAnd resources Driving factorsKey operation actions and budgets:For products, For channelsFor staffGrowth rates Agreed by Top Mang.Shareholders
Responsible persons &Budgeting committee namedStarting Date & Dead lines for departments, For final discussion Approval at the BoardBudgeting templates
Several discussions and iterations with departmentsNegotiations Several discussion with CEOApproval by the Top Management
Stress test factorsLink with output tablesDiscussions with departmentsApproval of worst case scenario, high growth and medium growth
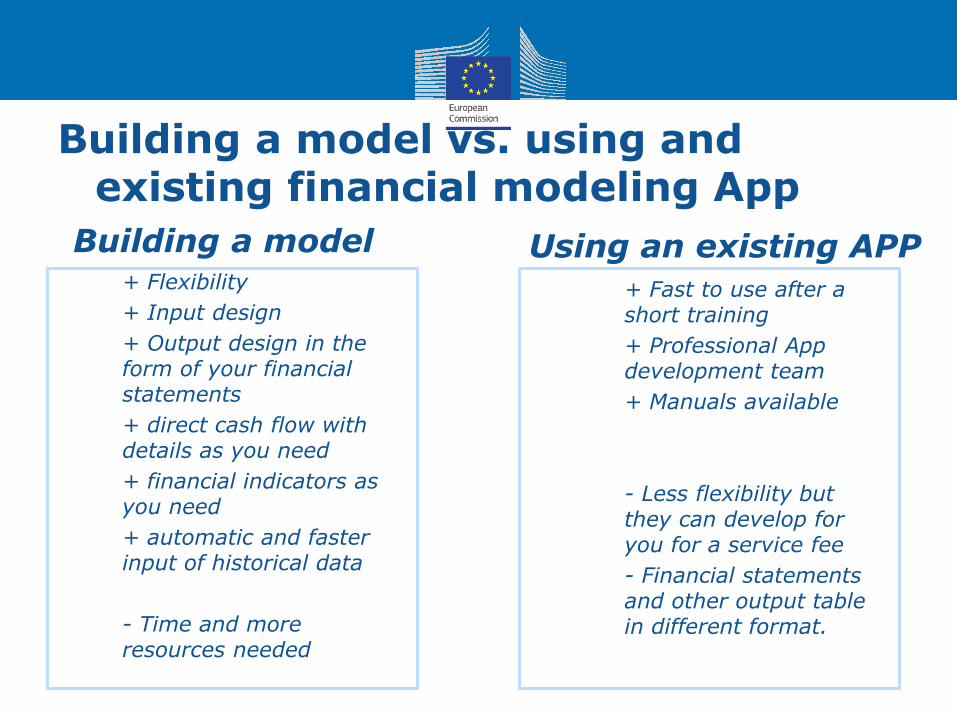
Building a model vs. using andexisting financial modeling App
Building a model• + Flexibility
• + Input design
• + Output design in the form of your financial statements
• + direct cash flow with details as you need
• + financial indicators as you need
• + automatic and faster input of historical data
• - Time and more resources needed
Using an existing APP
• + Fast to use after a short training
• + Professional App development team
• + Manuals available
• - Less flexibility but they can develop for you for a service fee
• - Financial statements and other output table in different format.
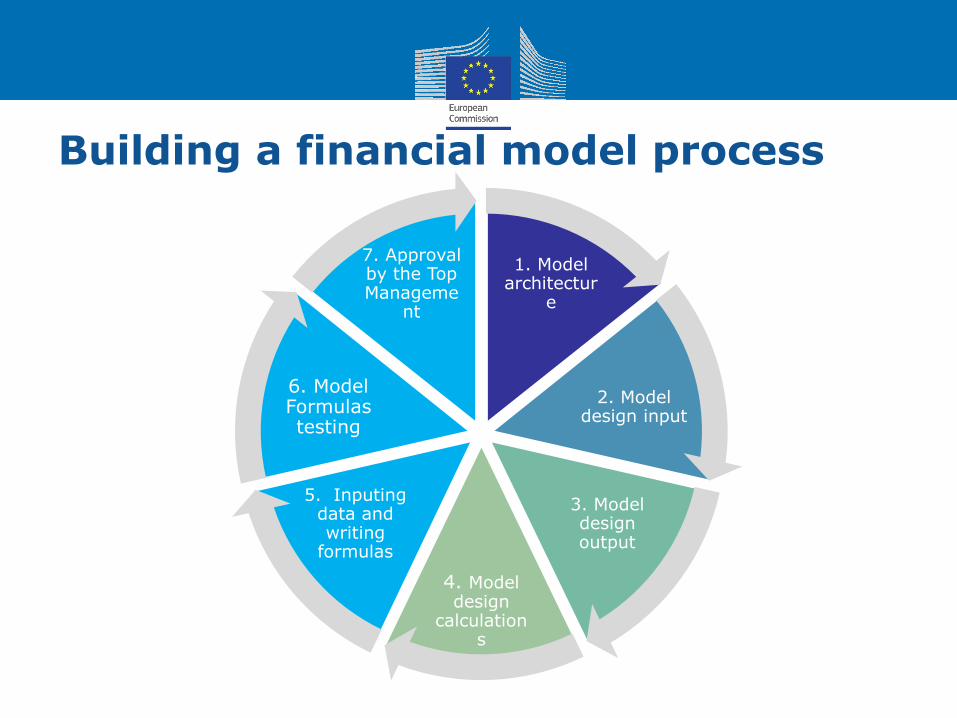
Building a financial model process
1. Model architectur
e
2. Model design input
3. Model design output
4. Model design
calculations
5. Inputingdata and writing
formulas
6. Model Formulas testing
7. Approval by the Top Manageme
nt
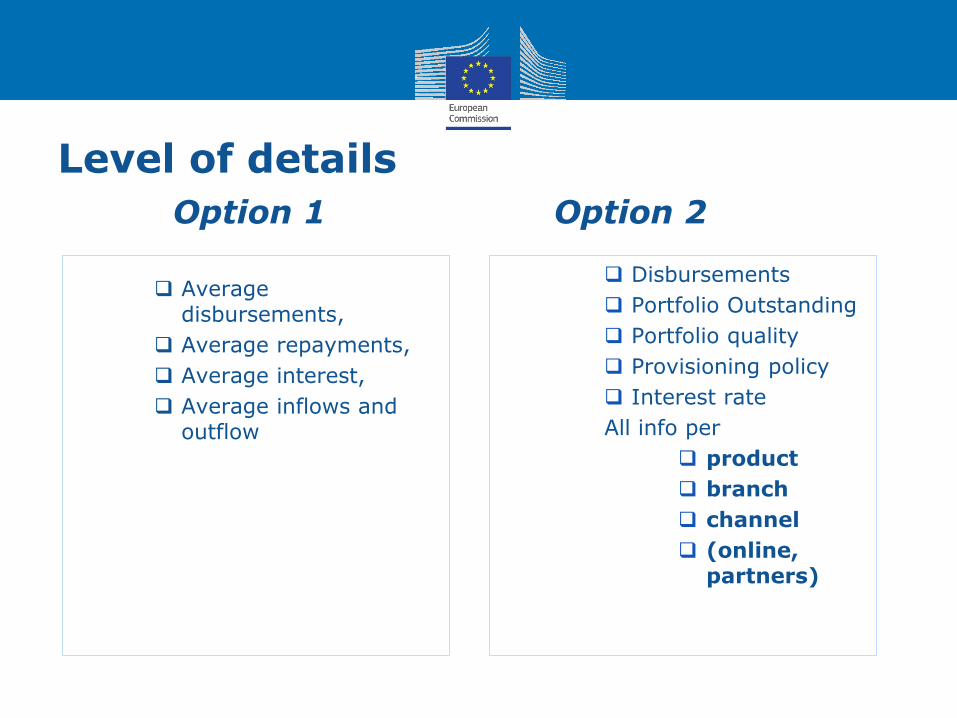
Level of details
1.
Disbursements
Portfolio Outstanding
Portfolio quality
Provisioning policy
Interest rate
All info per
product
branch
channel
(online, partners)
Option 2
Average disbursements,
Average repayments,
Average interest,
Average inflows and outflow
Option 1
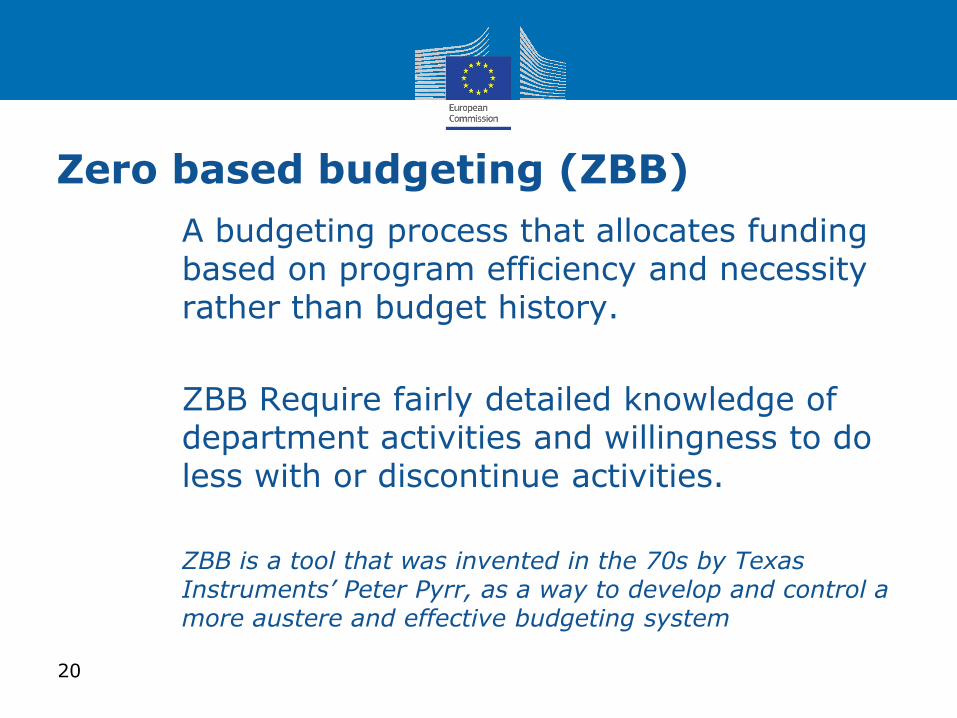
Zero based budgeting (ZBB)
• A budgeting process that allocates funding based on program efficiency and necessity rather than budget history.
• ZBB Require fairly detailed knowledge of department activities and willingness to do less with or discontinue activities.
• ZBB is a tool that was invented in the 70s by Texas Instruments’ Peter Pyrr, as a way to develop and control a more austere and effective budgeting system
20
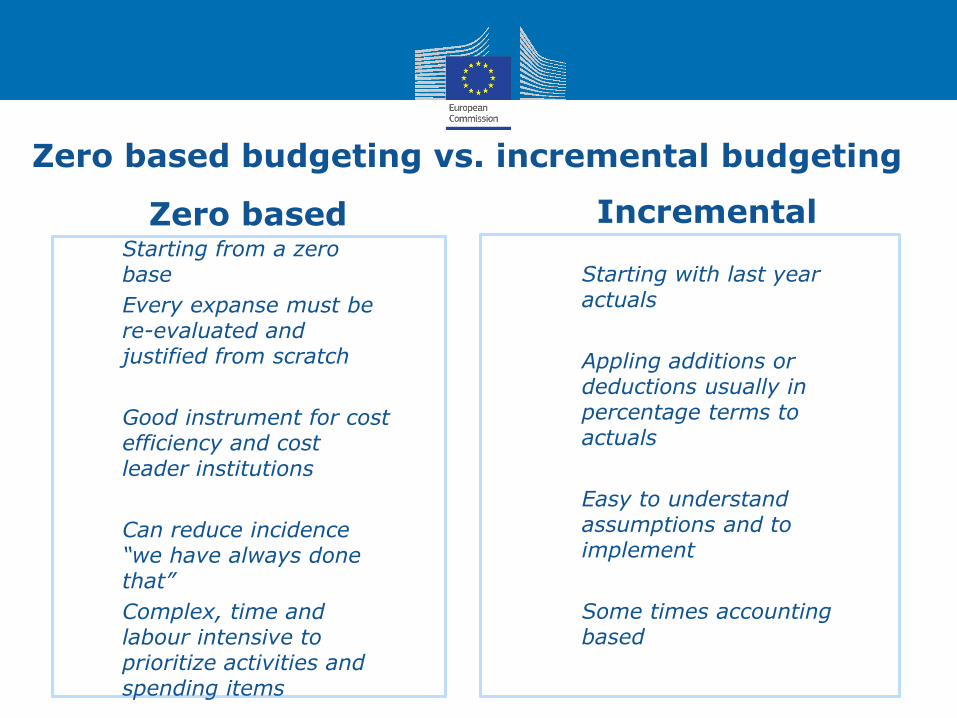
Zero based budgeting vs. incremental budgeting
Zero based• Starting from a zero
base
• Every expanse must be re-evaluated and justified from scratch
• Good instrument for cost efficiency and cost leader institutions
• Can reduce incidence “we have always done that”
• Complex, time and labour intensive to prioritize activities and spending items
Incremental
• Starting with last year actuals
• Appling additions or deductions usually in percentage terms to actuals
• Easy to understand assumptions and to implement
• Some times accounting based
In all companies - 10-25% cost reduction is possible
If all team members “like” your CFO and CEO then there is possibility to cut cost by 10-25%. Do team members hate Fin Department?
22
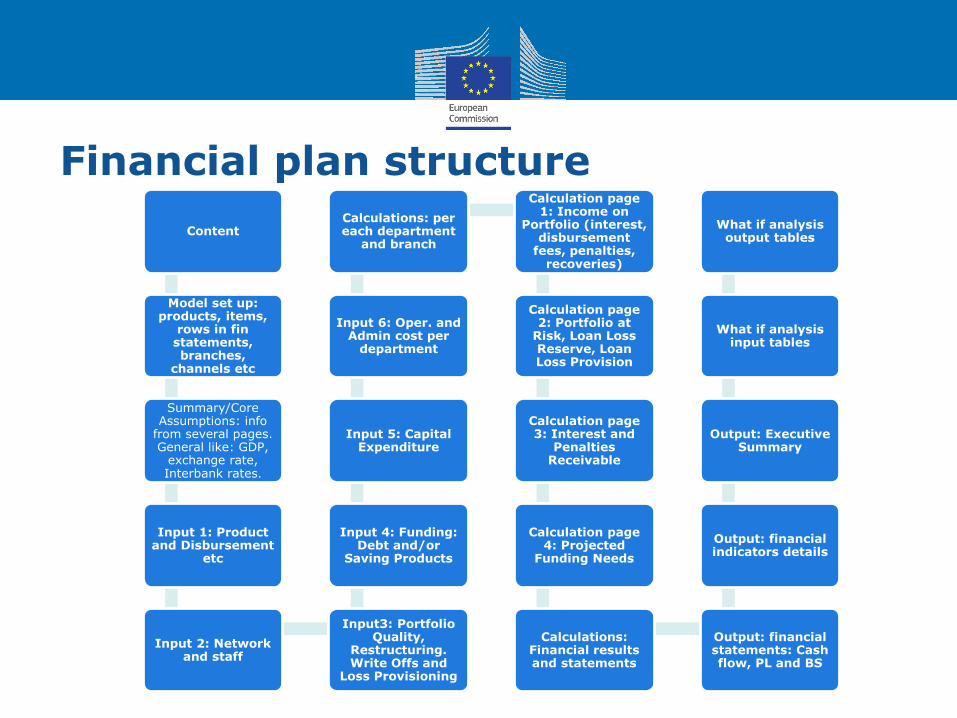
Financial plan structure
Content
Model set up: products, items,
rows in fin statements, branches,
channels etc
Summary/Core Assumptions: info
from several pages. General like: GDP,
exchange rate, Interbank rates.
Input 1: Product and Disbursement
etc
Input 2: Network and staff
Input3: Portfolio Quality,
Restructuring. Write Offs and
Loss Provisioning
Input 4: Funding: Debt and/or
Saving Products
Input 5: Capital Expenditure
Input 6: Oper. and Admin cost per
department
Calculations: per each department
and branch
Calculation page 1: Income on
Portfolio (interest, disbursement
fees, penalties, recoveries)
Calculation page 2: Portfolio at
Risk, Loan Loss Reserve, Loan Loss Provision
Calculation page 3: Interest and
Penalties Receivable
Calculation page 4: Projected
Funding Needs
Calculations: Financial results and statements
Output: financial statements: Cash flow, PL and BS
Output: financial indicators details
Output: Executive Summary
What if analysis input tables
What if analysis output tables
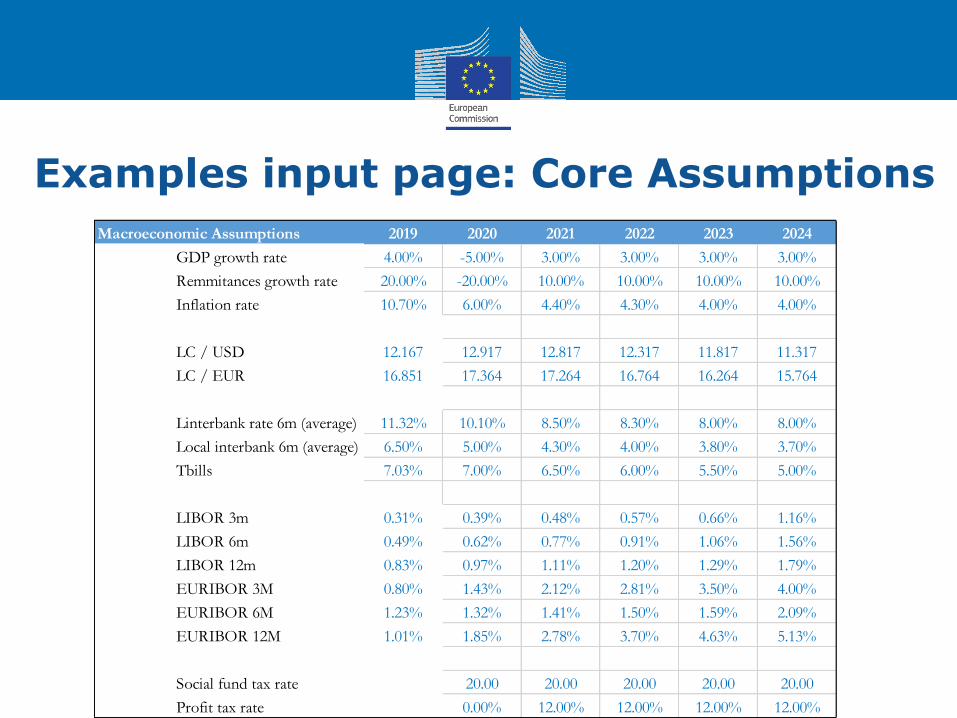
Examples input page: Core Assumptions
Macroeconomic Assumptions 2019 2020 2021 2022 2023 2024
GDP growth rate 4.00% -5.00% 3.00% 3.00% 3.00% 3.00%
Remmitances growth rate 20.00% -20.00% 10.00% 10.00% 10.00% 10.00%
Inflation rate 10.70% 6.00% 4.40% 4.30% 4.00% 4.00%
LC / USD 12.167 12.917 12.817 12.317 11.817 11.317
LC / EUR 16.851 17.364 17.264 16.764 16.264 15.764
Linterbank rate 6m (average) 11.32% 10.10% 8.50% 8.30% 8.00% 8.00%
Local interbank 6m (average) 6.50% 5.00% 4.30% 4.00% 3.80% 3.70%
Tbills 7.03% 7.00% 6.50% 6.00% 5.50% 5.00%
LIBOR 3m 0.31% 0.39% 0.48% 0.57% 0.66% 1.16%
LIBOR 6m 0.49% 0.62% 0.77% 0.91% 1.06% 1.56%
LIBOR 12m 0.83% 0.97% 1.11% 1.20% 1.29% 1.79%
EURIBOR 3M 0.80% 1.43% 2.12% 2.81% 3.50% 4.00%
EURIBOR 6M 1.23% 1.32% 1.41% 1.50% 1.59% 2.09%
EURIBOR 12M 1.01% 1.85% 2.78% 3.70% 4.63% 5.13%
Social fund tax rate 20.00 20.00 20.00 20.00 20.00
Profit tax rate 0.00% 12.00% 12.00% 12.00% 12.00%
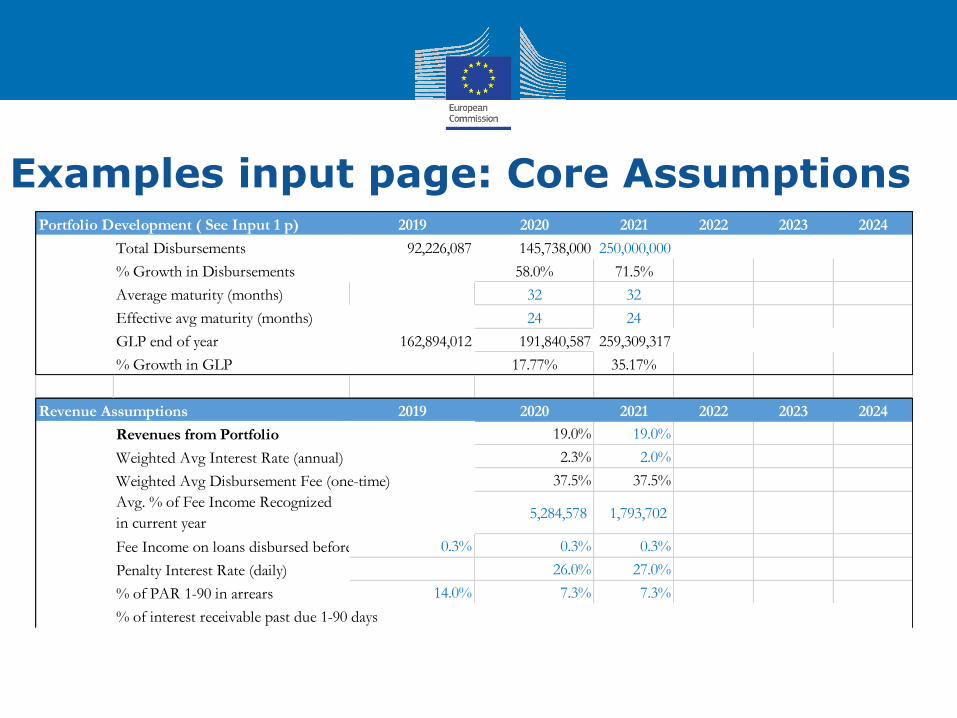
Examples input page: Core AssumptionsPortfolio Development ( See Input 1 p) 2019 2020 2021 2022 2023 2024
Total Disbursements 92,226,087 145,738,000 250,000,000
% Growth in Disbursements 58.0% 71.5%
Average maturity (months) 32 32
Effective avg maturity (months) 24 24
GLP end of year 162,894,012 191,840,587 259,309,317
% Growth in GLP 17.77% 35.17%
Revenue Assumptions 2019 2020 2021 2022 2023 2024
Revenues from Portfolio 19.0% 19.0%
Weighted Avg Interest Rate (annual) 2.3% 2.0%
Weighted Avg Disbursement Fee (one-time) 37.5% 37.5%
Avg. % of Fee Income Recognized
in current year5,284,578 1,793,702
Fee Income on loans disbursed before 2011 to be recognized0.3% 0.3% 0.3%
Penalty Interest Rate (daily) 26.0% 27.0%
% of PAR 1-90 in arrears 14.0% 7.3% 7.3%
% of interest receivable past due 1-90 days
Examples input page: Core Assumptions
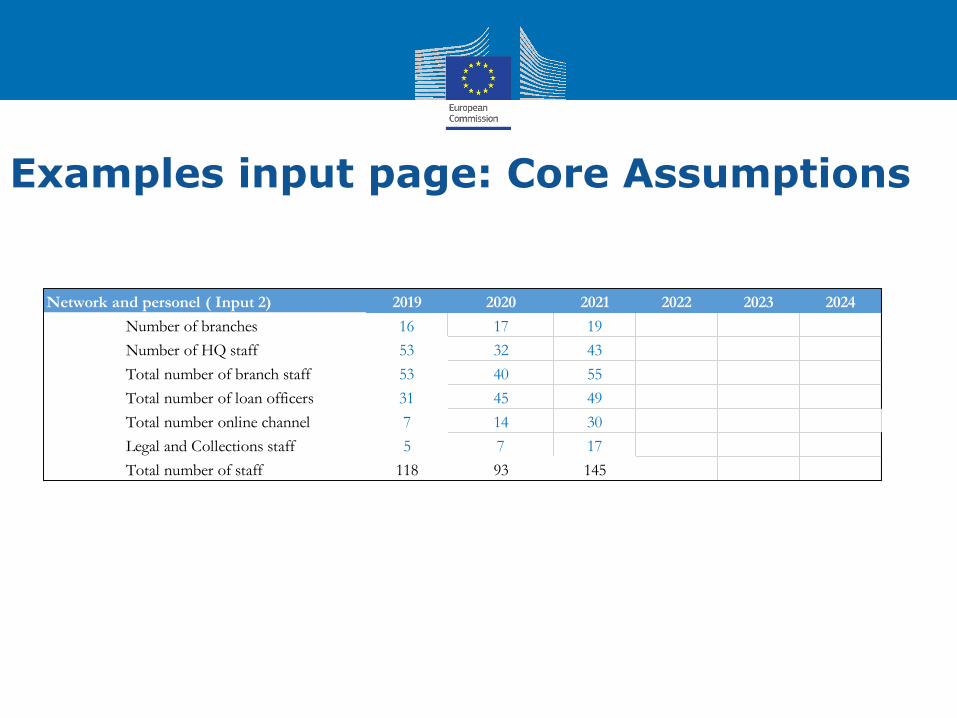
Network and personel ( Input 2) 2019 2020 2021 2022 2023 2024
Number of branches 16 17 19
Number of HQ staff 53 32 43
Total number of branch staff 53 40 55
Total number of loan officers 31 45 49
Total number online channel 7 14 30
Legal and Collections staff 5 7 17
Total number of staff 118 93 145
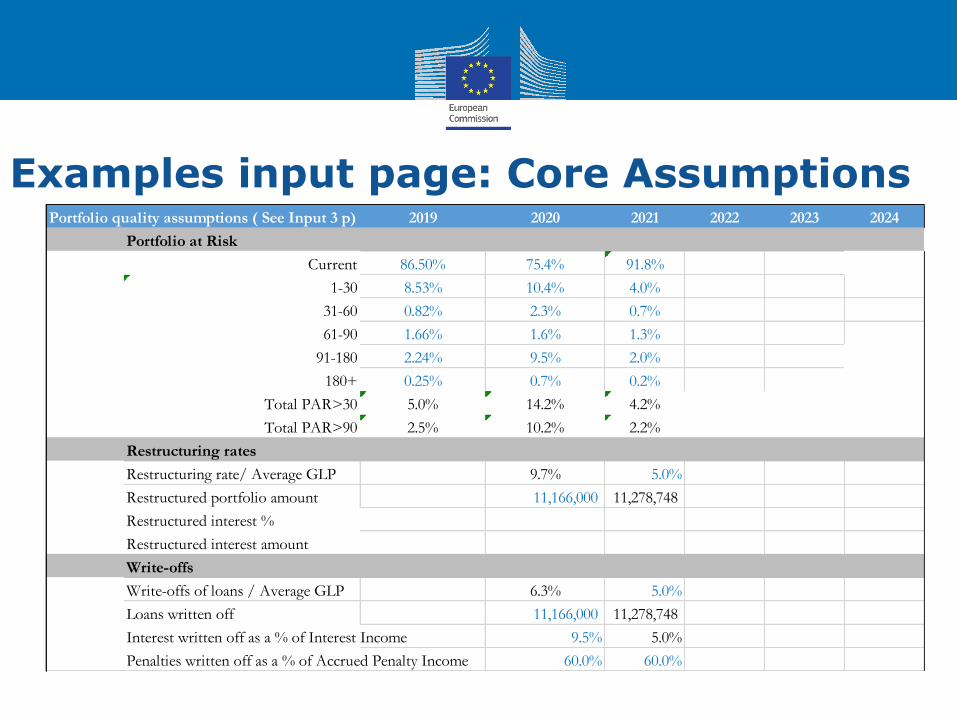
Examples input page: Core AssumptionsPortfolio quality assumptions ( See Input 3 p) 2019 2020 2021 2022 2023 2024
Portfolio at Risk
Current 86.50% 75.4% 91.8%
1-30 8.53% 10.4% 4.0%
31-60 0.82% 2.3% 0.7%
61-90 1.66% 1.6% 1.3%
91-180 2.24% 9.5% 2.0%
180+ 0.25% 0.7% 0.2%
Total PAR>30 5.0% 14.2% 4.2%
Total PAR>90 2.5% 10.2% 2.2%
Restructuring rates
Restructuring rate/ Average GLP 9.7% 5.0%
Restructured portfolio amount 11,166,000 11,278,748
Restructured interest %
Restructured interest amount
Write-offs
Write-offs of loans / Average GLP 6.3% 5.0%
Loans written off 11,166,000 11,278,748
Interest written off as a % of Interest Income 9.5% 5.0%
Penalties written off as a % of Accrued Penalty Income 60.0% 60.0%
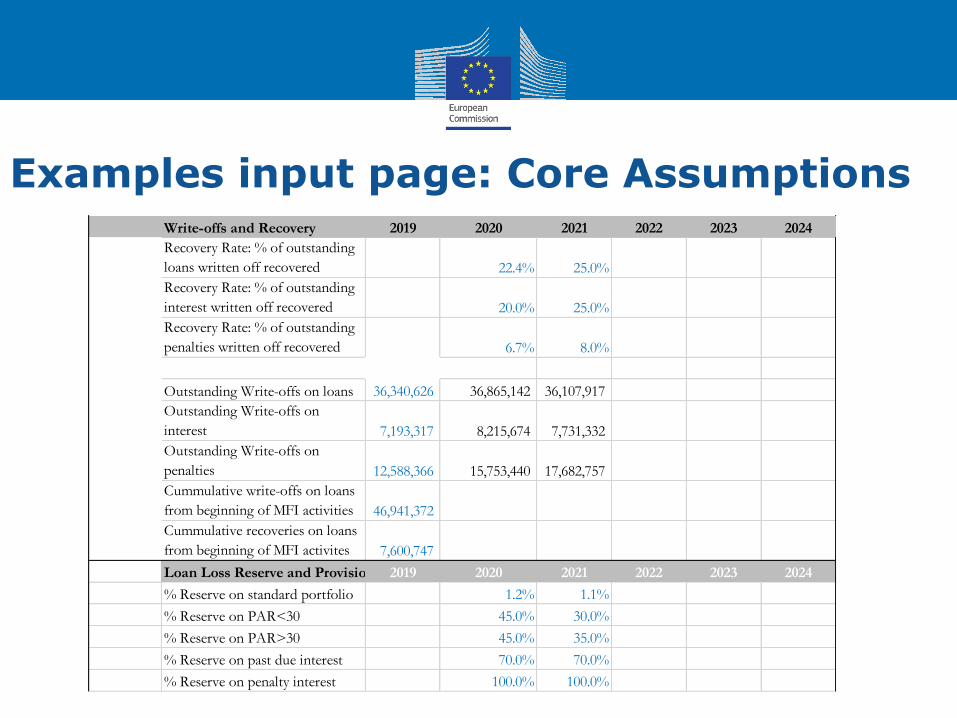
Examples input page: Core AssumptionsWrite-offs and Recovery 2019 2020 2021 2022 2023 2024
Recovery Rate: % of outstanding
loans written off recovered 22.4% 25.0%
Recovery Rate: % of outstanding
interest written off recovered 20.0% 25.0%
Recovery Rate: % of outstanding
penalties written off recovered 6.7% 8.0%
Outstanding Write-offs on loans 36,340,626 36,865,142 36,107,917
Outstanding Write-offs on
interest 7,193,317 8,215,674 7,731,332
Outstanding Write-offs on
penalties 12,588,366 15,753,440 17,682,757
Cummulative write-offs on loans
from beginning of MFI activities 46,941,372
Cummulative recoveries on loans
from beginning of MFI activites 7,600,747
Loan Loss Reserve and Provision 2019 2020 2021 2022 2023 2024
% Reserve on standard portfolio 1.2% 1.1%
% Reserve on PAR<30 45.0% 30.0%
% Reserve on PAR>30 45.0% 35.0%
% Reserve on past due interest 70.0% 70.0%
% Reserve on penalty interest 100.0% 100.0%
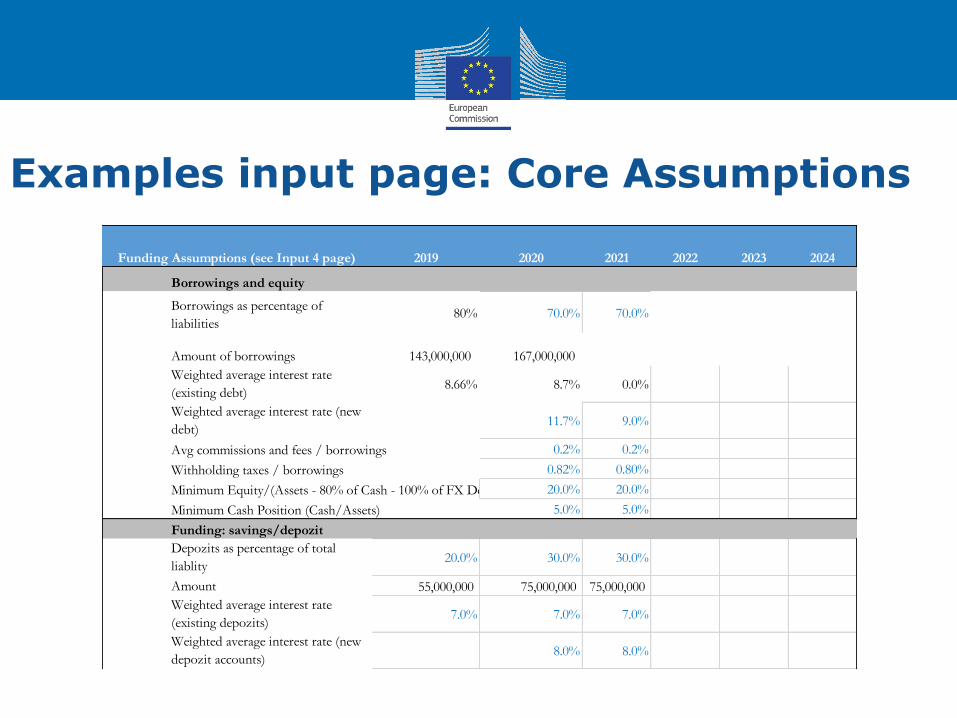
Examples input page: Core Assumptions
2019 2020 2021 2022 2023 2024
Borrowings and equity
Borrowings as percentage of
liabilities80% 70.0% 70.0%
Amount of borrowings 143,000,000 167,000,000
Weighted average interest rate
(existing debt)8.66% 8.7% 0.0%
Weighted average interest rate (new
debt)11.7% 9.0%
Avg commissions and fees / borrowings 0.2% 0.2%
Withholding taxes / borrowings 0.82% 0.80%
Minimum Equity/(Assets - 80% of Cash - 100% of FX Deposits) 20.0% 20.0%
Minimum Cash Position (Cash/Assets) 5.0% 5.0%
Funding: savings/depozit
Depozits as percentage of total
liablity20.0% 30.0% 30.0%
Amount 55,000,000 75,000,000 75,000,000
Weighted average interest rate
(existing depozits)7.0% 7.0% 7.0%
Weighted average interest rate (new
depozit accounts)8.0% 8.0%
Funding Assumptions (see Input 4 page)
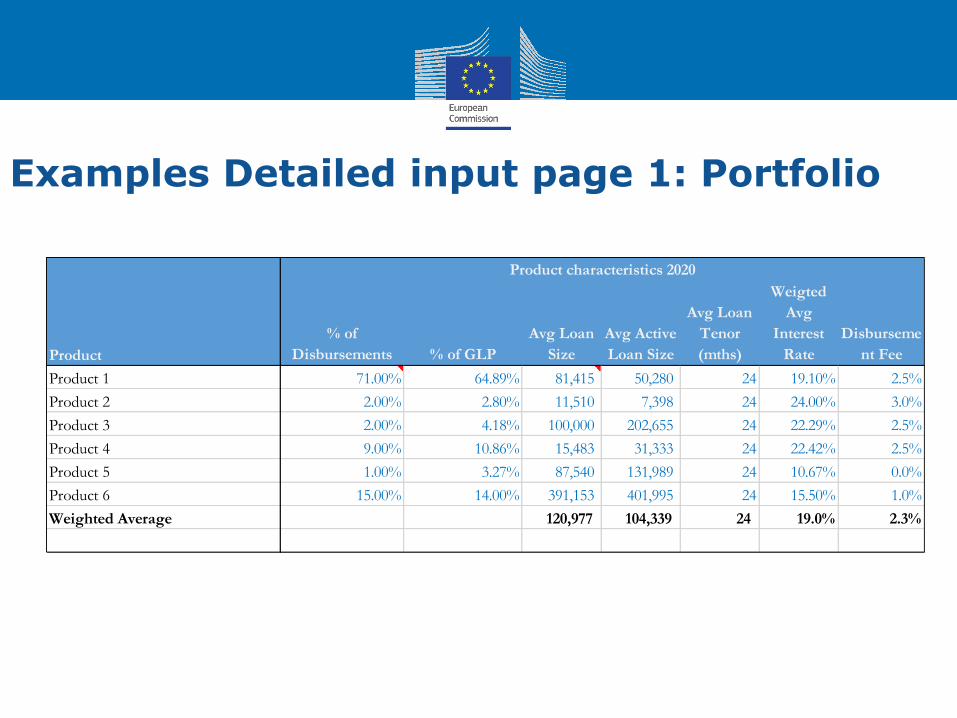
Examples Detailed input page 1: Portfolio
Product characteristics 2020
Product
% of
Disbursements % of GLP
Avg Loan
Size
Avg Active
Loan Size
Avg Loan
Tenor
(mths)
Weigted
Avg
Interest
Rate
Disburseme
nt Fee
Product 1 71.00% 64.89% 81,415 50,280 24 19.10% 2.5%
Product 2 2.00% 2.80% 11,510 7,398 24 24.00% 3.0%
Product 3 2.00% 4.18% 100,000 202,655 24 22.29% 2.5%
Product 4 9.00% 10.86% 15,483 31,333 24 22.42% 2.5%
Product 5 1.00% 3.27% 87,540 131,989 24 10.67% 0.0%
Product 6 15.00% 14.00% 391,153 401,995 24 15.50% 1.0%
Weighted Average 120,977 104,339 24 19.0% 2.3%

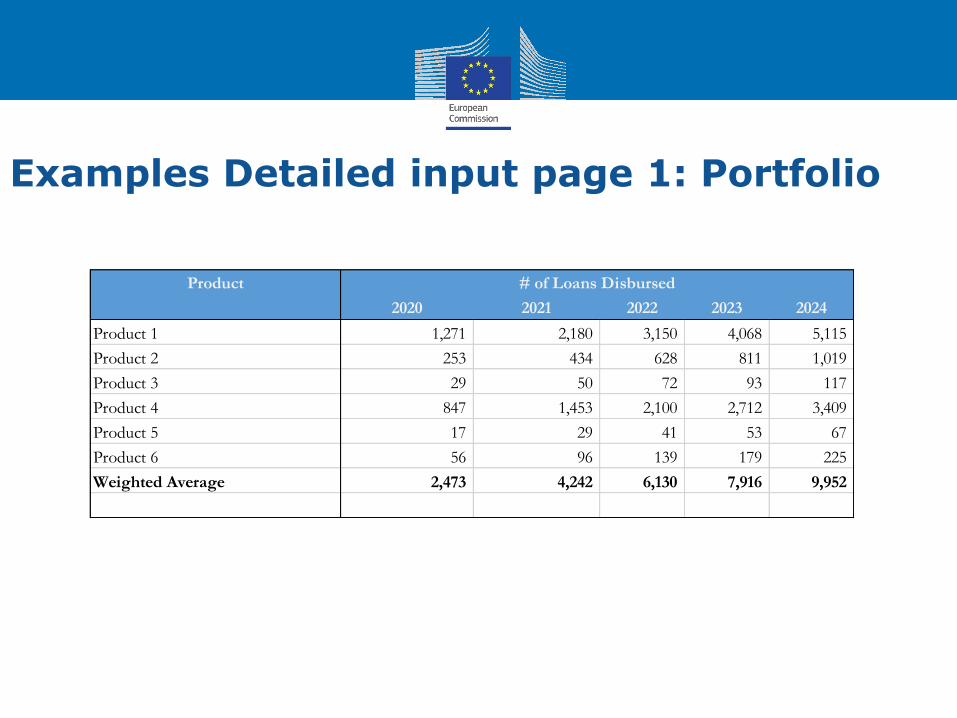
Examples Detailed input page 1: Portfolio
Product # of Loans Disbursed
2020 2021 2022 2023 2024
Product 1 1,271 2,180 3,150 4,068 5,115
Product 2 253 434 628 811 1,019
Product 3 29 50 72 93 117
Product 4 847 1,453 2,100 2,712 3,409
Product 5 17 29 41 53 67
Product 6 56 96 139 179 225
Weighted Average 2,473 4,242 6,130 7,916 9,952
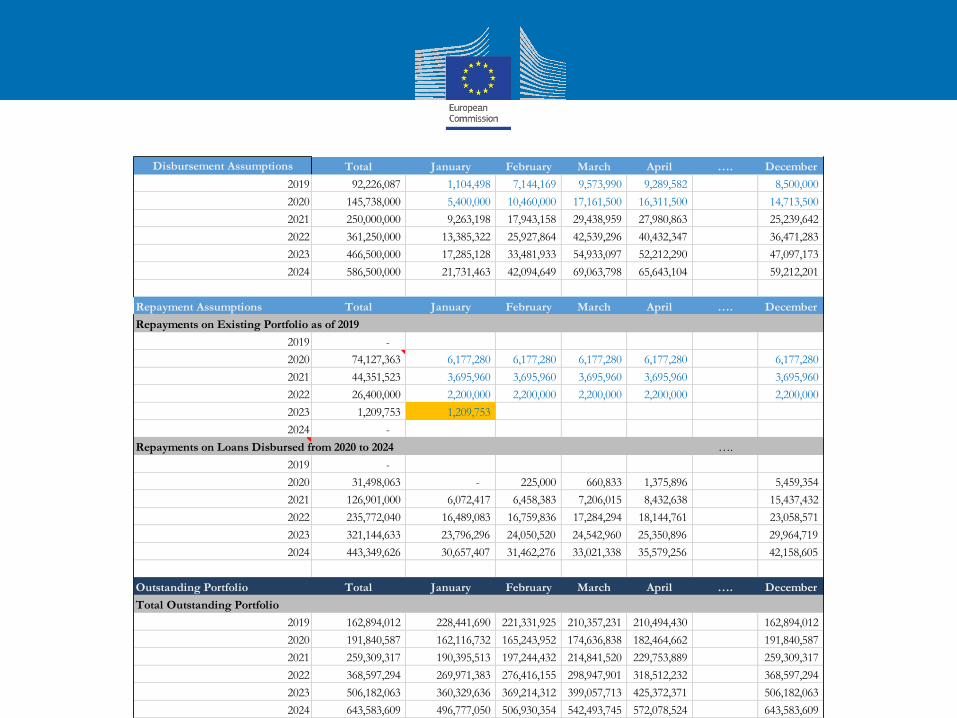
Disbursement Assumptions Total January February March April …. December
2019 92,226,087 1,104,498 7,144,169 9,573,990 9,289,582 8,500,000
2020 145,738,000 5,400,000 10,460,000 17,161,500 16,311,500 14,713,500
2021 250,000,000 9,263,198 17,943,158 29,438,959 27,980,863 25,239,642
2022 361,250,000 13,385,322 25,927,864 42,539,296 40,432,347 36,471,283
2023 466,500,000 17,285,128 33,481,933 54,933,097 52,212,290 47,097,173
2024 586,500,000 21,731,463 42,094,649 69,063,798 65,643,104 59,212,201
Repayment Assumptions Total January February March April …. December
Repayments on Existing Portfolio as of 2019
2019 -
2020 74,127,363 6,177,280 6,177,280 6,177,280 6,177,280 6,177,280
2021 44,351,523 3,695,960 3,695,960 3,695,960 3,695,960 3,695,960
2022 26,400,000 2,200,000 2,200,000 2,200,000 2,200,000 2,200,000
2023 1,209,753 1,209,753
2024 -
Repayments on Loans Disbursed from 2020 to 2024 ….
2019 -
2020 31,498,063 - 225,000 660,833 1,375,896 5,459,354
2021 126,901,000 6,072,417 6,458,383 7,206,015 8,432,638 15,437,432
2022 235,772,040 16,489,083 16,759,836 17,284,294 18,144,761 23,058,571
2023 321,144,633 23,796,296 24,050,520 24,542,960 25,350,896 29,964,719
2024 443,349,626 30,657,407 31,462,276 33,021,338 35,579,256 42,158,605
Outstanding Portfolio Total January February March April …. December
Total Outstanding Portfolio
2019 162,894,012 228,441,690 221,331,925 210,357,231 210,494,430 162,894,012
2020 191,840,587 162,116,732 165,243,952 174,636,838 182,464,662 191,840,587
2021 259,309,317 190,395,513 197,244,432 214,841,520 229,753,889 259,309,317
2022 368,597,294 269,971,383 276,416,155 298,947,901 318,512,232 368,597,294
2023 506,182,063 360,329,636 369,214,312 399,057,713 425,372,371 506,182,063
2024 643,583,609 496,777,050 506,930,354 542,493,745 572,078,524 643,583,609
Calculation pages
Calculation pages
• You may want to partner with a specialized person on formulas or even Visual Basic for Applications (VBA) programming
• Do not insert data in the formulas
• Do not make formulas to long, instead create additional separate calculation page or table
• Testing, Testing and again Testing
36
Output
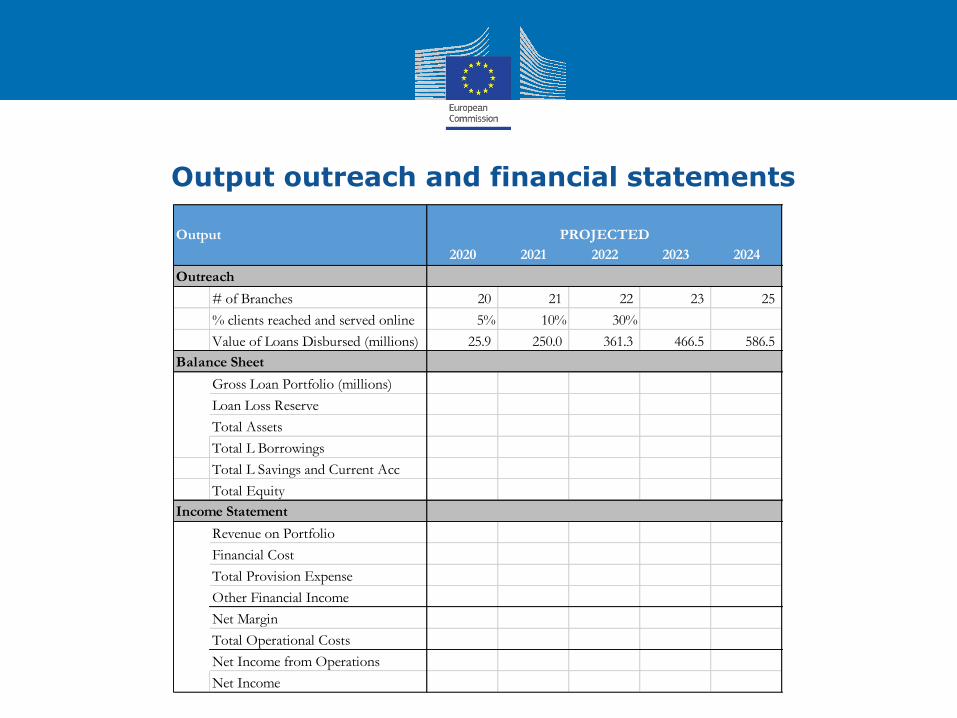
Output outreach and financial statements
Output PROJECTED
2020 2021 2022 2023 2024
Outreach
# of Branches 20 21 22 23 25
% clients reached and served online 5% 10% 30%
Value of Loans Disbursed (millions) 25.9 250.0 361.3 466.5 586.5
Balance Sheet
Gross Loan Portfolio (millions)
Loan Loss Reserve
Total Assets
Total L Borrowings
Total L Savings and Current Acc
Total Equity
Income Statement
Revenue on Portfolio
Financial Cost
Total Provision Expense
Other Financial Income
Net Margin
Total Operational Costs
Net Income from Operations
Net Income
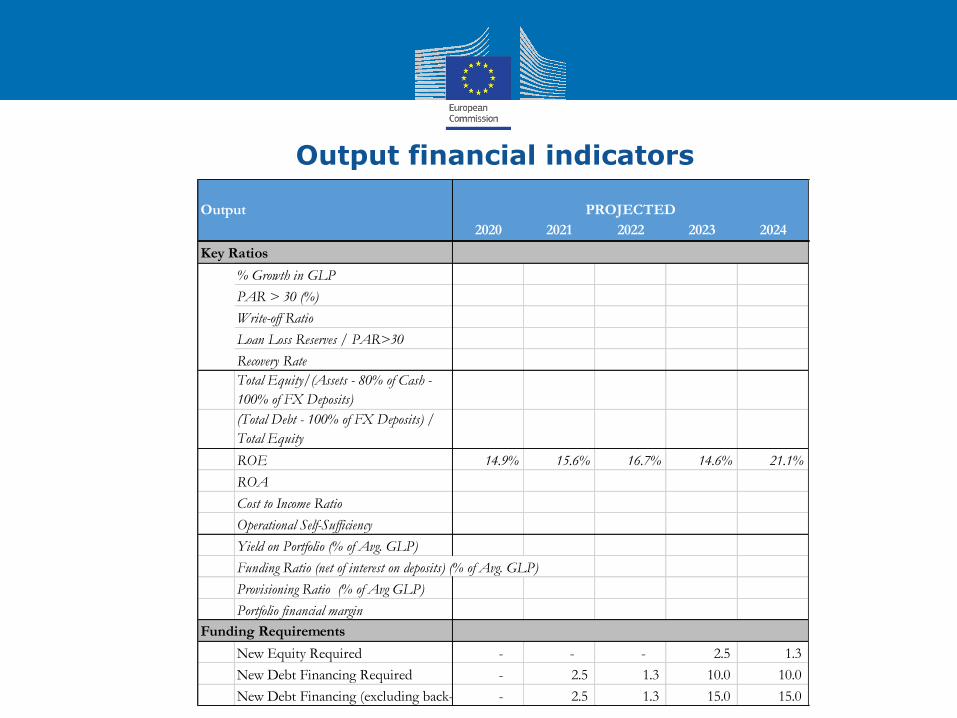
Output financial indicators
Key Ratios
% Growth in GLP
PAR > 30 (%)
Write-off Ratio
Loan Loss Reserves / PAR>30
Recovery Rate
Total Equity/(Assets - 80% of Cash -
100% of FX Deposits)
(Total Debt - 100% of FX Deposits) /
Total Equity
ROE 14.9% 15.6% 16.7% 14.6% 21.1%
ROA
Cost to Income Ratio
Operational Self-Sufficiency
Yield on Portfolio (% of Avg. GLP)
Funding Ratio (net of interest on deposits) (% of Avg. GLP)
Provisioning Ratio (% of Avg GLP)
Portfolio financial margin
Funding Requirements
New Equity Required - - - 2.5 1.3
New Debt Financing Required - 2.5 1.3 10.0 10.0
New Debt Financing (excluding back-to-back)- 2.5 1.3 15.0 15.0
Output PROJECTED
2020 2021 2022 2023 2024
Output pages
• Use your standard financial statements that are used in your MIS
• Use your standard financial indictors formulas including indicators used for covenants with creditors
• Use some “group” and “ungroup” functions to shorten for presentation purposes
40
Better visualization of output
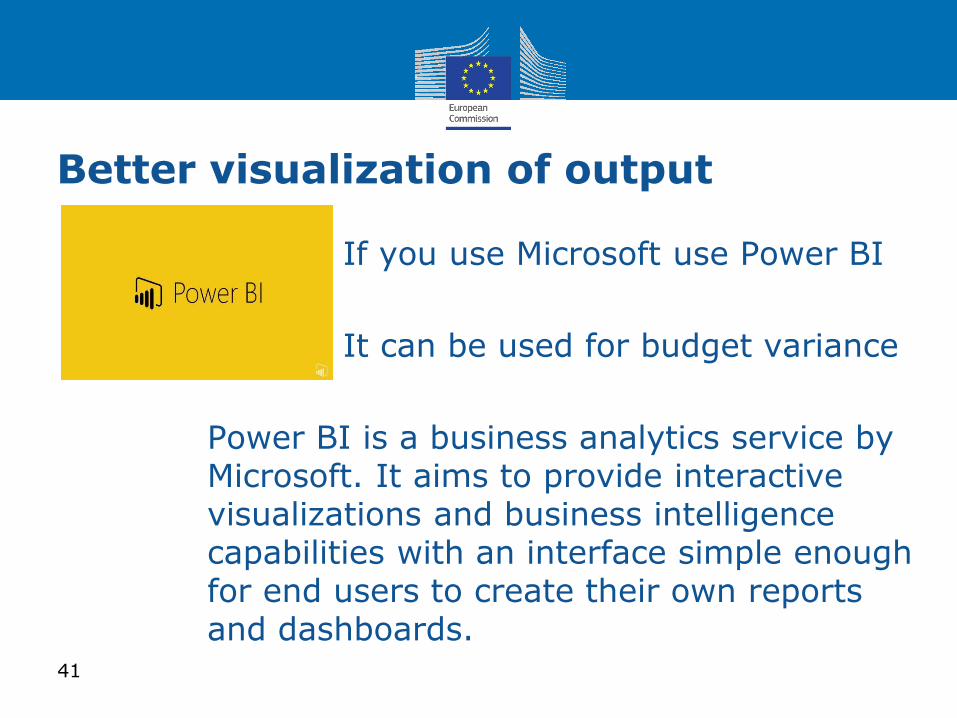
• If you use Microsoft use Power BI
• It can be used for budget variance
• Power BI is a business analytics service by Microsoft. It aims to provide interactive visualizations and business intelligence capabilities with an interface simple enough for end users to create their own reports and dashboards.
41
Stress test/ What if analysis
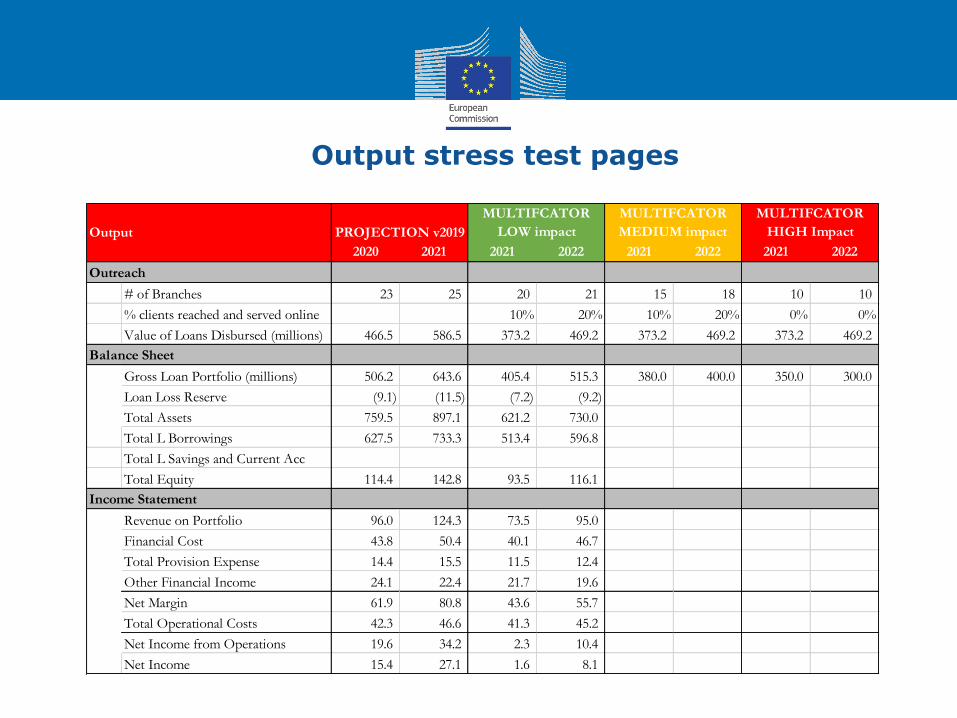
Output stress test pages
Output PROJECTION v2019
MULTIFCATOR
LOW impact
MULTIFCATOR
MEDIUM impact
MULTIFCATOR
HIGH Impact
2020 2021 2021 2022 2021 2022 2021 2022
Outreach
# of Branches 23 25 20 21 15 18 10 10
% clients reached and served online 10% 20% 10% 20% 0% 0%
Value of Loans Disbursed (millions) 466.5 586.5 373.2 469.2 373.2 469.2 373.2 469.2
Balance Sheet
Gross Loan Portfolio (millions) 506.2 643.6 405.4 515.3 380.0 400.0 350.0 300.0
Loan Loss Reserve (9.1) (11.5) (7.2) (9.2)
Total Assets 759.5 897.1 621.2 730.0
Total L Borrowings 627.5 733.3 513.4 596.8
Total L Savings and Current Acc
Total Equity 114.4 142.8 93.5 116.1
Income Statement
Revenue on Portfolio 96.0 124.3 73.5 95.0
Financial Cost 43.8 50.4 40.1 46.7
Total Provision Expense 14.4 15.5 11.5 12.4
Other Financial Income 24.1 22.4 21.7 19.6
Net Margin 61.9 80.8 43.6 55.7
Total Operational Costs 42.3 46.6 41.3 45.2
Net Income from Operations 19.6 34.2 2.3 10.4
Net Income 15.4 27.1 1.6 8.1
Manuals. How to use the model
User manuals
• Writing manuals or you will rewrite the model!
• Not only how to use but also how to program, develop the model
• Involve more people including external specialized firms
•
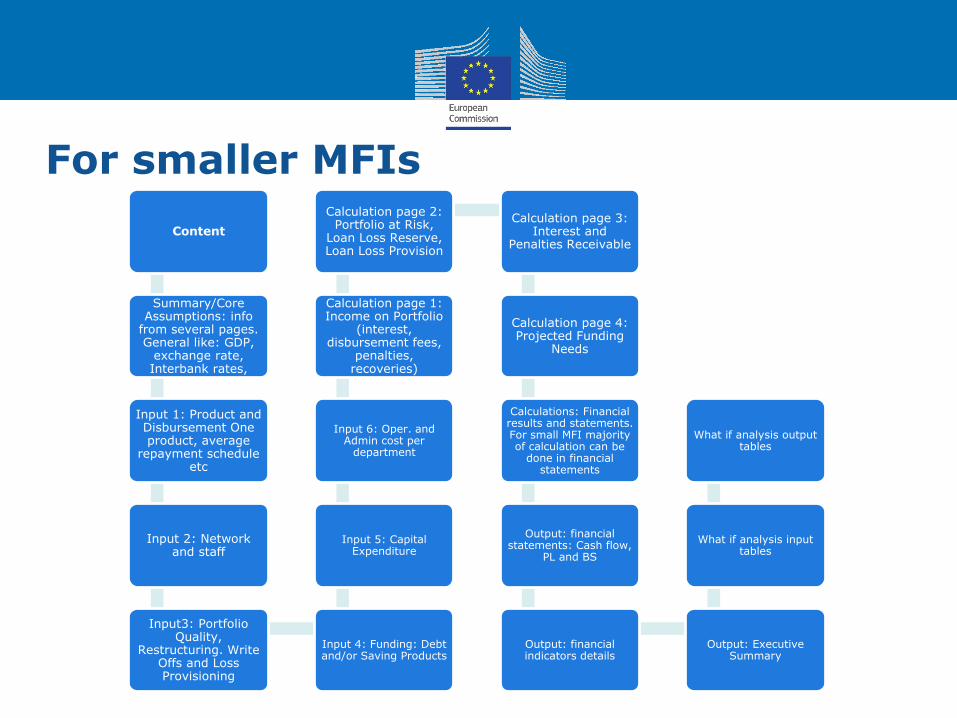
For smaller MFIs
Content
Summary/Core Assumptions: info
from several pages. General like: GDP,
exchange rate, Interbank rates,
Input 1: Product and Disbursement One product, average
repayment schedule etc
Input 2: Network and staff
Input3: Portfolio Quality,
Restructuring. Write Offs and Loss Provisioning
Input 4: Funding: Debt and/or Saving Products
Input 5: Capital Expenditure
Input 6: Oper. and Admin cost per
department
Calculation page 1: Income on Portfolio
(interest, disbursement fees,
penalties, recoveries)
Calculation page 2: Portfolio at Risk,
Loan Loss Reserve, Loan Loss Provision
Calculation page 3: Interest and
Penalties Receivable
Calculation page 4: Projected Funding
Needs
Calculations: Financial results and statements. For small MFI majority of calculation can be
done in financial statements
Output: financial statements: Cash flow,
PL and BS
Output: financial indicators details
Output: Executive Summary
What if analysis input tables
What if analysis output tables
Financial plan structure for smaller, Sturt-ups or earlier stage, MFIs
• Apply one loan product model
• One average repayment schedule as key assumption
• Several assumptions related to bad debt depending on the strategy PAR 5% or 25%
• List operational and admin expenses and go to Cash flow

How to Build a Corporate Immune System in Response to
COVID-19 – webinar series
European Code of Good
Conduct
Capacity Building•Webinars recordings and other resources
related to pandemic crises:
•www.mfc.org.pl/coronavirus-pandemic-good-practices-resources-library/
Digital Literacy Bootcamp series
European Code of Good
Conduct
Capacity Building• 05.05, 11:00 – 12:30 CET - Leveraging Robotic
Process Automation (RPA) in microfinance
• 12.05, 11:00 – 12.30 CET - Your mobile brandexperience
•… and more at http://mfc.org.pl/digital-literacy-
bootcamp-diglit/

Contact us!
Microfinance Centre
Noakowskiego 10/38
00-666 Warsaw, Poland
+48 22 622 34 65
Thank you!


![COVID-19, immune system response, hyperinflammation and ......2004/01/19 · requiring intensive care unit (ICU) admission [4, 5]. An efficient immune response against SARS-CoV-2](https://img.pdfslide.net/doc/110x75/601d1d157289a5626d7e8f21/covid-19-immune-system-response-hyperinflammation-and-20040119-requiring.jpg)