Embed Size (px)
Citation preview
1
How to Build an Effective Trading System
Howard Bandy NAAIM 2008
© Copyright 2008 by Howard Bandy. Distribution rights are granted to NAAIM
(and Build Confidence that It Will Be Profitable)

2
Disclaimer
• This is an educational presentation • The purpose is to explain the author’s
method for developing trading systems • This is not a trading system presentation • Neither the author and presenter, Howard
Bandy, nor the conference organizer, NAAIM, is liable for losses resulting from application of techniques described in this presentation

3
The Problem
The Solution
Practical Implementation

4
The Problem
• Will the newly developed trading system be profitable when traded?
• How confident can we be?
5
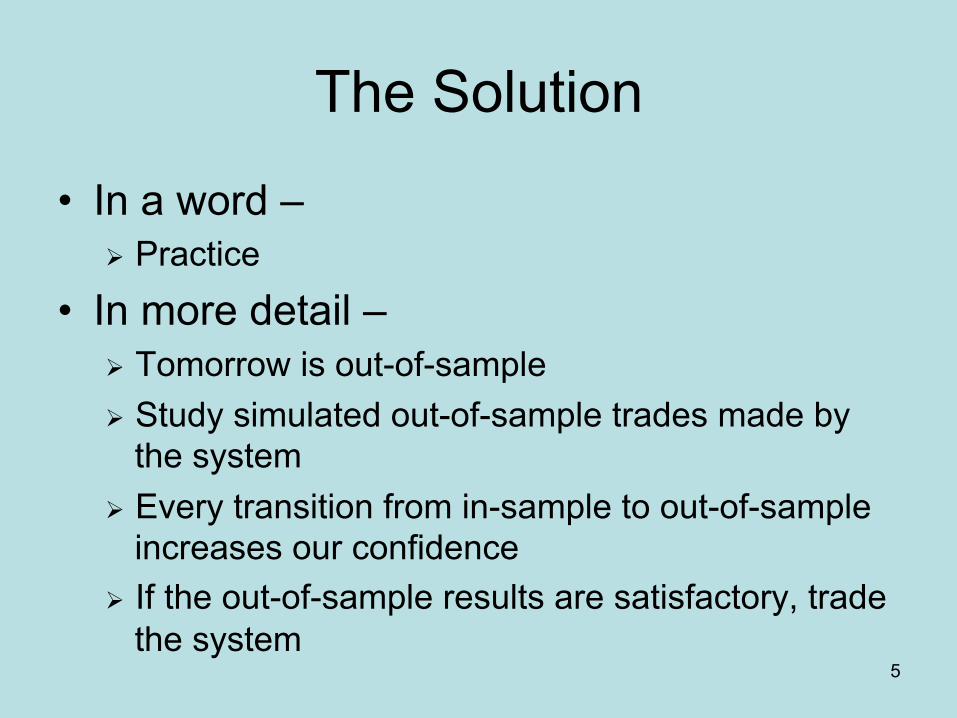
The Solution
• In a word – Practice
• In more detail – Tomorrow is out-of-sample Study simulated out-of-sample trades made by
the system Every transition from in-sample to out-of-sample
increases our confidence If the out-of-sample results are satisfactory, trade
the system
6
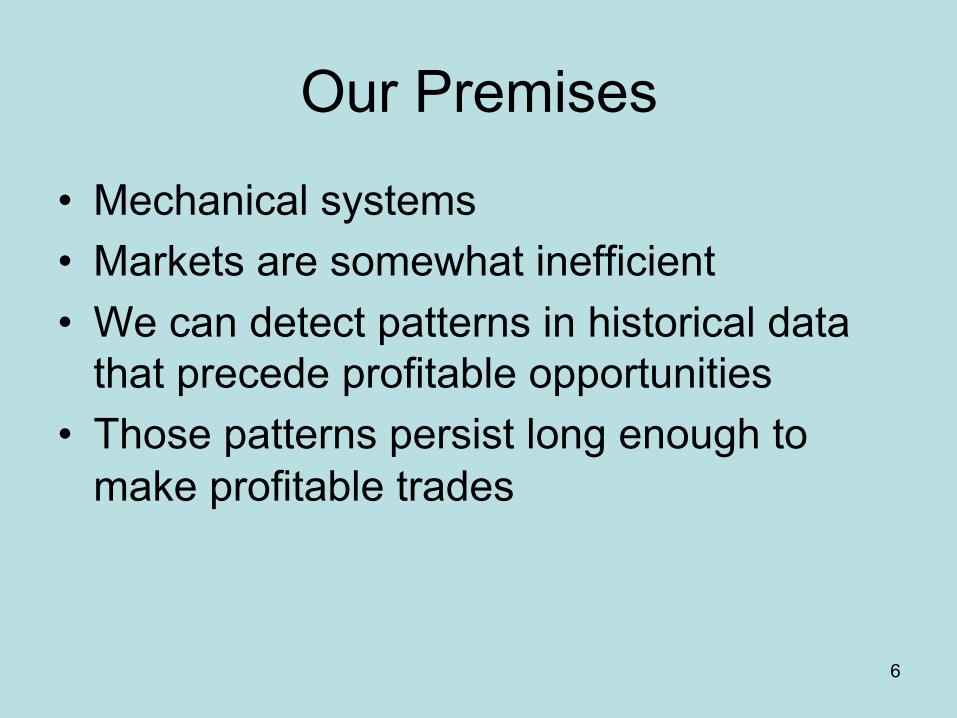
Our Premises
• Mechanical systems • Markets are somewhat inefficient • We can detect patterns in historical data
that precede profitable opportunities • Those patterns persist long enough to
make profitable trades
7
Lord Kelvin - 1891
“When you can measure what you are speaking about, and express it in numbers, you know something about it; but when you cannot measure it, when you cannot express it in numbers, your knowledge is of a meager and unsatisfactory kind…”
8
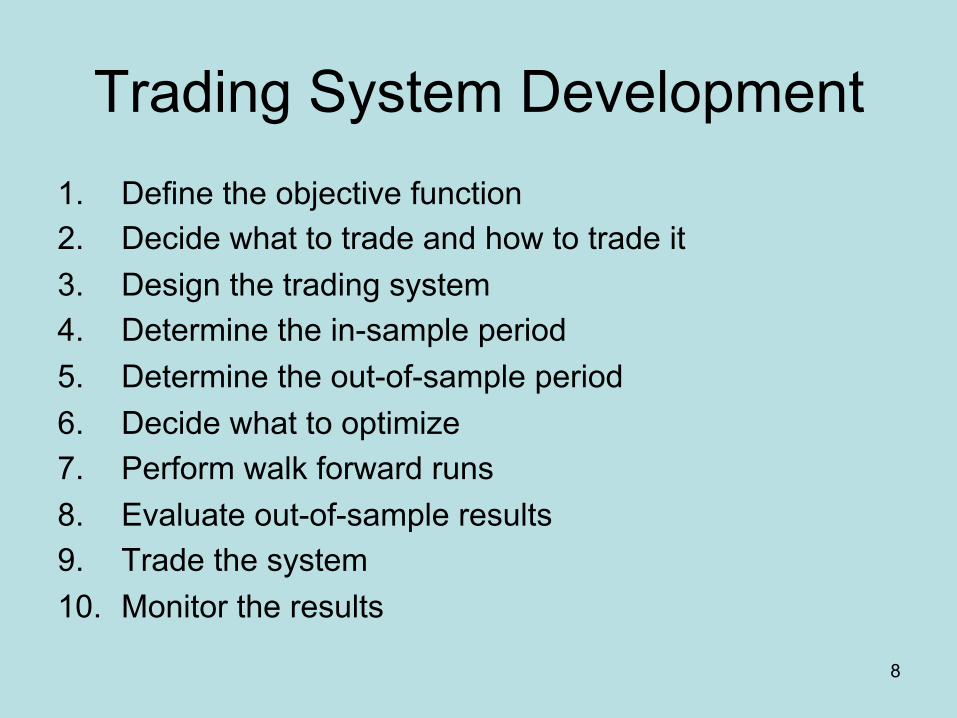
Trading System Development 1. Define the objective function 2. Decide what to trade and how to trade it 3. Design the trading system 4. Determine the in-sample period 5. Determine the out-of-sample period 6. Decide what to optimize 7. Perform walk forward runs 8. Evaluate out-of-sample results 9. Trade the system 10. Monitor the results
9
Defining Best – Objective Function
• Psychology of trading experts have it backwards
• Cognitive dissonance • Start by identifying what is important to
you • Create an objective function that
incorporates those features • Use this to compare alternative systems
10
Defining Best – Objective Function
• A function that gives single-valued score • A measure of the system • Incorporates important features • Score is reported for every test run • Will be used during walk forward • You select the objective function • Take your time and get it right • Don’t start designing and testing without it
11
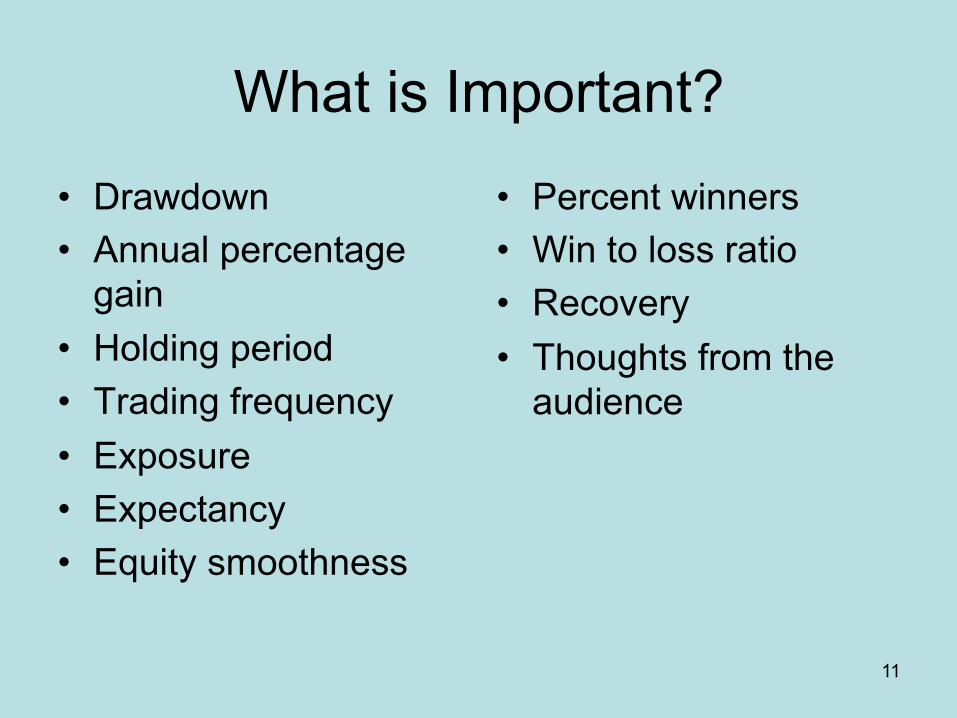
What is Important?
• Drawdown • Annual percentage
gain • Holding period • Trading frequency • Exposure • Expectancy • Equity smoothness
• Percent winners • Win to loss ratio • Recovery • Thoughts from the
audience

12
Drawdown
• In a single trade, it is the maximum amount of loss at any time, relative to the best price
• In a system, it is the maximum decline in the account’s equity at any time, measured from maximum equity up to that point
• Drawdown is probably the single most important metric – excessive drawdown is the most common reason traders stop using a system
• Given a smooth equity curve, add leverage as desired to the point where drawdown becomes limiting
13
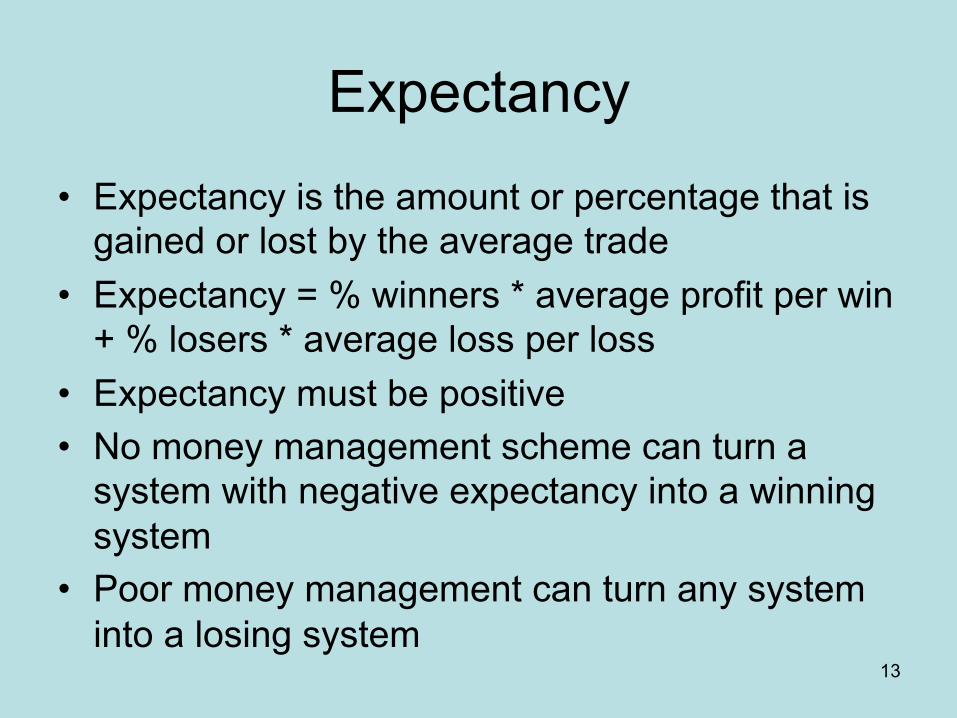
Expectancy
• Expectancy is the amount or percentage that is gained or lost by the average trade
• Expectancy = % winners * average profit per win + % losers * average loss per loss
• Expectancy must be positive • No money management scheme can turn a
system with negative expectancy into a winning system
• Poor money management can turn any system into a losing system
14
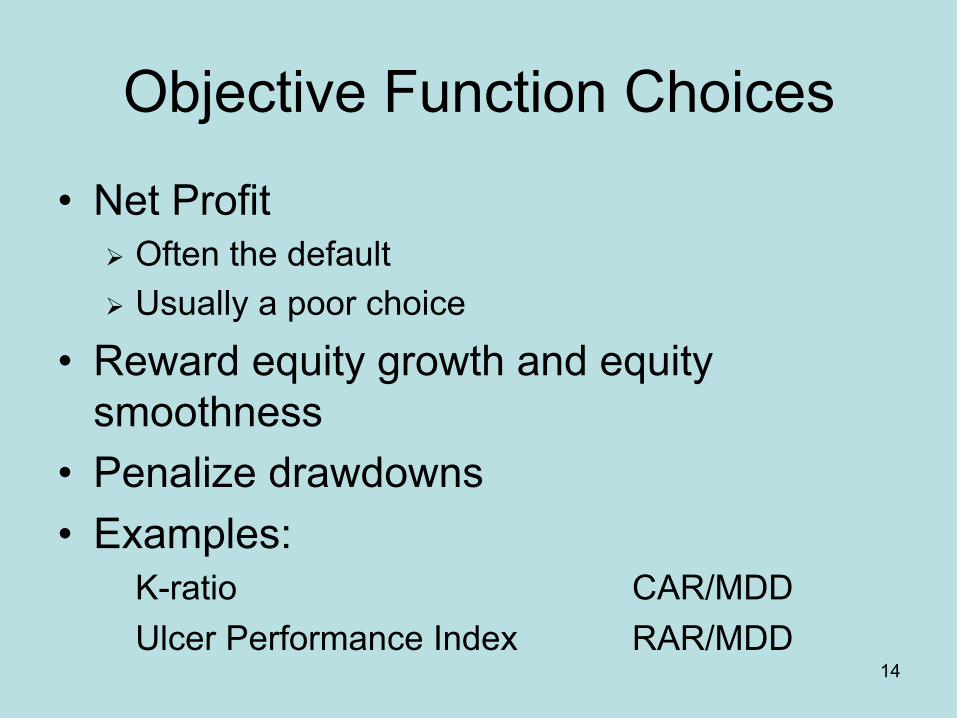
Objective Function Choices
• Net Profit Often the default Usually a poor choice
• Reward equity growth and equity smoothness
• Penalize drawdowns • Examples:
K-ratio CAR/MDD Ulcer Performance Index RAR/MDD
15
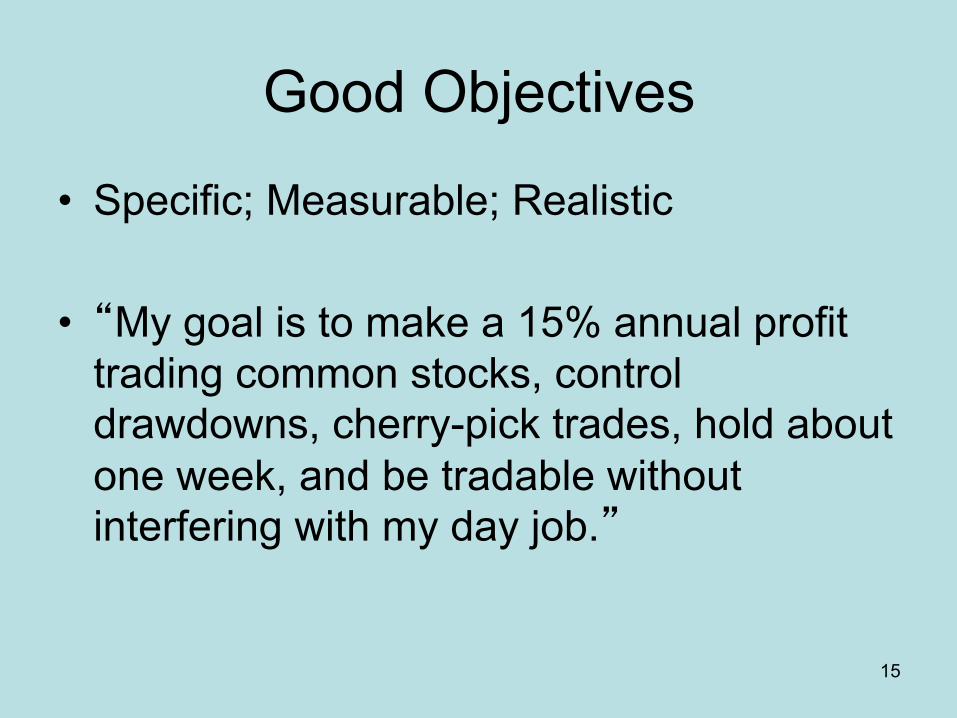
Good Objectives
• Specific; Measurable; Realistic
• “My goal is to make a 15% annual profit trading common stocks, control drawdowns, cherry-pick trades, hold about one week, and be tradable without interfering with my day job.”

16
Translated
• Compound Annual Return > 15% • Maximum System Drawdown < 15% • Exposure ~ 30% • Holding 3 to 7 days • Use end-of-day data • Evaluate in the evening • Trade Market on Open
17
Verify Your Objective Function
• Choose metrics that best fit your trading style and personality
• Run some optimizations • Plot the equity curves of several variations • Sort the results into order by ObFn • You should prefer them in order by ObFn • If not, modify the objective function until they
are ranked correctly • Will be used during walk forward
18
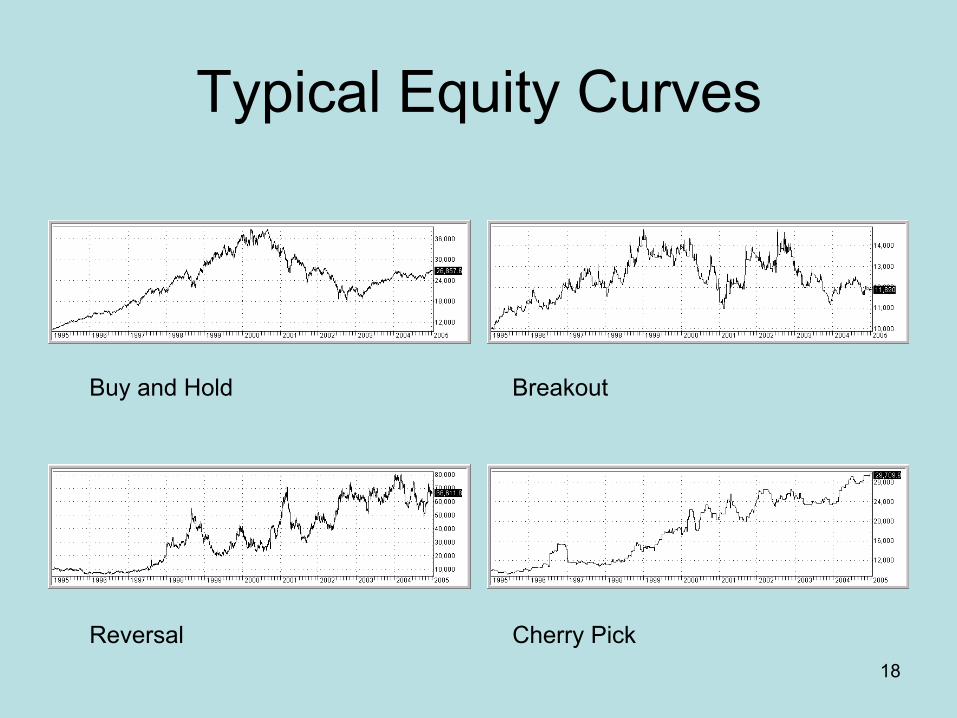
Typical Equity Curves
Buy and Hold Breakout
Reversal Cherry Pick
19
Data and Issues
• Historical data for backtesting • Current data for trading • Liquidity • Price reasonable • Data cleanliness
Bad quotes Unadjusted splits, distributions, restatements Visual inspection Consistency

20
About Financial Data
• It is non-stationary Cannot be made stationary Autocorrelation is very weak
• Data = trends + cycles + patterns + noise • Trading system is designed to recognize
some signal portion • Low signal to noise ratio • Noise is everything the system does not
model

21
How to Trade
• End-of-day, intraday • MOO, MOC, limit orders, stops
• Single issues • Portfolios
• Position size • Risk management

22
Models and Modeling
1. Build a model Trial and error Deduction
(reasoning) Induction (analysis of
data) Loop of
• Conjecture • Experiment • Observe • Modify
2. Validate that the model represents signal, not noise (out-of-sample testing)
3. Monitor to determine whether the model and the underlying are in sync (statistical tests)
23
Models and Reality
• Our trading models are static • The reality we are trying to model is
dynamic • Our hope:
We can build a model of the data, That recognizes some inefficiency, And use that model to trade profitably, As long as the model and reality stay in sync.
24
What to Model – Something Easy
• Sector ETFs • Sector Mutual Funds • Indices • Industry Monitor ID Groups • Custom Indices (AddToComposite) • Beware survivor bias
25
Survivor Bias
• Companies that fail disappear • Mergers and acquisitions change the
characteristics of companies • Companies currently in a list, group, fund,
industry, or index may not have always been there
• Others that used to be members may be missing
26
What to Trade – Something Profitable and Liquid
• Stocks, funds, ETFs, futures • Single issue • Portfolio • Model one thing – trade another
27
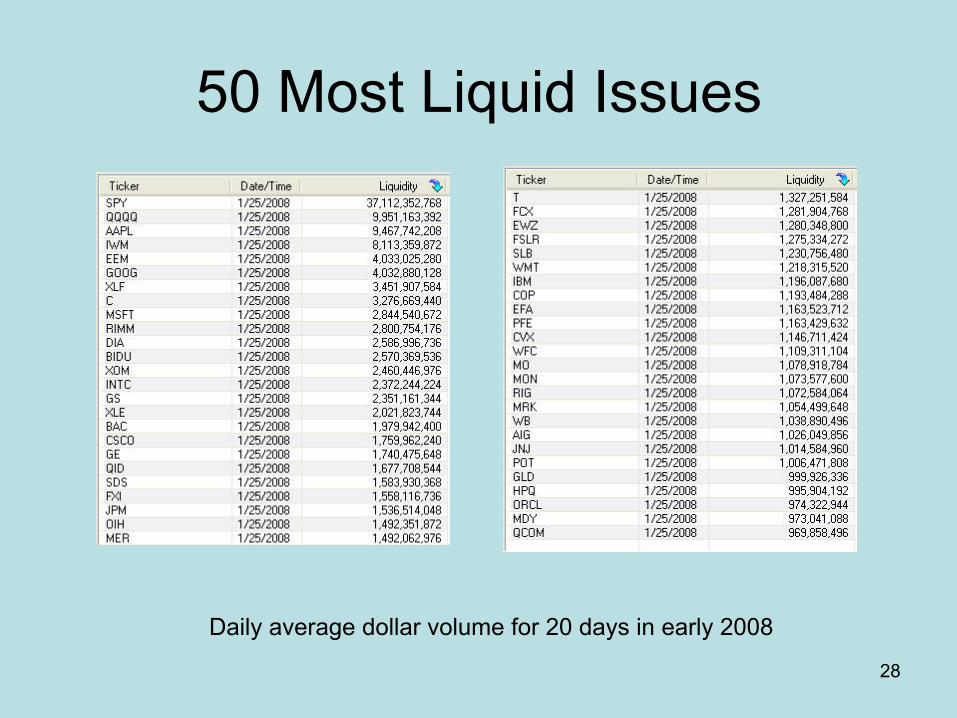
Liquidity
• $100M per day 500 issues 300 of the S&P500 $0.01 – $0.02 spread Very few gaps on 1 minute chart
• $20M per day 1500 issues $0.01 - $0.04 spread
28
50 Most Liquid Issues
Daily average dollar volume for 20 days in early 2008

29
Profitability
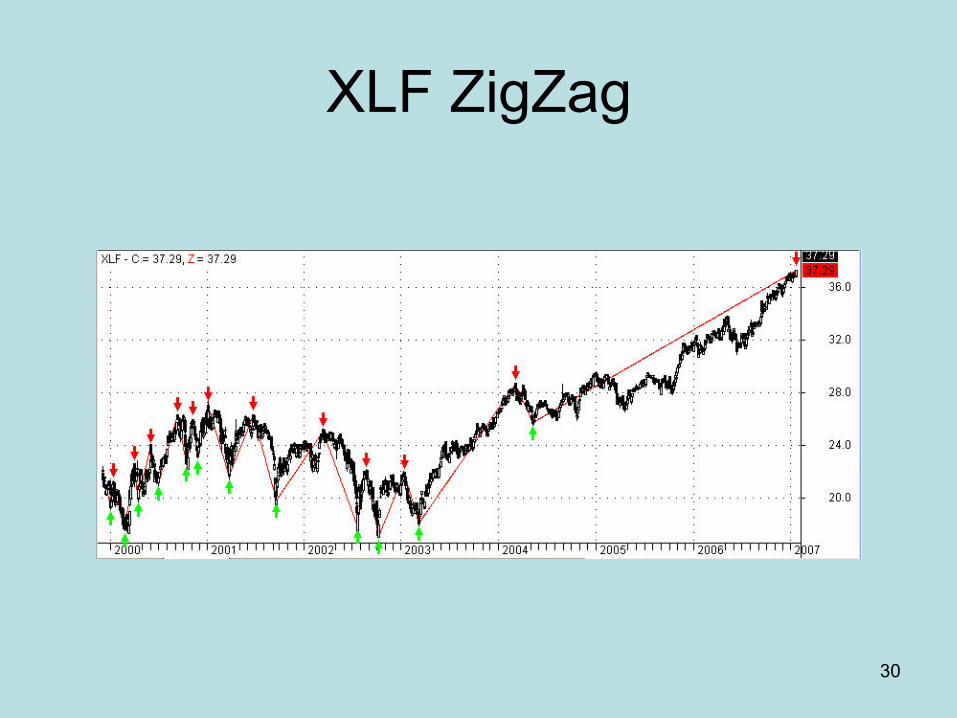
• Model XLF Run ZigZag.afl to see potential
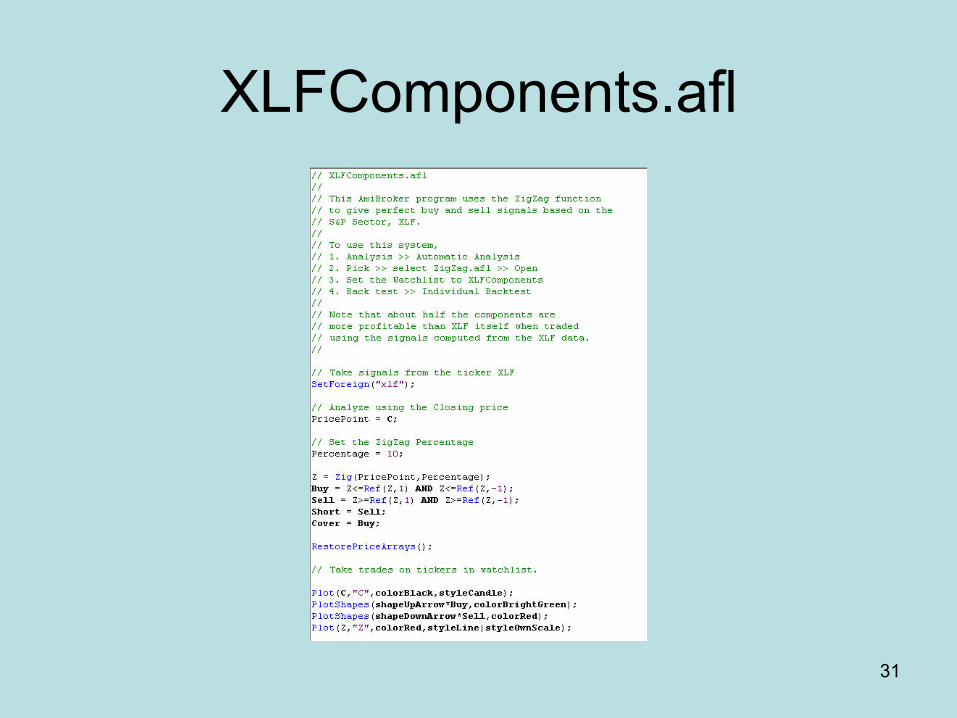
• Trade components Use WatchList XLFComponents Run XLFComponents.afl to see potential
• XLF is easier to model • The components are more profitable to
trade
30
XLF ZigZag
31
XLFComponents.afl

32
Trading XLF Components
33
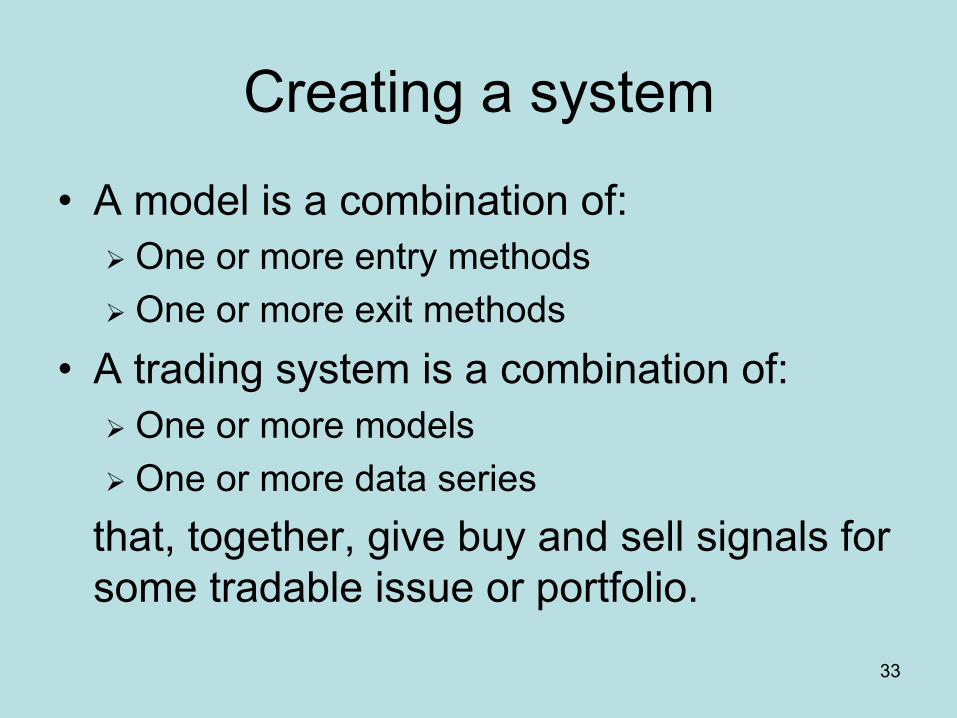
Creating a system
• A model is a combination of: One or more entry methods One or more exit methods
• A trading system is a combination of: One or more models One or more data series
that, together, give buy and sell signals for some tradable issue or portfolio.
34
Types of Systems
• Trend following Breakout Moving average
• Mean reversion • Pattern • Seasonality • Cycle • Others?
• Every trade is a trend-following trade while you are in it
35
Entries
• Signals Indicators Patterns Seasonality Cycles
• Setups • Filters • Random – for comparison

36
Exits
• Signals – Indicators, patterns, seasonality, cycles Same as entry – other direction Same logic – different parameter values Different logic
• Timed holding period • Profit target • Trailing stop • Maximum loss stop
37
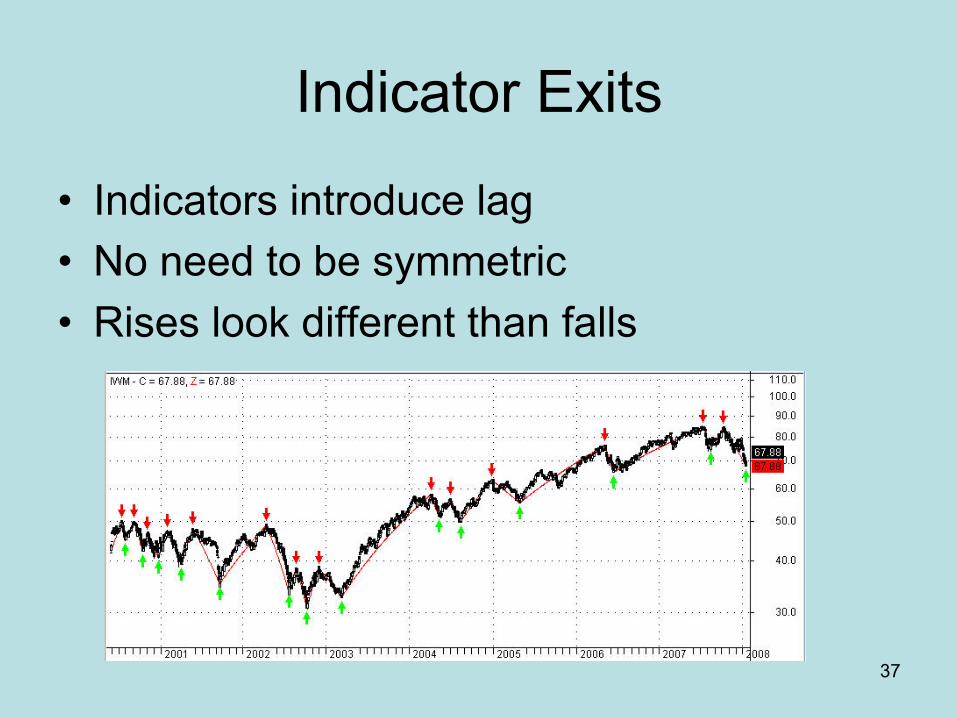
Indicator Exits
• Indicators introduce lag • No need to be symmetric • Rises look different than falls
38
Stops are Not Reasons to Sell
• Best exits come from signals and indicators
• Mean reversion (short holding periods) – profit targets and timed holding periods
• Trend following (longer holding periods) – trailing stops
• Maximum loss stop is for emergency protection only
• Stops hurt systems
39
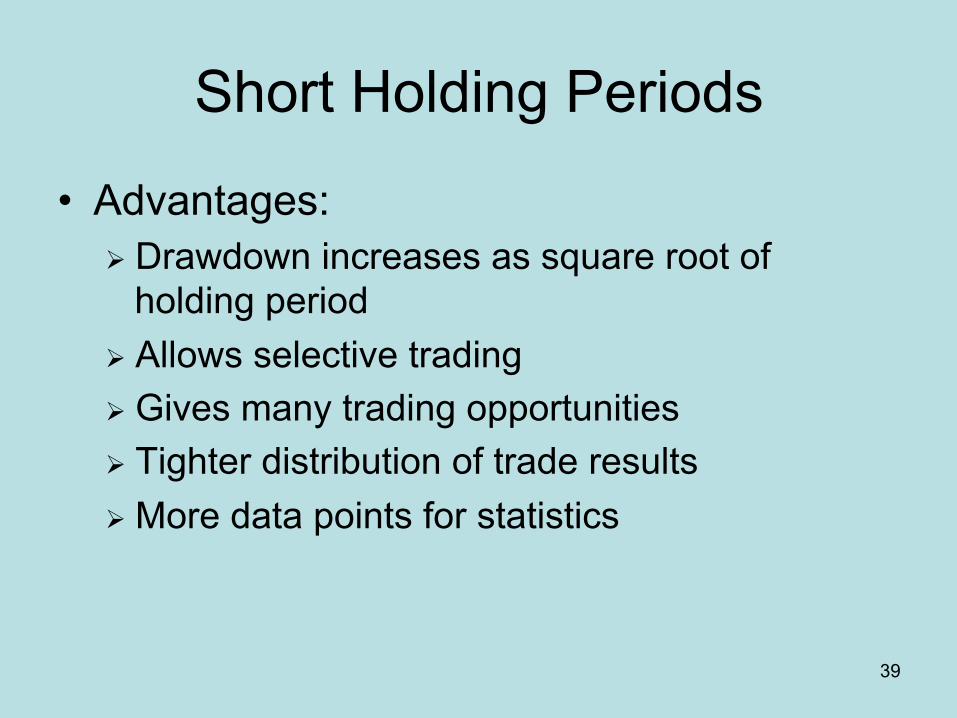
Short Holding Periods
• Advantages: Drawdown increases as square root of
holding period Allows selective trading Gives many trading opportunities Tighter distribution of trade results More data points for statistics
40
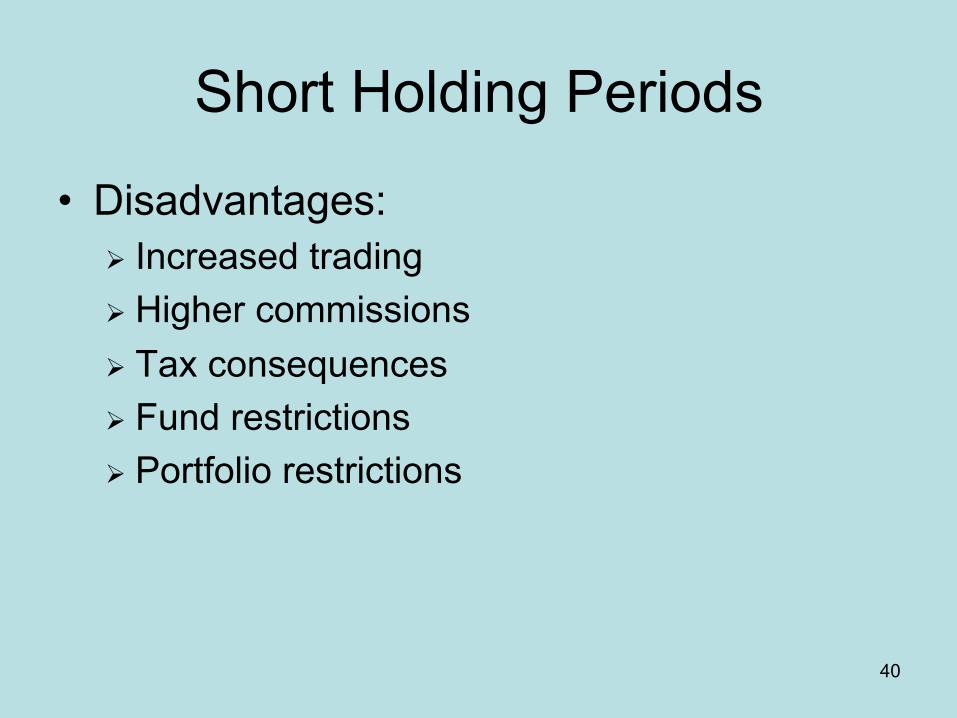
Short Holding Periods
• Disadvantages: Increased trading Higher commissions Tax consequences Fund restrictions Portfolio restrictions
41
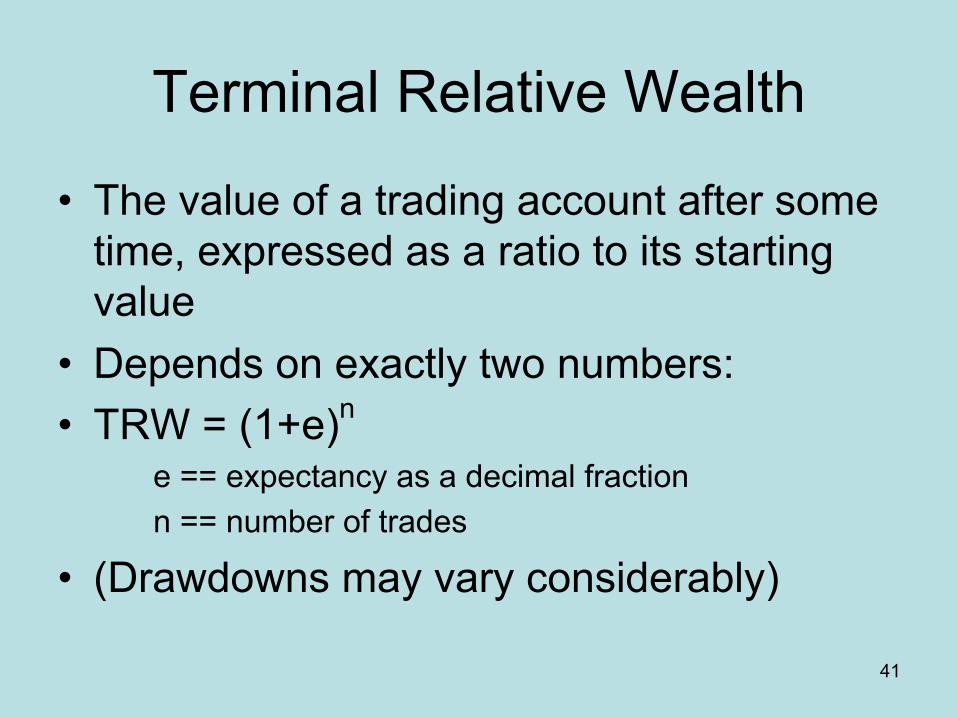
Terminal Relative Wealth
• The value of a trading account after some time, expressed as a ratio to its starting value
• Depends on exactly two numbers: • TRW = (1+e)n
e == expectancy as a decimal fraction n == number of trades
• (Drawdowns may vary considerably)

42
Code Signals First, Then Stops
• Begin by coding your entry • If you use more than one entry, test each
separately • Add your exit using logic appropriate for
the type of system • If you use more than one exit, test each
separately • Add stops only for protection
43
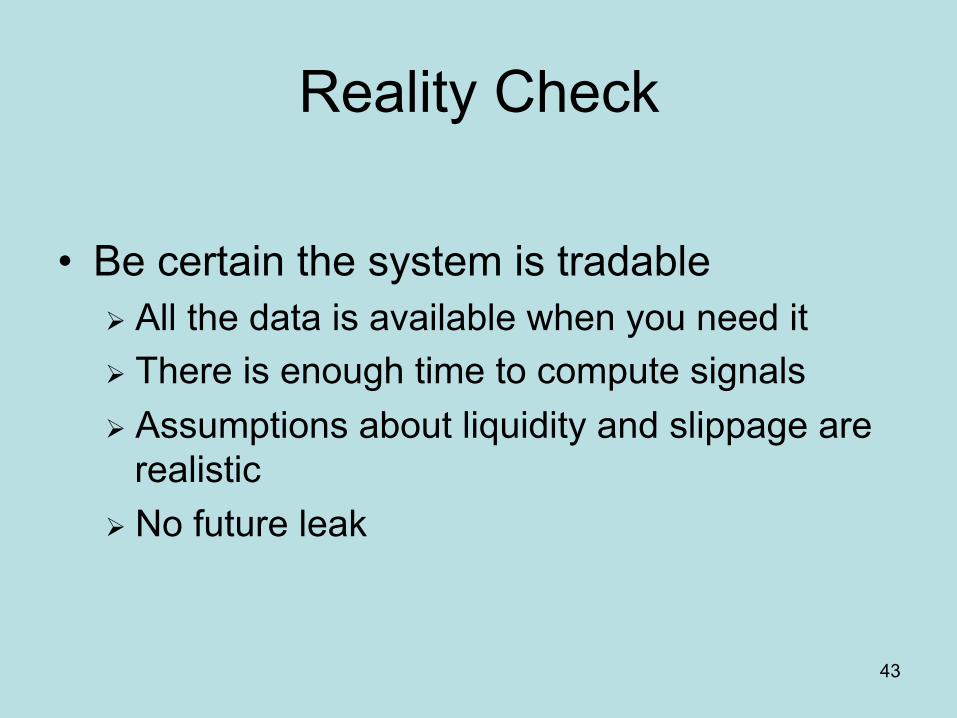
Reality Check
• Be certain the system is tradable All the data is available when you need it There is enough time to compute signals Assumptions about liquidity and slippage are
realistic No future leak
44
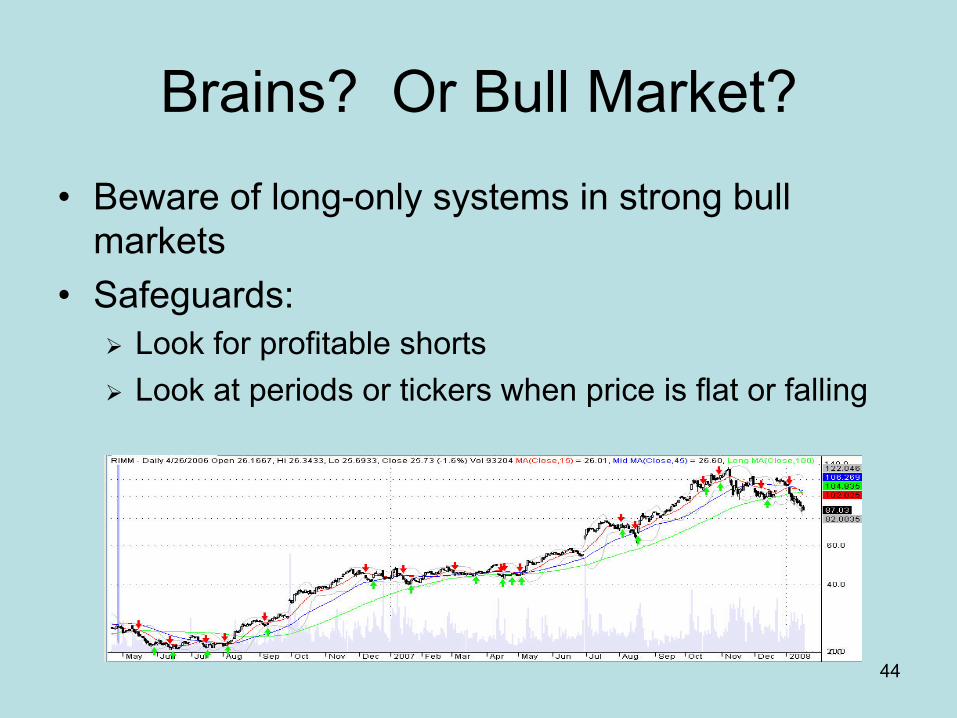
Brains? Or Bull Market?
• Beware of long-only systems in strong bull markets
• Safeguards: Look for profitable shorts Look at periods or tickers when price is flat or falling
45
Simulated Trading
• An automated series of: 1. Evaluate alternatives in-sample 2. Select the best alternative 3. Simulate trading out-of-sample
• Move forward in time and repeat steps 1, 2, and 3
• If out-of-sample results are satisfactory, trade the system

46
In-Sample
• In-sample – the period of time (and the data and trades associated with it) where the alternatives of logic and parameter values are evaluated
• In-sample results are always good • In-sample results have no value in
estimating the future performance of the system
47
Out-of-Sample
• Out-of-sample – the period of time (and the data and trades associated with it) where the trading system is tested on data it has never seen before
• Immediately follows the in-sample period • Caution – making decisions based on out-
of-sample data results in that data becoming part of the in-sample data
48
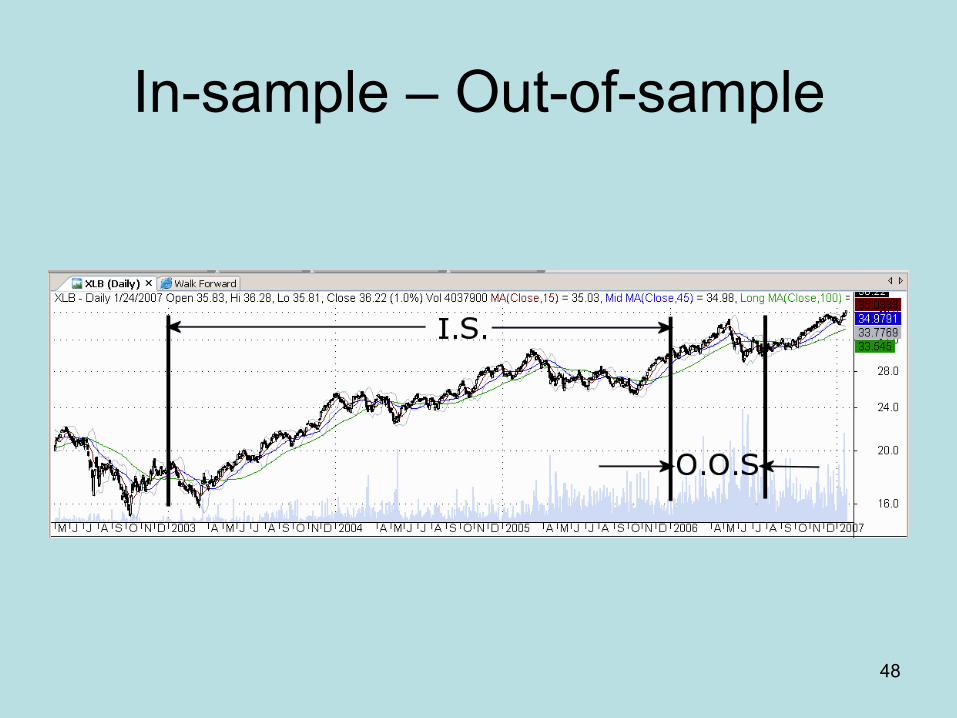
In-sample – Out-of-sample

49
In-sample Period Length
• How long should the in-sample period be? • Opinions include:
A long time period Pro: Include many different conditions Con: Cannot accurately model everything
A short time period Pro: Stay synchronized with current conditions Con: Learn noise instead of signal
• Experiment • My recommendation – as short as practical
50
Out-of-Sample Period Length
• As long as the model and the market remain in sync
• Unrelated to length of in-sample period
51
Optimization
• A search for the best values for logic and parameters
• Any time two or more alternatives are considered, you might as well consider thousands
• Rough runs to determine ranges • Thorough runs to locate maxima
52
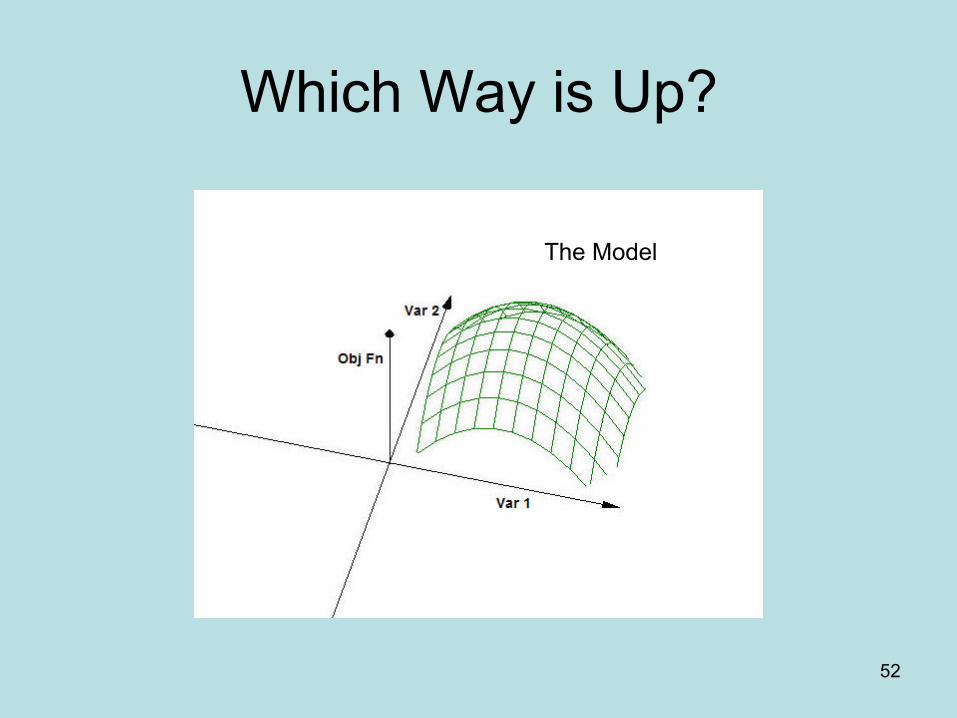
Which Way is Up?
The Model
53
How to Optimize
• One dimension at time Takes less time Can get stuck Finds local maxima
• Multiple dimensions Exhaustive search Long runs Detect interactions and global maxima
• Use preliminary runs to select the range
54
Reoptimization
• Length of out-of-sample period determines reoptimization schedule
• You may reoptimize at any time
55
Degrees of Freedom
• Every data point contributes one degree of freedom
• Every alternative considered uses up one degree of freedom
• Curve-fit or over-fit means there are no degrees of freedom left over
56
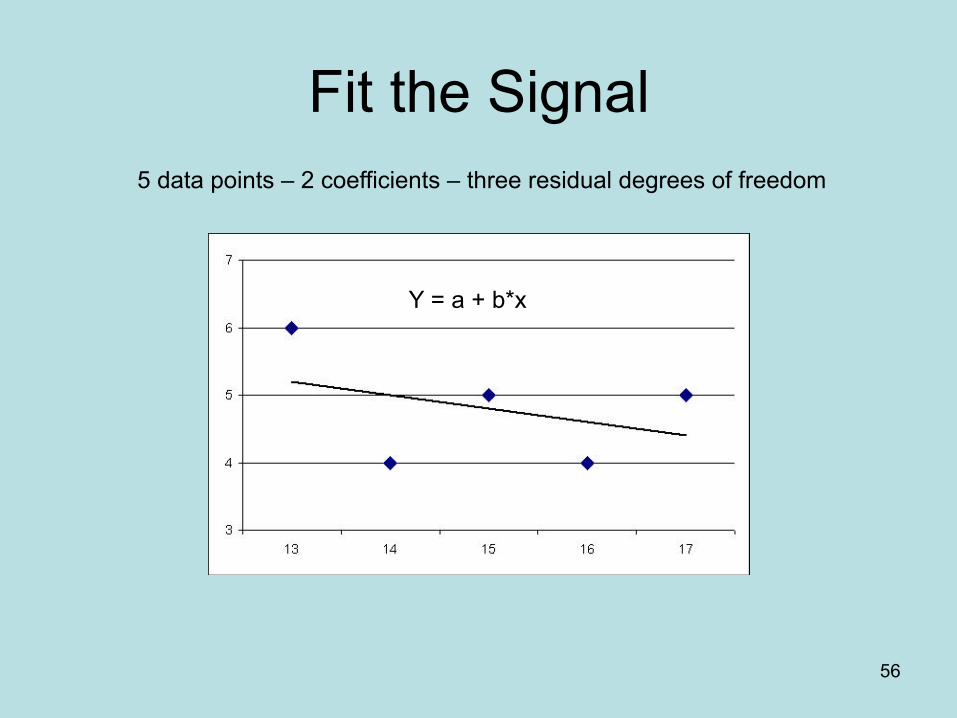
Fit the Signal 5 data points – 2 coefficients – three residual degrees of freedom
Y = a + b*x
57
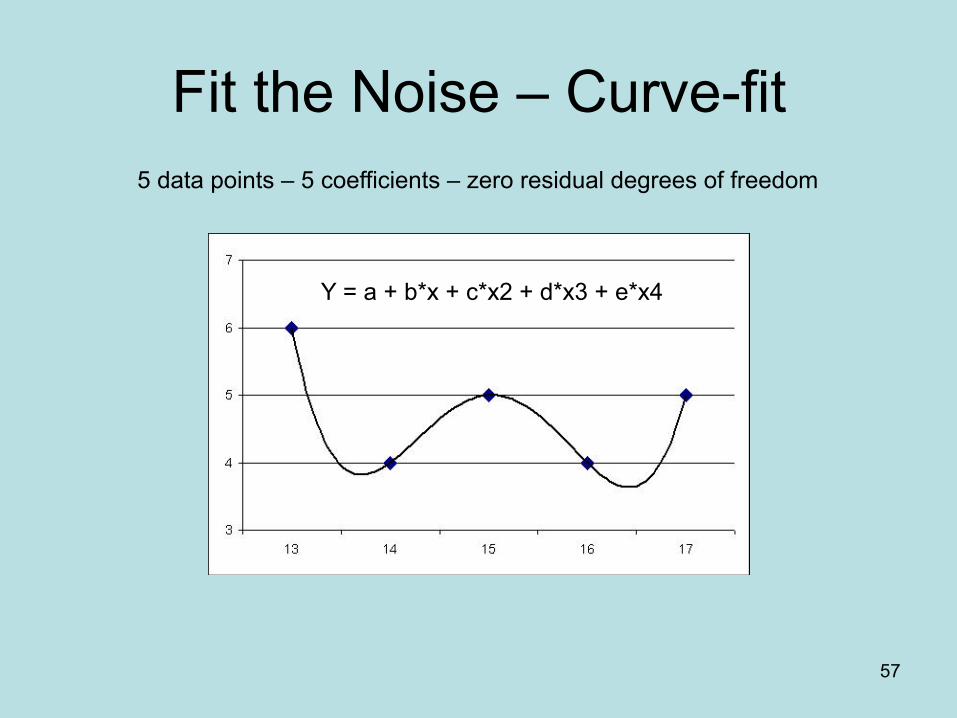
Fit the Noise – Curve-fit 5 data points – 5 coefficients – zero residual degrees of freedom
Y = a + b*x + c*x2 + d*x3 + e*x4
58
Walk Forward
• A sequence of steps, each consisting of optimizing over an in-sample period and testing over an out-of-sample period
• Automatically, advancing dates each step: Optimize in-sample Choose best Test out-of-sample
• Accumulate out-of-sample results • Best chosen strictly by objective function
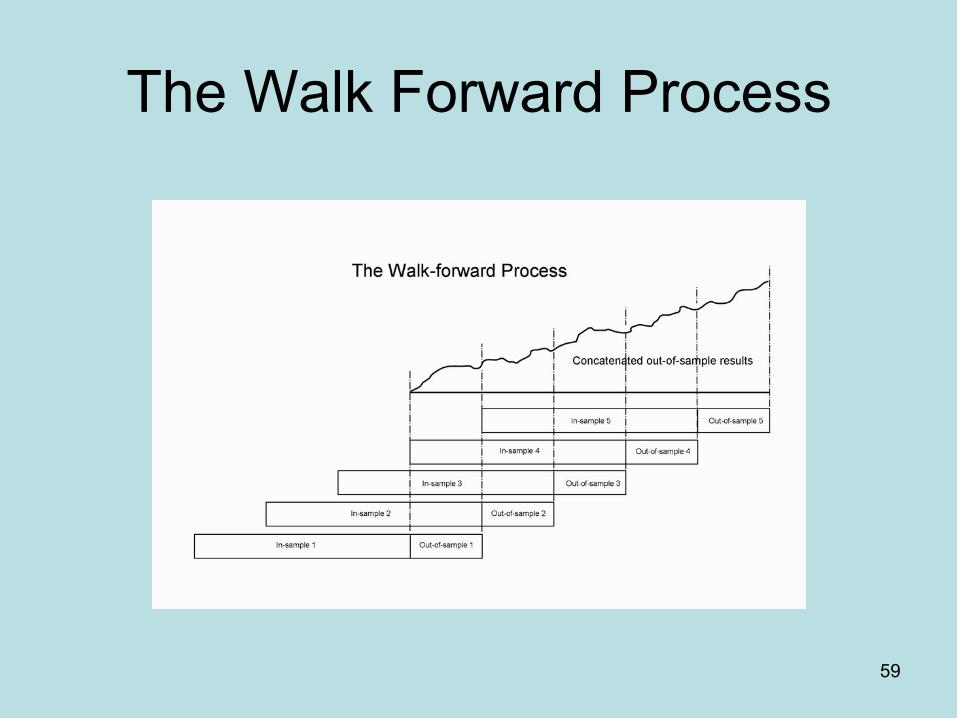
59
The Walk Forward Process
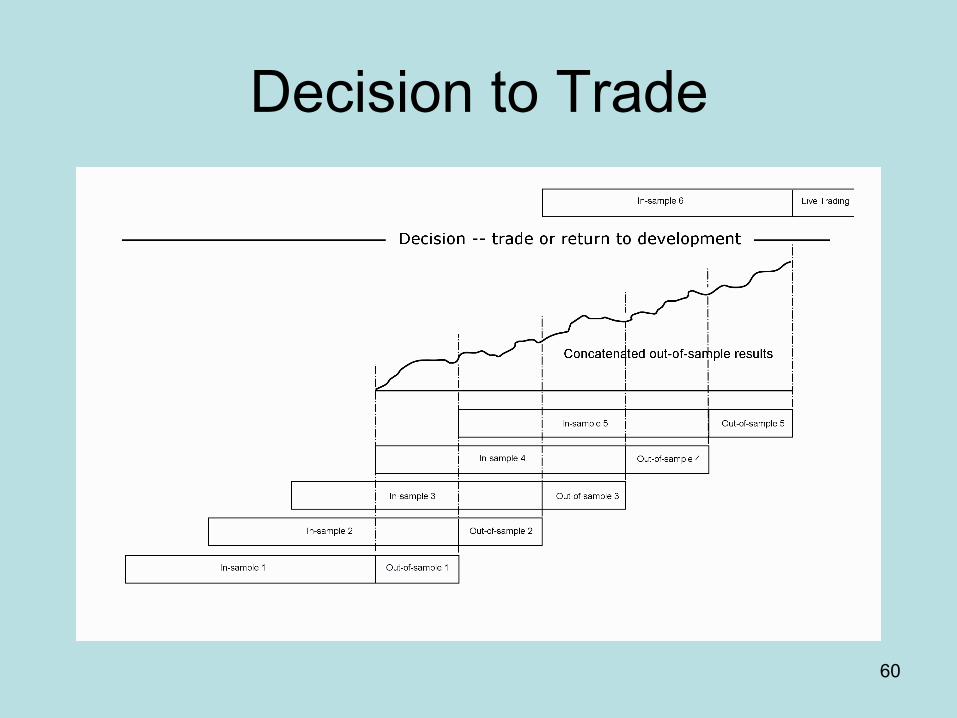
60
Decision to Trade

61
Validation
• Evaluate out-of-sample results • Decide whether to trade the system or not
• Out-of-sample results indicate how the system will react to various conditions
• In-sample results have no value in determining the likely profitability of the system
62
Trading
• Next Day Open (NDO) Update data after close Compute signals in evening
• Trade on Close of signal bar Real time data feed Compute price ahead Anticipate signals

63
Monitor Results
• Compare real time results with out-of-sample test results
• All systems fail • Use statistical tests to determine if the
system is broken • Use statistical process control techniques,
if possible • When to reoptimize
64
5 Wins in a Row – Now What?
• After a long string of winning trades, do you change anything?
• Probably not Your system and the market are in sync This is just what you hoped for, stay with it Do not penalize good results
65
4 Losses in a Row – Now What?
• Review the trade statistics from your out-of-sample runs.
• What is the typical ratio of winning trades to losing trades?
• Is this unusual? • Use the runs test for a statistical answer • Or use the binomial distribution
66
The Binomial Distribution
• Assume your out-of-sample shows 60% winners, 40% losers
• The probability of any trade being a loser is 0.40
• The probability of two successive losers is 0.40 * 0.40 = 0.16 Expect this regularly
• Three losers in a row = 0.064 Start to worry • Four losers in a row = 0.0256 It is broken
67
Practical Implementation
68
Everything You Need
• Everything you need is available today
• AmiBroker trading system development platform
• Any end-of-day and most real-time data sources
• Quotes Plus is a good data vendor
69
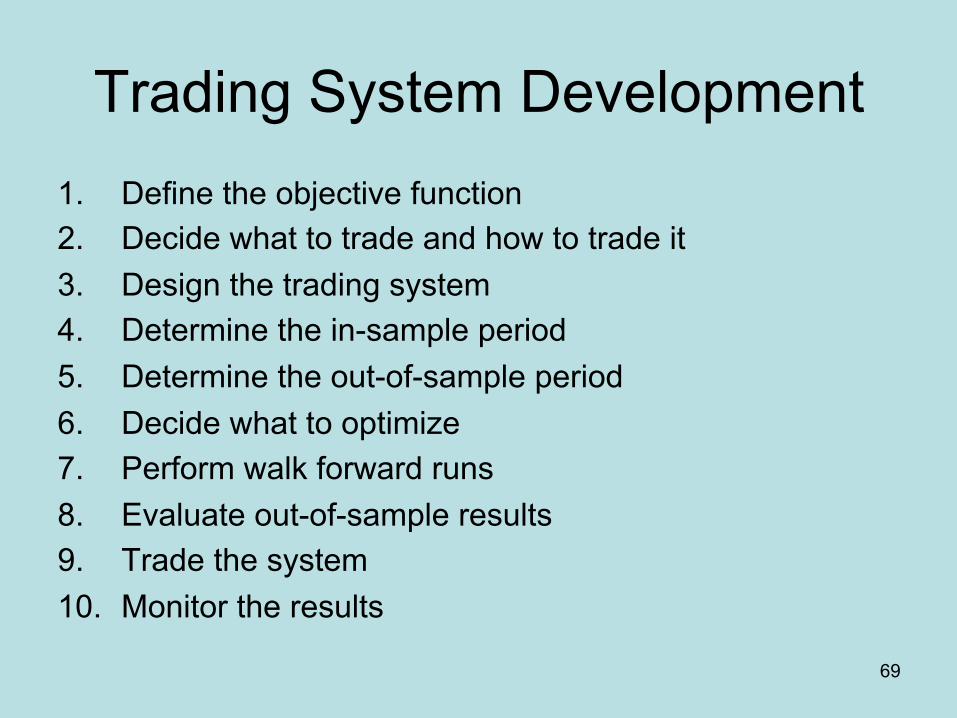
Trading System Development 1. Define the objective function 2. Decide what to trade and how to trade it 3. Design the trading system 4. Determine the in-sample period 5. Determine the out-of-sample period 6. Decide what to optimize 7. Perform walk forward runs 8. Evaluate out-of-sample results 9. Trade the system 10. Monitor the results
70
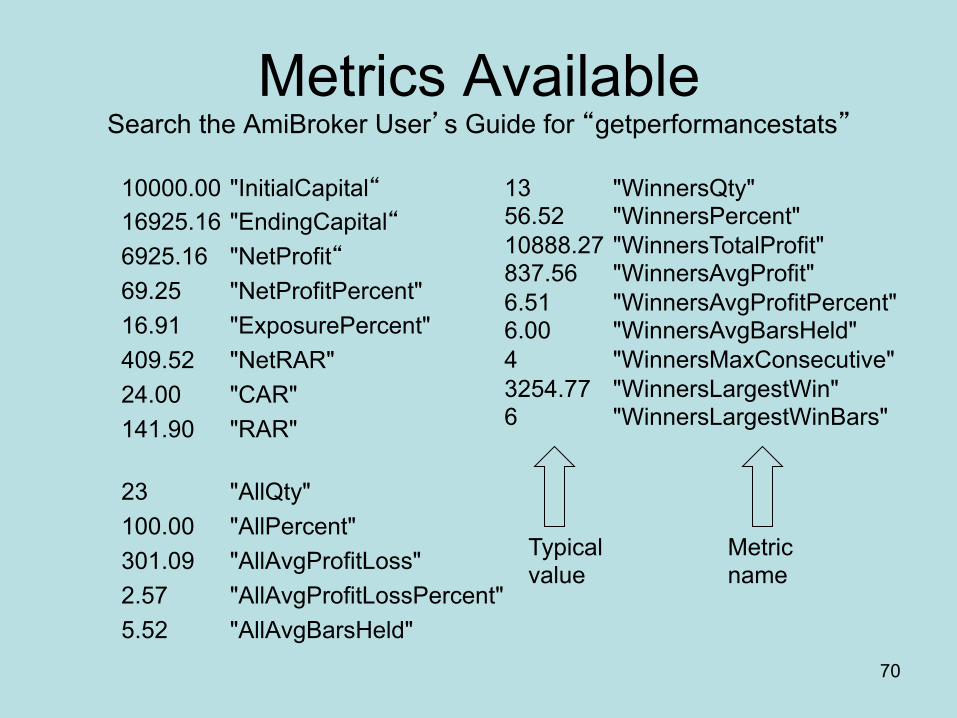
Metrics Available Search the AmiBroker User’s Guide for “getperformancestats”
10000.00 "InitialCapital“ 16925.16 "EndingCapital“ 6925.16 "NetProfit“ 69.25 "NetProfitPercent" 16.91 "ExposurePercent" 409.52 "NetRAR" 24.00 "CAR" 141.90 "RAR"
23 "AllQty" 100.00 "AllPercent" 301.09 "AllAvgProfitLoss" 2.57 "AllAvgProfitLossPercent" 5.52 "AllAvgBarsHeld"
13 "WinnersQty" 56.52 "WinnersPercent" 10888.27 "WinnersTotalProfit" 837.56 "WinnersAvgProfit" 6.51 "WinnersAvgProfitPercent" 6.00 "WinnersAvgBarsHeld" 4 "WinnersMaxConsecutive" 3254.77 "WinnersLargestWin" 6 "WinnersLargestWinBars"
Metric name
Typical value

71
Metrics Available 10 "LosersQty" 43.48 "LosersPercent" -3963.11 "LosersTotalLoss" -396.31 "LosersAvgLoss" -2.55 "LosersAvgLossPercent" 4.90 "LosersAvgBarsHeld" , 2 "LosersMaxConsecutive" -1210.84 "LosersLargestLoss" 4 "LosersLargestLossBar"
-1707.12 "MaxTradeDrawdown“ -11.66 "MaxTradeDrawdownPercent" -2071.76 "MaxSystemDrawdown" -13.80 "MaxSystemDrawdownPercent" 3.34 "RecoveryFactor" 1.74 "CAR/MDD" 10.28 "RAR/MDD" 2.75 "ProfitFactor" 2.11 "PayoffRatio“ 883.56 "StandardError“ 3.39 "RRR“ 5.37 "UlcerIndex" 3.46 "UlcerPerformanceIndex" 2.31 "SharpeRatio“ 0.0967 "KRatio"
72
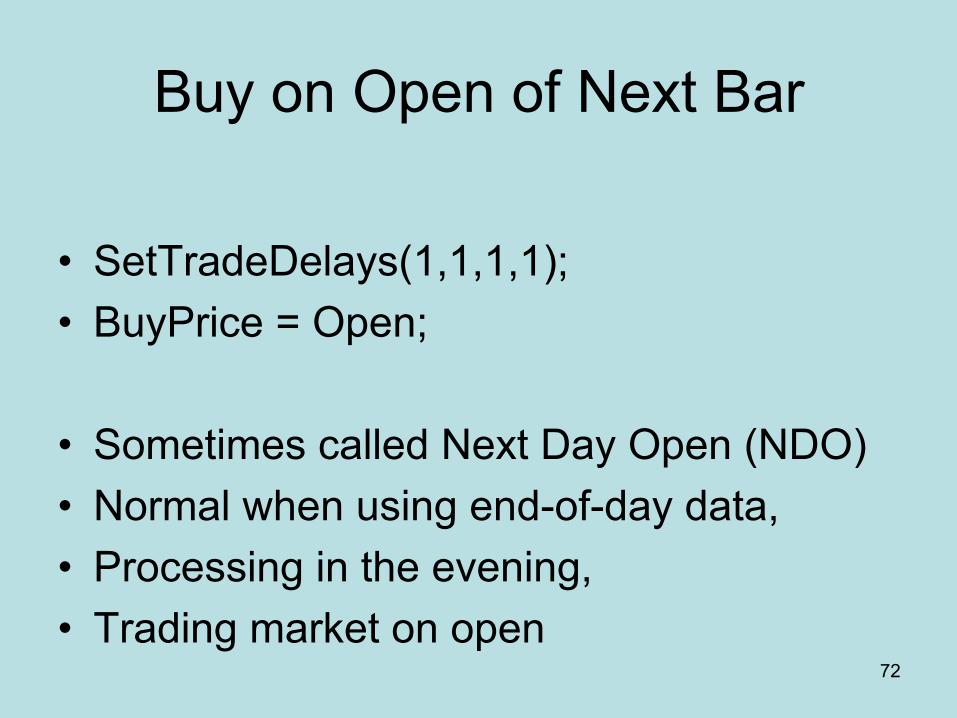
Buy on Open of Next Bar
• SetTradeDelays(1,1,1,1); • BuyPrice = Open;
• Sometimes called Next Day Open (NDO) • Normal when using end-of-day data, • Processing in the evening, • Trading market on open
73
Buy on Close of Current Bar
• SetTradeDelays(0,0,0,0); • BuyPrice = Close;
• Often the best entry • Must anticipate the signal
74
Designing Entries
• Start with an indicator Pick an entry method Hold 2 days
--- or ---
• Start with desirable result Identify good entry points Look for leading indicators

75
Lag
• Lag makes entries late • Low lag indicators:
AMA Zero Lag MACD Regression
• Zero lag indicators: Patterns Statistics Seasonality

76
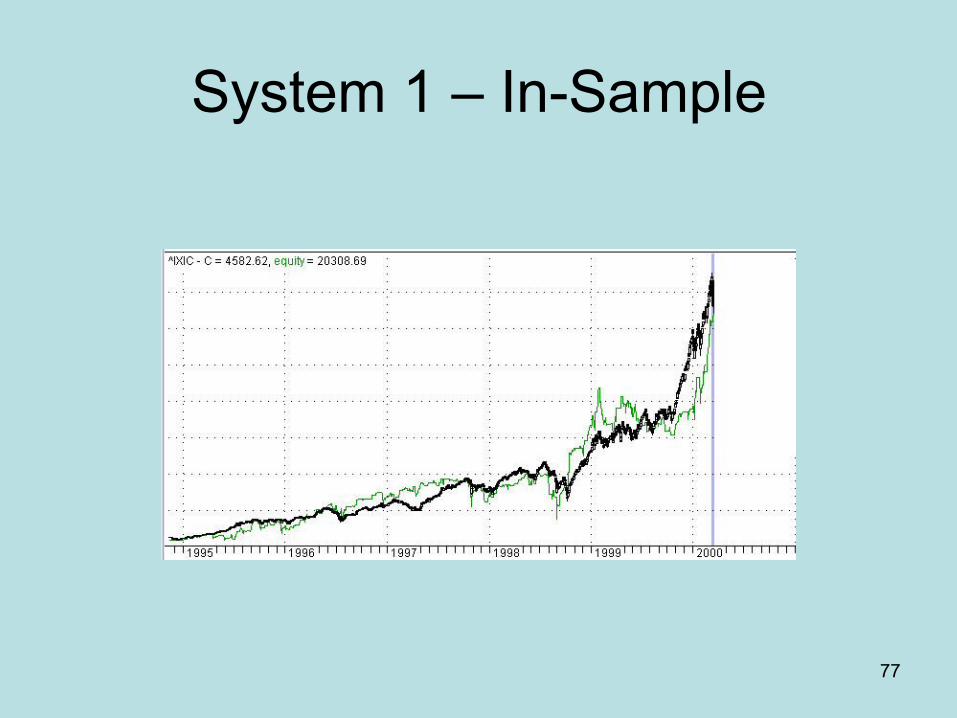
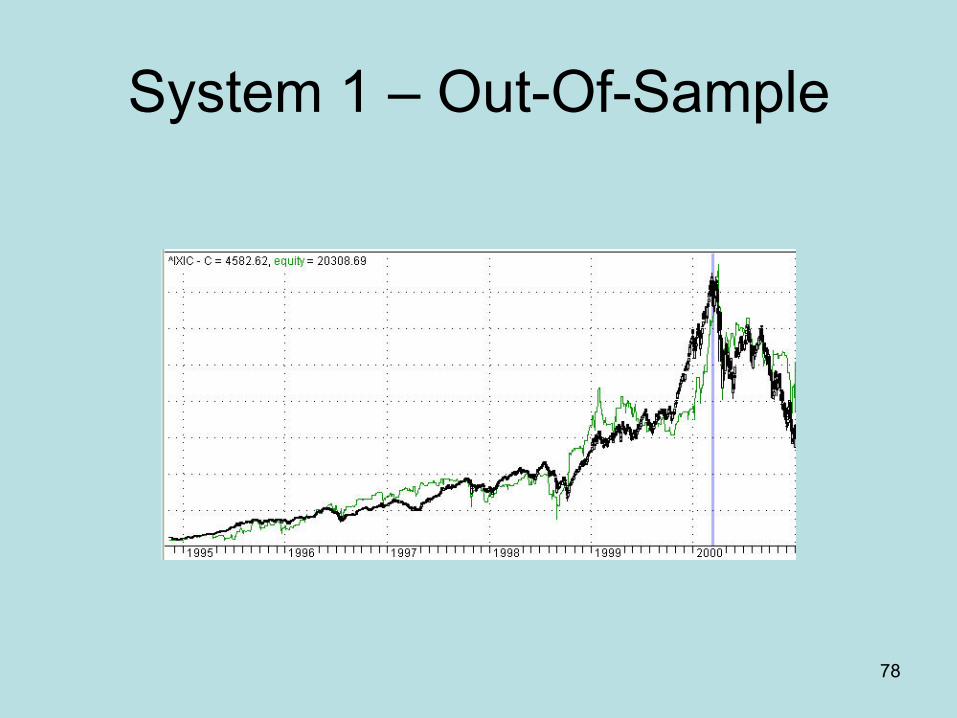
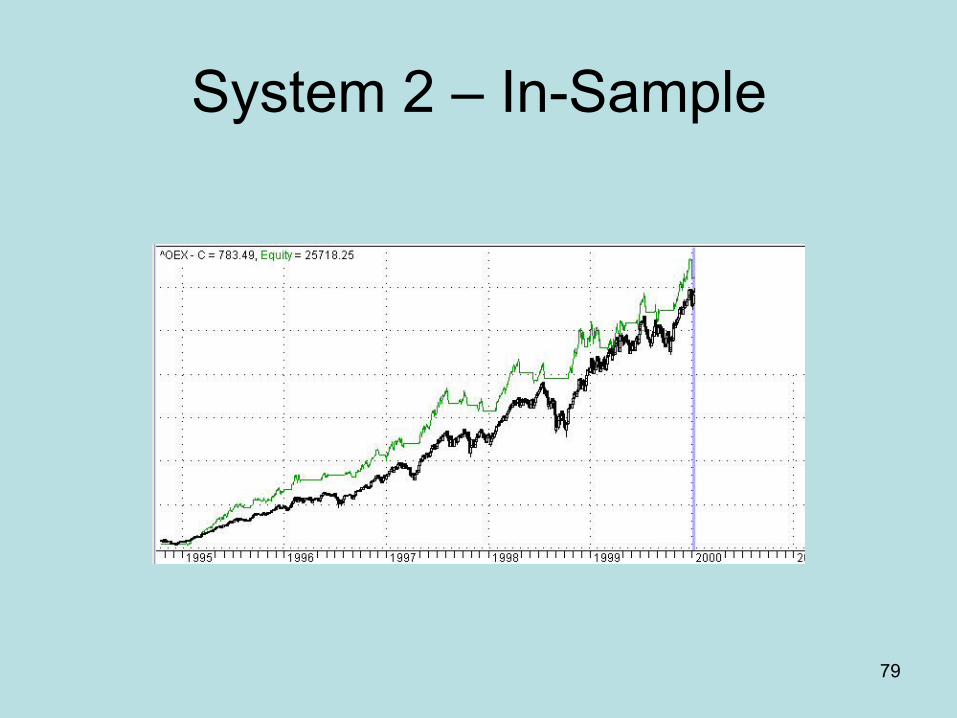
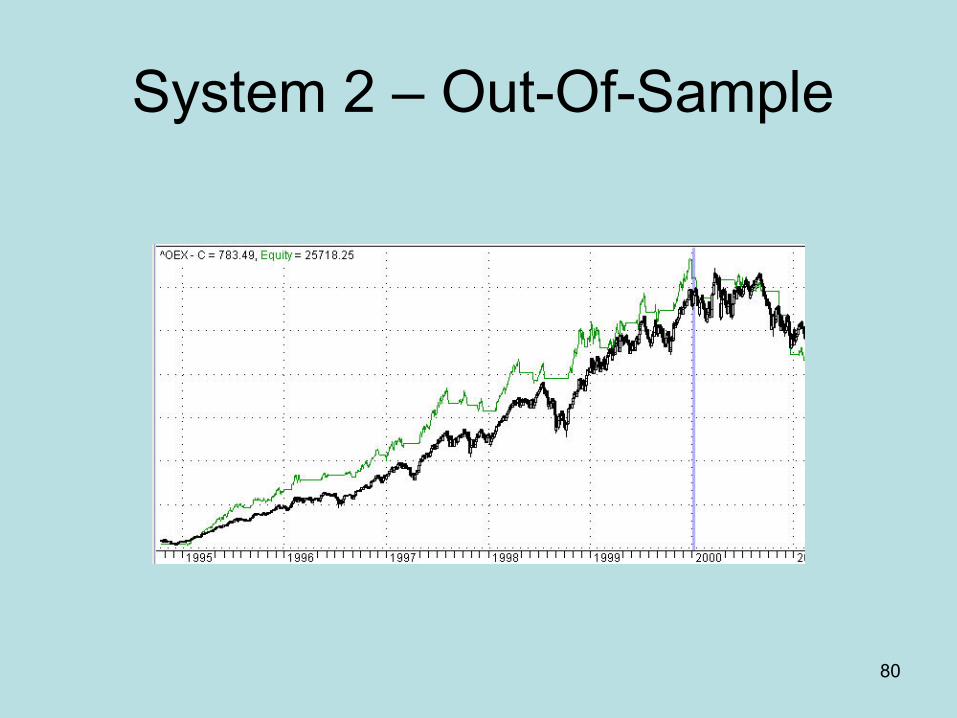
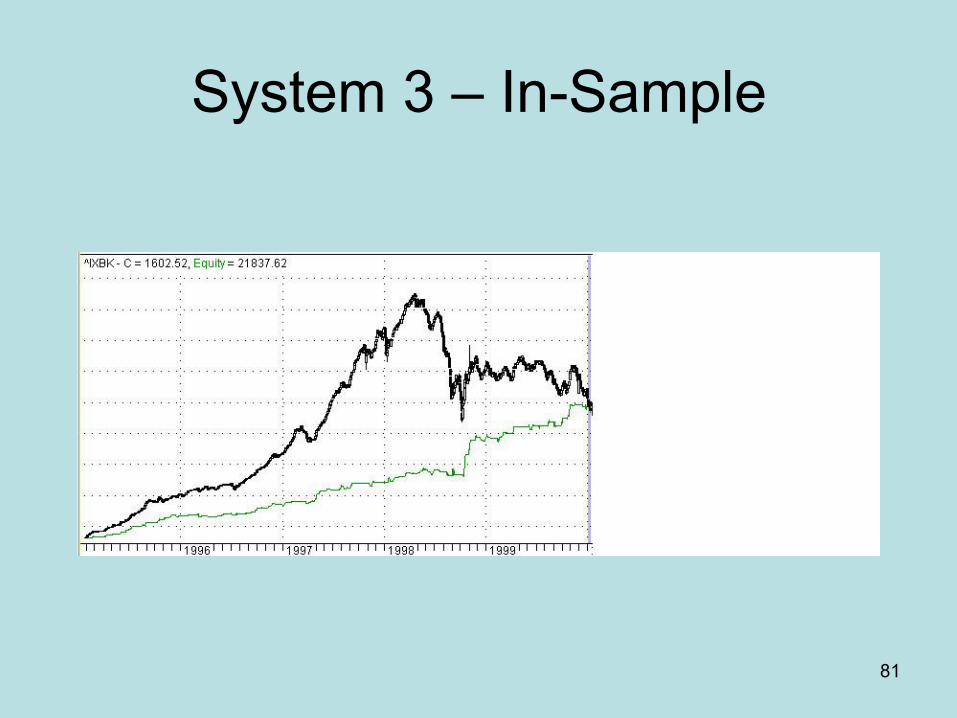
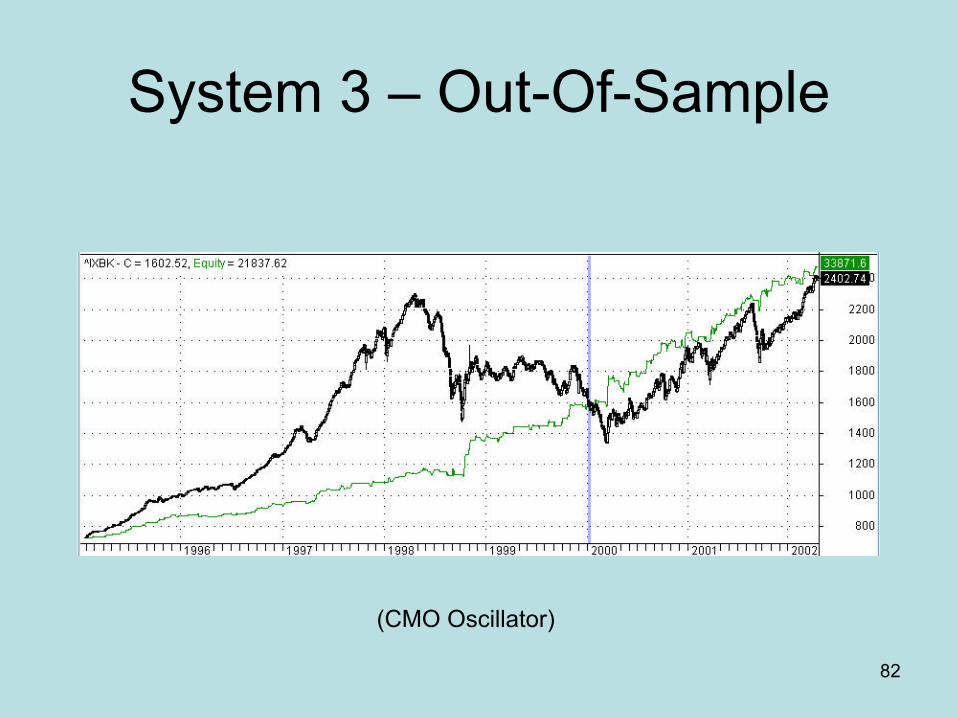
Be Wary of In-sample Results
• The next few slides illustrate the in-sample and out-of-sample results of several systems
• It is impossible to tell whether results are in-sample or out-of-sample without performing the validation yourself
77
System 1 – In-Sample
78
System 1 – Out-Of-Sample
79
System 2 – In-Sample
80
System 2 – Out-Of-Sample
81
System 3 – In-Sample
82
System 3 – Out-Of-Sample
(CMO Oscillator)
83
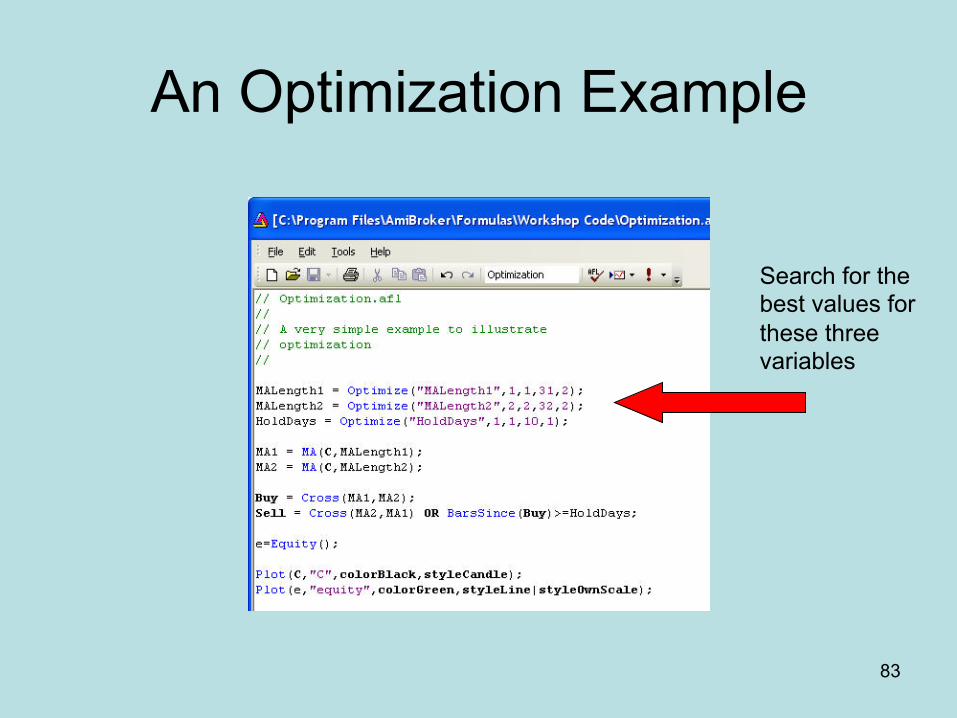
An Optimization Example
Search for the best values for these three variables
84
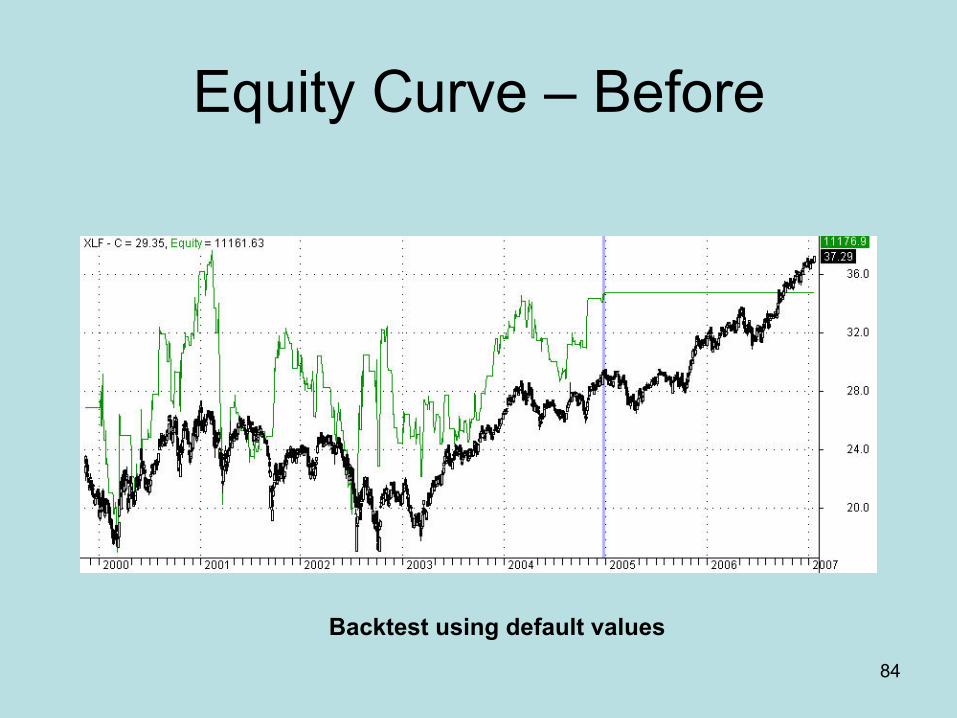
Equity Curve – Before
Backtest using default values
85
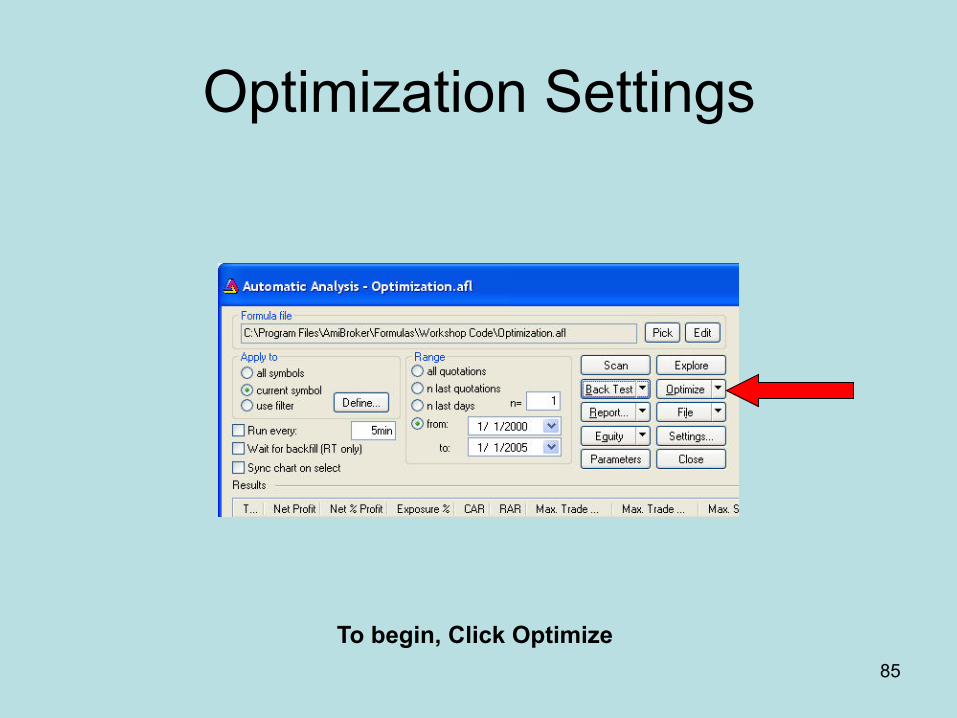
Optimization Settings
To begin, Click Optimize
86
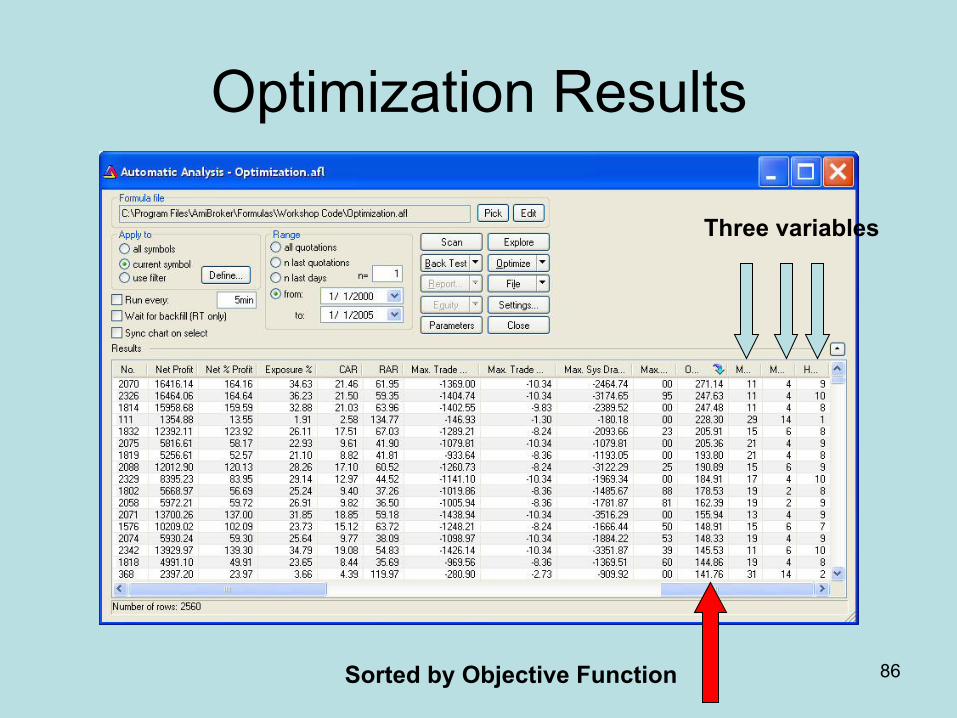
Optimization Results
Sorted by Objective Function
Three variables
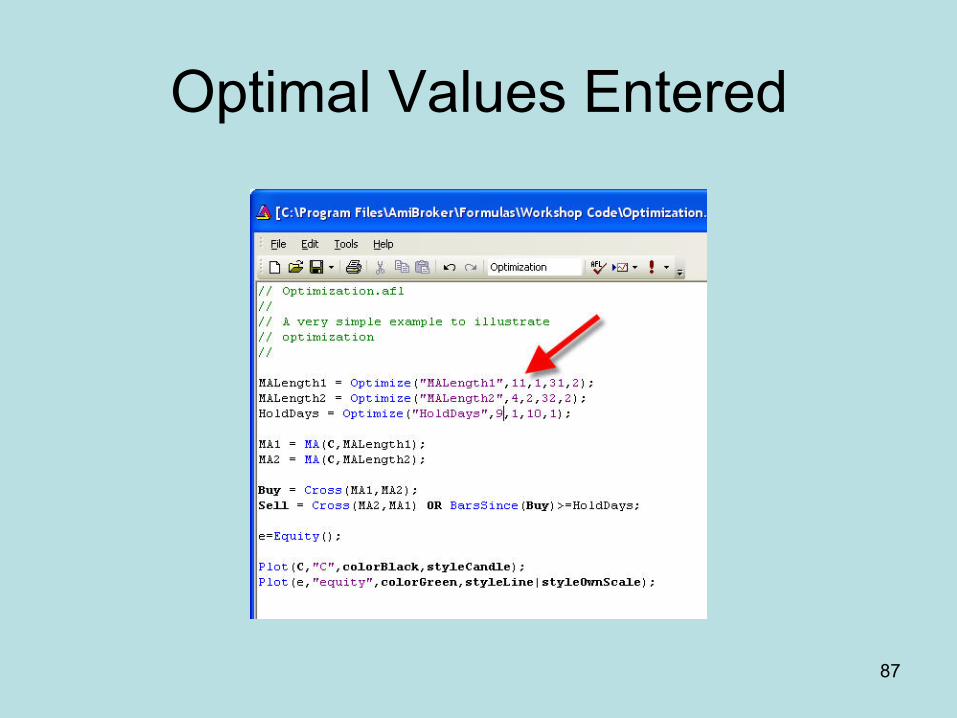
87
Optimal Values Entered

88
Equity Curve – After
This is In-Sample, and it looks good

89
Settings to Test OOS
Set “to” date later
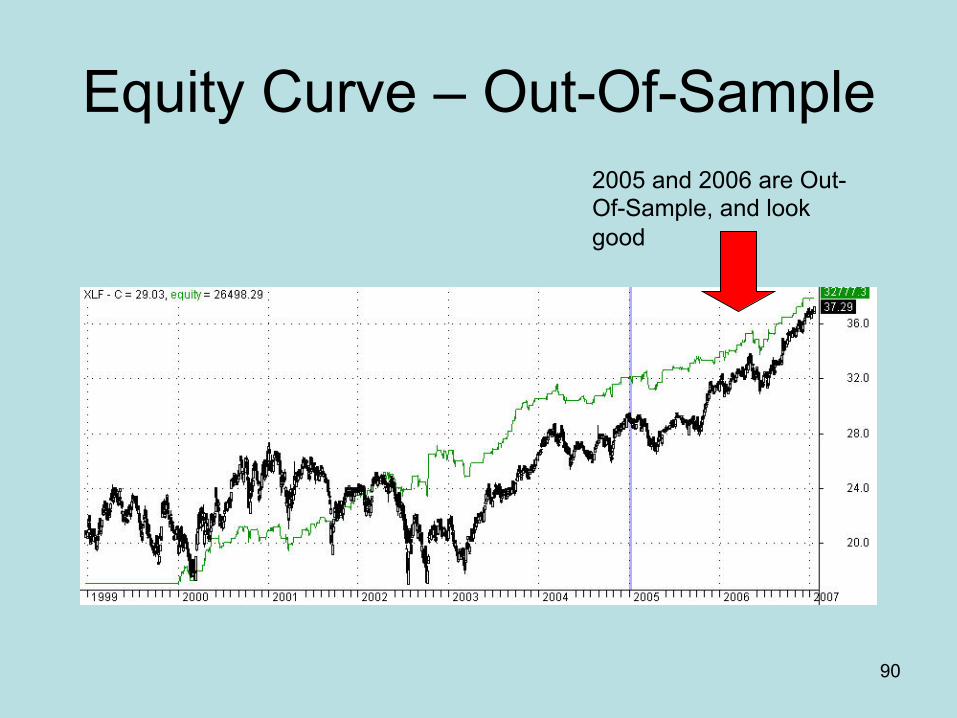
90
Equity Curve – Out-Of-Sample 2005 and 2006 are Out-Of-Sample, and look good
91
Walk Forward Example
• AmiBroker has native walk forward testing from Version 5.05
92
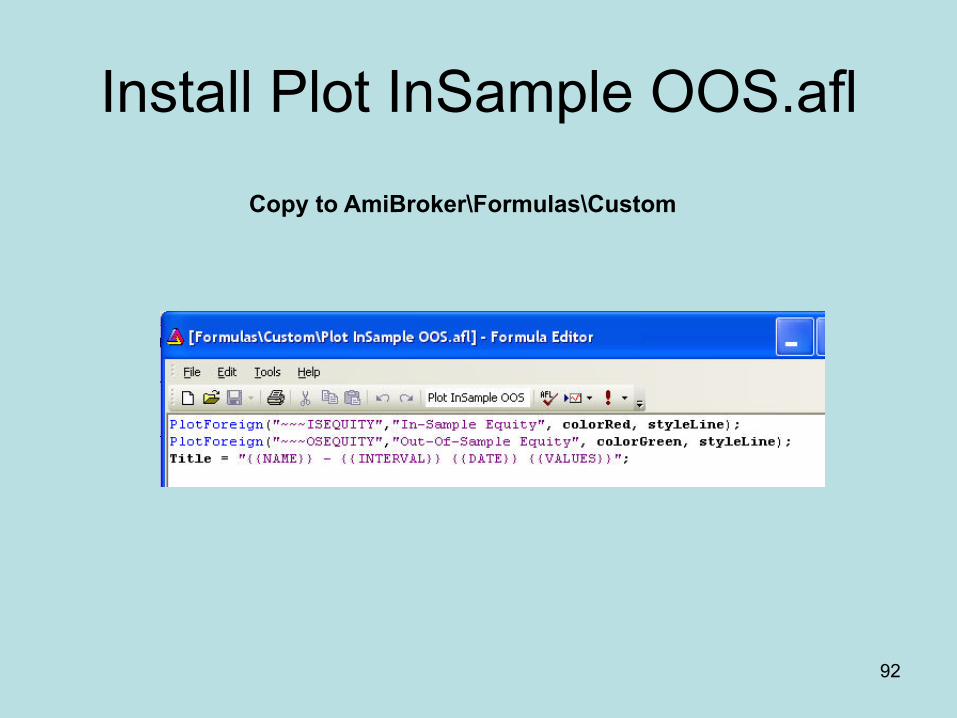
Install Plot InSample OOS.afl
Copy to AmiBroker\Formulas\Custom
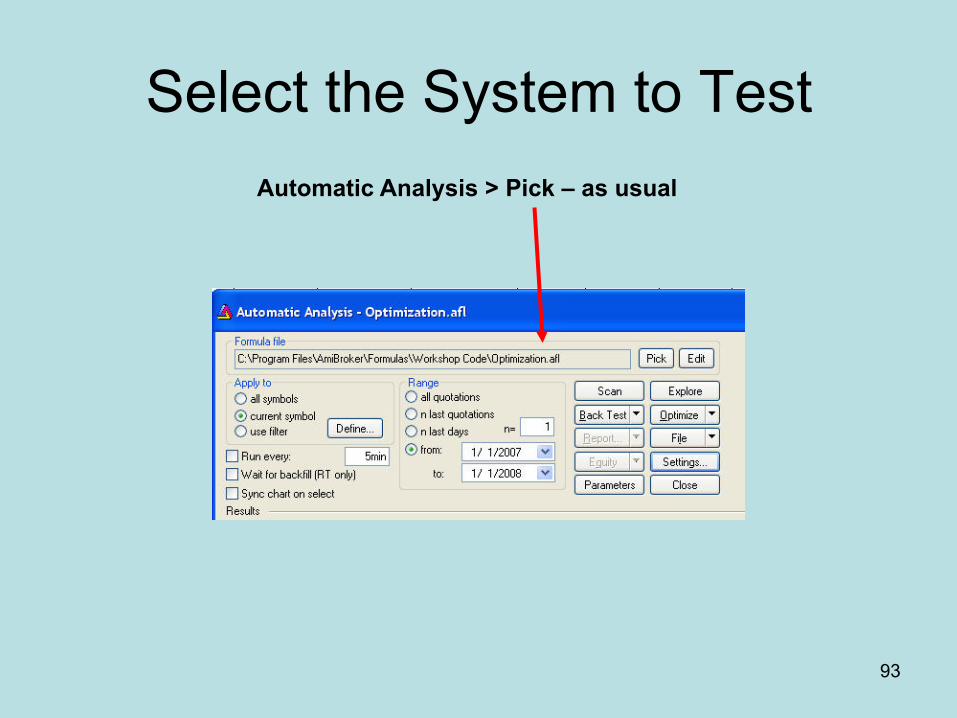
93
Select the System to Test Automatic Analysis > Pick – as usual

94
Note Optimization Statements

95
Settings
Settings
Walk Forward
Set Dates
Select Objective
OK
96
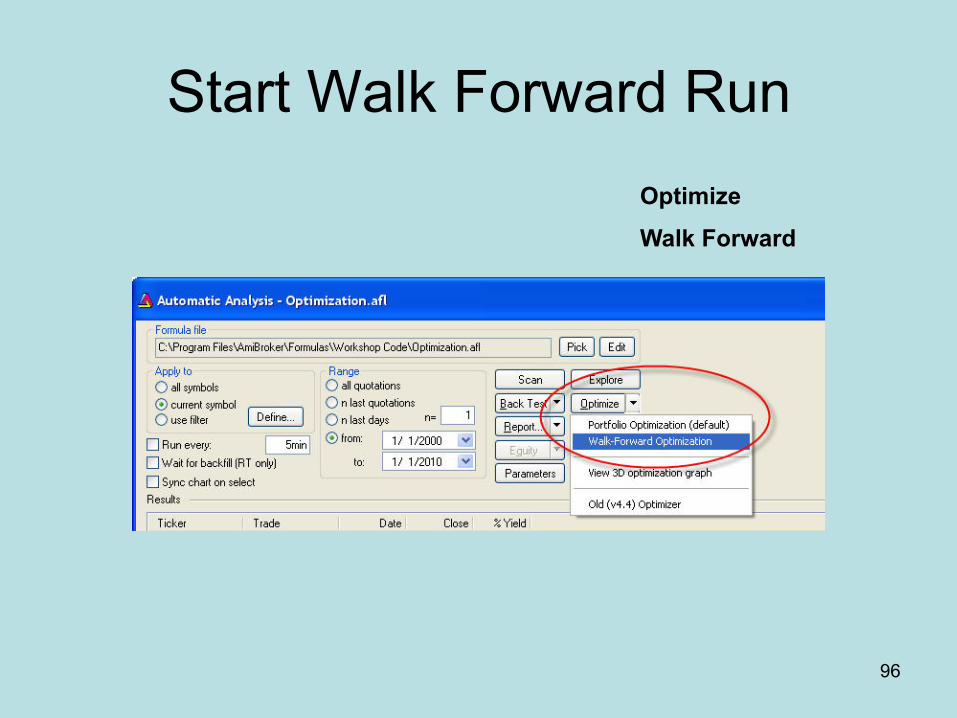
Start Walk Forward Run Optimize
Walk Forward
97
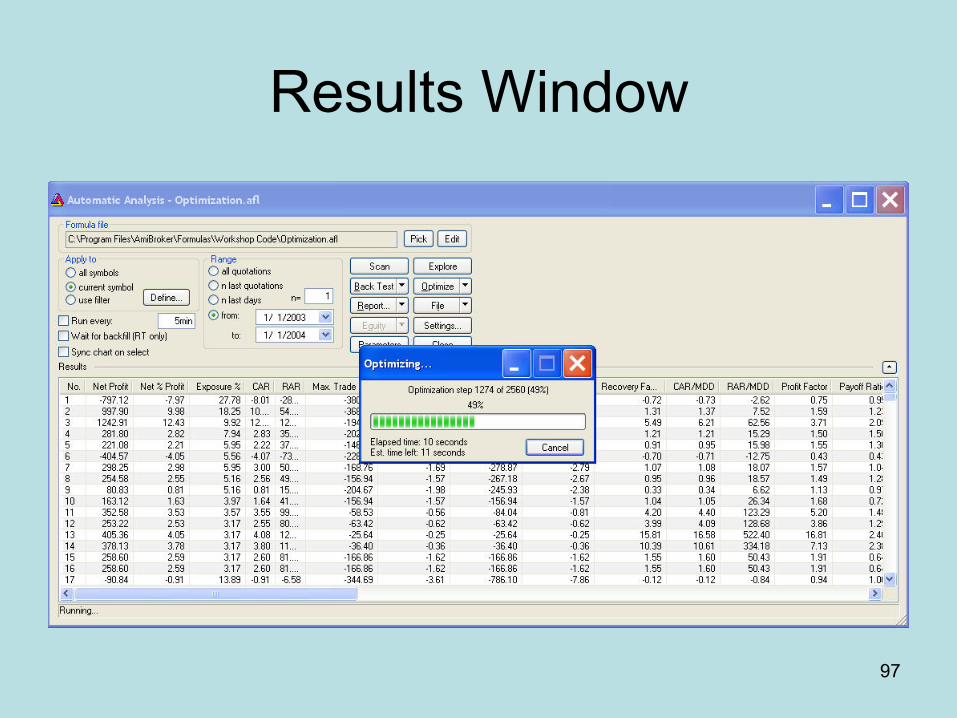
Results Window

98
Two Tabs Minimize “Optimizing” window to reveal these
99
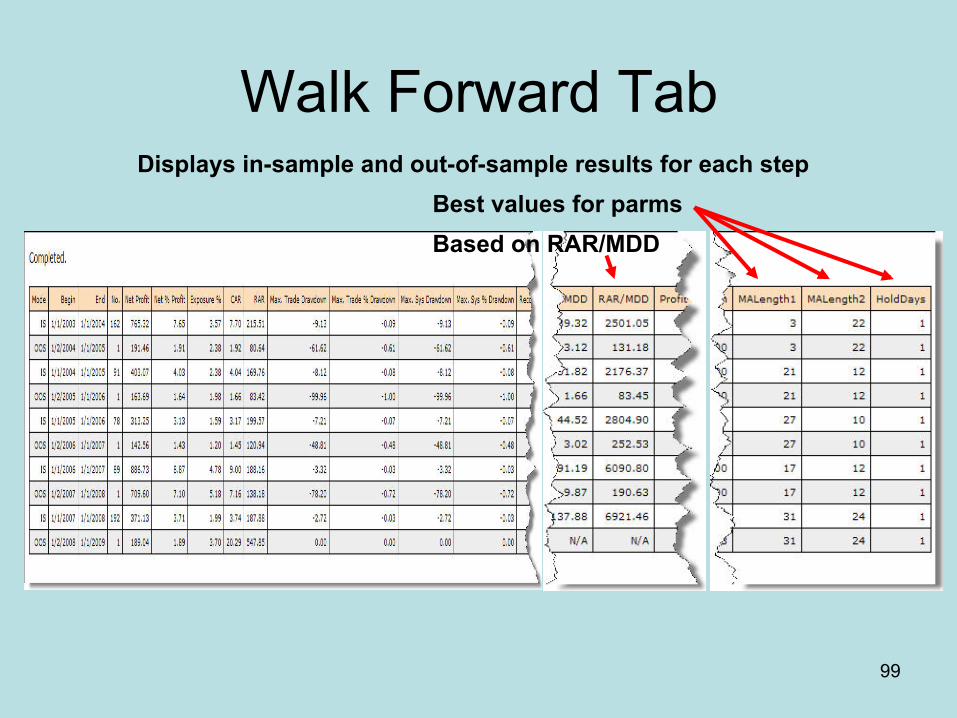
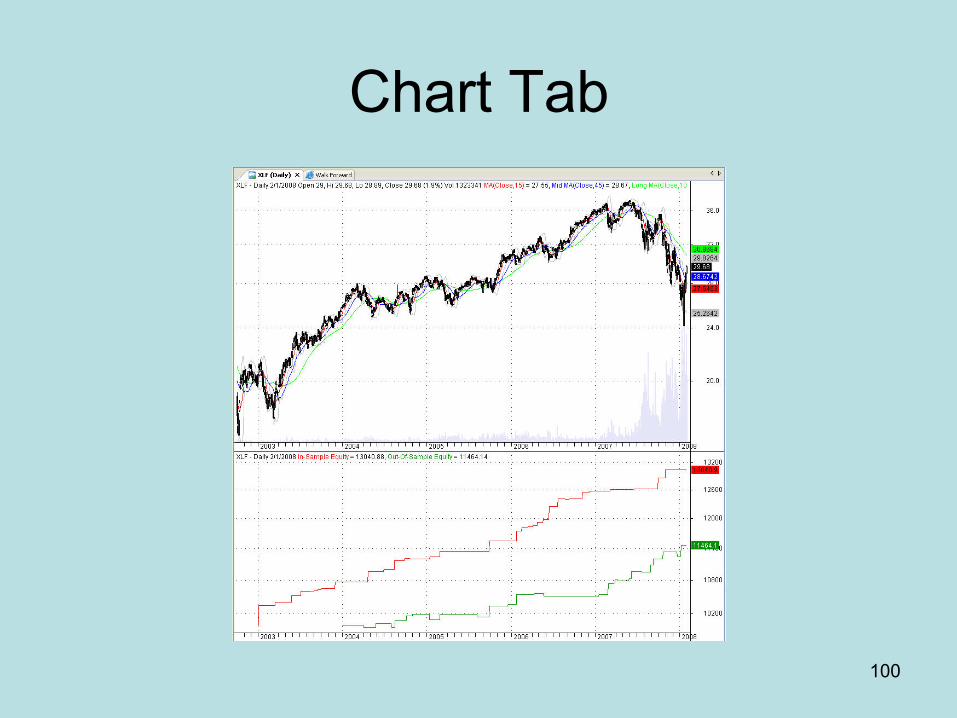
Walk Forward Tab Displays in-sample and out-of-sample results for each step
Best values for parms Based on RAR/MDD
100
Chart Tab

101
I.S. and O.O.S. Equity Curves

102
Just for NAAIM
A system using weekly data
103
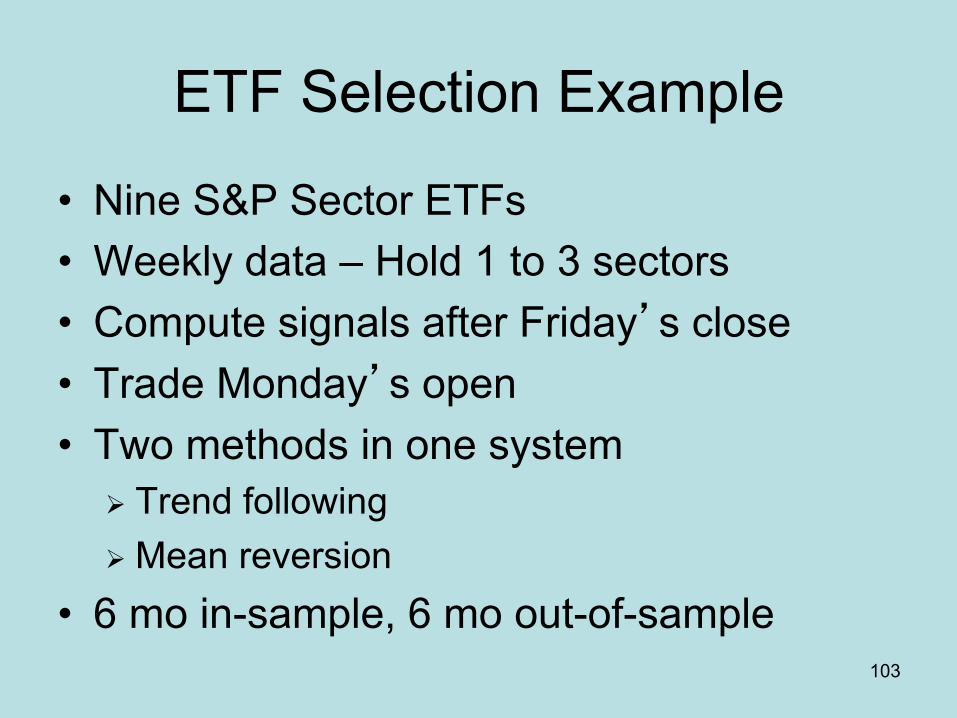
ETF Selection Example
• Nine S&P Sector ETFs • Weekly data – Hold 1 to 3 sectors • Compute signals after Friday’s close • Trade Monday’s open • Two methods in one system
Trend following Mean reversion
• 6 mo in-sample, 6 mo out-of-sample
104
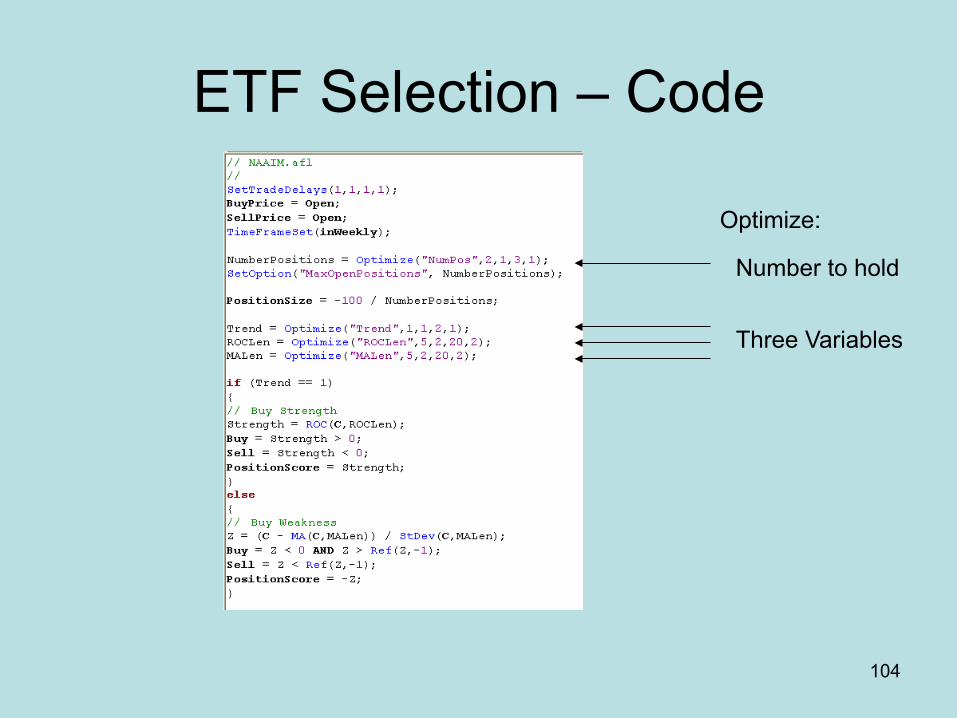
ETF Selection – Code
Three Variables
Optimize:
Number to hold

105
ETF Selection – Walk forward
106
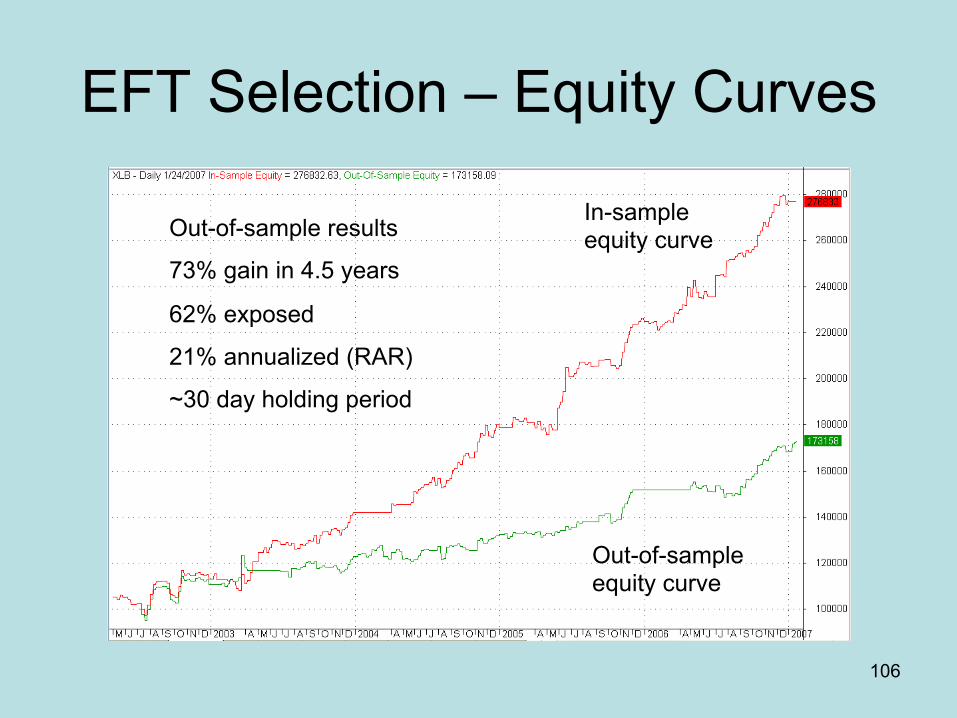
EFT Selection – Equity Curves
Out-of-sample equity curve
In-sample equity curve Out-of-sample results
73% gain in 4.5 years
62% exposed
21% annualized (RAR)
~30 day holding period
107
How to Build an Effective Trading System
(and Build Confidence that It Will Be Profitable)

108
Trading System Development 1. Define the objective function 2. Decide what to trade and how to trade it 3. Design the trading system 4. Determine the in-sample period 5. Determine the out-of-sample period 6. Decide what to optimize 7. Perform walk forward runs 8. Evaluate out-of-sample results 9. Trade the system 10. Monitor the results

109
Questions and Comments
110
Quantitative Trading Systems • Expands on topics
presented today • Subtitled “Practical
Methods for Design, Testing, and Validation”
• Published in 2007 • Very well received • Shipped to over 35
countries
111
Contact Information
• To discuss or schedule a seminar, workshop, custom programming, or consulting:
• Dr. Howard B. Bandy • (520) 705-1239 (cell) • [email protected]
112
Resources
• AmiBroker www.amibroker.com • Quotes Plus www.quotes-plus.com • Quantitative Trading Systems
www.quantitativetradingsystems.com
• www.quantitativetradingsystems.com/resources

113
The End


![[ITA] Trading System](https://img.pdfslide.net/doc/110x75/55cf9d6d550346d033ad949e/ita-trading-system.jpg)