Embed Size (px)
Citation preview
How to Do a Strategic Analysis
Dr. Stan Abraham2009-10

What Is Strategic Analysis?
One person’s or one group’s attempt at arriving at a strategy and key strategic decisions for a company– For example, vision statement, objectives,
and key programs– An essential precursor to strategic
planning
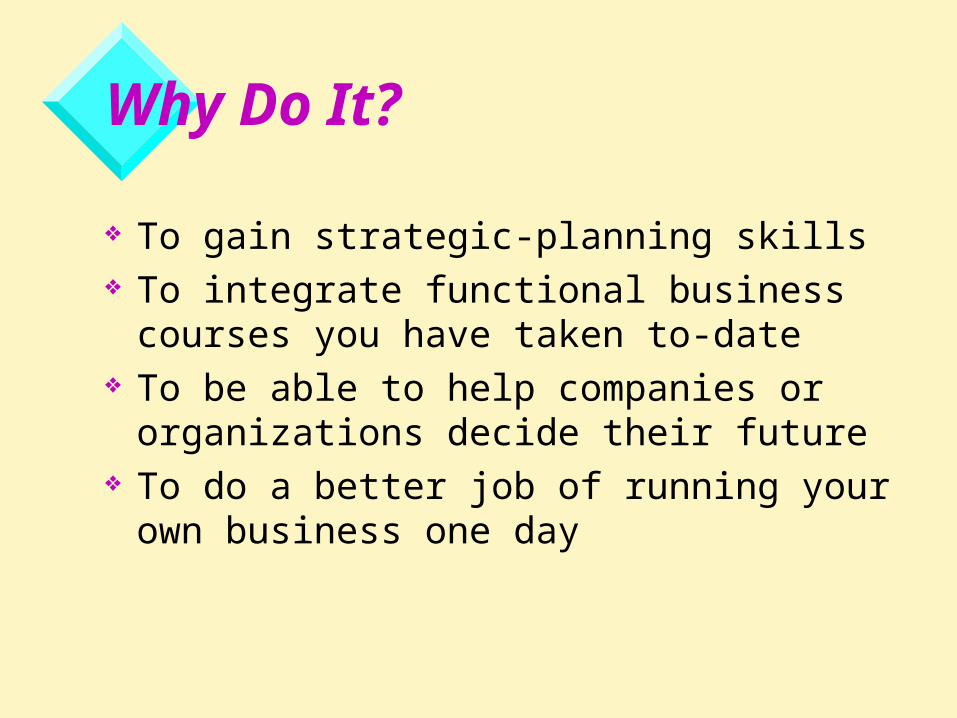
Why Do It?
To gain strategic-planning skills To integrate functional business
courses you have taken to-date To be able to help companies or
organizations decide their future To do a better job of running your own
business one day

The Essential Questions
1. What’s the current situation?
2. Where do we want to go?
3. How can we get there?
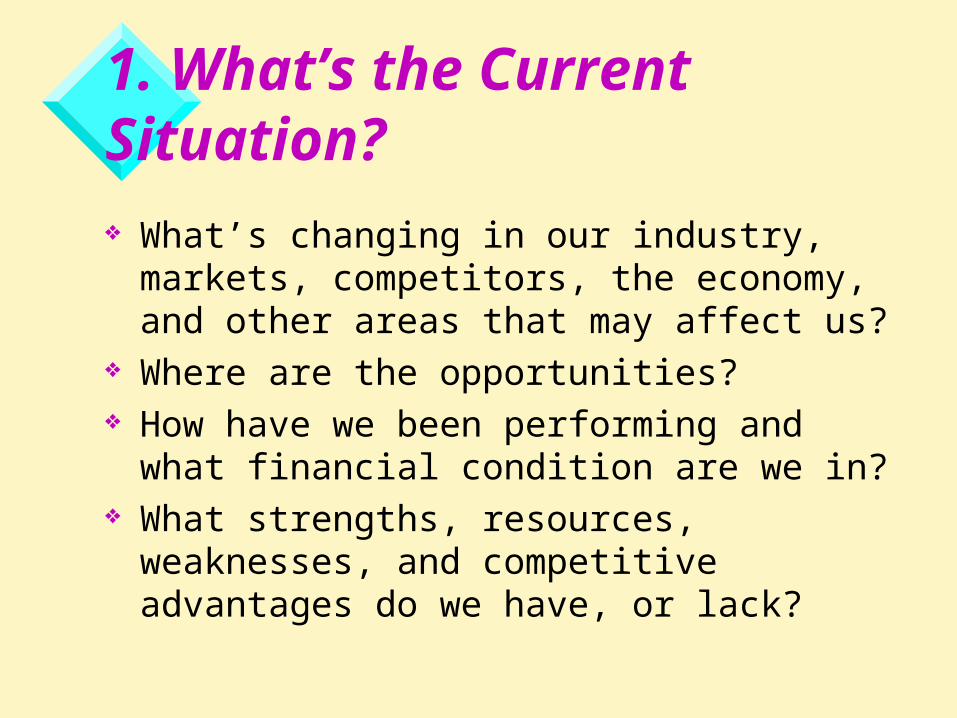
1. What’s the Current Situation? What’s changing in our industry, markets,
competitors, the economy, and other areas that may affect us?
Where are the opportunities? How have we been performing and what
financial condition are we in? What strengths, resources, weaknesses, and
competitive advantages do we have, or lack?
2. Where Do We Want to Go?This involves strategic thinking
What are all the possible and feasible directions we could take?– Which opportunities could we pursue?– What alternative business models make
sense? Which is the best alternative?
– Why is it the best one?

3. How can we get there?And how fast should we get there?
What vision and strategy should we pursue?
What objectives should we set?– For the next year and three years’ hence?
What programs should we implement? What contingencies can we devise in
case things go wrong?
What Is Strategy?
Strategy is how a company actually competes
The best strategy is embedded in a business model that both provides customer value and gives the organization a sustainable competitive advantage
[Know what these terms mean?]

Strategic Planning vs. Strategic Management
Strategic-planning process Operational planning
ImplementationEvaluation & control
Strategic management
Strategic thinking drives the process
Strategic analysis informs the process
Book Figure 1.1
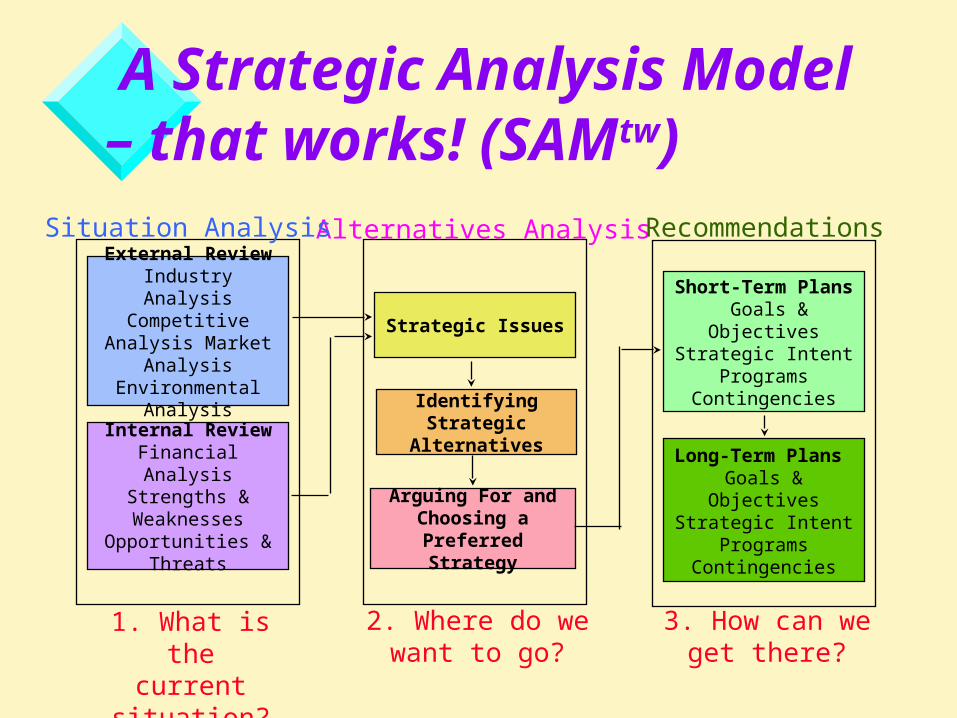
A Strategic Analysis Model – that works! (SAMtw)
Alternatives Analysis
Strategic Issues
Identifying Strategic Alternatives
Arguing For and Choosing a
Preferred Strategy
Recommendations
Short-Term Plans Goals & Objectives
Strategic IntentPrograms
Contingencies
Long-Term Plans Goals & Objectives
Strategic Intent Programs
Contingencies
Situation Analysis
External Review Industry Analysis
Competitive Analysis Market Analysis Environmental
Analysis
Internal Review Financial Analysis
Strengths & Weaknesses
Opportunities & Threats
1. What is thecurrent situation?
2. Where do wewant to go?
3. How can weget there?
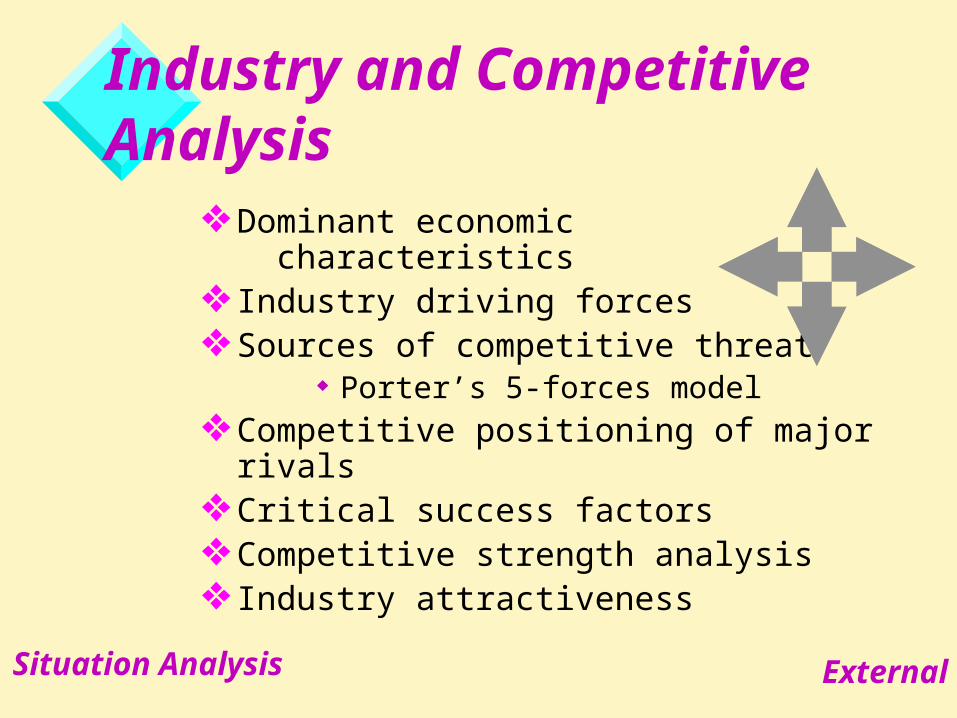
Industry and Competitive Analysis
Dominant economic characteristics
Industry driving forcesSources of competitive threat
Porter’s 5-forces modelCompetitive positioning of major rivalsCritical success factorsCompetitive strength analysis Industry attractiveness
Situation Analysis External

Dominant Economic Characteristics Example: Industry for a chemical commodity
Industry Size $500 million sales; 4 million tons total volume
Scope of Competitive Rivalry Primarily regional; producers rarely sell outside a 250-mile radius of plant
due to high cost of shipping long distances
Industry Growth Rate 2-3 percent annually
Stage in Lifecycle Mature
Number of Competitors About 30 companies with 110 plant locations and capacity of 4.5 million
tons. Market shares range from 3-21 percent
Customers About 2,000 buyers; most are industrial chemical firms
Situation Analysis External
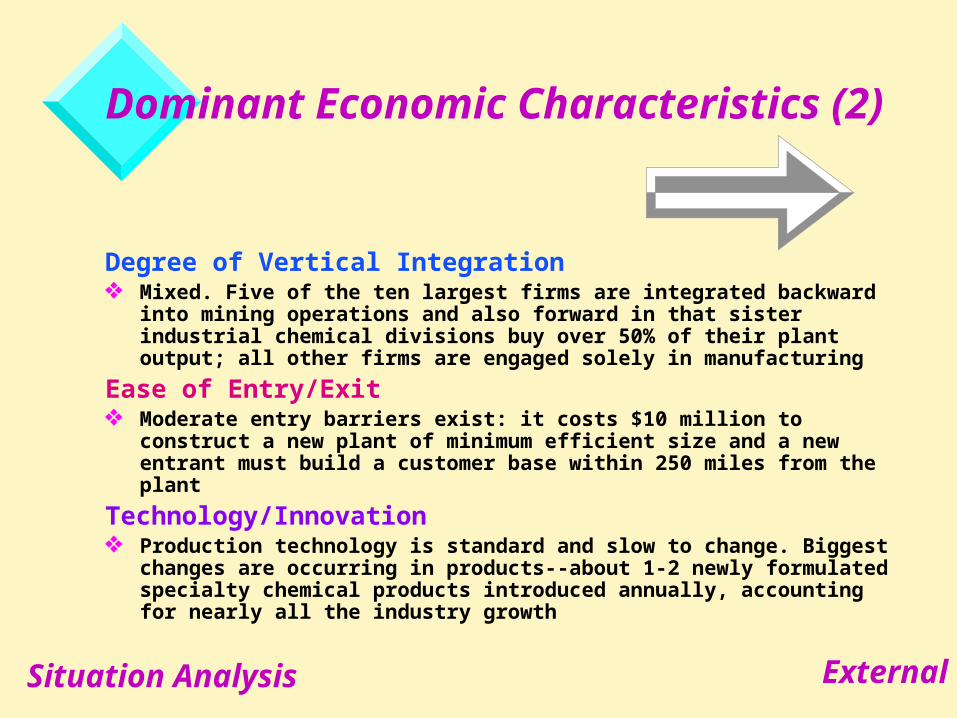
Dominant Economic Characteristics (2)
Degree of Vertical Integration Mixed. Five of the ten largest firms are integrated backward into mining
operations and also forward in that sister industrial chemical divisions buy over 50% of their plant output; all other firms are engaged solely in manufacturing
Ease of Entry/Exit Moderate entry barriers exist: it costs $10 million to construct a new plant
of minimum efficient size and a new entrant must build a customer base within 250 miles from the plant
Technology/Innovation Production technology is standard and slow to change. Biggest changes
are occurring in products--about 1-2 newly formulated specialty chemical products introduced annually, accounting for nearly all the industry growth
Situation Analysis External
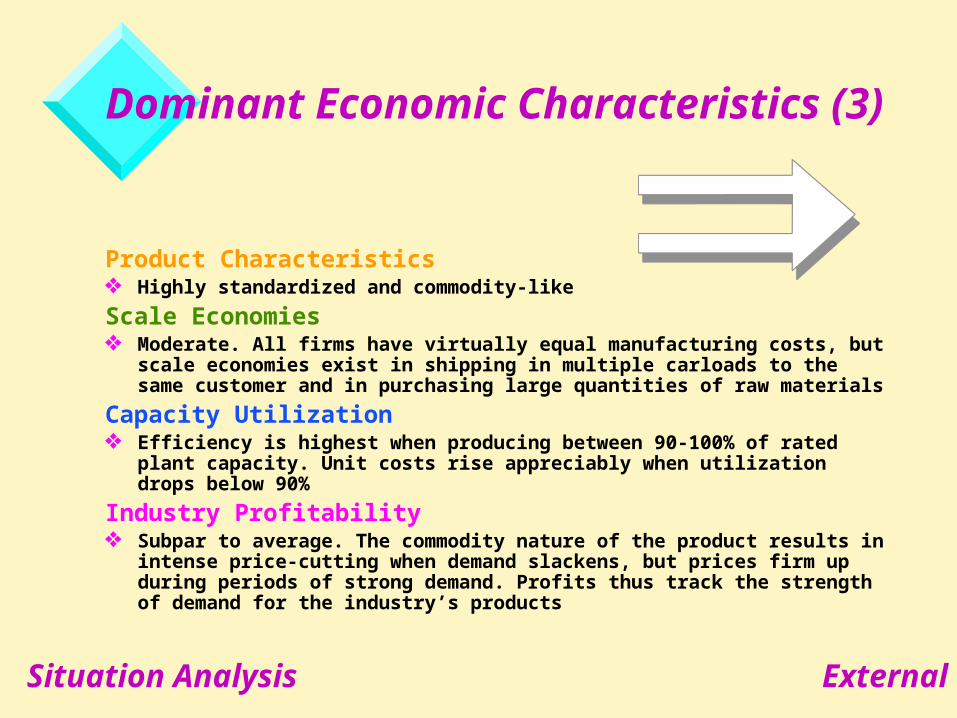
Dominant Economic Characteristics (3)
Product Characteristics Highly standardized and commodity-like
Scale Economies Moderate. All firms have virtually equal manufacturing costs, but scale
economies exist in shipping in multiple carloads to the same customer and in purchasing large quantities of raw materials
Capacity Utilization Efficiency is highest when producing between 90-100% of rated plant
capacity. Unit costs rise appreciably when utilization drops below 90%
Industry Profitability Subpar to average. The commodity nature of the product results in
intense price-cutting when demand slackens, but prices firm up during periods of strong demand. Profits thus track the strength of demand for the industry’s products
Situation Analysis External

Industry Driving Forces
Changes in the industry growth rate
Changes in who buys the product and how they use it
Product or marketing innovation
Technological change
Entry or exit of major firms
Diffusion of technical know-how
Increasing globalization of the industry
Changes in cost and efficiency
Emerging buyer preferences for differentiation
Regulatory influences and government policy changes
Changing societal concerns, attitudes, lifestyles
Situation Analysis External
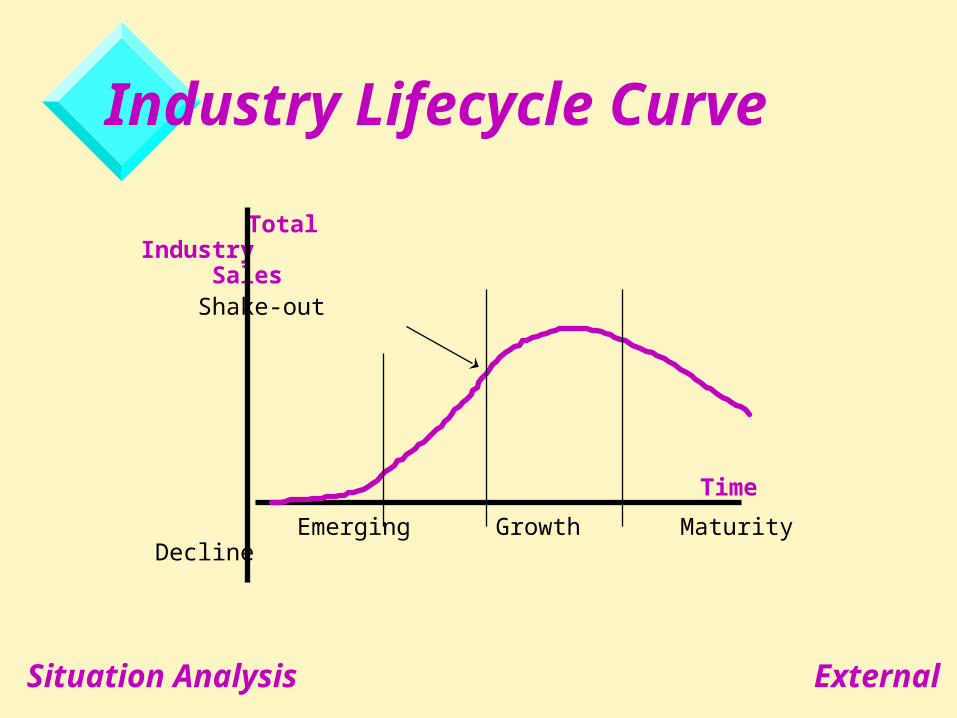
Industry Lifecycle Curve
TotalIndustry Sales
Shake-out
Emerging Growth Maturity Decline
Time
Situation Analysis External
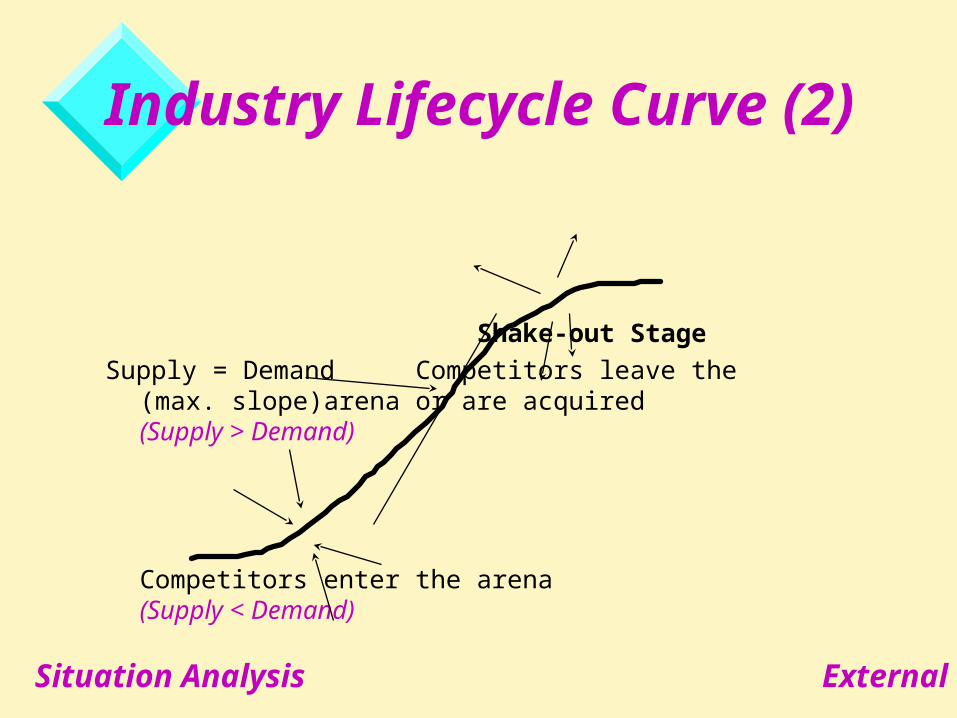
Industry Lifecycle Curve (2)
Shake-out Stage
Supply = Demand Competitors leave the(max. slope) arena or are acquired
(Supply > Demand)
Competitors enter the arena(Supply < Demand)
Situation Analysis External

Concentrated vs. Fragmented Industries Concentrated – when most of the industry’s
sales are accounted for by only a few firms The “Big Four” accounting firms audit 96% of
public companies in the U.S. Only three firms make jet engines for the world’s
commercial aircraft; only two make the aircraft Fragmented – when no company has more than a
one-percent share of the market Beauty salons Bookkeepers Plumbers Cement-mixing companies
Situation Analysis External
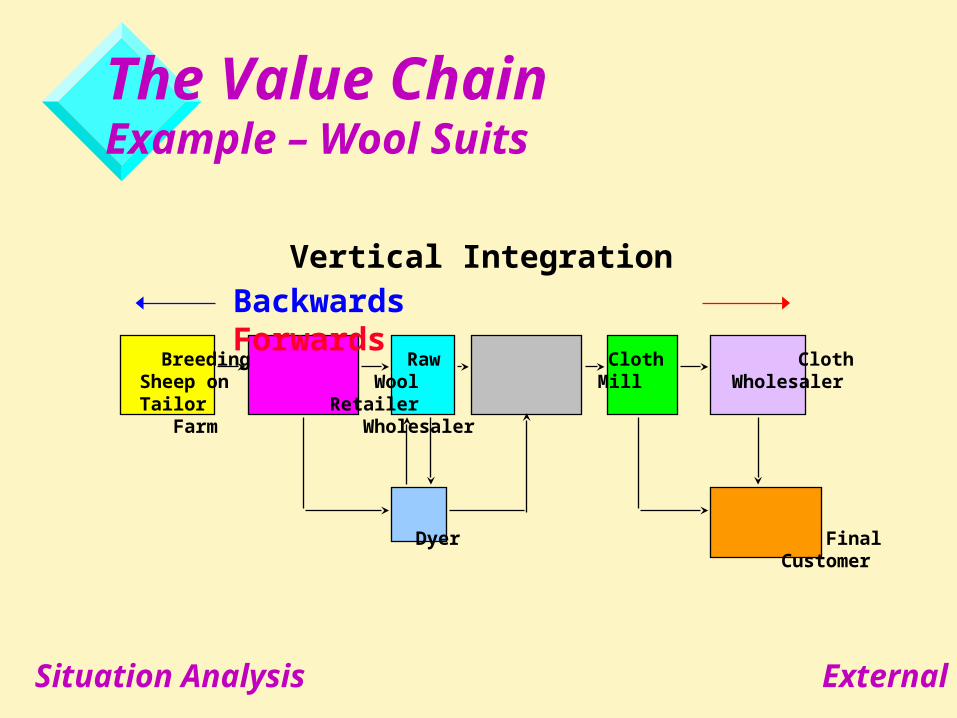
The Value ChainExample – Wool Suits
Situation Analysis External
Vertical IntegrationBackwards Forwards
Breeding Raw Cloth Cloth Sheep on Wool Mill Wholesaler Tailor Retailer Farm Wholesaler
Dyer Final Customer

Potential New Entrants
Barriers to Entry
Suppliers Rivals Buyers
Substitutes
Sources of CompetitionPorter’s 5-Forces Model of Competitive Threats
Situation Analysis External
Intensity of Rivalry?
Bargaining Power(a) of buyers?
(b) of suppliers?
Barriers to Entry?
Threat of Substitutes?
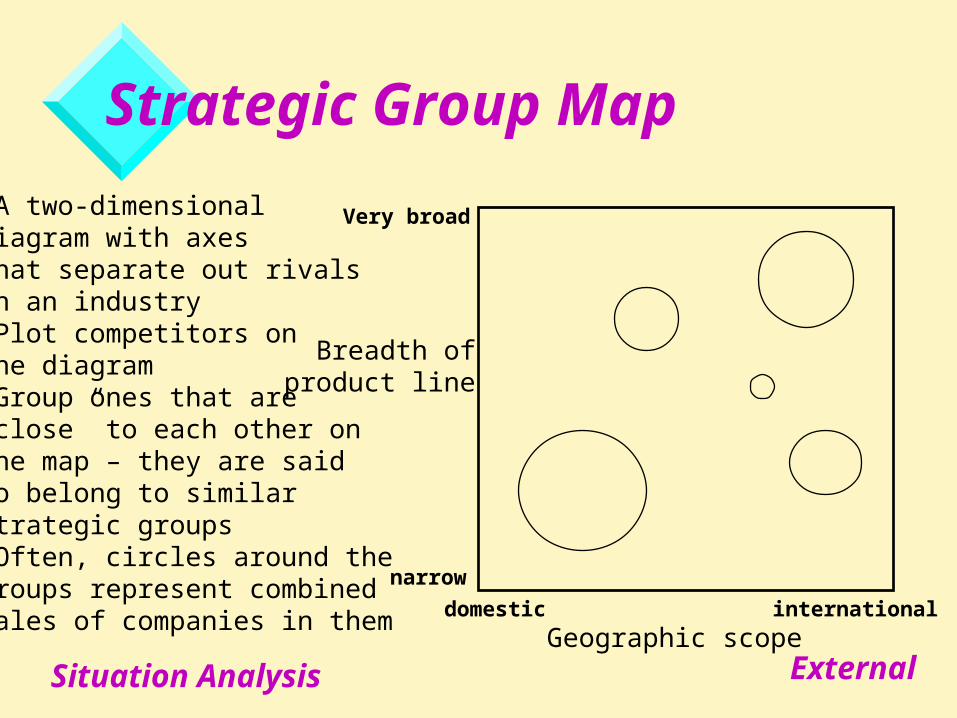
Strategic Group Map
Breadth ofproduct line
Geographic scope
Very broad
narrow
domestic international
•A two-dimensionaldiagram with axesthat separate out rivalsin an industry•Plot competitors onthe diagram•Group ones that are“close” to each other onthe map – they are saidto belong to similarstrategic groups•Often, circles around thegroups represent combinedsales of companies in them
Situation Analysis External

Critical-Success-Factor Analysis
A critical success factor (CSF) is something a company must do well in order to succeed in the industry.Example: XYZ Industry
Competitors Critical Success Factor Co. A B C D E Engine technology 8 9 9 7 6 10 Styling and features 9 8 9 8 7 9 Brand reputation 10 8 9 7 6 9 Strong distribution/dealer network 7 8 9 6 7 10 Efficient manufacturing 6 8 8 7 8 9 Effective marketing 9 8 9 8 7 9
Situation Analysis External
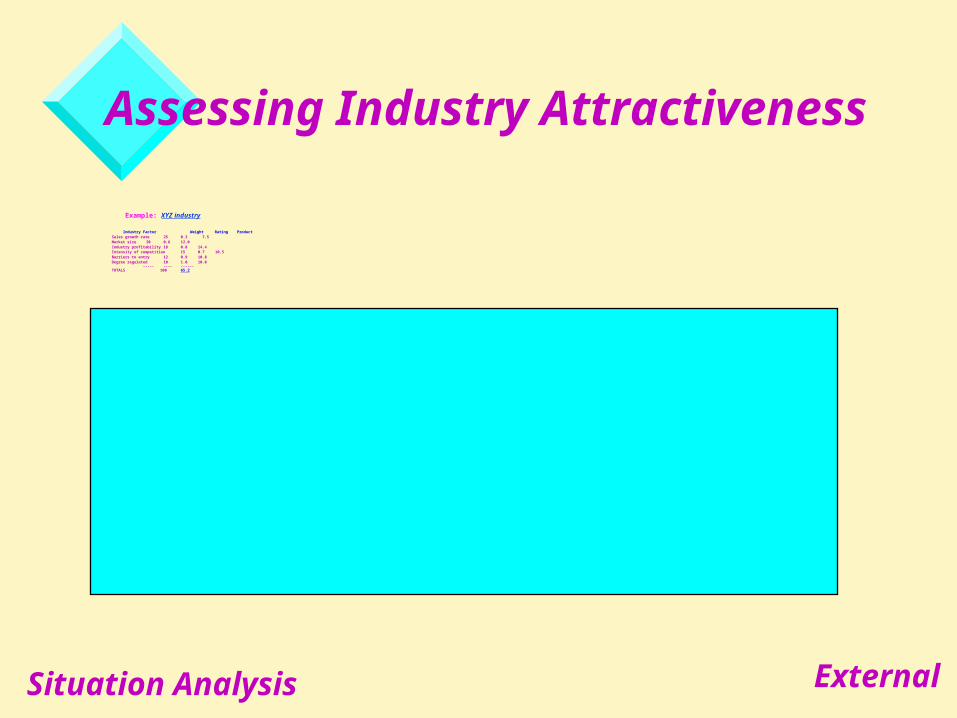
Assessing Industry Attractiveness
Example: XYZ industry
Industry Factor Weight Rating Product Sales growth rate 25 0.3 7.5 Market size 20 0.6 12.0 Industry profitability 18 0.8 14.4 Intensity of competition 15 0.7 10.5 Barriers to entry 12 0.9 10.8 Degree regulated 10 1.0 10.0
----- ---- ------TOTALS 100 65.2
Situation Analysis External

Assessing Competitive Strength
Example: Your Company Under Analysis
Competitive Factor Weight Rating Product
Technological innovativeness 22 0.6 13.2
Marketing/distribution 20 0.9 18.0
Caliber of management 18 0.9 16.2
Relative cost position 17 0.6 10.2
Brand reputation 12 1.0 12.0
Financial strength 11 0.7 7.7 ----- ------
TOTALS 100 77.3
Situation Analysis External
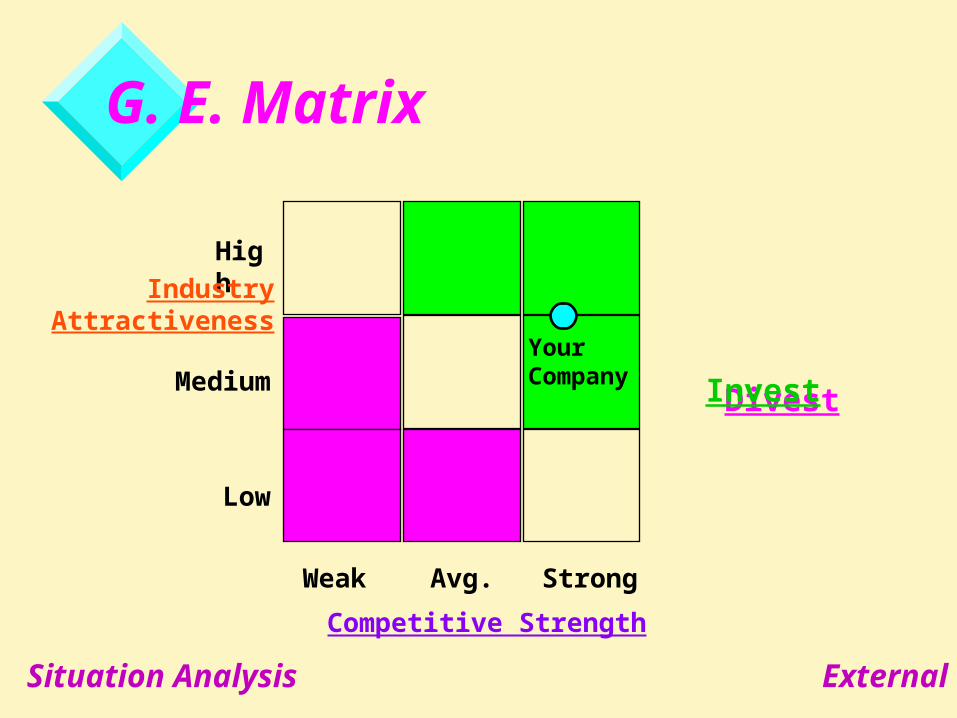
G. E. Matrix
High
Medium
Low
Weak Avg. Strong
Divest
Invest
Competitive Strength
IndustryAttractiveness
Your Company
Situation Analysis External
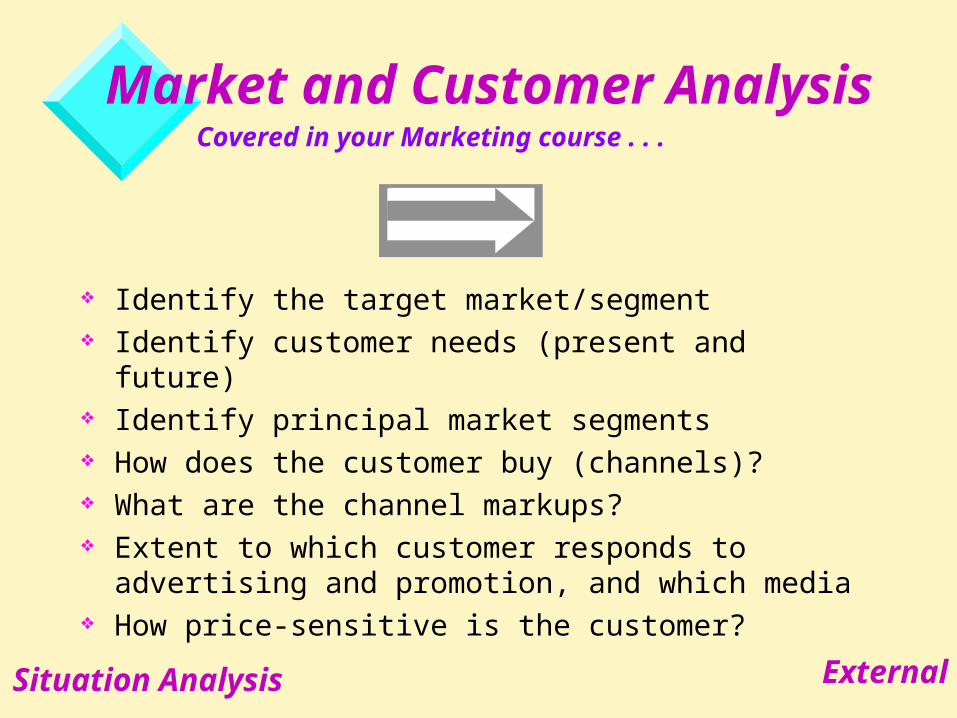
Market and Customer Analysis Covered in your Marketing course . . .
Identify the target market/segment Identify customer needs (present and future) Identify principal market segments How does the customer buy (channels)? What are the channel markups? Extent to which customer responds to advertising and
promotion, and which media How price-sensitive is the customer?
Situation Analysis External

Environmental Analysis Categories to Scan Continually
Demographic changes -- regional population shifts, birth rates, age cohorts, etc.Impending regulatory/legislative changes -- healthcare reform, tax bills, etc.Political changes (esp. at election time) -- tax changes, party platforms, etc.Lifestyle/attitude trends -- fitness, disease prevention, seeking adventure, etc.Sociocultural trends -- consumer activism, greater tolerance of diversity, etc.Economic climate and trends -- extended recession, devaluation, etc.Technological advances -- industry & federal spending on R&D, new patents, etc.
All the above, for each foreign country in which the company does business.
Ask, “What changes/trends affect my company either negatively or positively?” The larger the potential impact, the
more specific data are needed about the trend/change.
Situation Analysis External

Phase Coverage in Class
Alternatives Analysis
Strategic Issues
Identifying Strategic Alternatives
Arguing For and Choosing a
Preferred Strategy
Recommendations
Short-Term Plans Goals & Objectives
Strategic IntentPrograms
Contingencies
Long-Term Plans Goals & Objectives
Strategic Intent Programs
Contingencies
Situation Analysis
External Review Industry Analysis
Competitive Analysis Market Analysis Environmental
Analysis
Internal Review Financial Analysis
Strengths & Weaknesses
Opportunities & Threats
1. What is thecurrent situation?
2. Where do wewant to go?
3. How can weget there?
I
IIIII
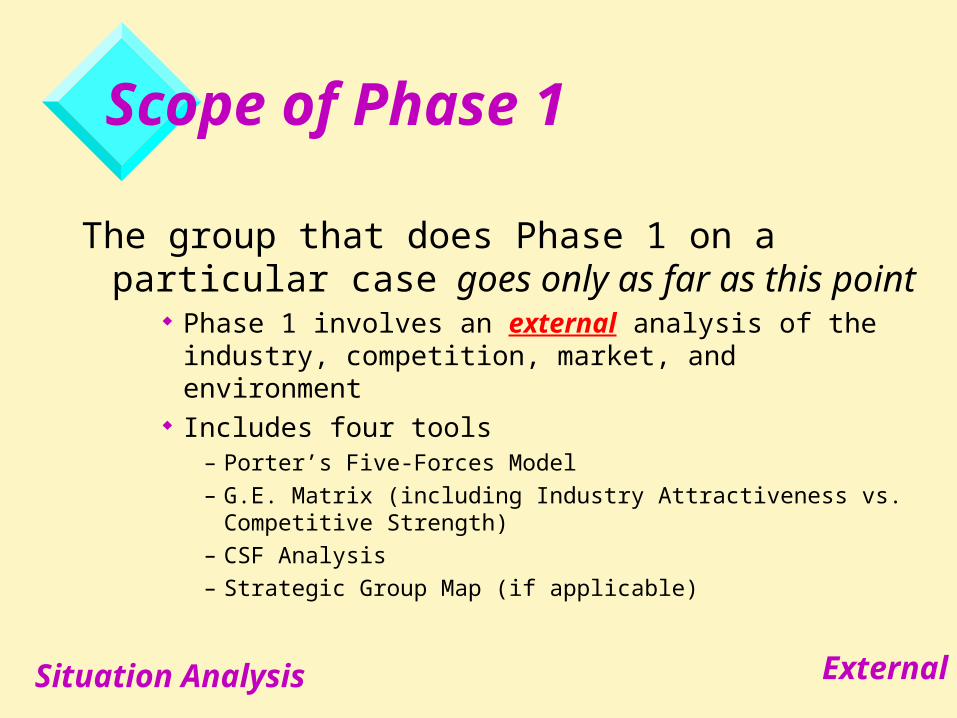
Scope of Phase 1
The group that does Phase 1 on a particular case goes only as far as this point
Phase 1 involves an external analysis of the industry, competition, market, and environment
Includes four tools– Porter’s Five-Forces Model
– G.E. Matrix (including Industry Attractiveness vs. Competitive Strength)
– CSF Analysis
– Strategic Group Map (if applicable)
Situation Analysis External

Financial Analysis
SAM does all the work for you after you have inputted income-statement and balance-sheet data for the given years
You have to select which kinds of financial data to present in order to give a reasonable and complete picture of the company’s recent performance and current financial condition
You end the presentation with a ‘financial conclusion’ slide– Use data from the previous charts shown to support
your conclusion
Situation Analysis Internal
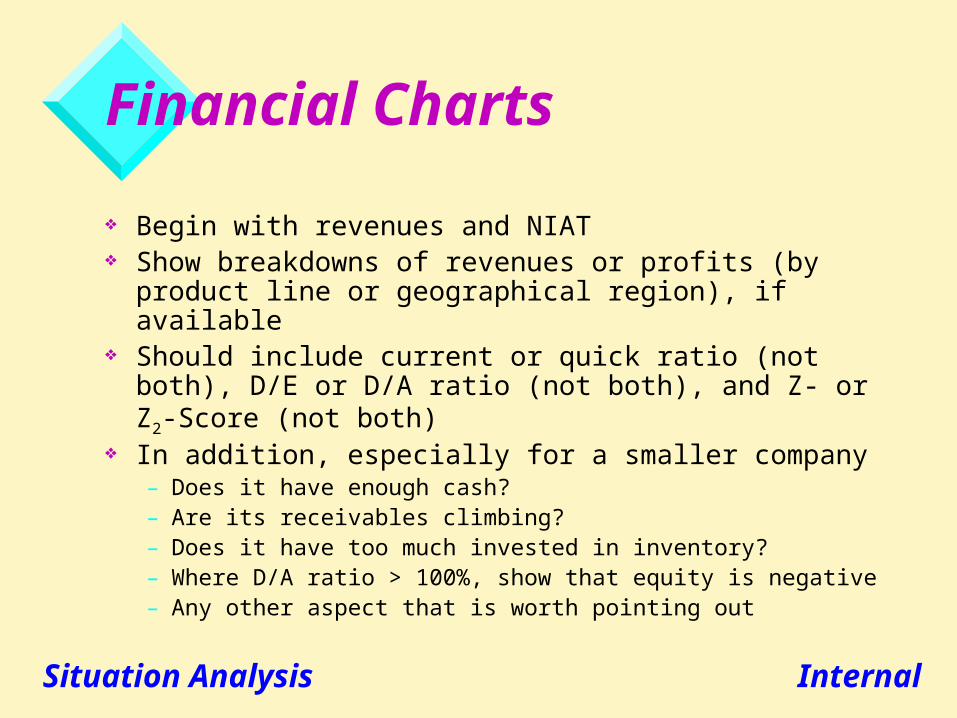
Financial Charts
Begin with revenues and NIAT Show breakdowns of revenues or profits (by product line
or geographical region), if available Should include current or quick ratio (not both), D/E or
D/A ratio (not both), and Z- or Z2-Score (not both) In addition, especially for a smaller company
– Does it have enough cash?– Are its receivables climbing?– Does it have too much invested in inventory?– Where D/A ratio > 100%, show that equity is negative– Any other aspect that is worth pointing out
Situation Analysis Internal
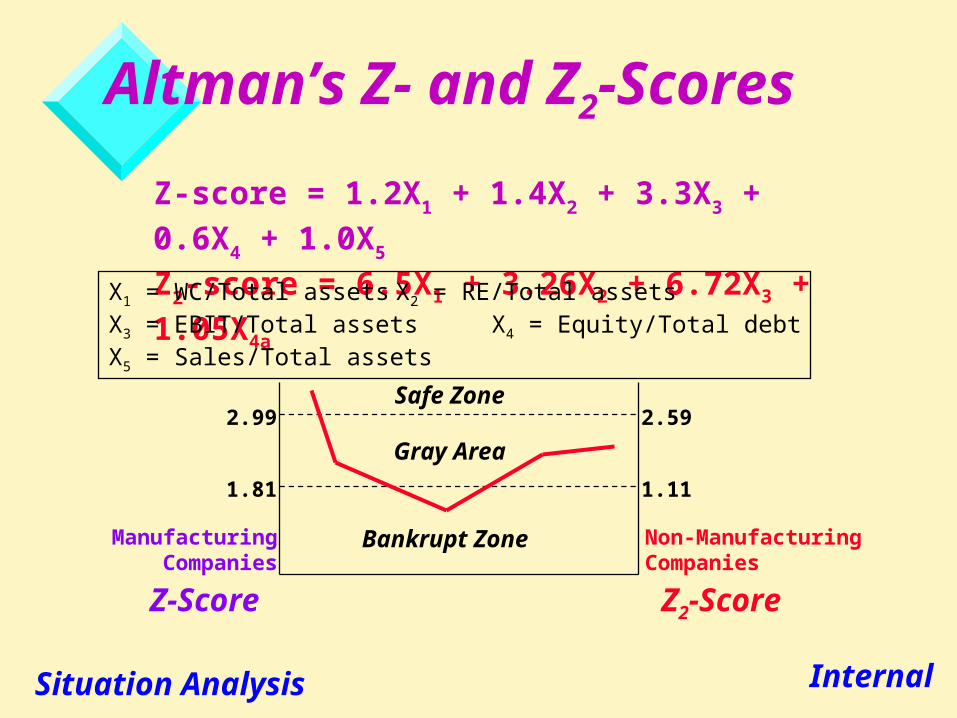
Altman’s Z- and Z2-Scores
Safe Zone
Gray Area
Bankrupt ZoneManufacturingCompanies
Non-ManufacturingCompanies
2.99
1.81
2.59
1.11
Z-Score Z2-Score
Situation Analysis Internal
Z-score = 1.2X1 + 1.4X2 + 3.3X3 + 0.6X4 + 1.0X5
Z2-score = 6.5X1 + 3.26X2 + 6.72X3 + 1.05X4a
X1 = WC/Total assets X2 = RE/Total assetsX3 = EBIT/Total assets X4 = Equity/Total debtX5 = Sales/Total assets
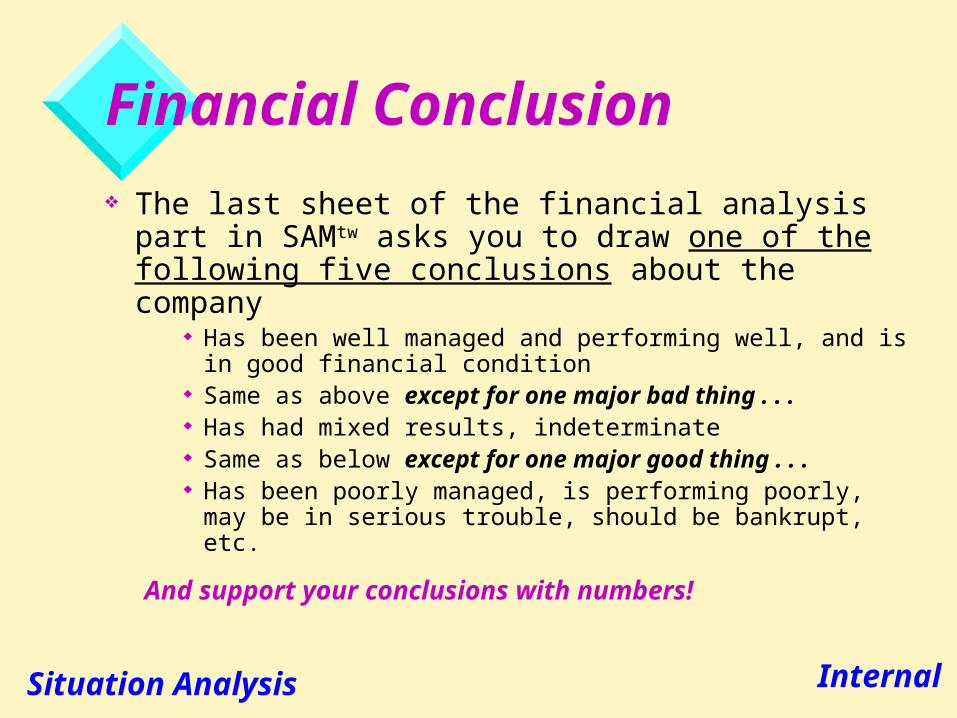
Financial Conclusion
The last sheet of the financial analysis part in SAMtw asks you to draw one of the following five conclusions about the company
Has been well managed and performing well, and is in good financial condition
Same as above except for one major bad thing . . . Has had mixed results, indeterminate Same as below except for one major good thing . . . Has been poorly managed, is performing poorly, may be in
serious trouble, should be bankrupt, etc.
And support your conclusions with numbers!
Situation Analysis Internal

Financial Conclusion Example: Harley-Davidson (1988)
H-D has been performing very well and is financially in good condition
Motorcycle revenues grew an average 23.5%/yr from 1986-88 in a declining industry
NIAT grew 12.7% in 1988 NPM almost doubled from 1.7% in 1986 to 3.2% in 1988 D/E ratio declined 54.5% from 5.5 in 1987 to 2.3 in 1988 It has $52.3M in cash in 1988 Z-Score improved to 3.07 (safe zone) in 1988
Situation Analysis Internal
Set off the conclusion in a different font and color to stand out. Summarize thesupporting data in the order you showed the charts. Cite statistics.
Company Strengths
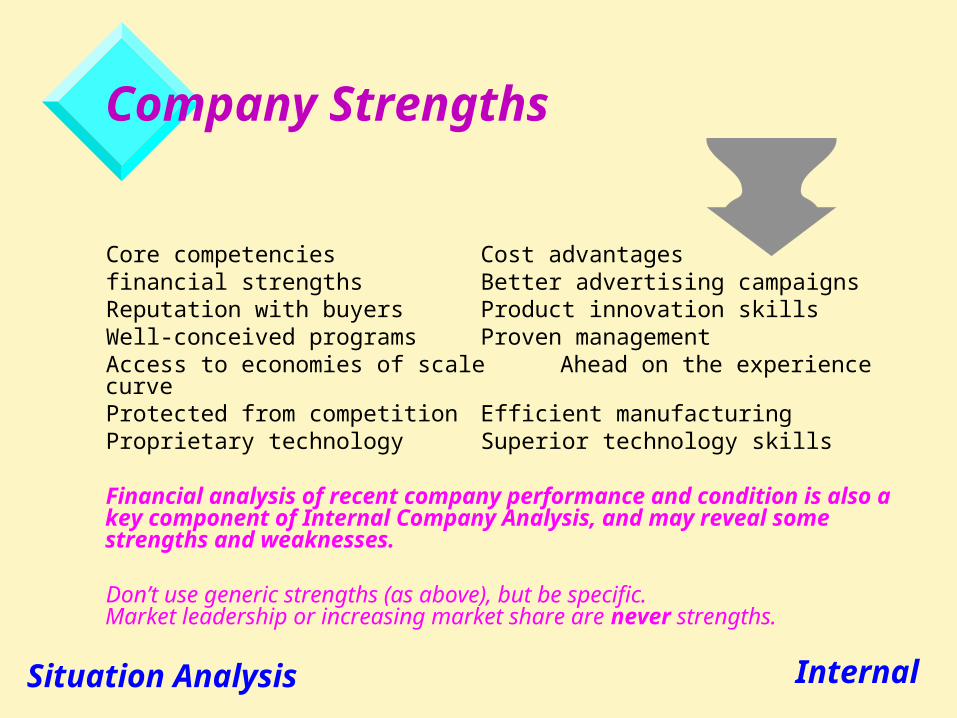
Core competencies Cost advantagesfinancial strengths Better advertising campaignsReputation with buyers Product innovation skillsWell-conceived programs Proven managementAccess to economies of scale Ahead on the experience curveProtected from competition Efficient manufacturingProprietary technology Superior technology skills
Financial analysis of recent company performance and condition is also a key component of Internal Company Analysis, and may reveal some strengths and weaknesses.
Don’t use generic strengths (as above), but be specific.Market leadership or increasing market share are never strengths.
Situation Analysis Internal

Company Weaknesses
No clear strategic direction Falling behind in R&D
Obsolete facilities Product line too narrow
Sub-par profitability because . . . Weak market image
Little or no managerial depth/talent Weak distribution network
Missing key skills/competencies Weak marketing skills
Poor implementation record Unable to finance strategies
Internal operating problems High relative costs
Poor product quality Worsening customer service
Deteriorating union relations Slow development of newproducts
Situation Analysis Internal
Same notes as for ‘Strengths’ slide
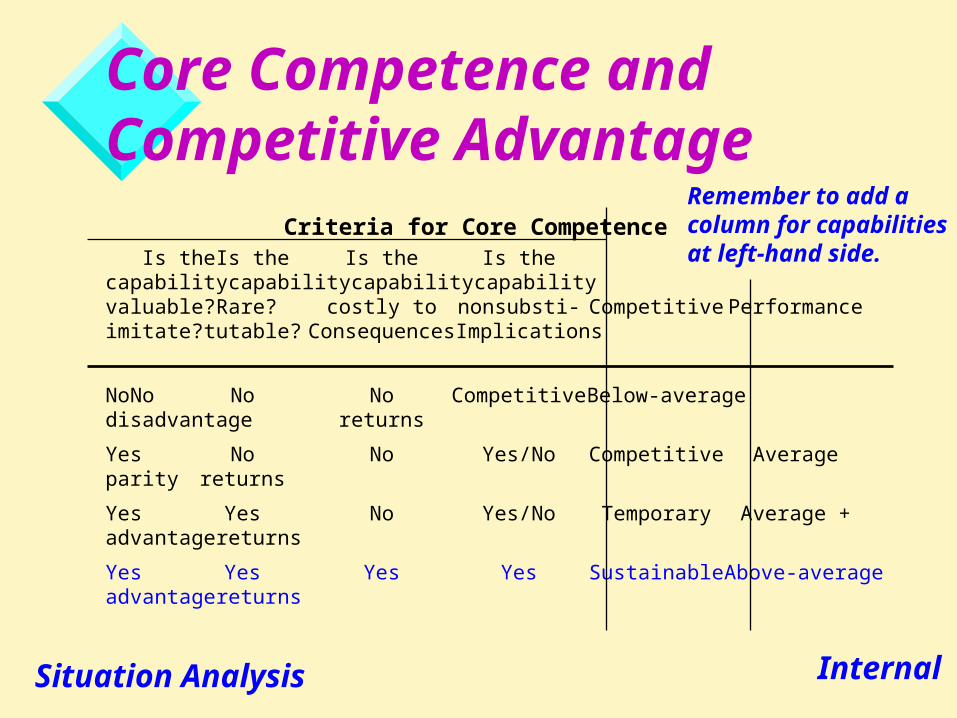
Core Competence and Competitive Advantage Criteria for Core Competence Is the Is the Is the Is thecapability capability capability capabilityvaluable? Rare? costly to nonsubsti- Competitive Performance
imitate? tutable? Consequences Implications
No No No No Competitive Below-averagedisadvantage returns
Yes No No Yes/No Competitive Averageparity returns
Yes Yes No Yes/No Temporary Average +advantage returns
Yes Yes Yes Yes Sustainable Above-averageadvantage returns
Situation Analysis Internal
Remember to add acolumn for capabilitiesat left-hand side.
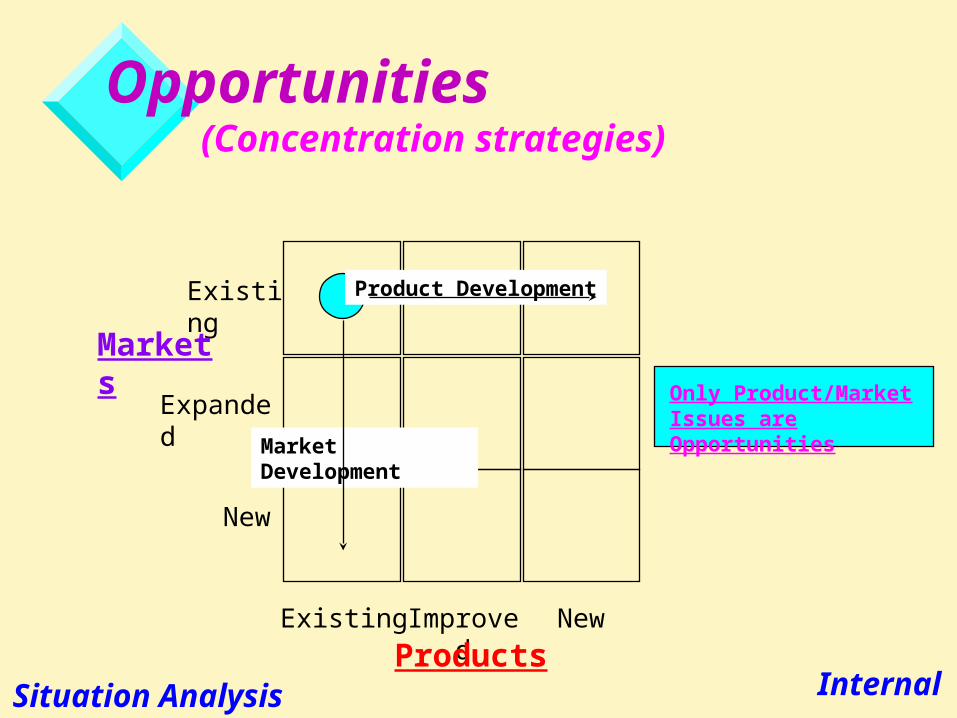
Opportunities(Concentration strategies)
Existing
Expanded
New
Existing Improved New
Only Product/Market Issues are Opportunities
Products
Market Development
Product Development
Markets
Situation Analysis Internal

Threats
Entry of low-cost foreign competitors Adverse shifts in foreign exchange rates and trade
policies Slower market growth Adverse demographic changes Costly regulatory requirements Impending economic downturn Growing bargaining power of buyers and suppliers Changing buyer needs and tastes Rising sales of substitute products Legislation with adverse impact
Situation Analysis Internal
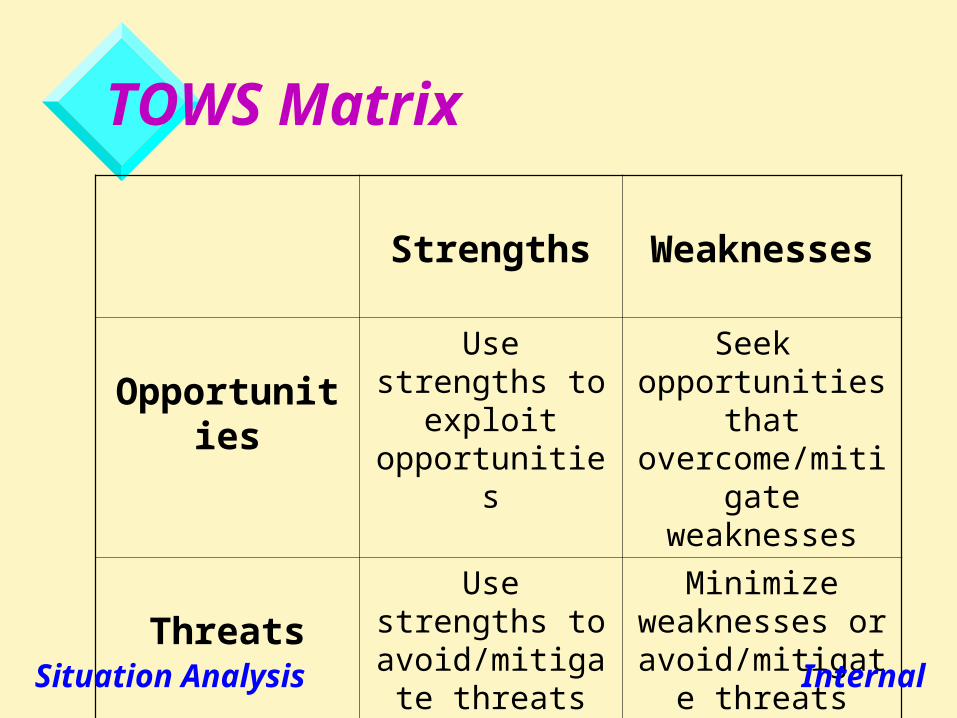
TOWS Matrix
Strengths Weaknesses
OpportunitiesUse strengths to
exploit opportunities
Seek opportunities that overcome/mitigate
weaknesses
ThreatsUse strengths to avoid/mitigate
threats
Minimize weaknesses or avoid/mitigate threats (hard)
Situation Analysis Internal
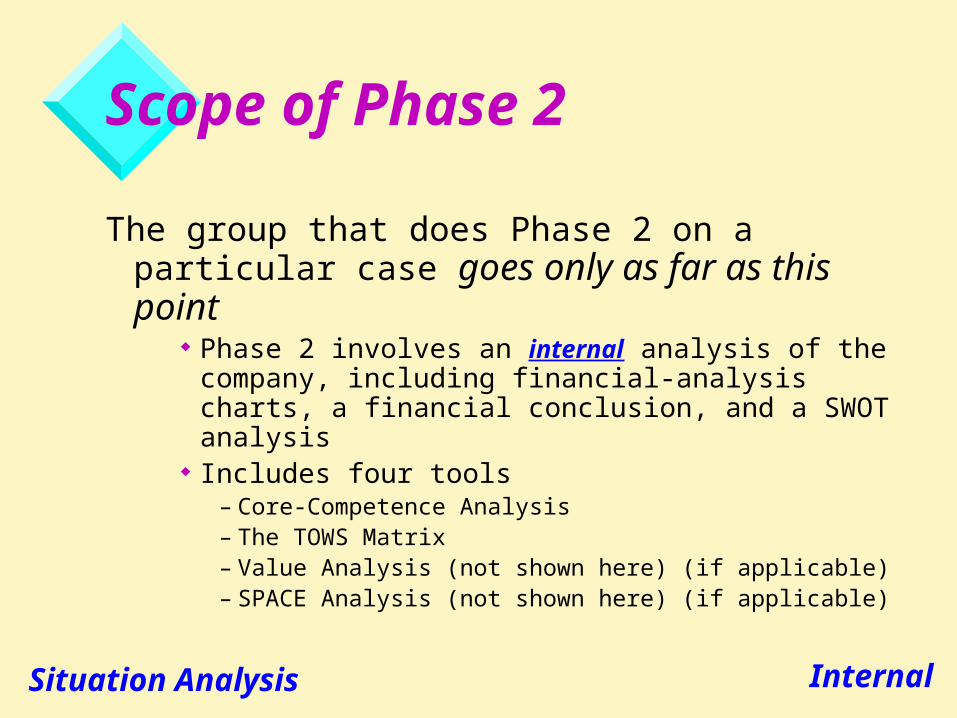
Scope of Phase 2
The group that does Phase 2 on a particular case goes only as far as this point
Phase 2 involves an internal analysis of the company, including financial-analysis charts, a financial conclusion, and a SWOT analysis
Includes four tools– Core-Competence Analysis– The TOWS Matrix– Value Analysis (not shown here) (if applicable)– SPACE Analysis (not shown here) (if applicable)
Situation Analysis Internal
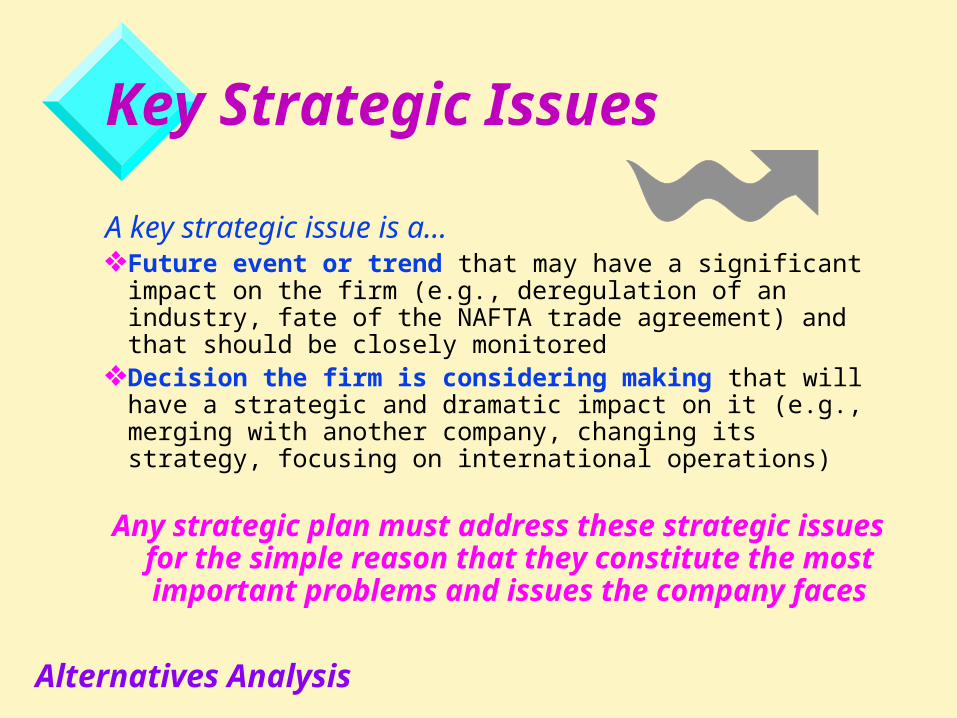
Key Strategic Issues
A key strategic issue is a…Future event or trend that may have a significant impact on the
firm (e.g., deregulation of an industry, fate of the NAFTA trade agreement) and that should be closely monitored
Decision the firm is considering making that will have a strategic and dramatic impact on it (e.g., merging with another company, changing its strategy, focusing on international operations)
Any strategic plan must address these strategic issues for the simple reason that they constitute
the most important problems and issues the company faces
Alternatives Analysis
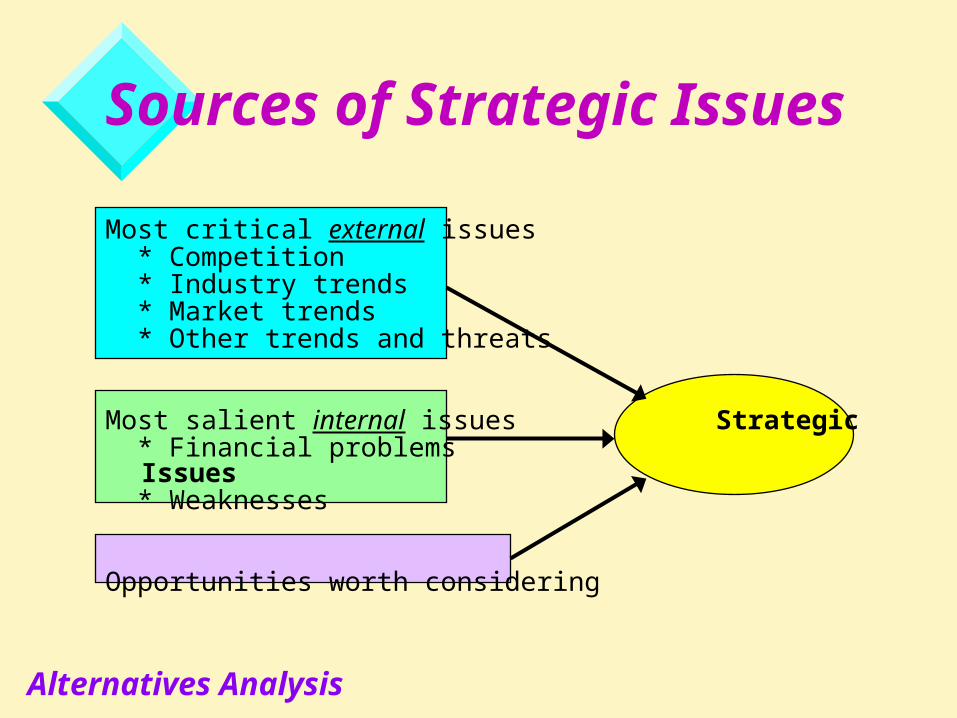
Sources of Strategic Issues
Most critical external issues * Competition * Industry trends * Market trends * Other trends and threats
Most salient internal issues Strategic * Financial problems Issues * Weaknesses
Opportunities worth considering
Alternatives Analysis
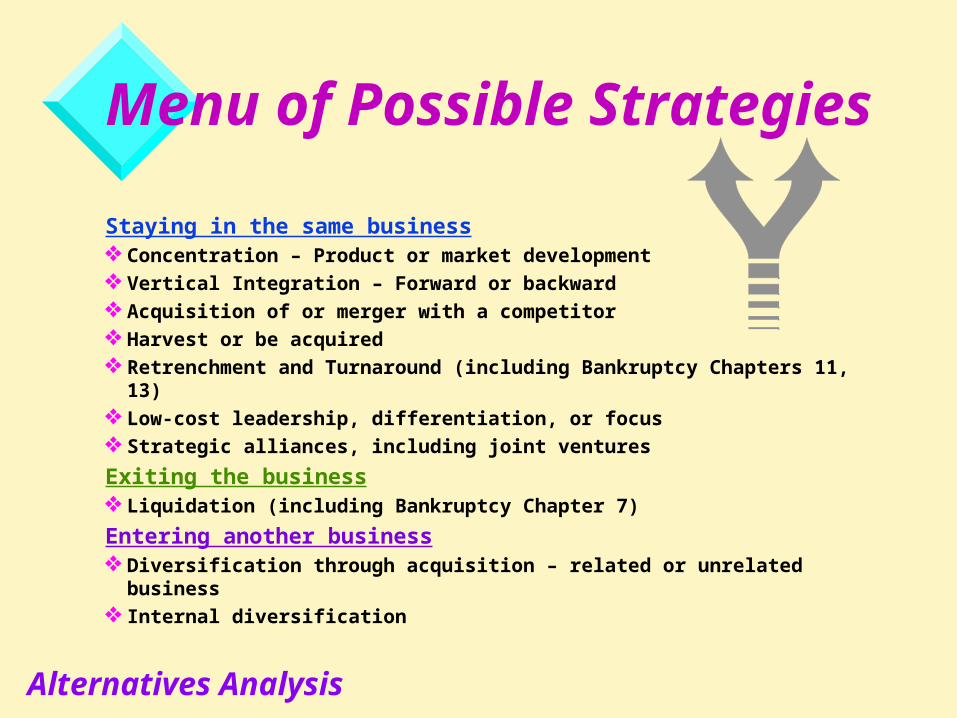
Menu of Possible Strategies
Staying in the same business Concentration – Product or market development
Vertical Integration – Forward or backward
Acquisition of or merger with a competitor
Harvest or be acquired
Retrenchment and Turnaround (including Bankruptcy Chapters 11, 13)
Low-cost leadership, differentiation, or focus
Strategic alliances, including joint ventures
Exiting the business Liquidation (including Bankruptcy Chapter 7)
Entering another business Diversification through acquisition – related or unrelated business
Internal diversification
Alternatives Analysis
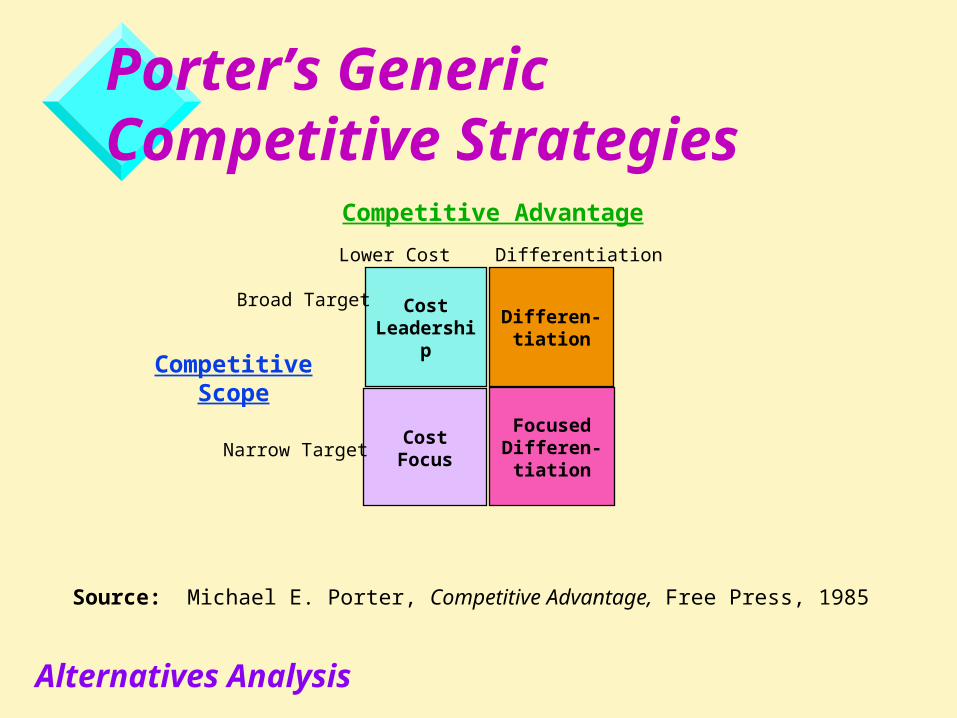
Porter’s Generic Competitive Strategies
Cost Leadership
Differen-tiation
Cost FocusFocused Differen-
tiation
Competitive Advantage
CompetitiveScope
Broad Target
Narrow Target
Source: Michael E. Porter, Competitive Advantage, Free Press, 1985
Lower Cost Differentiation
Alternatives Analysis
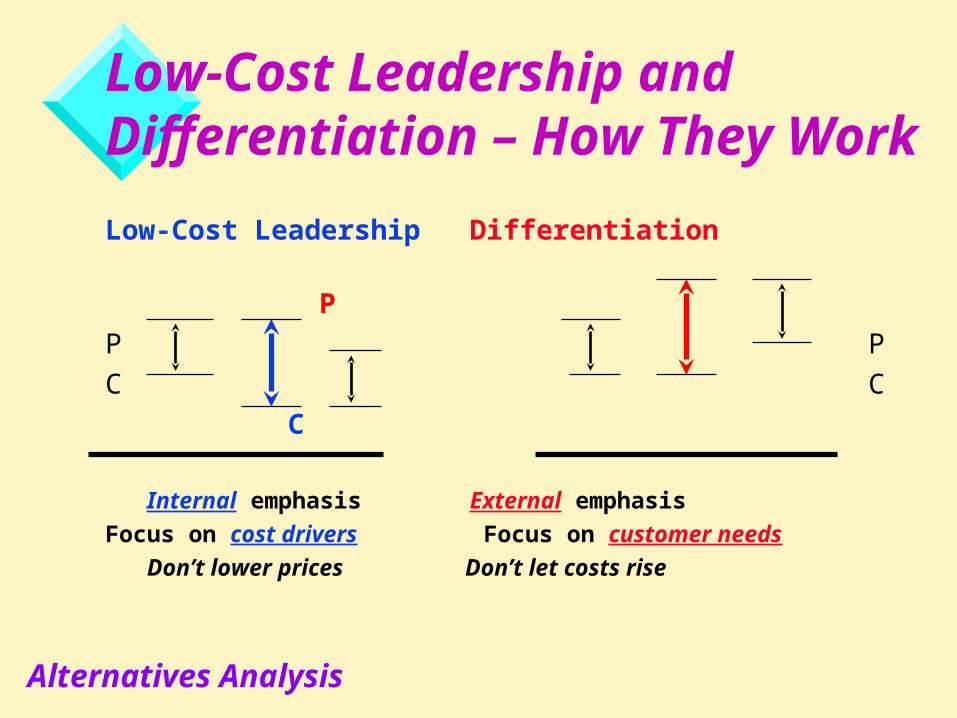
Low-Cost Leadership and Differentiation – How They Work
Low-Cost Leadership Differentiation
P
P P
C C
C
Internal emphasis External emphasis
Focus on cost drivers Focus on customer needs
Don’t lower prices Don’t let costs rise
Alternatives Analysis

Coming up with Strategic Alternatives
The most difficult part of strategic planning– Requires a lot of thought and creativity
The challenge is to devise 2-4 alternatives (bundles)– The minimum is two
– More than four is practically impossible
Must meet four criteria– Mutually exclusive (i.e., doing one means not being able to do
the others)
– Feasible (i.e., doable and internally consistent)
– Lead to success (as defined by the company)
– Address all strategic issues (or delete the ones not addressed)
Alternatives Analysis
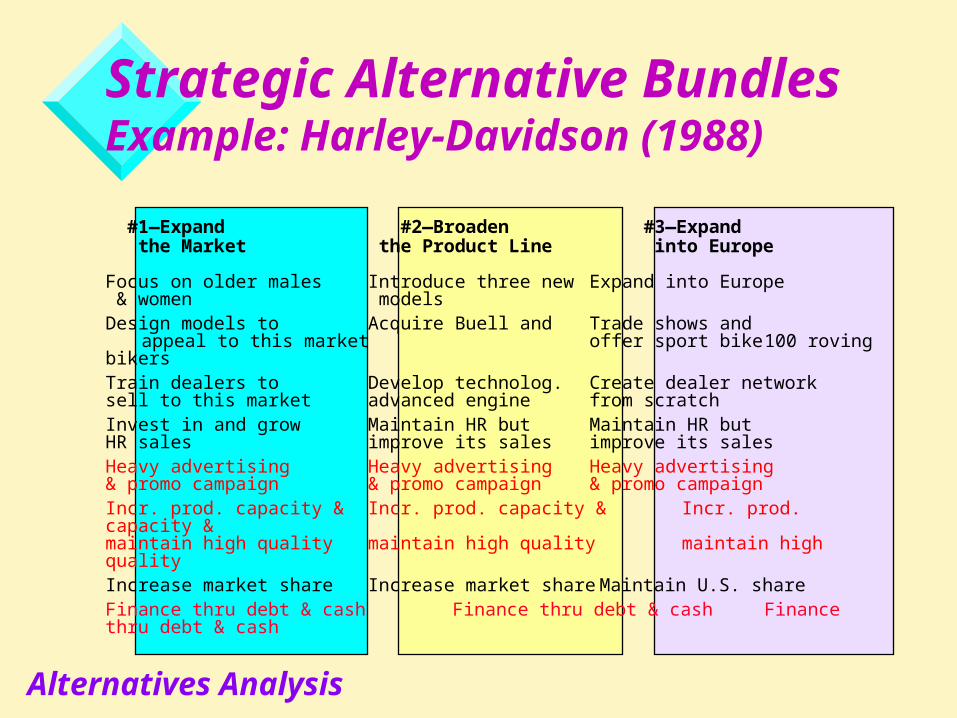
#1—Expand #2—Broaden #3—Expand the Market the Product Line into Europe
Focus on older males Introduce three new Expand into Europe & women modelsDesign models to Acquire Buell and Trade shows and
appeal to this market offer sport bike 100 roving bikersTrain dealers to Develop technolog. Create dealer networksell to this market advanced engine from scratchInvest in and grow Maintain HR but Maintain HR butHR sales improve its sales improve its salesHeavy advertising Heavy advertising Heavy advertising & promo campaign & promo campaign & promo campaignIncr. prod. capacity & Incr. prod. capacity & Incr. prod. capacity & maintain high quality maintain high quality maintain high qualityIncrease market share Increase market share Maintain U.S. shareFinance thru debt & cash Finance thru debt & cash Finance thru debt & cash
Strategic Alternative Bundles Example: Harley-Davidson (1988)
Alternatives Analysis
Choose the Best Alternative
Argue for which one is better or best– hard to do when all are equally good
The choice depends on how each alternative stacks up against selected criteria
Managers that will implement the strategy must be involved in deciding which alternative to pursue
Alternatives Analysis
Criteria for Choosing a Successful Strategy
Shareholder Value—Often used as the measure of the effectiveness of strategic planning
Revenues—Particularly appropriate when the firm wants to increase market share
Profitability—Important when earnings or cash flow have been flat or negative, or when the firm is highly leveraged
Investment Required—Does the firm have, or can it acquire, the resources it needs? Does it make sense to be acquired?
Degree of Risk—How certain is the firm to succeed if it undertakes this alternative? Is it risk-averse?
Alternatives Analysis
Criteria for Choosing a Successful Strategy (cont.)
Return on investment—ROI is another profitability measure Breakeven point—The sooner the investment is recouped the
better Match with existing company culture—While it may be better
to choose an alternative that does not require changing the culture, the culture may have to change to take advantage of a better alternative
Attainment of a core competence or competitive advantage— This is the secret of being competitive and attaining above-industry-average profits
Alternatives Analysis
Criteria for Choosing a Successful Strategy (cont.)
Timing—Is the timing right to implement a particular alternative? Is it better to implement now or later?
Strengthening its value proposition—the key to developing a revenue stream and loyal customers
Strengthening bargaining power—increasing bargaining power with either buyers or suppliers will likely increase profits
Alternatives Analysis

Two Types of Criterion
Positively Correlated Revenues Profits Return on investment Shareholder value Gaining or extending a
competitive advantage Strengthening its value
proposition Strengthening bargaining
power
Negatively Correlated Investment required Time to breakeven Competitive retaliation Culture change required Riskiness
(Rate from 0 to +10) (Rate from 0 to –10)
Alternatives Analysis

Criteria MatrixExample for Harley-Davidson (1988)
Alternatives Analysis
Criteria
Expand the
Market
Broaden Product
Line
Expand into
Europe Revenue Growth P 9 6 5 Profitability P 8 6 6 Investment Required N -5 -8 -6 Degree of Risk N -4 -4 -5 Culture Change N -3 0 -1
Comp. Advantage P 7 6 4 TOTAL 12 6 3
Recommendations Format for Short- and Long-Term Plans
Should include:
Specific measurable objectives to be achieved next year and in three years’ time
– At least Revenues and NIAT
– Perhaps one other that is important (optional)
Strategic Intent Major programs to implement that will achieve the set
objectives and implement the strategy Trigger and contingency pairs -- what could go wrong
(trigger) and what would the firm do differently if that happened (contingency)?

Triggers and ContingenciesCriteria to meet…
Triggers… Must be quantitatively expressed The cause should be externalContingencies… Must address (alleviate) the trigger Cannot renege on the chosen strategy Must be something different from what the
company is currently doing Must be operational and implementable
quickly (perhaps within 1-3 months)
Scope of Phase 3
Phase 3 ends at this point The group will continually work at improving its list of
strategic issues and bundles in class as Phases 1 and 2 are unfolding
It will then present its strategic issues and bundles for class discussion
We all understand it’s a “work in process” Strive for understanding, not perfection
Include a criteria matrix showing your choice of a preferred bundle (the class may disagree)
Include short- and long-term recommendations
Alternatives Analysis

The Vision StatementWhat Do We Aspire to Be?
Typically created for five or ten years out Can include numbers (objectives) or not Typically created by the organization’s
leader (sometimes by the top team) Must be sold to the rest of the organization
Must be realistic (possible to attain) and hence worth striving for
Must know when it has been achieved

The Mission Statement How Should We Do Business? Our “Raison D'être”
Should encompass the company’s current business and future strategy
Should include its value proposition (products or services offered to which target market)
Should include what makes the company special
How it creates value in order to win and keep its customers’ business
Creating Vision/Mission Statements One of the most challenging tasks leaders/managers
undertake Most don’t do it well—they consider it time wasted Many are unable to think clearly enough and get too frustrated If you cannot do it, you don’t know your business well enough
Leaders must get the commitment of the whole organization to the vision/mission statements
Key people should participate in its preparation Should not be revised for several years, or until it no longer fits
what the company is doing
When to Create Them?
After doing a strategic analysis Because the strategy and direction of the company
may change Because you have been able to check whether the
existing vision and mission statements need changing
Otherwise, the vision and mission statements essentially govern what the company does (or doesn’t do) next

That’s it, folks!
The whole process will come to life as you start to do the strategic analyses yourselves…