Embed Size (px)
Citation preview
How to do Fast Analyticson Massive Datasets
Alexander GrayGeorgia Institute of TechnologyComputational Science and Engineering
College of Computing
FASTlab: Fundamental Algorithmic and Statistical Tools
The FASTlabFundamental Algorithmic and Statistical Tools Laboratory
1. Arkadas Ozakin: Research scientist, PhD Theoretical Physics2. Dong Ryeol Lee: PhD student, CS + Math3. Ryan Riegel: PhD student, CS + Math4. Parikshit Ram: PhD student, CS + Math5. William March: PhD student, Math + CS6. James Waters: PhD student, Physics + CS7. Hua Ouyang: PhD student, CS8. Sooraj Bhat: PhD student, CS9. Ravi Sastry: PhD student, CS10. Long Tran: PhD student, CS11. Michael Holmes: PhD student, CS + Physics (co-supervised)12. Nikolaos Vasiloglou: PhD student, EE (co-supervised)13. Wei Guan: PhD student, CS (co-supervised)14. Nishant Mehta: PhD student, CS (co-supervised)15. Wee Chin Wong: PhD student, ChemE (co-supervised)16. Abhimanyu Aditya: MS student, CS17. Yatin Kanetkar: MS student, CS18. Praveen Krishnaiah: MS student, CS19. Devika Karnik: MS student, CS20. Prasad Jakka: MS student, CS
Allow users to apply all the state-of-the-art statistical methods…
….with orders-of-magnitude more computational efficiency– Via: Fast algorithms + Distributed computing
Our mission
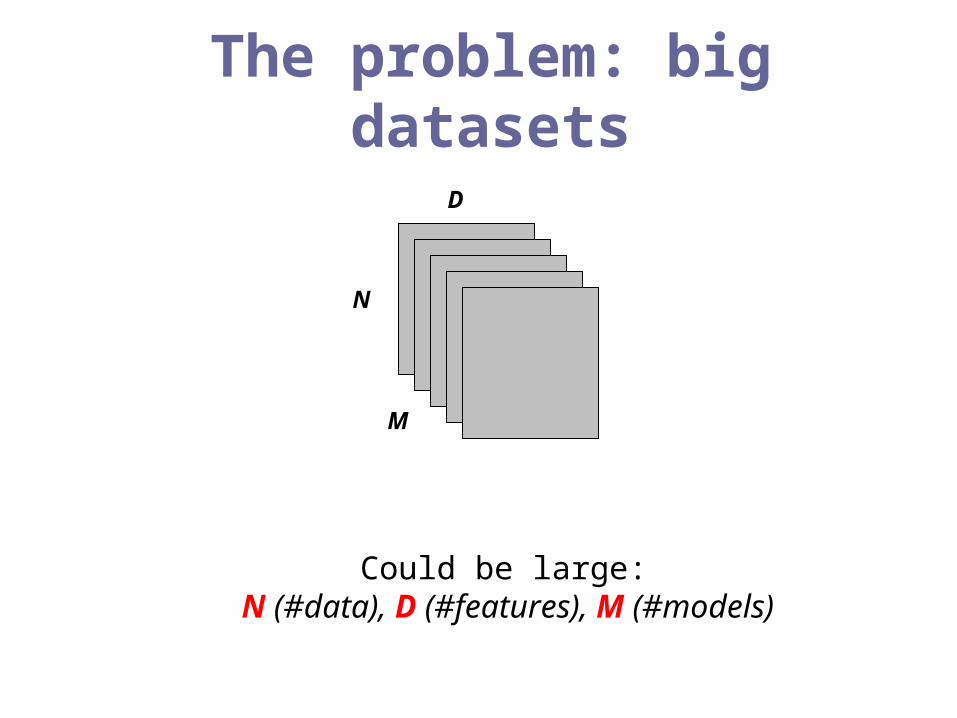
The problem: big datasets
D
N
M
Could be large: N (#data), D (#features), M (#models)
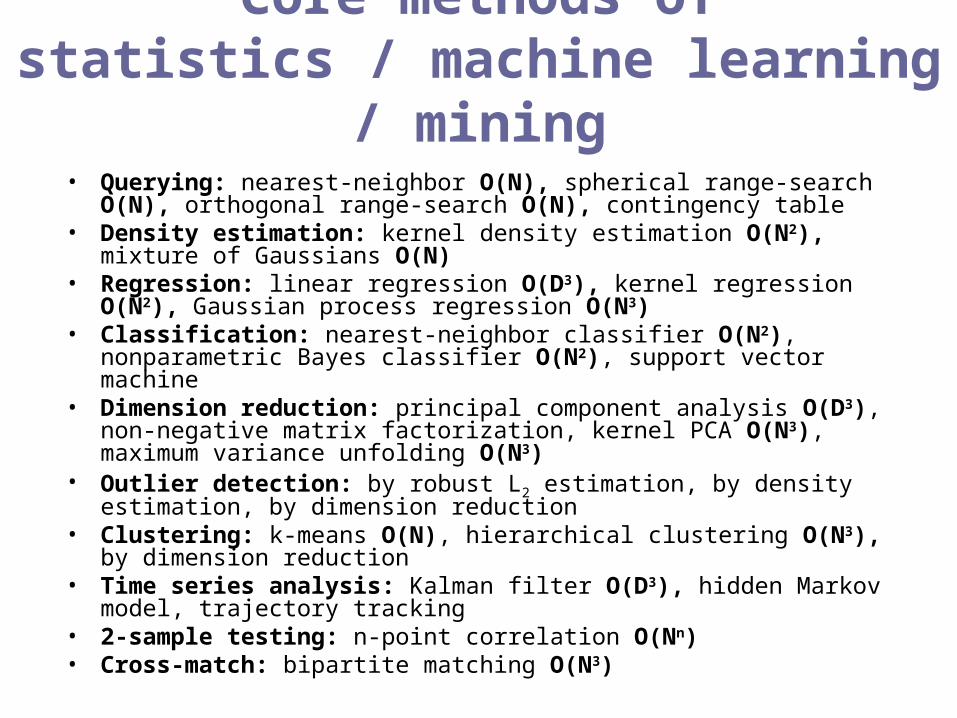
Core methods ofstatistics / machine learning / mining
• Querying: nearest-neighbor O(N), spherical range-search O(N), orthogonal range-search O(N), contingency table
• Density estimation: kernel density estimation O(N2), mixture of Gaussians O(N)
• Regression: linear regression O(D3), kernel regression O(N2), Gaussian process regression O(N3)
• Classification: nearest-neighbor classifier O(N2), nonparametric Bayes classifier O(N2), support vector machine
• Dimension reduction: principal component analysis O(D3), non-negative matrix factorization, kernel PCA O(N3), maximum variance unfolding O(N3)
• Outlier detection: by robust L2 estimation, by density estimation, by dimension reduction
• Clustering: k-means O(N), hierarchical clustering O(N3), by dimension reduction
• Time series analysis: Kalman filter O(D3), hidden Markov model, trajectory tracking
• 2-sample testing: n-point correlation O(Nn)• Cross-match: bipartite matching O(N3)
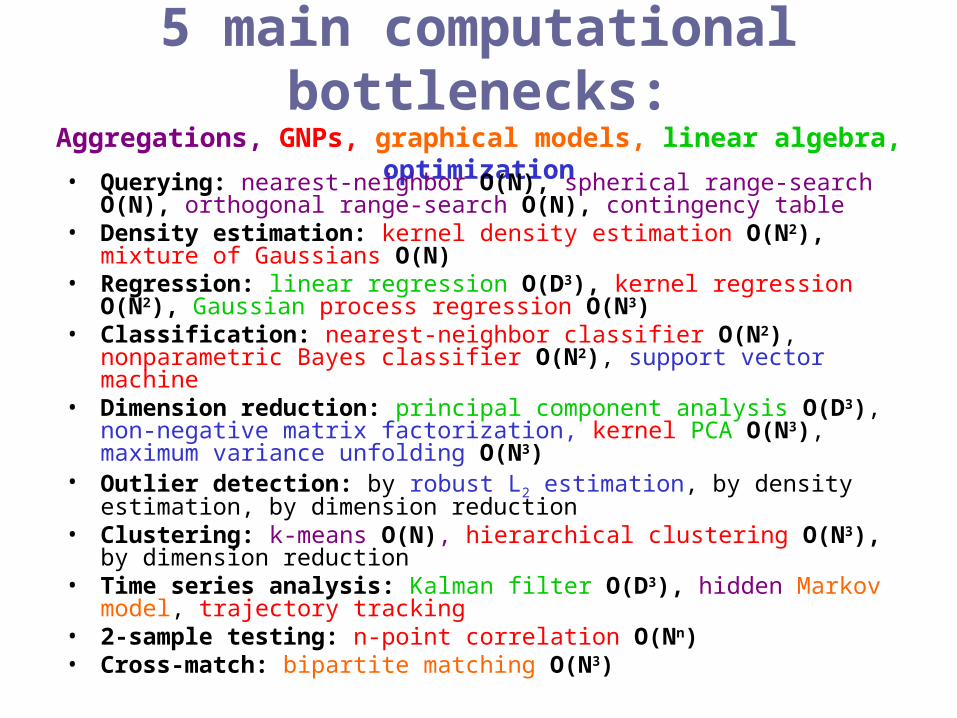
5 main computational bottlenecks:Aggregations, GNPs, graphical models, linear algebra, optimization
• Querying: nearest-neighbor O(N), spherical range-search O(N), orthogonal range-search O(N), contingency table
• Density estimation: kernel density estimation O(N2), mixture of Gaussians O(N)
• Regression: linear regression O(D3), kernel regression O(N2), Gaussian process regression O(N3)
• Classification: nearest-neighbor classifier O(N2), nonparametric Bayes classifier O(N2), support vector machine
• Dimension reduction: principal component analysis O(D3), non-negative matrix factorization, kernel PCA O(N3), maximum variance unfolding O(N3)
• Outlier detection: by robust L2 estimation, by density estimation, by dimension reduction
• Clustering: k-means O(N), hierarchical clustering O(N3), by dimension reduction
• Time series analysis: Kalman filter O(D3), hidden Markov model, trajectory tracking
• 2-sample testing: n-point correlation O(Nn)• Cross-match: bipartite matching O(N3)
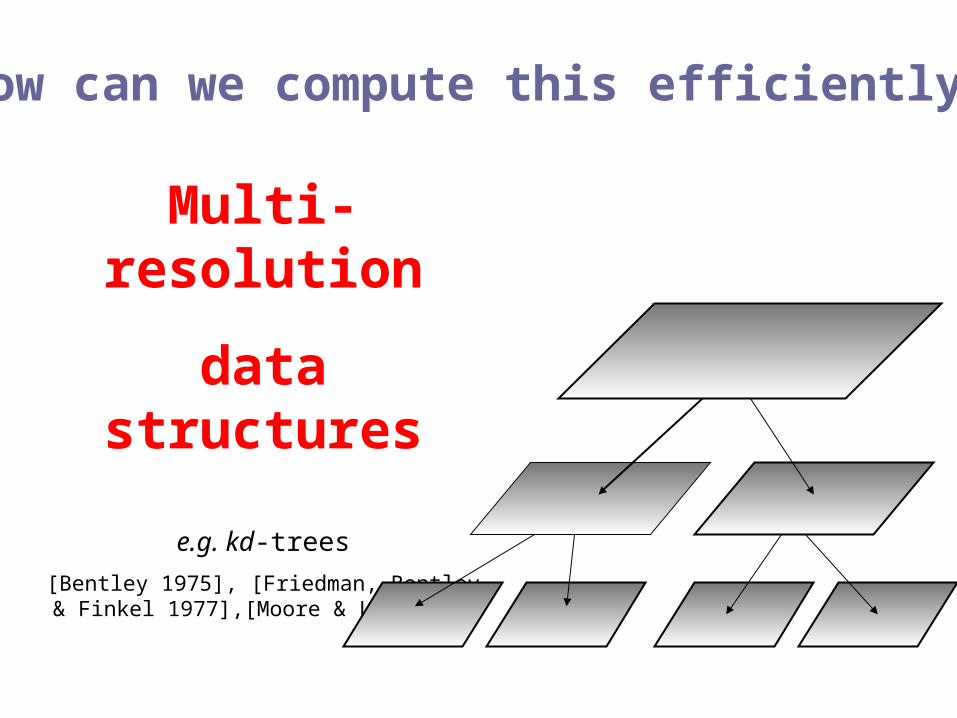
Multi-resolution
data structures
e.g. kd-trees
[Bentley 1975], [Friedman, Bentley & Finkel 1977],[Moore & Lee 1995]
How can we compute this efficiently?

A kd-tree: level 1
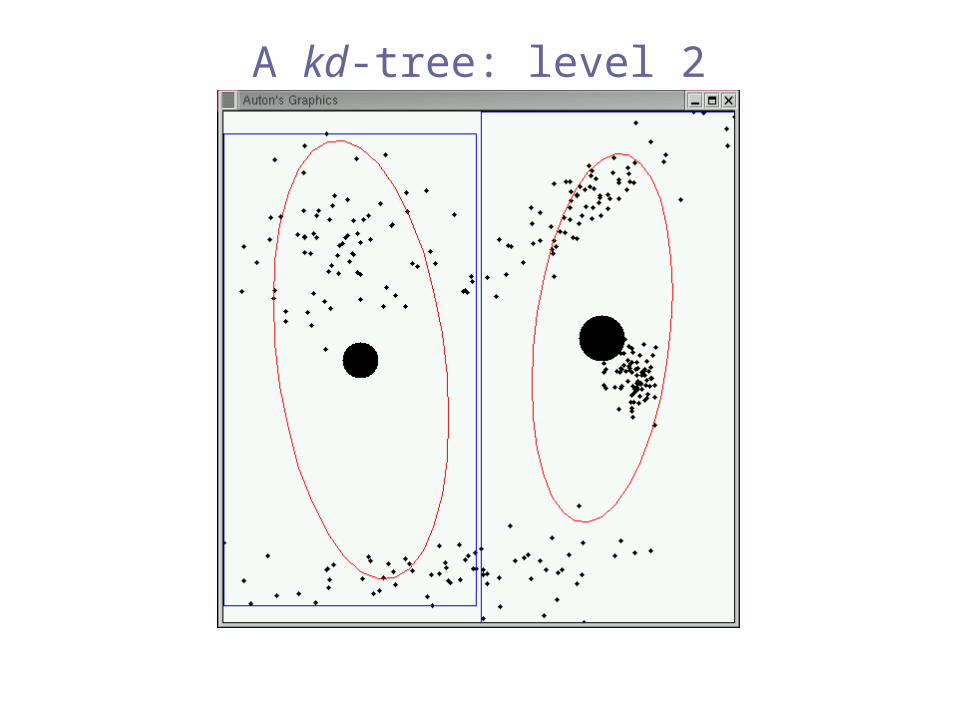
A kd-tree: level 2
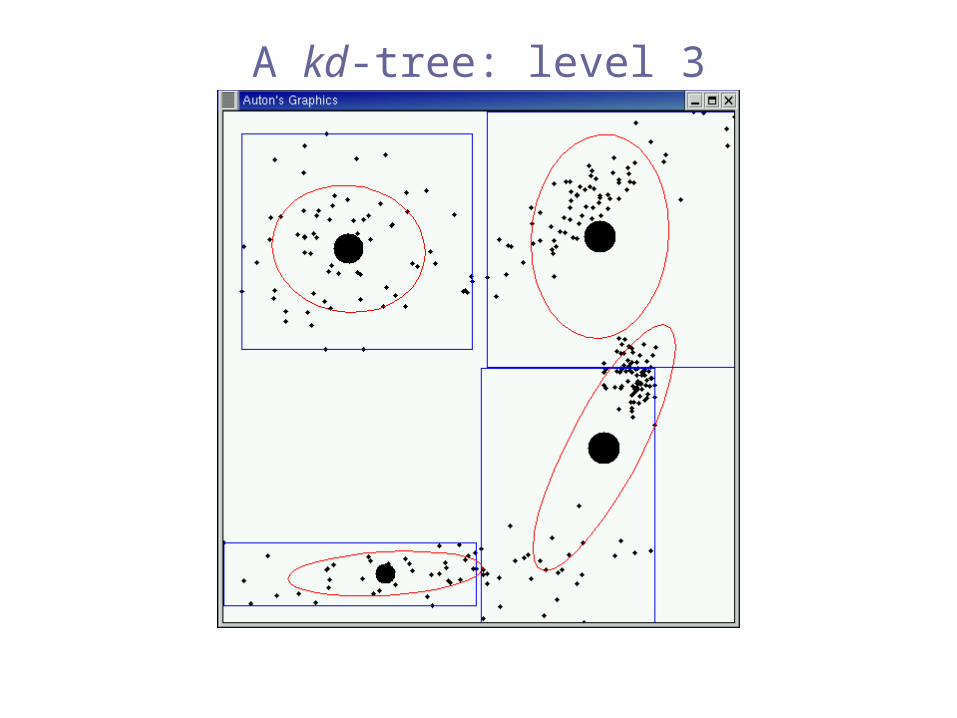
A kd-tree: level 3
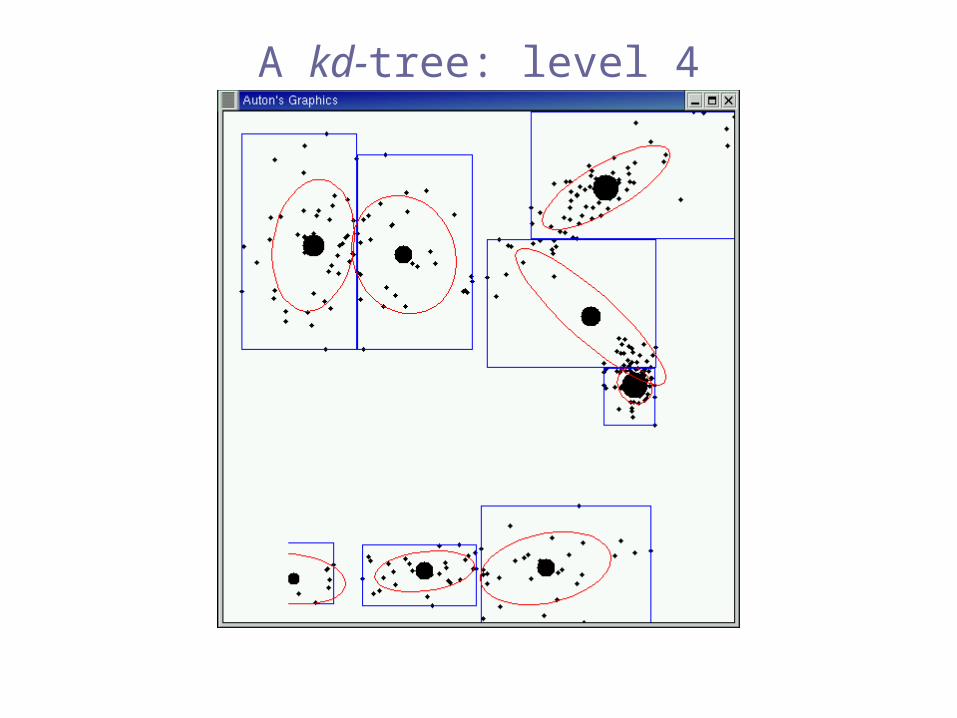
A kd-tree: level 4
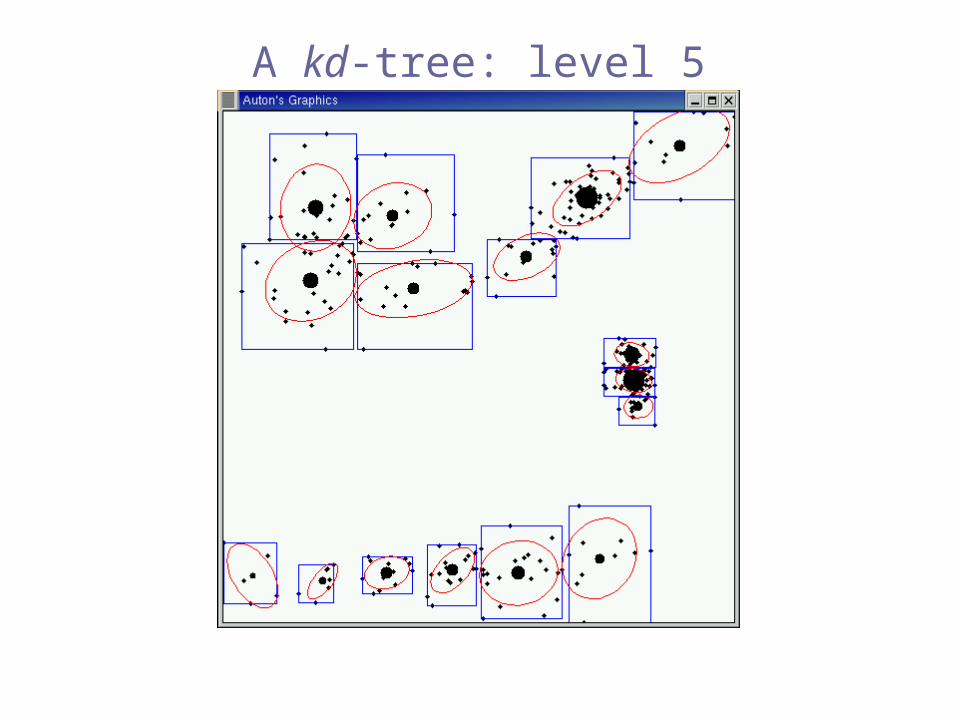
A kd-tree: level 5
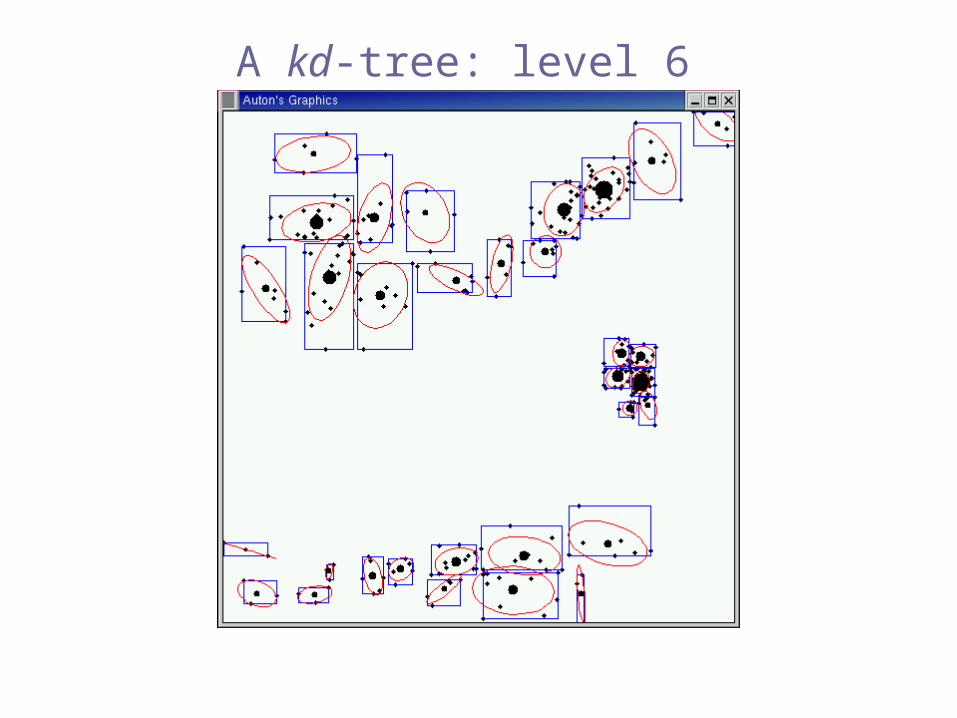
A kd-tree: level 6
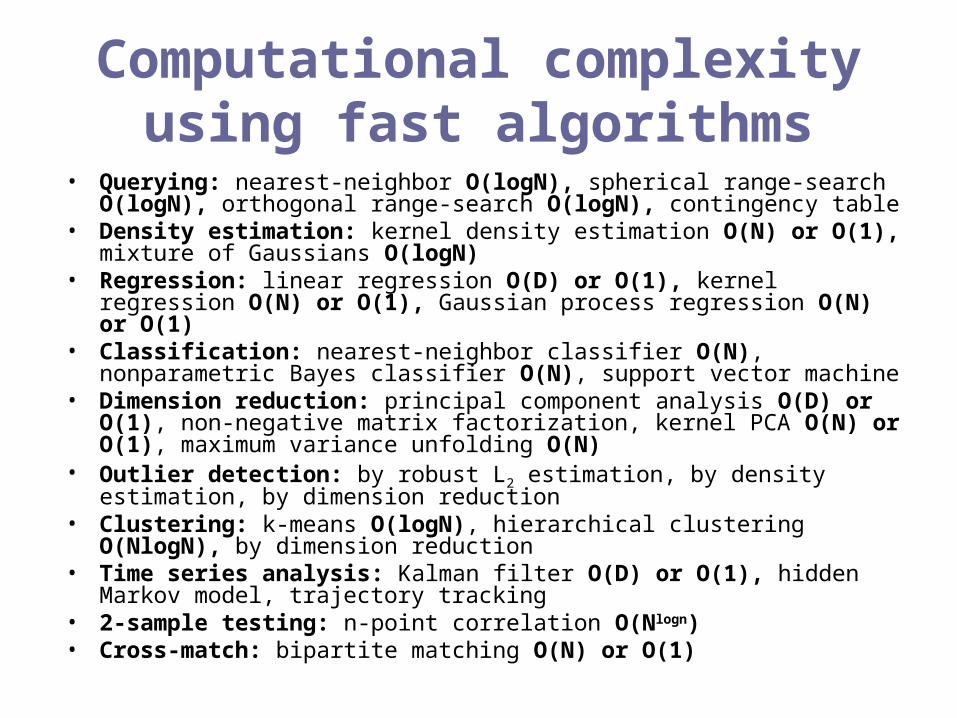
Computational complexityusing fast algorithms
• Querying: nearest-neighbor O(logN), spherical range-search O(logN), orthogonal range-search O(logN), contingency table
• Density estimation: kernel density estimation O(N) or O(1), mixture of Gaussians O(logN)
• Regression: linear regression O(D) or O(1), kernel regression O(N) or O(1), Gaussian process regression O(N) or O(1)
• Classification: nearest-neighbor classifier O(N), nonparametric Bayes classifier O(N), support vector machine
• Dimension reduction: principal component analysis O(D) or O(1), non-negative matrix factorization, kernel PCA O(N) or O(1), maximum variance unfolding O(N)
• Outlier detection: by robust L2 estimation, by density estimation, by dimension reduction
• Clustering: k-means O(logN), hierarchical clustering O(NlogN), by dimension reduction
• Time series analysis: Kalman filter O(D) or O(1), hidden Markov model, trajectory tracking
• 2-sample testing: n-point correlation O(Nlogn)• Cross-match: bipartite matching O(N) or O(1)
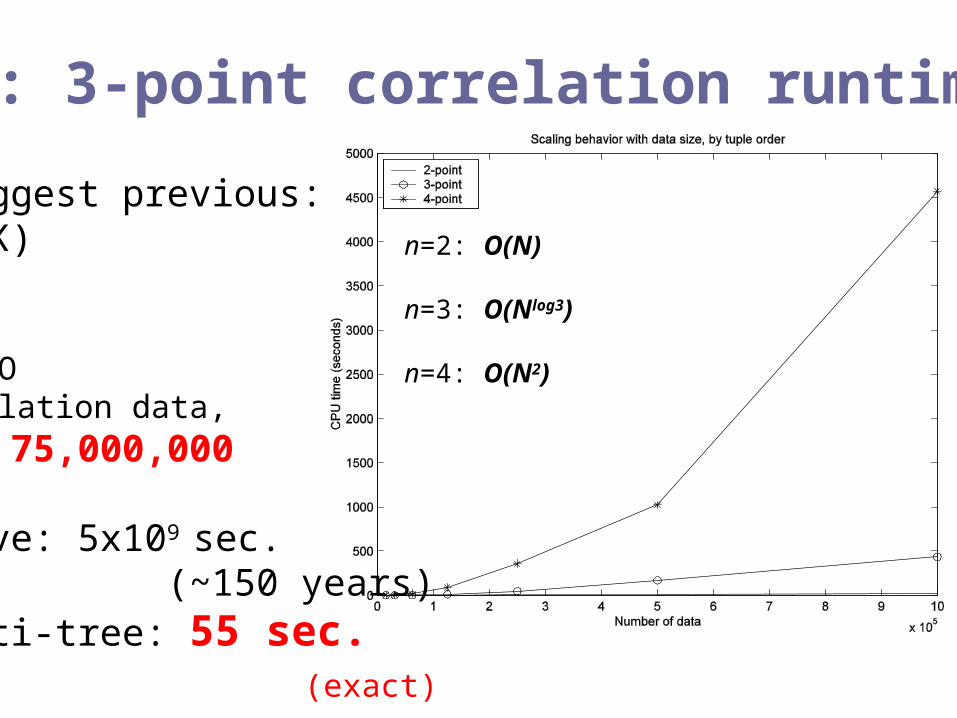
Ex: 3-point correlation runtime
(biggest previous: 20K)
VIRGO simulation data,N = 75,000,000
naïve: 5x10⁹ sec. (~150 years)multi-tree: 55 sec. (exact)
n=2: O(N)
n=3: O(Nlog3)
n=4: O(N2)
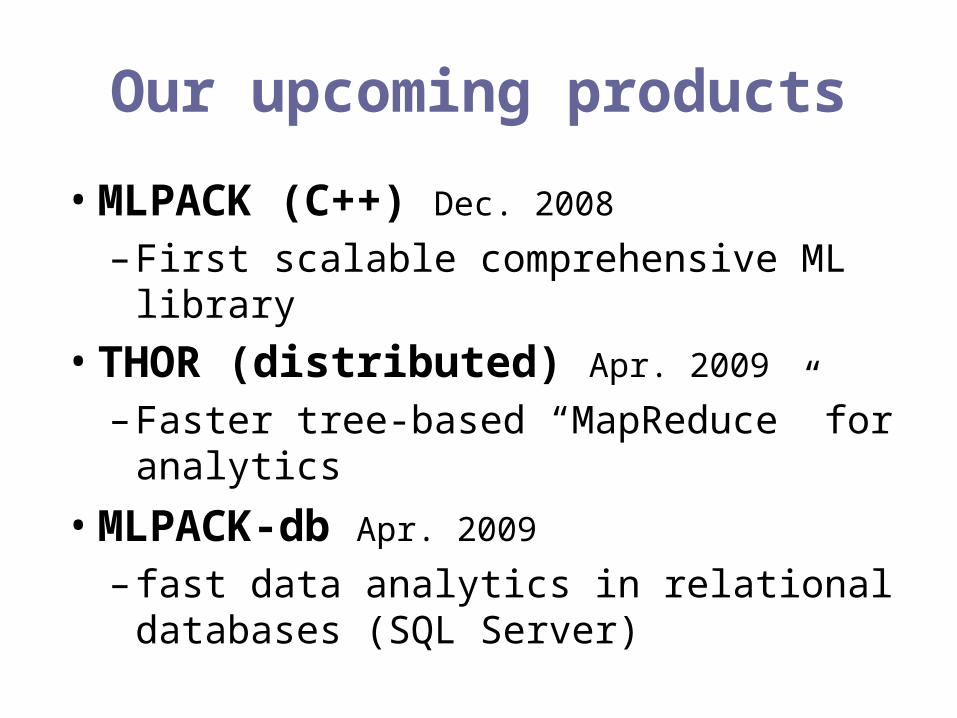
Our upcoming products
• MLPACK (C++) Dec. 2008
– First scalable comprehensive ML library
• THOR (distributed) Apr. 2009
– Faster tree-based “MapReduce” for analytics
• MLPACK-db Apr. 2009 – fast data analytics in relational
databases (SQL Server)
The end
• It’s possible to scale up all statistical methods
• …with smart algorithms, not just brute force
• Look for MLPACK (C++), THOR (distributed), MLPACK-db (RDBMS)
Alexander Gray [email protected](email is best; webpage sorely out of date)
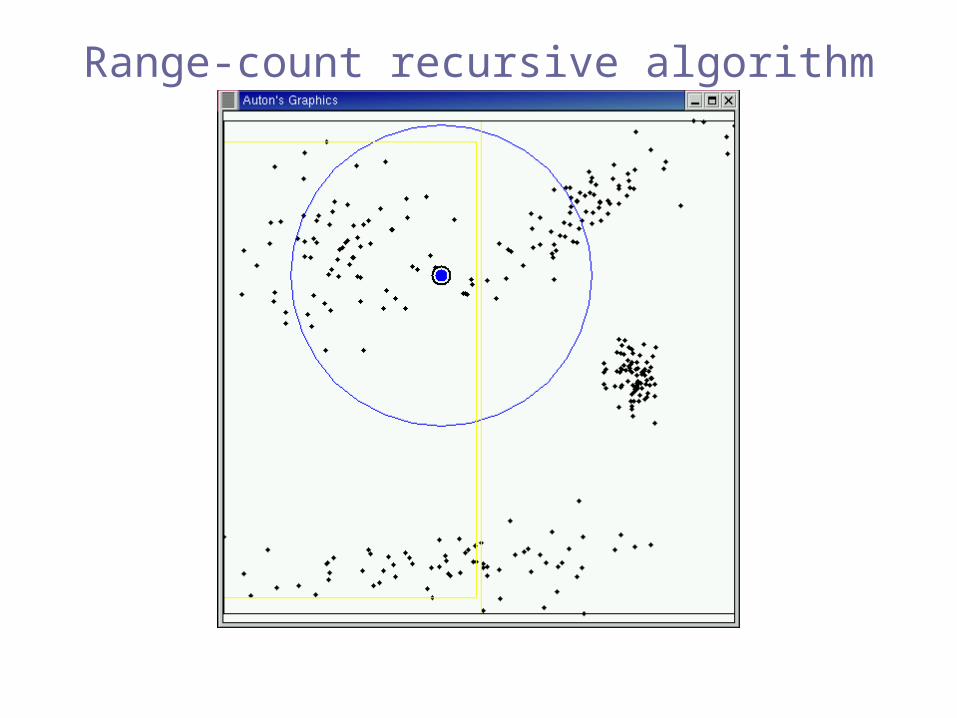
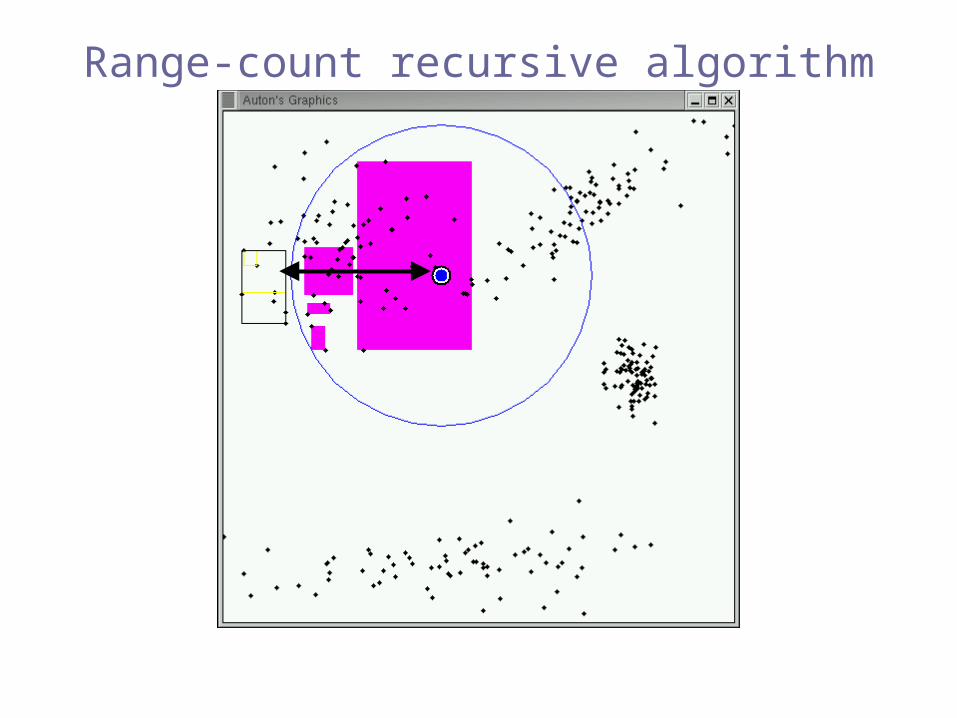
Range-count recursive algorithm
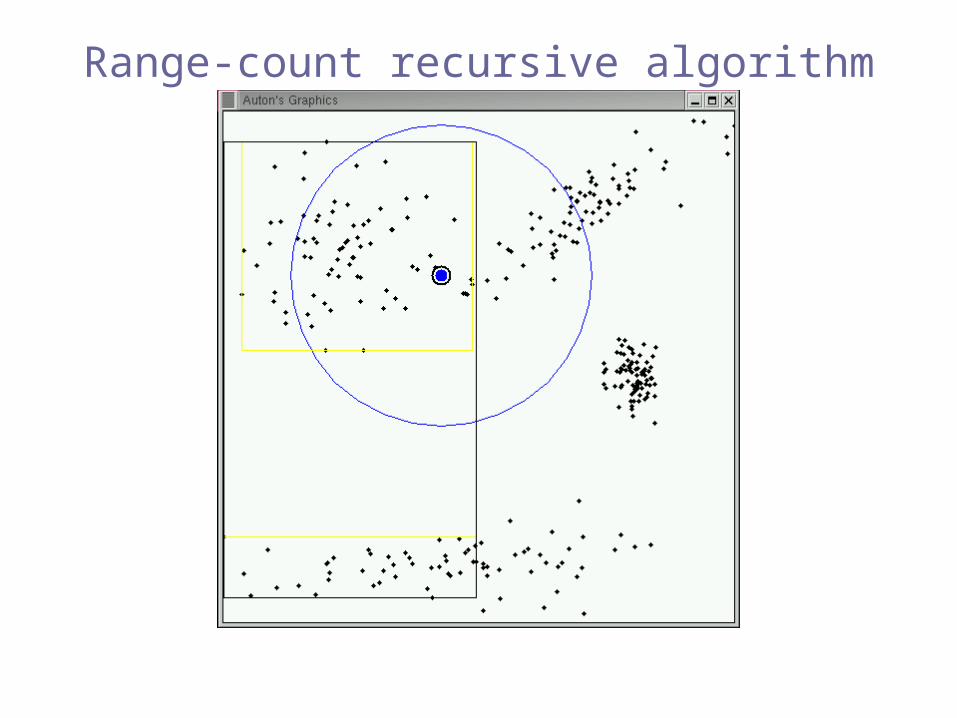
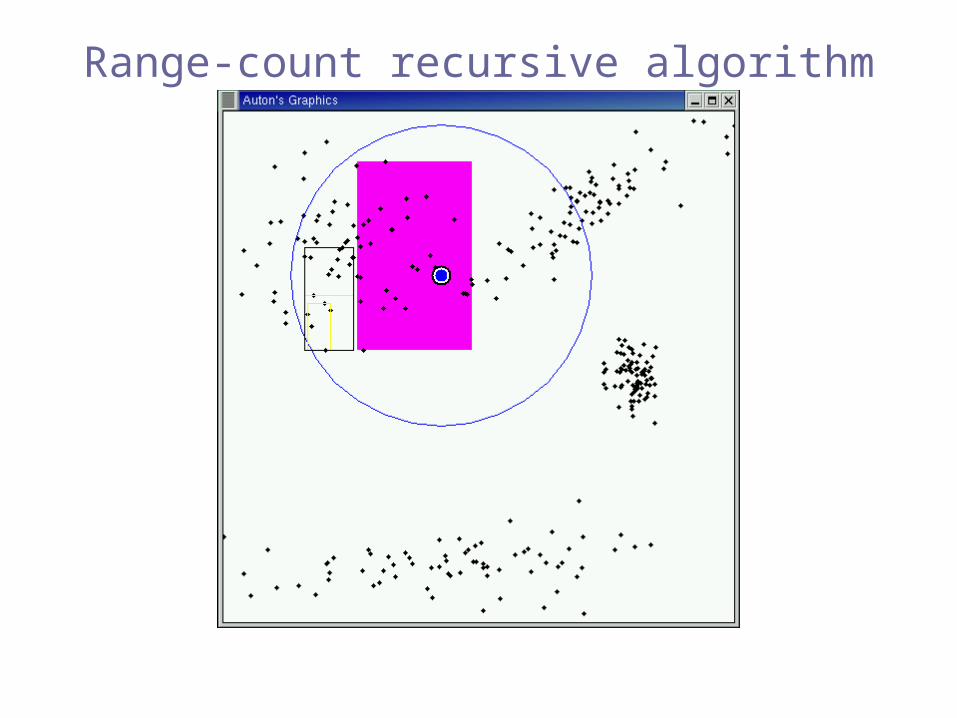
Range-count recursive algorithm
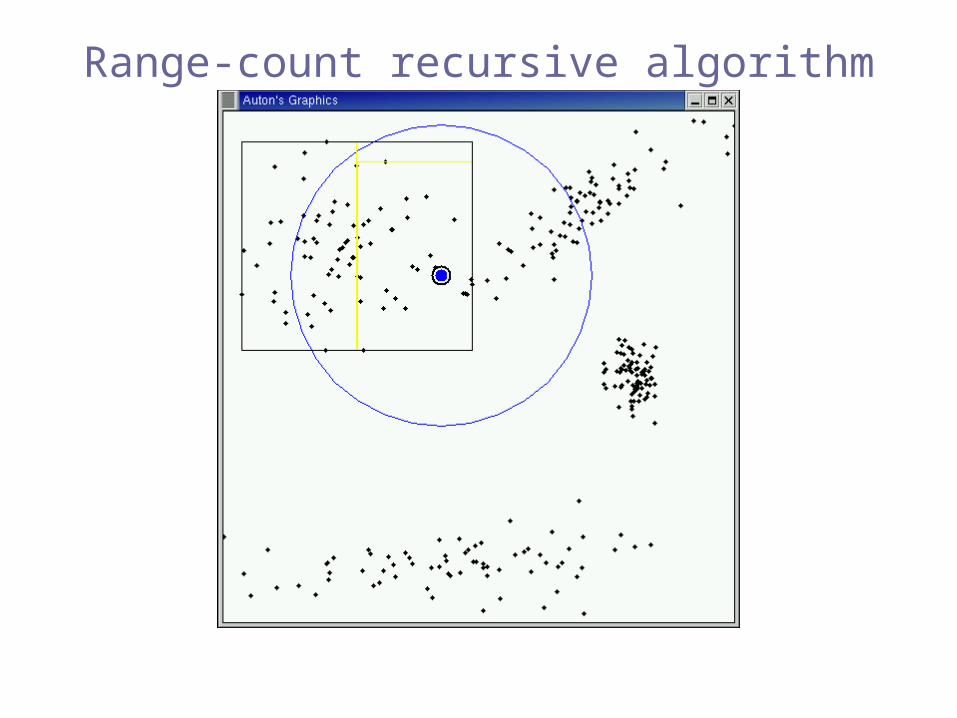
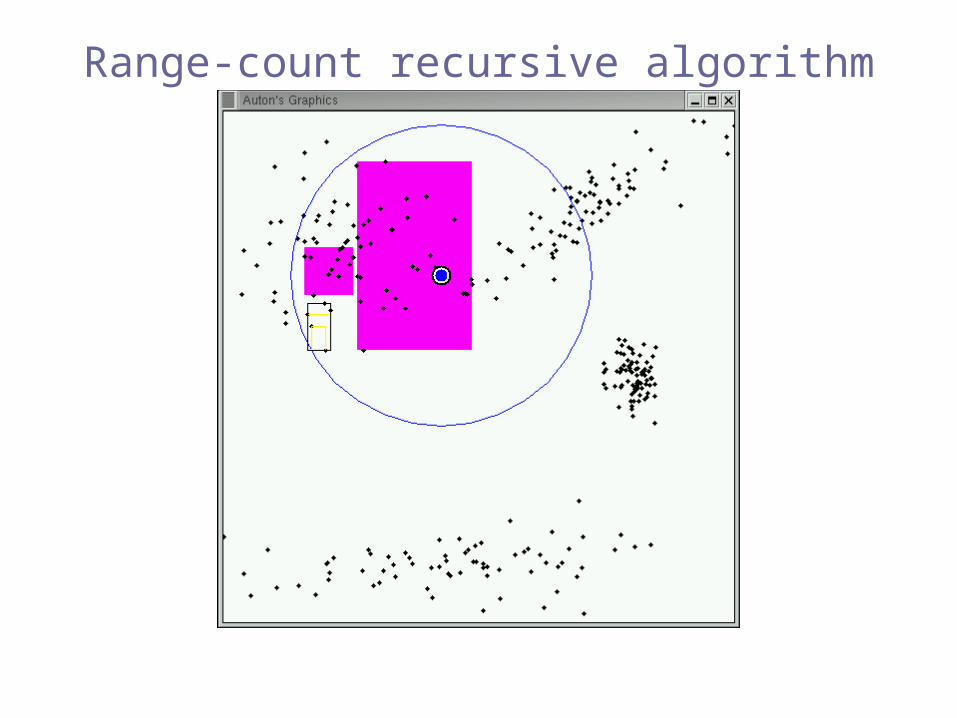
Range-count recursive algorithm
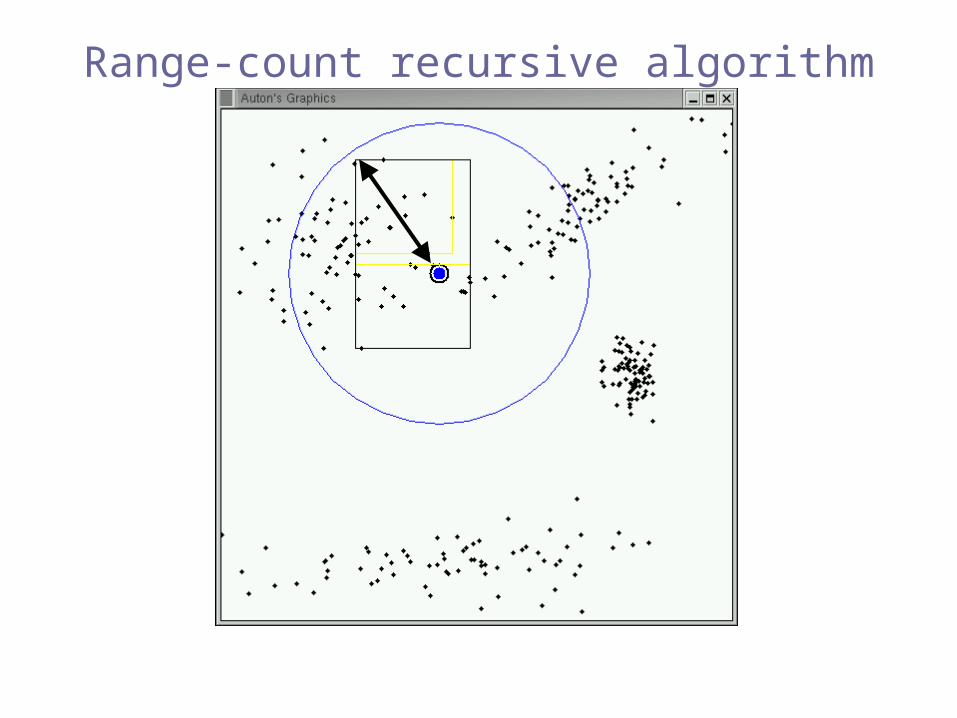
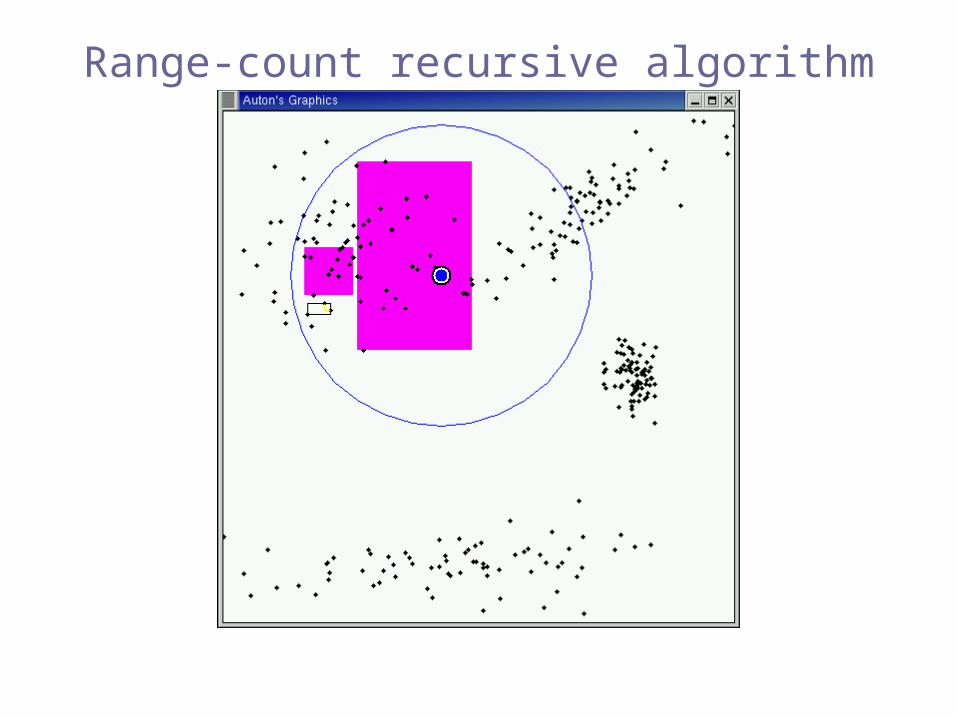
Range-count recursive algorithm
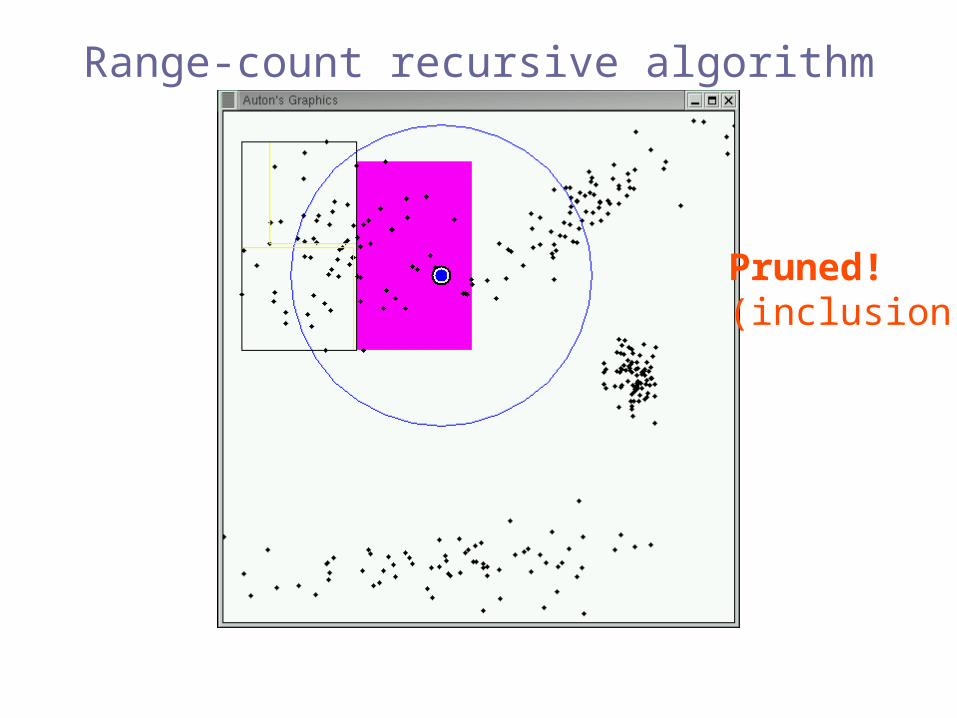
Pruned!(inclusion)
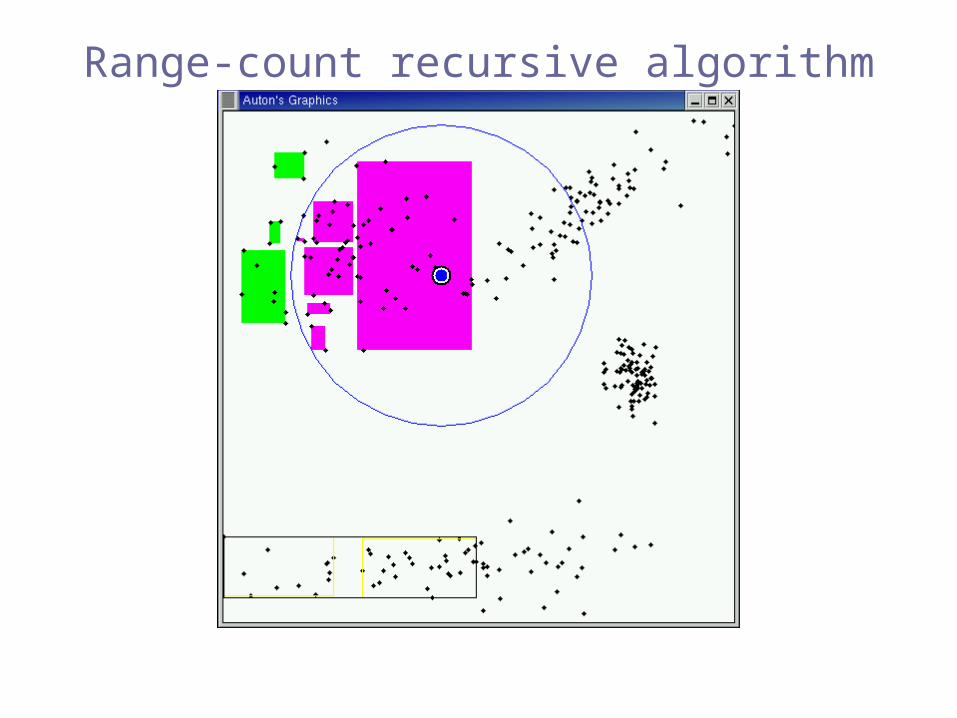
Range-count recursive algorithm

Range-count recursive algorithm
Range-count recursive algorithm

Range-count recursive algorithm
Range-count recursive algorithm
Range-count recursive algorithm

Range-count recursive algorithm
Range-count recursive algorithm

Pruned!(exclusion)
Range-count recursive algorithm
Range-count recursive algorithm
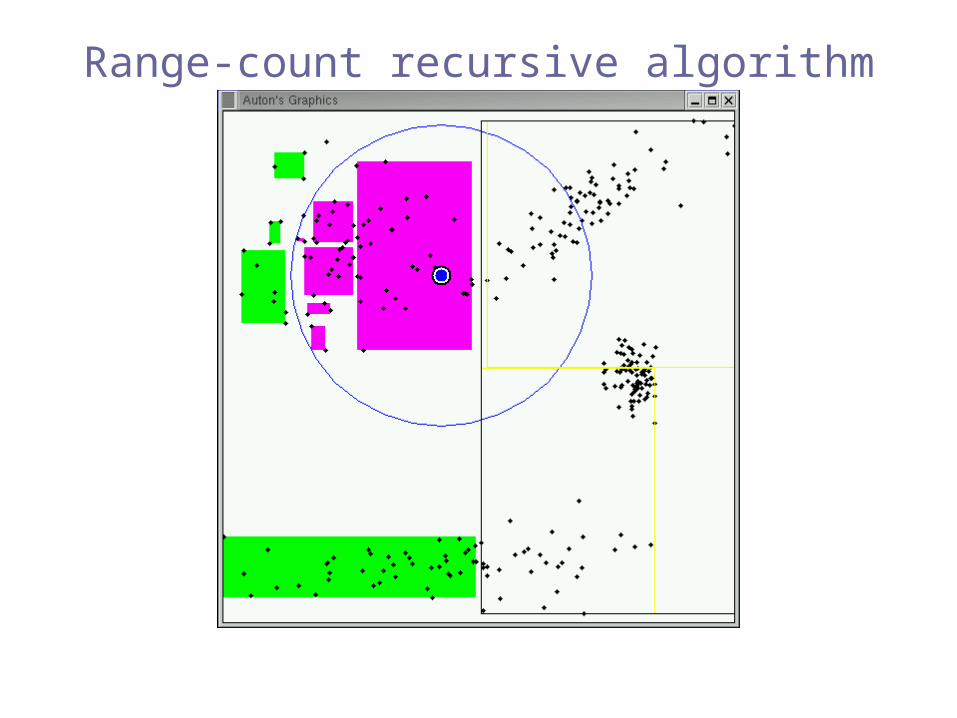
Range-count recursive algorithm
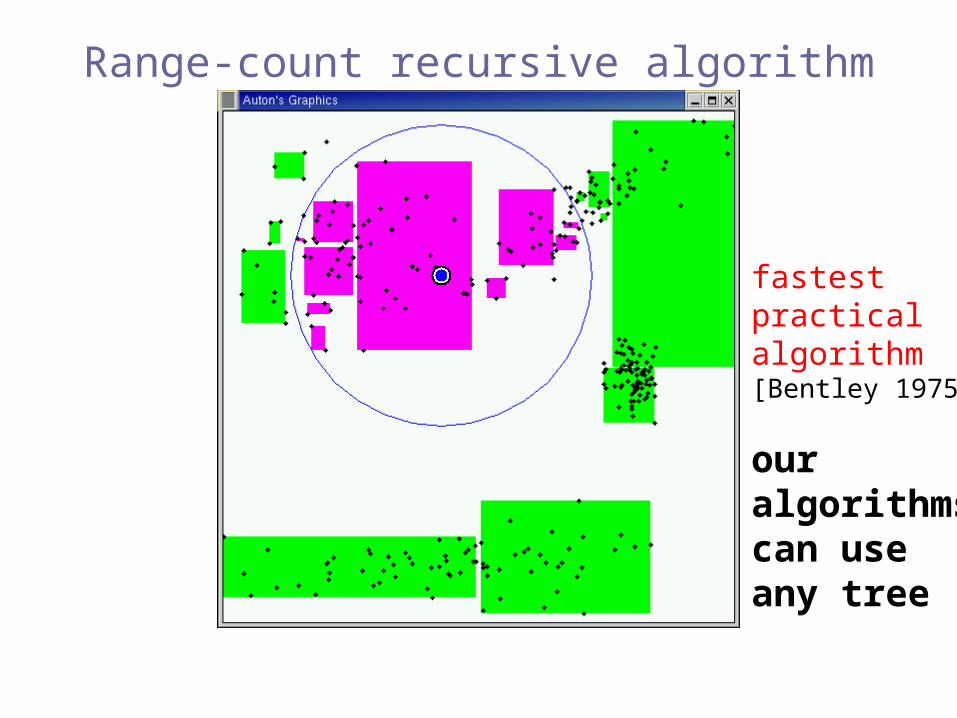
fastestpracticalalgorithm[Bentley 1975]
our algorithmscan use any tree
Range-count recursive algorithm


![[Rajaraman,Ullman] Mining of Massive Datasets](https://img.pdfslide.net/doc/110x75/577cb4141a28aba7118c4a6f/rajaramanullman-mining-of-massive-datasets.jpg)