Embed Size (px)
Citation preview
05/05/2021 – Ver. 1.0.0
HOW-TO GUIDE
Canary Data Trends in
WinCC
This Technical Note contains all the information required to visualize data trends
from a Canary Historian in Siemens WinCC.
TECH NOTE
2
TOC
Element8 Tech Note
1. Introduction ............................................................................... 3
2. Visualization in Siemens WinCC ................................................ 4
3. How not to visualize in WinCC .................................................. 9
4. Summary ................................................................................... 14

3
1. Introduction
This technical note will discuss how to visualize data trends from a Canary Historian in
Siemens WinCC.
The whole idea is to embed Canary Axiom trend charts within SCADA packages to
provide crucial data via HMI screens. To script existing SCADA objects to pass historical
data requests to trends charts are often difficult. Axiom has a feature that simplifies this
task, called URL parameters. The URL parameters can help you to address the requests for
a specific tag(s), live mode & duration of the client usage, and the live edge of the chart.
Some SCADA applications use iframes to embed web applications, and the Axiom Core is
not aware when the Axiom client in no longer being used. To overcome this limitation, the
timeout parameter can be used. There are many different URL parameters that gives you
the ability to write basic script in your SCADA application and send data feeds to a single
trend chart instance, no matter how the embedding is being done.
To read up more on how URL Parameters for Axiom Create Endless Visualization
Possibilities, you can check out the blog post here:
https://blog.canarylabs.com/url-parameters-for-axiom-create-endless-visualization-
possibilities
Going back to basics, the Historian in this document refers to the Canary Labs Enterprise
Historian. This Historian is a NoSQL time series database that utilizes loss-less compression
algorithms to provide high speed performance without requiring data interpolation.
Data Trends are a visualization of your data, and it enables you to assess how the data
has changed over time.
Siemens WinCC is a control and data HMI system that is used to monitor and control
physical processes on large scale and over long distances under Windows for all industry
segments. The latest release date is October 2018 for version 7.5
Note that there is a newer WinCC product, called WinCC Unified. It is a new visualization
system that enables digitization in machine and plant engineering. The Canary Axiom tool
can be fully integrated in this newest software package to visualize data trends.
Ensure that you have WinCC and Canary installed on the same machine before
continuing with this Technote.
There are 2 ways that you can implement integration to visualise data trends from a
Canary Historian in WinCC:
1. Visualization in Siemens WinCC
2. How not to visualize in WinCC
These steps are described in greater detail in the following sections

4
2. Visualization in Siemens WinCC 1. The first thing to do is open the desired WinCC project in which you would like to
visualize the data trends from the Canary Historian. Your WinCC Explorer should be
open.
2. Click on the “Graphics Designer” option that can be found in the left-hand menu
beneath your opened project.
3. You will see the Graphics Designer window pop-up as an additional screen. This is
where all graphics for a project can be designed and created by the user. There are
multiple options to choose from on the right-hand menu. Click on the “Control” smart
object option and drag it to the middle of the screen

5
4. The “Insert a Control” screen will pop-up. Scroll all the way up and click on the “Canary
Labs Trend Link Control” option. Note that the Canary Labs controls will only be
available in WinCC if the Canary Labs Trend Link is installed locally on the same
machine. The last Canary installer that has the Trend Link included is version 20.
The control will be created as a small object in the designer tab. Just click and
drag to enlarge the control to the desired size.

6
5. Next up is to provide the control object with data that is imported from the Canary
Historian. Double-click on the control object. The “Canary Labs Trend Link Control
Properties” screen will pop-up. To add Trends to the control, click on the “Add Trend(s)”
button
6. The “Add Trends” window will pop-up. Here you can browse the local machine or
remote machines to access a Canary Historian and choose tags which you wish to
trend

7
If you click on the “Browse Remote Computer…” option, you will be prompted with
another pop-up window to enter the computer IP address. Click on the “OK”
button to submit the request to connect to a remote computer
7. Once the connection has been successfully established, you will be able to browse
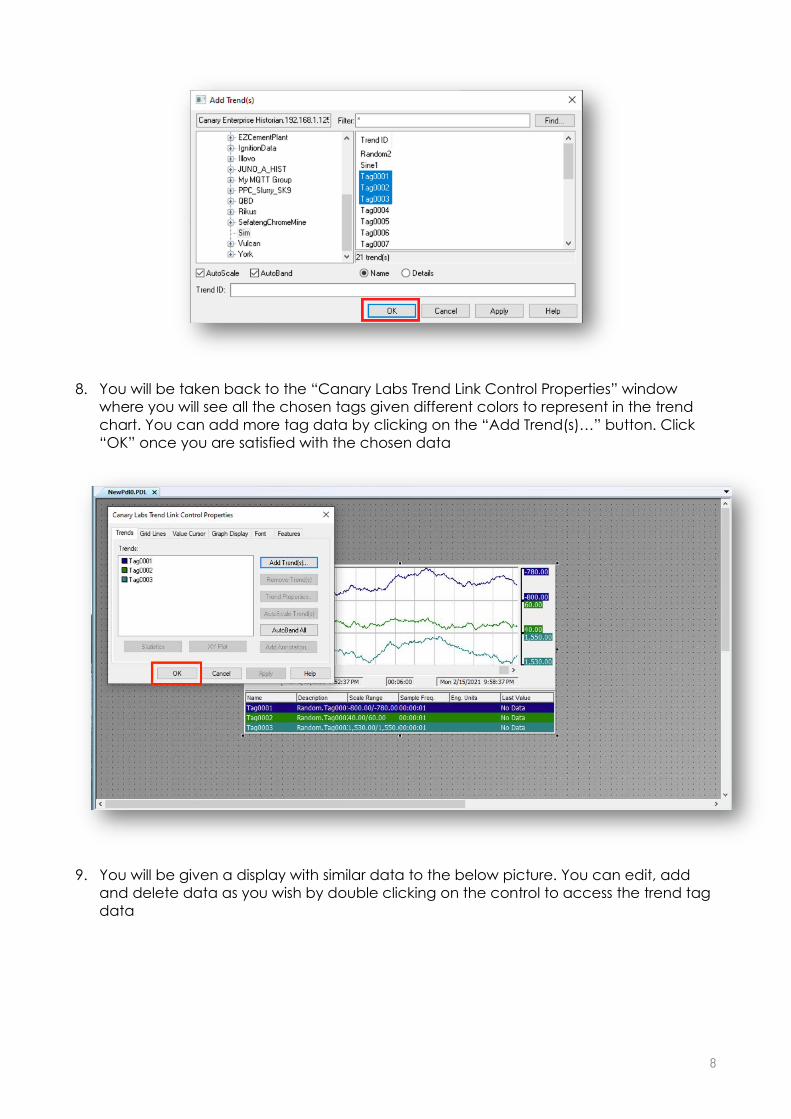
tags on the Canary Historian. Choose the tags you wish to add as trends (to choose
multiple, hold down the Ctrl button while selecting the tags) and click the “OK” button
8
8. You will be taken back to the “Canary Labs Trend Link Control Properties” window
where you will see all the chosen tags given different colors to represent in the trend
chart. You can add more tag data by clicking on the “Add Trend(s)…” button. Click
“OK” once you are satisfied with the chosen data
9. You will be given a display with similar data to the below picture. You can edit, add
and delete data as you wish by double clicking on the control to access the trend tag
data

9
3. How not to visualize in WinCC There is another way to visualize data from a Canary Historian in WinCC but is not
recommended. In essence it is done the same way as adding an iframe to an
application, but just with much older technology.
This is because the latest version of WinCC can not execute JavaScript code and hence
will not be able to load web browser applications in the project.
The process will still be explained step by step, so feel free to try it out yourself. If you do
get it to work and would like to impress us, pop us an email at [email protected],
with screenshots of course!
1. Redirect back to the Graphics Designer, and click on the “.NET Control” option in
the right side-panel

10
2. The “Insert a Control” screen will pop-up again. Scroll all the way down and click on
the “System.Windows.Form” option. Make sure to choose the latest version that is
4.0.0.0
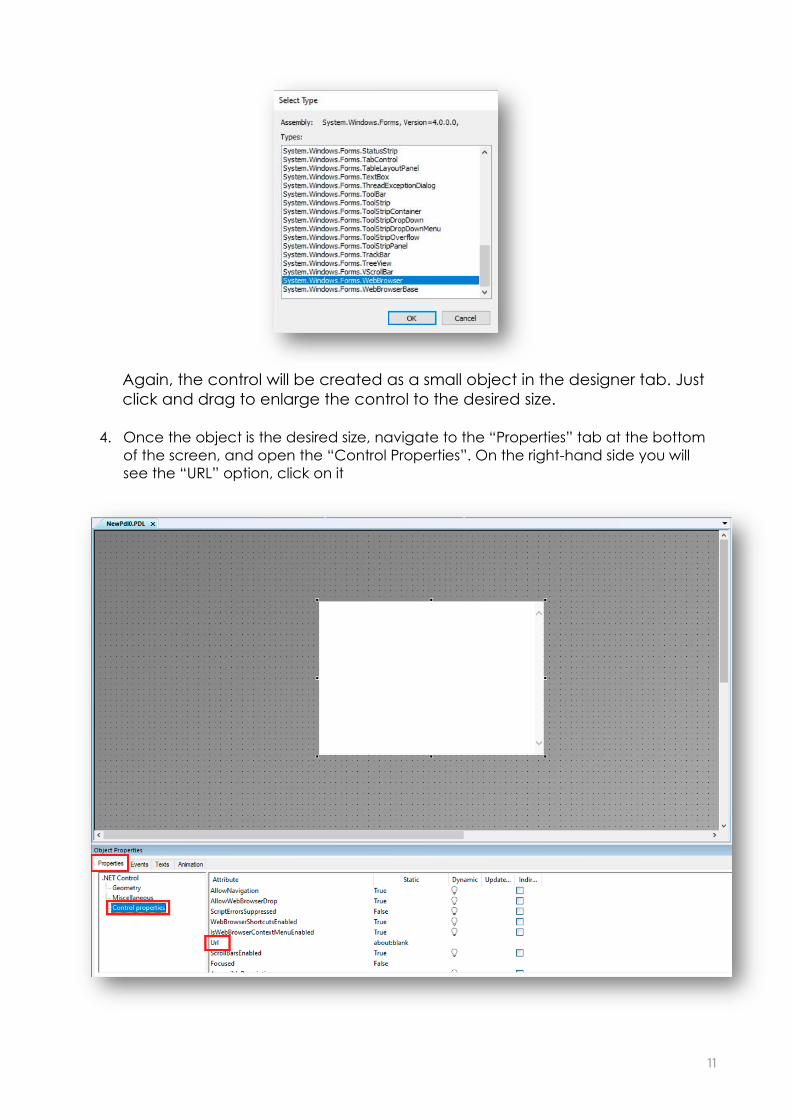
3. The “Select Type” screen will pop-up. Choose the
“System.Windows.Forms.WebBrowser” option. This is the control which run on the
same principal as an iframe since you specify a URL to which it will connect
11
Again, the control will be created as a small object in the designer tab. Just
click and drag to enlarge the control to the desired size.
4. Once the object is the desired size, navigate to the “Properties” tab at the bottom
of the screen, and open the “Control Properties”. On the right-hand side you will
see the “URL” option, click on it

12
5. This will open a “Text Input” window where you can enter the IP address of the web
application which you would like to visualize. For example, http://125.0.0.0:80
Remember to add the port to the back of the IP address. Click “OK” once done
6. You will see the following error stating that “An error has occurred in the script on
this page”. This is because WinCC cannot execute the web applications’
JavaScript code to embed it in the project. Remember, the .Net Control is NOT an
iframe, it just follows the same concept
7. If you click on the “Yes” button, the control will start initializing the specified web
application, but will not load data or the application any further.

13

14
4. Summary There are 2 ways that you can implement integration to visualise data trends from a
Canary Historian in WinCC; here is a summary of those ways:
1. Visualization in Siemens WinCC
2. How not to visualize in WinCC
For additional resourcing, please direct yourself to the Canary user manual:
https://help.canarylabs.com/hc/en-us
+27 (0)11 595 8458 [email protected] element8.co.za
Element8. Know your Limitless. The Pivot. Block C. Montecasino Boulevard. Fourways. Gauteng. 2055. South Africa. Authorised Distributor of Industry Leading Software: Ignition, Canary & Flow Software