Embed Size (px)
Citation preview
How To: Make a Fewer, Bigger, Better Approach Work in Innovation Practical Tips for Implementingby Scott Siegel
How
To:
Mak
e a
Few
er, B
igge
r, Be
tter
App
roac
h W
ork
in In
nova
tion
2
TABLE OF CONTENTS
The Case for Fewer, Bigger, Better The Innovation Target Gap The Pipeline Proliferation Problem
Digging Deeper: Fewer, Bigger, Better
The Basics of a Zero-Sum Approach Execution Benefits
Understanding Launch & Support Cadence
Things to Keep in Mind as You Get Started
To address their disappointing innovation results, many management teams advocate a strategy of launching Fewer, Bigger, Better products. While this is a sound approach, it has proven difficult to execute. Success requires the organizational resolve, discipline and confidence to launch fewer projects and still meet top-line innovation goals.
How
To:
Mak
e a
Few
er, B
igge
r, Be
tter
App
roac
h W
ork
in In
nova
tion
3 TABLE OF CONTENTS TABLE OF CONTENTS
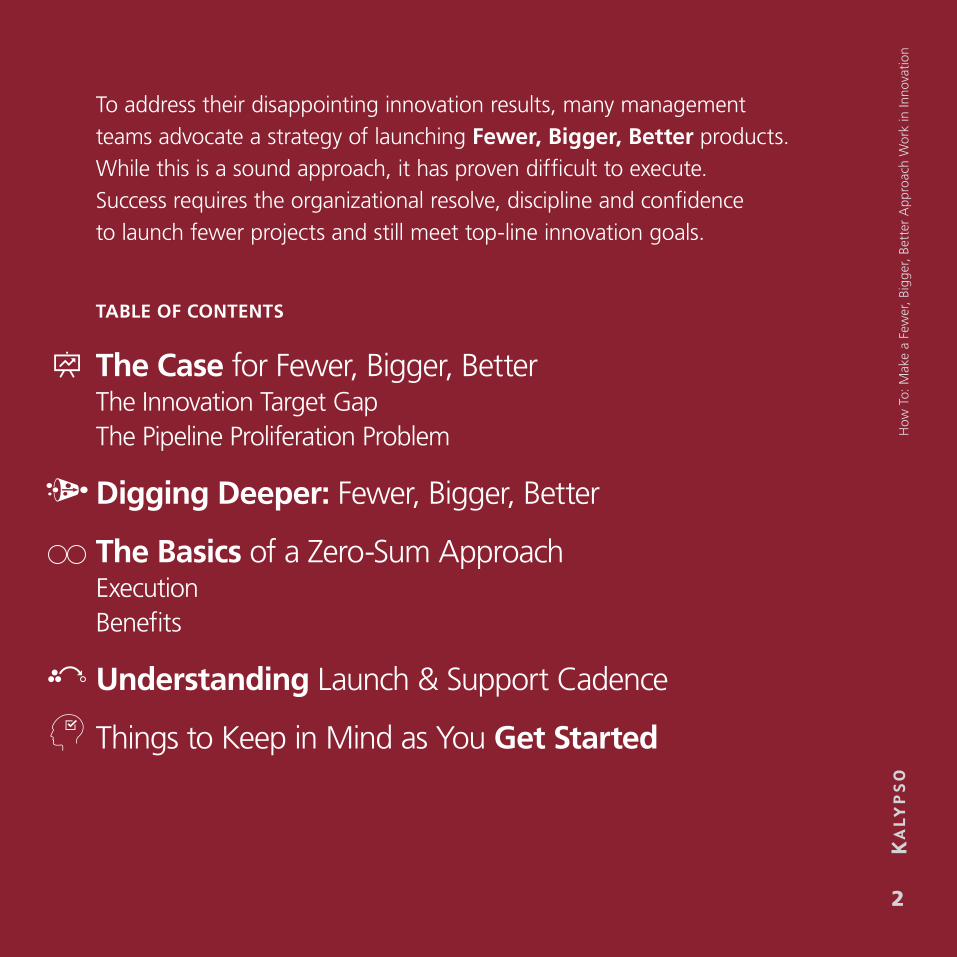
The Case for a Fewer, Bigger, Better ApproachMore so than almost any other industry, Consumer Packaged Goods (CPG) products rely heavily on substantial advertising, branding and promotional support for both core and new products to be successful.
In the 1950’s, the CPG industry set the standard for the 30-second TV commercial and classic product positioning tactics. As new social media and digital mediums have been introduced, the industry has kept pace and continues to have some of the highest levels of spending across companies and brands today.
However, consumers are increasingly bombarded with new products across these new channels and in stores, so even the current spend levels do not give new innovations the fighting chance to succeed in a crowded and competitive marketplace.
CPG companies must better acknowledge the realities of the spend required to drive awareness, trial, distribution and merchandising goals for new products. Innovation budgets are not likely to increase, so in order to secure sufficient support for prioritized products, companies need to reduce the number of new launches.
There were over 190,000 new UPCs
in the form of more than 9,500 new brand launches
in 20132
The most successful innovations have an
average spend of $26MM in Year 13
CPG (Food & Candy, Personal Care Products)
has 3rd highest industry spend
with little distance to #11
1 Source: Kantar Media, Jan-Sept 2014 2 Source: IRI 2013 New Product Pacesetters report 3 Source: Nielsen, 2014 Breakthrough Innovation Report 189
How
To:
Mak
e a
Few
er, B
igge
r, Be
tter
App
roac
h W
ork
in In
nova
tion
4 TABLE OF CONTENTS
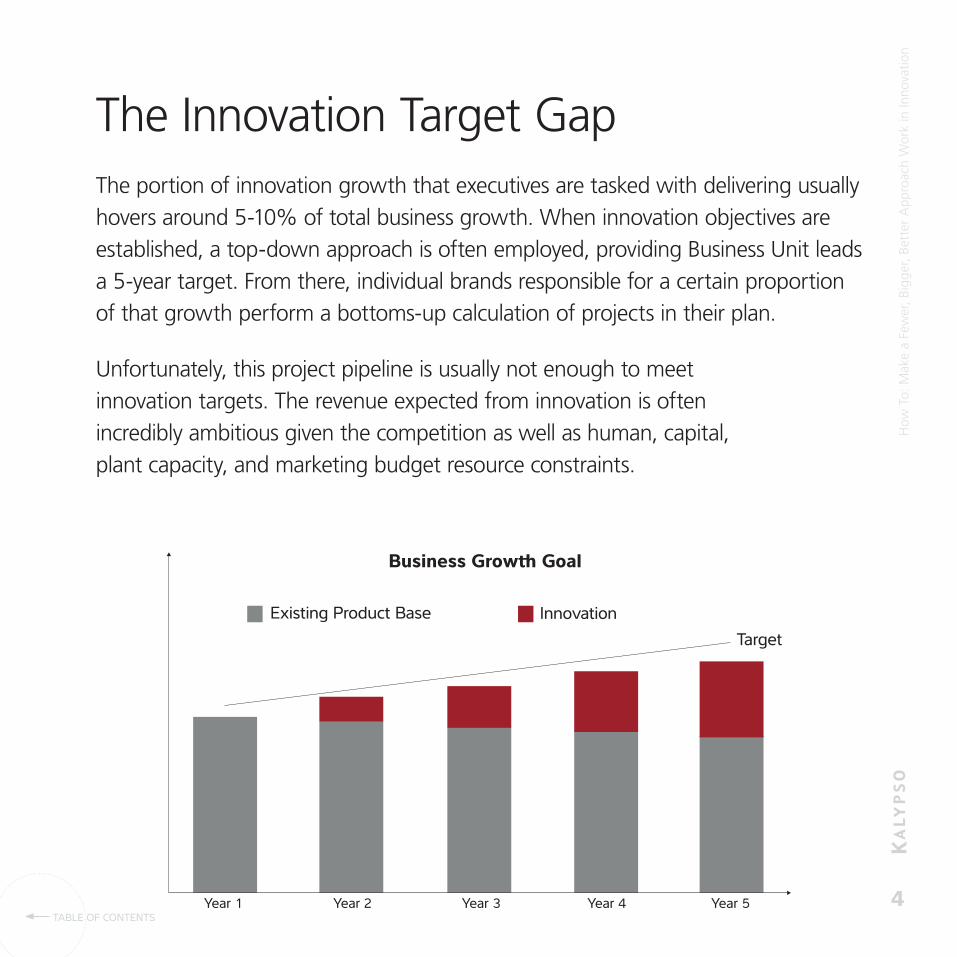
The Innovation Target GapThe portion of innovation growth that executives are tasked with delivering usually hovers around 5-10% of total business growth. When innovation objectives are established, a top-down approach is often employed, providing Business Unit leads a 5-year target. From there, individual brands responsible for a certain proportion of that growth perform a bottoms-up calculation of projects in their plan.
Unfortunately, this project pipeline is usually not enough to meet innovation targets. The revenue expected from innovation is often incredibly ambitious given the competition as well as human, capital, plant capacity, and marketing budget resource constraints.
Business Grow� Goal
Existing Product Base InnovationTarget
Year 1 Year 2 Year 3 Year 4 Year 5
Proliferation of �e Pipeline
Aggresive Innovations Targets
Core business, “ProductEngine” projects
Global strategies
Executive “pet” projects
Seasonal items
Marketing: scope, labeland graphic changes
Sales: any�ing and every�ing!
Wall Street Quarterly expectations
Retailers: exclusive products and formats
Consumers: changing preferences, heal� &
wellness trends
Regulatory: claim,allergen and nutrition
label requirements
Brand ProjectProjected Revenue
Brand A
Brand A
Brand A
Brand A
Brand B
Brand B
Brand B
Brand C
Brand C
Brand C
Project 1
Project 2
Project 3
Project 4
Project 5
Project 6
Project 7
Project 8
Project 9
Project 10
$20M
$25M
$5M
$50M
$15M
$3M
$3M
$50M
$20M
$20M
Planned PipelineINTERNAL EXTERNAL
Brand CP roject 10$ 20M
Brand ProjectProjected Revenue
Brand A
Brand A
Brand A
Brand A
Brand B
Brand B
Brand B
Brand C
Brand C
Project 1
Project 2
Project 3
Project 4
Project 5
Project 6
Project 7
Project 8
Project 9
$20M
$25M
$5M
$50M
$15M
$3M
$3M
$50M
$20M
Actual Pipeline
Brand CP roject 10$ 20M
Brand ProjectProjected Revenue
Brand A
Brand A
Brand A
Brand A
Brand B
Brand B
Brand B
Brand C
Brand C
Project 1
Project 2
Project 3
Project 4
Project 5
Project 6
Project 7
Project 8
Project 9
$20M
$25M
$5M
$50M
$15M
$3M
$3M
$50M
$20M
Actual Pipeline
Brand CP roject 10$ 20M
Brand ProjectProjected Revenue
Brand A
Brand A
Brand A
Brand A
Brand B
Brand B
Brand B
Brand C
Brand C
Project 1
Project 2
Project 3
Project 4
Project 5
Project 6
Project 7
Project 8
Project 9
$20M
$25M
$5M
$50M
$15M
$3M
$3M
$50M
$20M
Actual Pipeline
How
To:
Mak
e a
Few
er, B
igge
r, Be
tter
App
roac
h W
ork
in In
nova
tion
5 TABLE OF CONTENTS
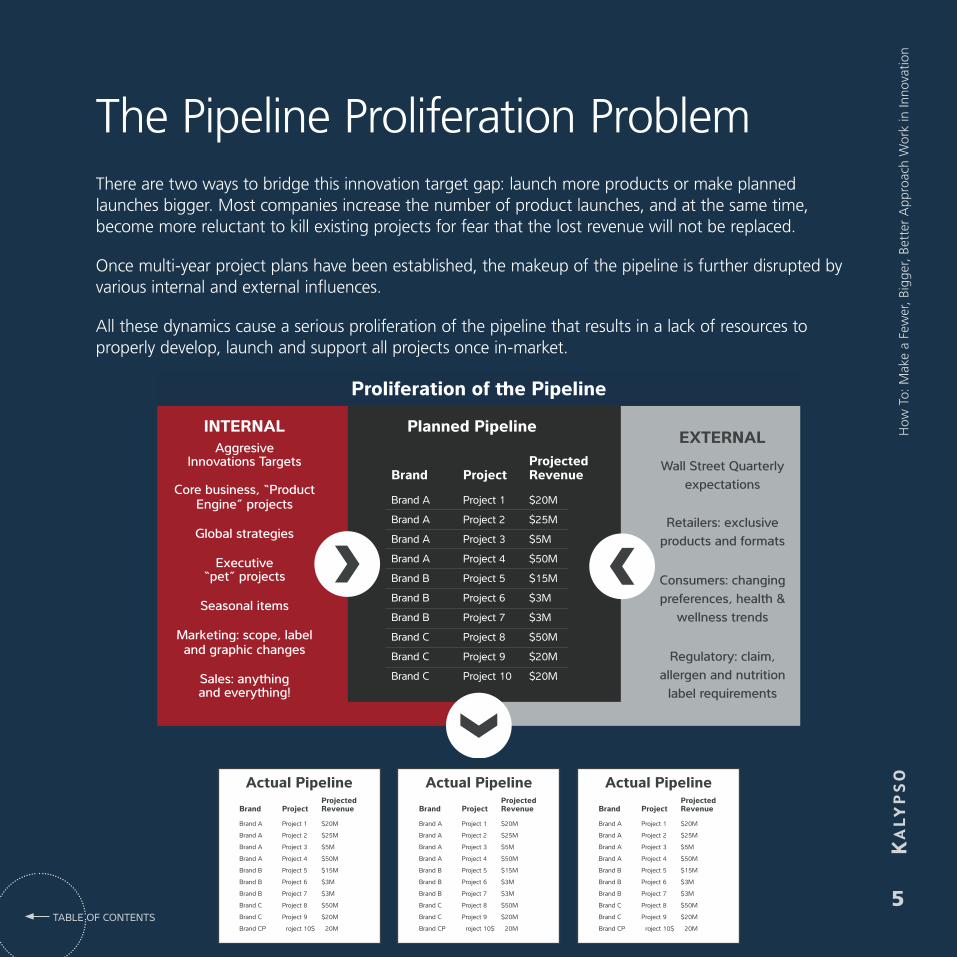
The Pipeline Proliferation ProblemThere are two ways to bridge this innovation target gap: launch more products or make planned launches bigger. Most companies increase the number of product launches, and at the same time, become more reluctant to kill existing projects for fear that the lost revenue will not be replaced.
Once multi-year project plans have been established, the makeup of the pipeline is further disrupted by various internal and external influences.
All these dynamics cause a serious proliferation of the pipeline that results in a lack of resources to properly develop, launch and support all projects once in-market.
How
To:
Mak
e a
Few
er, B
igge
r, Be
tter
App
roac
h W
ork
in In
nova
tion
6 TABLE OF CONTENTS
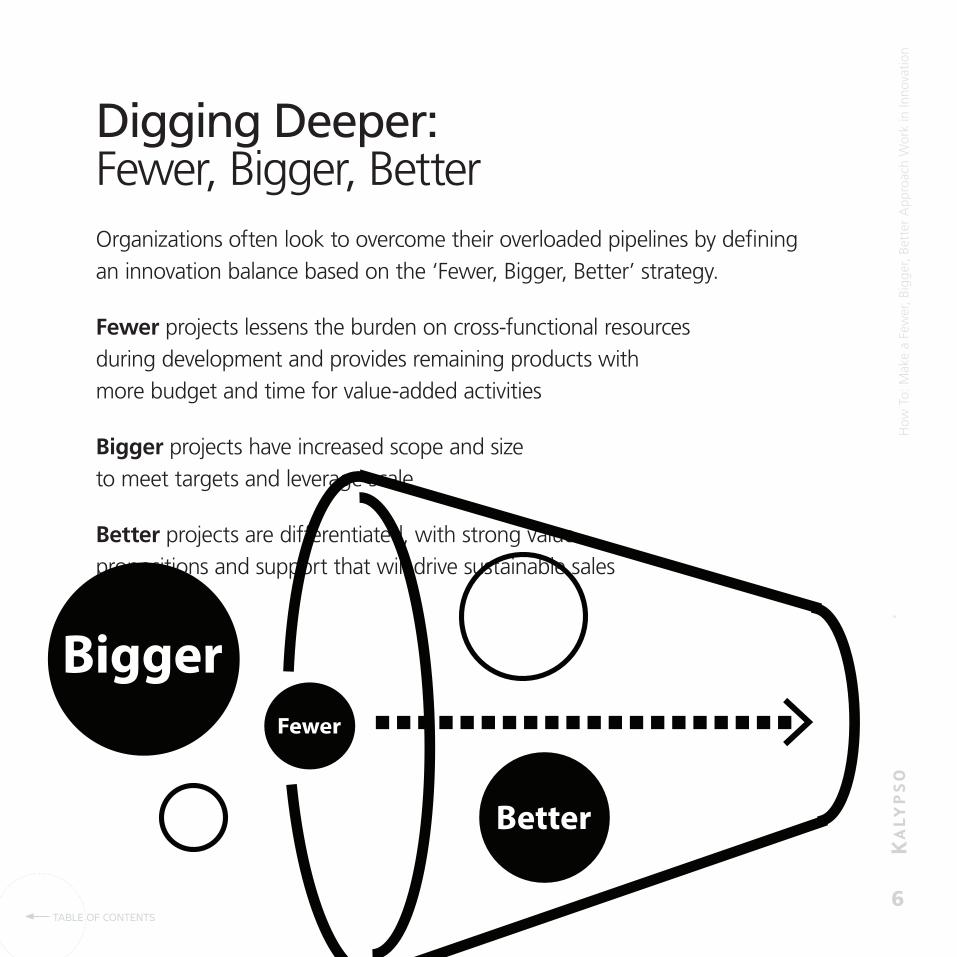
Digging Deeper: Fewer, Bigger, BetterOrganizations often look to overcome their overloaded pipelines by defining an innovation balance based on the ‘Fewer, Bigger, Better’ strategy.
Fewer projects lessens the burden on cross-functional resources during development and provides remaining products with more budget and time for value-added activities
Bigger projects have increased scope and size to meet targets and leverage scale
Better projects are differentiated, with strong value propositions and support that will drive sustainable sales
How
To:
Mak
e a
Few
er, B
igge
r, Be
tter
App
roac
h W
ork
in In
nova
tion
7
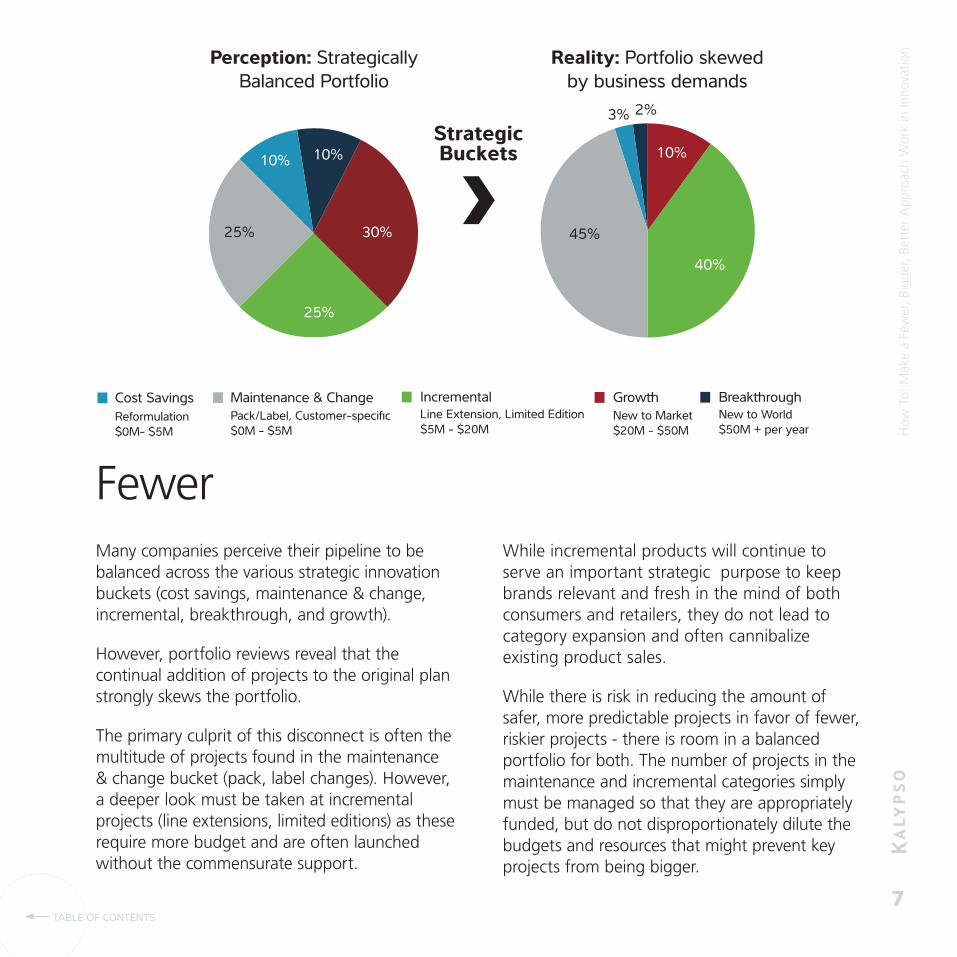
Cost SavingsReformulation$0M- $5M
Maintenance & ChangePack/Label, Customer-specific$0M - $5M
Break�roughNew to World$50M + per year
Grow�New to Market$20M - $50M
IncrementalLine Extension, Limited Edition$5M - $20M
30%
10%10%
25%
25%
10%
40%
45%
3% 2%
Perception: Strategically Balanced Portfolio
Reality: Portfolio skewed by business demands
TABLE OF CONTENTS
FewerMany companies perceive their pipeline to be balanced across the various strategic innovation buckets (cost savings, maintenance & change, incremental, breakthrough, and growth).
However, portfolio reviews reveal that the continual addition of projects to the original plan strongly skews the portfolio.
The primary culprit of this disconnect is often the multitude of projects found in the maintenance & change bucket (pack, label changes). However, a deeper look must be taken at incremental projects (line extensions, limited editions) as these require more budget and are often launched without the commensurate support.
While incremental products will continue to serve an important strategic purpose to keep brands relevant and fresh in the mind of both consumers and retailers, they do not lead to category expansion and often cannibalize existing product sales.
While there is risk in reducing the amount of safer, more predictable projects in favor of fewer, riskier projects - there is room in a balanced portfolio for both. The number of projects in the maintenance and incremental categories simply must be managed so that they are appropriately funded, but do not disproportionately dilute the budgets and resources that might prevent key projects from being bigger.
Strategic Buckets
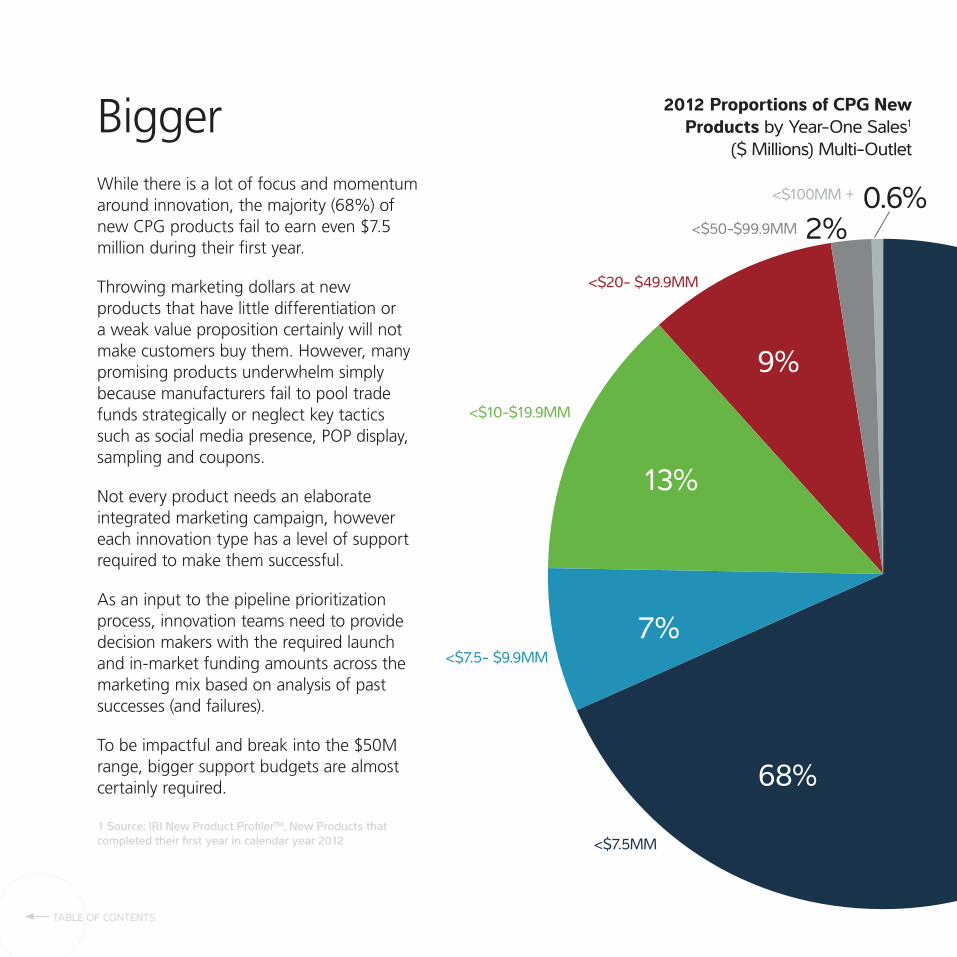
BiggerWhile there is a lot of focus and momentum around innovation, the majority (68%) of new CPG products fail to earn even $7.5 million during their first year.
Throwing marketing dollars at new products that have little differentiation or a weak value proposition certainly will not make customers buy them. However, many promising products underwhelm simply because manufacturers fail to pool trade funds strategically or neglect key tactics such as social media presence, POP display, sampling and coupons.
Not every product needs an elaborate integrated marketing campaign, however each innovation type has a level of support required to make them successful.
As an input to the pipeline prioritization process, innovation teams need to provide decision makers with the required launch and in-market funding amounts across the marketing mix based on analysis of past successes (and failures).
To be impactful and break into the $50M range, bigger support budgets are almost certainly required.
<$20- $49.9MM
<$50-$99.9MM
<$100MM +
<$10-$19.9MM
<$7.5- $9.9MM
<$7.5MM
68%
7%
13%
9%
0.6%2%
TABLE OF CONTENTS
1 Source: IRI New Product Profiler™, New Products that completed their first year in calendar year 2012
2012 Proportions of CPG New Products by Year-One Sales1
($ Millions) Multi-Outlet
How
To:
Mak
e a
Few
er, B
igge
r, Be
tter
App
roac
h W
ork
in In
nova
tion
9 TABLE OF CONTENTS
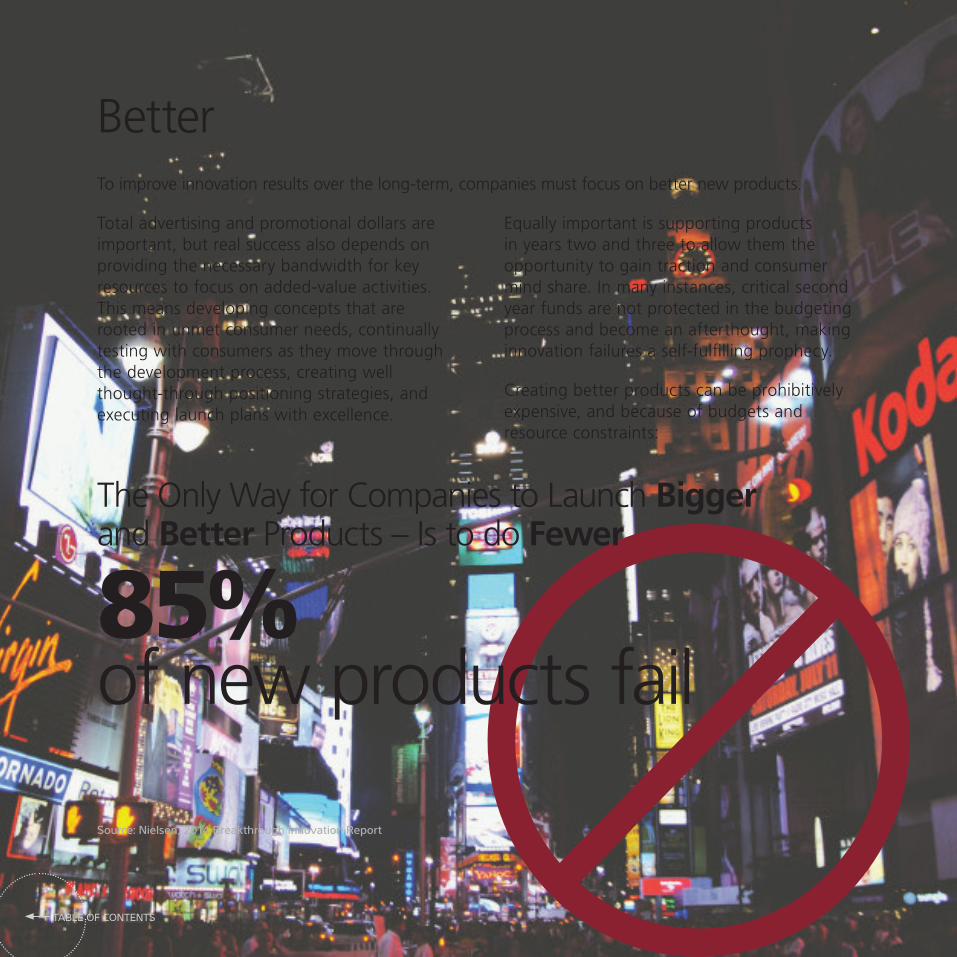
BetterTo improve innovation results over the long-term, companies must focus on better new products.
Total advertising and promotional dollars are important, but real success also depends on providing the necessary bandwidth for key resources to focus on added-value activities. This means developing concepts that are rooted in unmet consumer needs, continually testing with consumers as they move through the development process, creating well thought-through positioning strategies, and executing launch plans with excellence.
Equally important is supporting products in years two and three to allow them the opportunity to gain traction and consumer mind share. In many instances, critical second year funds are not protected in the budgeting process and become an afterthought, making innovation failures a self-fulfilling prophecy.
Creating better products can be prohibitively expensive, and because of budgets and resource constraints:
The Only Way for Companies to Launch Bigger and Better Products – Is to do Fewer
85%of new products fail
Source: Nielsen, 2014 Breakthrough Innovation Report
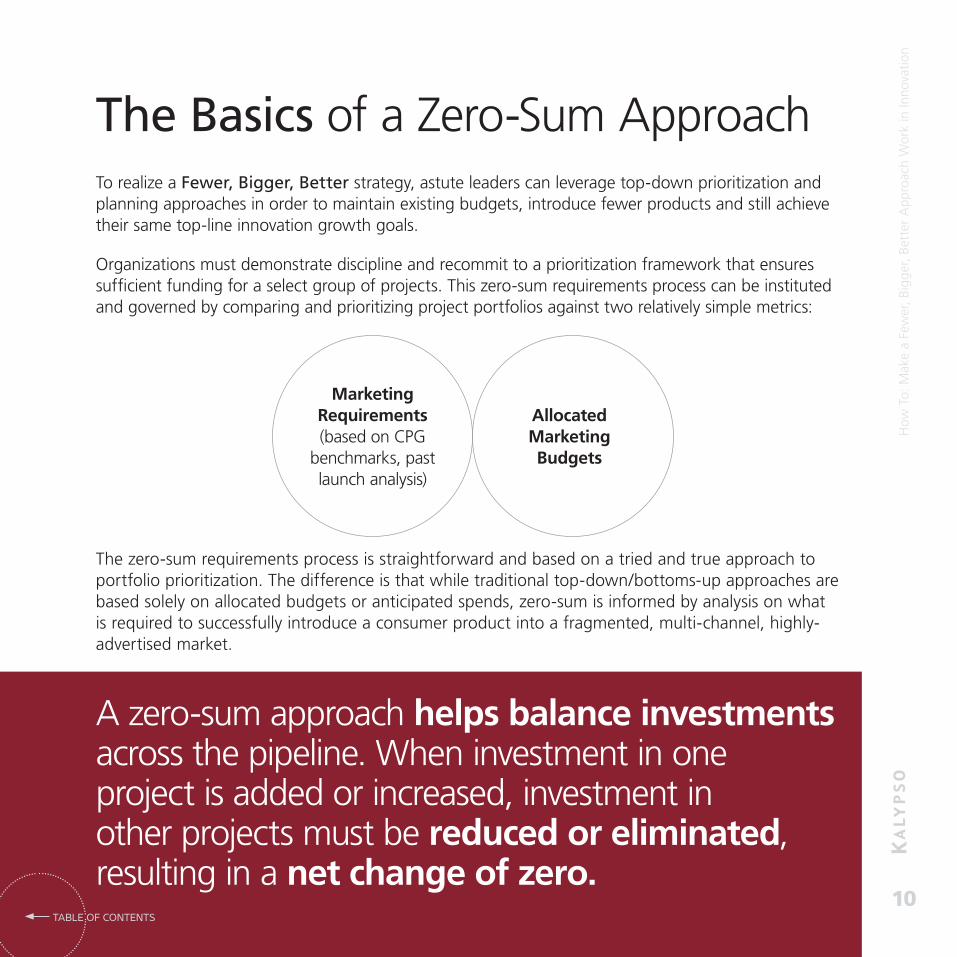
A zero-sum approach helps balance investments across the pipeline. When investment in one project is added or increased, investment in other projects must be reduced or eliminated, resulting in a net change of zero.
The Basics of a Zero-Sum ApproachTo realize a Fewer, Bigger, Better strategy, astute leaders can leverage top-down prioritization and planning approaches in order to maintain existing budgets, introduce fewer products and still achieve their same top-line innovation growth goals.
Organizations must demonstrate discipline and recommit to a prioritization framework that ensures sufficient funding for a select group of projects. This zero-sum requirements process can be instituted and governed by comparing and prioritizing project portfolios against two relatively simple metrics:
The zero-sum requirements process is straightforward and based on a tried and true approach to portfolio prioritization. The difference is that while traditional top-down/bottoms-up approaches are based solely on allocated budgets or anticipated spends, zero-sum is informed by analysis on what is required to successfully introduce a consumer product into a fragmented, multi-channel, highly-advertised market.
How
To:
Mak
e a
Few
er, B
igge
r, Be
tter
App
roac
h W
ork
in In
nova
tion
10 TABLE OF CONTENTS
Marketing Requirements (based on CPG
benchmarks, past launch analysis)
Allocated Marketing Budgets
How
To:
Mak
e a
Few
er, B
igge
r, Be
tter
App
roac
h W
ork
in In
nova
tion
11 TABLE OF CONTENTS
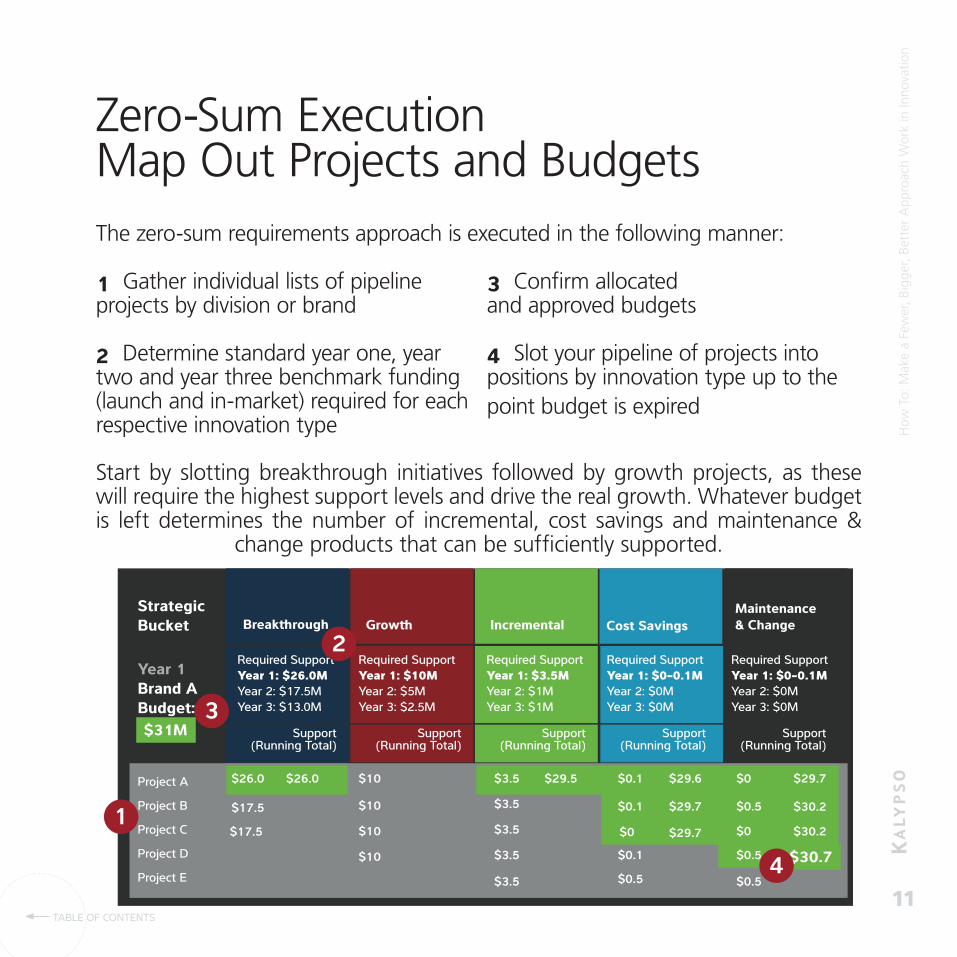
Zero-Sum Execution Map Out Projects and BudgetsThe zero-sum requirements approach is executed in the following manner:
1 Gather individual lists of pipeline projects by division or brand
2 Determine standard year one, year two and year three benchmark funding (launch and in-market) required for each respective innovation type
3 Confirm allocated and approved budgets
4 Slot your pipeline of projects into positions by innovation type up to the point budget is expired
Strategic Bucket Break�rough Grow� Incremental Cost Savings
Maintenance & Change
Year 1Brand ABudget:
Project A
Project B
Project C
Project D
Project E
Required SupportYear 1: $10MYear 2: $5MYear 3: $2.5M
Required SupportYear 1: $26.0MYear 2: $17.5MYear 3: $13.0M
Required SupportYear 1: $3.5MYear 2: $1MYear 3: $1M
Required SupportYear 1: $0-0.1MYear 2: $0MYear 3: $0M
Required SupportYear 1: $0-0.1MYear 2: $0MYear 3: $0M
Support(Running Total)
Support(Running Total)
Support(Running Total)
Support(Running Total)
Support(Running Total)
$17.5
$17.5
$26.0$26.0 $10
$10
$10
$10
$3.5
$3.5
$3.5
$3.5
$29.5 $0.1
$0.1
$0
$0.1
$0.5$3.5
$29.6
$29.7
$29.7
$0
$0.5
$0
$0.5
$0.5
$29.7
$30.2
$30.21
2
3$31M
$30.74
Start by slotting breakthrough initiatives followed by growth projects, as these will require the highest support levels and drive the real growth. Whatever budget is left determines the number of incremental, cost savings and maintenance &
change products that can be sufficiently supported.
Consolidated Brand View
How
To:
Mak
e a
Few
er, B
igge
r, Be
tter
App
roac
h W
ork
in In
nova
tion
12 TABLE OF CONTENTS
1600
1400
1200
1000
800
600
400
200
0
Year 1 Year 2 Year 3 Year 4 Year 5
Consolidate Brand View
IncludesBrand A$26Msupport
Total CoporateMarketing Budget
Total Required to support Year 2 and Year 3 of previous launches
Total Required to support current year launches
Total Required to support core product lines
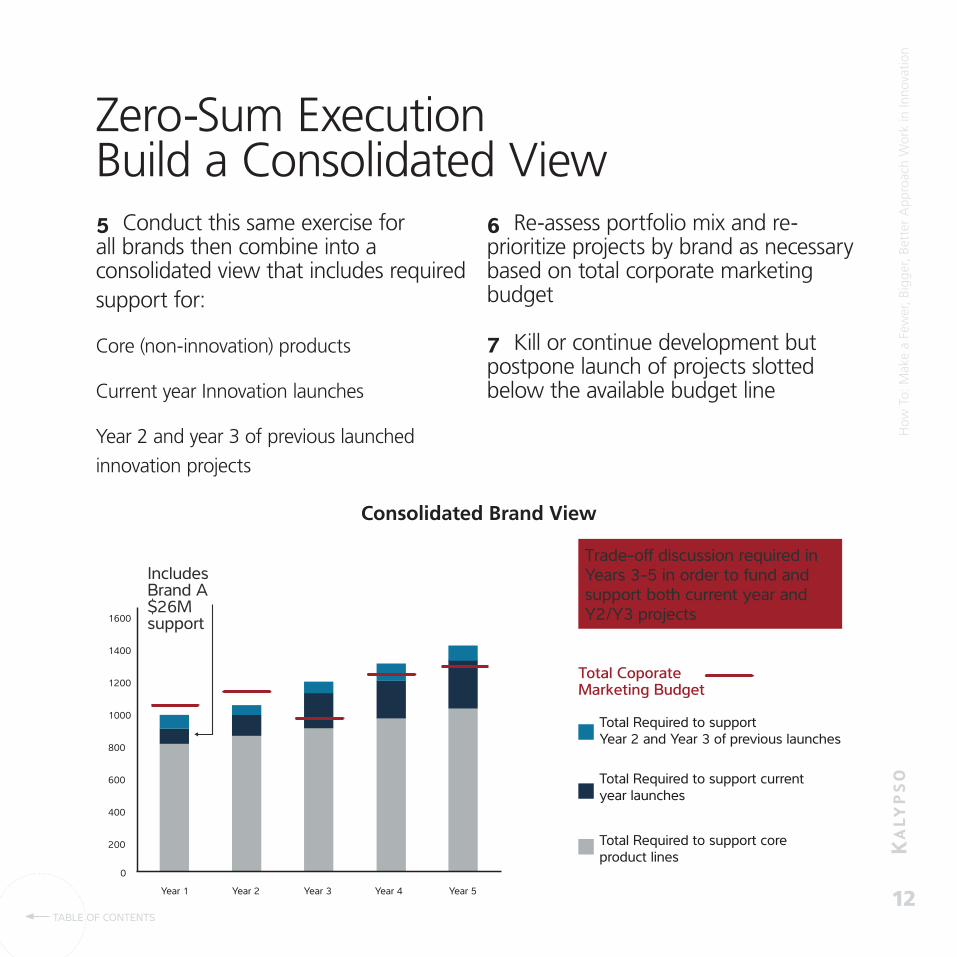
Trade-off discussion required in Years 3-5 in order to fund and support bo current year and Y2/Y3 projects
Zero-Sum Execution Build a Consolidated View5 Conduct this same exercise for all brands then combine into a consolidated view that includes required support for:
Core (non-innovation) products
Current year Innovation launches
Year 2 and year 3 of previous launched
innovation projects
6 Re-assess portfolio mix and re-prioritize projects by brand as necessary based on total corporate marketing budget
7 Kill or continue development but postpone launch of projects slotted below the available budget line

How
To:
Mak
e a
Few
er, B
igge
r, Be
tter
App
roac
h W
ork
in In
nova
tion
13 TABLE OF CONTENTS TABLE OF CONTENTS
Benefits of a Zero-Sum approachHow many initiatives can be successfully launched per year?
The zero-sum requirements approach helps determine product launch priorities while removing the arduous and inexact process of using resource and FTE estimates to inform product development and launch capability.
The fundamental ‘hit or miss’ nature of innovation makes it difficult to predict the amount of new products required to meet innovation targets, but marketing support requirements and budgets are straightforward data points that can offer an accurate indicator of what is realistic.
Functional level capacity is certainly important to understand and products cannot otherwise be developed, but the zero-sum requirements approach provides a more practical and unbiased way to determine the right number and mix of new products that should be launched.
Zero-Sum delivers a pipeline with fewer projects which provides sufficient budgets and allows innovation teams to redirect their skills to higher value work that will lead to bigger and better new products with longer lasting success.

How
To:
Mak
e a
Few
er, B
igge
r, Be
tter
App
roac
h W
ork
in In
nova
tion
14 TABLE OF CONTENTS TABLE OF CONTENTS
Understanding Launch & Support CadenceAmerican families, on average, repeatedly buy the same 150 items, which constitute as much as 85% of their household needs1. To break into this buying repertoire, significant funds are required for launch and support for one to two years.
Even the largest of global CPG organizations will have trouble adequately supporting a truly breakthrough product or multiple growth projects across all their brands and regions every year.
It is critical to understand launch and support cadence to ensure adequate funding for major initiatives across the company brand portfolio and launch calendar.
1 Trout & Partners

15 TABLE OF CONTENTS
Phasing of InnovationYear 1 Year 2 Year 3 Year 4 Year 5
Brand A Incremental 1 (Year 2 & 3 Funding Support)
Incremental 2
Grow� 1 (Year 2 & 3 Funding Support)
Incremental 2
Brand B
Incremental 3 Incremental 2
Incremental 1 Incremental 1
Incremental 4 Incremental 3
Incremental 5Incremental 2
Incremental 3
Brand C
Incremental 6
Break�rough 1 Year 2 Year 3
Grow� 1
Grow� 1
Incremental 4
Grow� 2
Incremental 4
Break�rough 3
Break�rough 2 Year 2 Year 3
In this simplified example, this company:
• Can support 3 breakthrough launches over a 5 year period (one every other year)
• In years with Breakthrough launches, can also support: 1 Growth 4 Incremental
• In years without Breakthrough, can support: 2 Growth 6 Incremental
• Brand B’s strategy and positioning in market is not to launch any Breakthrough or Growth products
Understanding Launch & Support Cadence
How
To:
Mak
e a
Few
er, B
igge
r, Be
tter
App
roac
h W
ork
in In
nova
tion
16 TABLE OF CONTENTS
Understanding Launch & Support CadenceLaunching new products is expensive. Executives who are tasked with looking across the portfolio must allocate sufficient funds from one brand to another in their respective year of major launches. Brand level leaders need to be prepared for these breakthrough and growth launches by managing the amount of incremental, maintenance and cost savings projects planned. This ensures that they have the budget available to fund launch, year two and year three as the cadence directs.
With a strategic prioritization cadence based on sufficiently funding breakthrough and growth projects first, the ability to meet three and five year innovation targets across the broader business becomes achievable with fewer launches. The sequencing and overlapping of major launches allows some room for underperforming products to be supplemented by stronger ones that peak in year two or three of their cycle.
Plans and budgets change, but mapping the number and type of launches across brands and years provides a clear picture of all of the launch and in-market support that will be required across the organization. If there is an overlap between brands that will result in too many large innovation launches and not enough support funds, priorities need to be shifted.
How
To:
Mak
e a
Few
er, B
igge
r, Be
tter
App
roac
h W
ork
in In
nova
tion
17 TABLE OF CONTENTS TABLE OF CONTENTS
Things to Keep in Mind as You Get StartedA Fewer, Bigger, Better strategy is a sound approach, but success requires the resolve, discipline and confidence to launch fewer products and still meet top-line innovation goals.
The support level required for different innovation types varies, but without the appropriate funds for launch and in market support, new products will probably fail.
A zero-sum approach helps balance investments across the pipeline. When investment in one project is added or increased, investment in other projects must be reduced or eliminated, resulting in a net change of zero.
A pipeline with fewer projects provides sufficient budgets and allows innovation teams to redirect their skills to higher value work that will lead to bigger and better new products with longer lasting success. A smaller product portfolio also simplifies supply chain, process engineering and manufacturing efforts, which in many cases can reduce time-to-market.
Retailers see manufacturers with a Fewer, Bigger, Better strategy as strategic partners that can support big innovations that deliver real results.

Kalypso is a global innovation consulting firm. We work with organizations
to deliver better results from innovation. For more information, visit kalypso.com.
Follow Kalypso on Twitter @KalypsoLP and on Facebook at Facebook.com/KalypsoLP.