Embed Size (px)
Citation preview
Measuring the Business Impactof Web Performance
1
Buddy Brewer [@bbrewer]

5
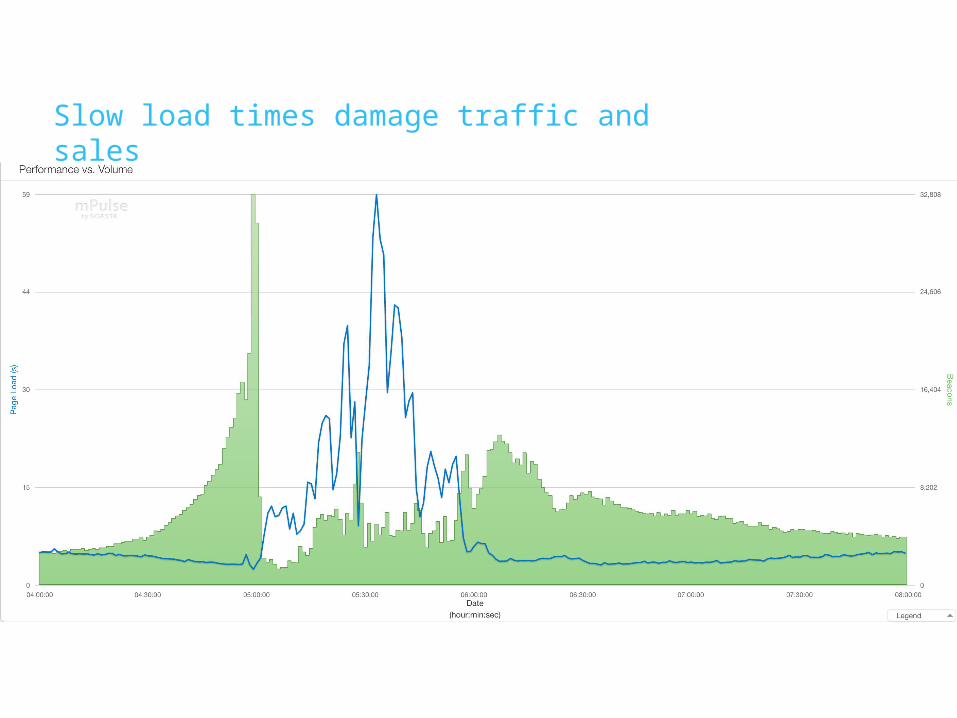
Why Care About Performance?Slow load times damage traffic and sales
5
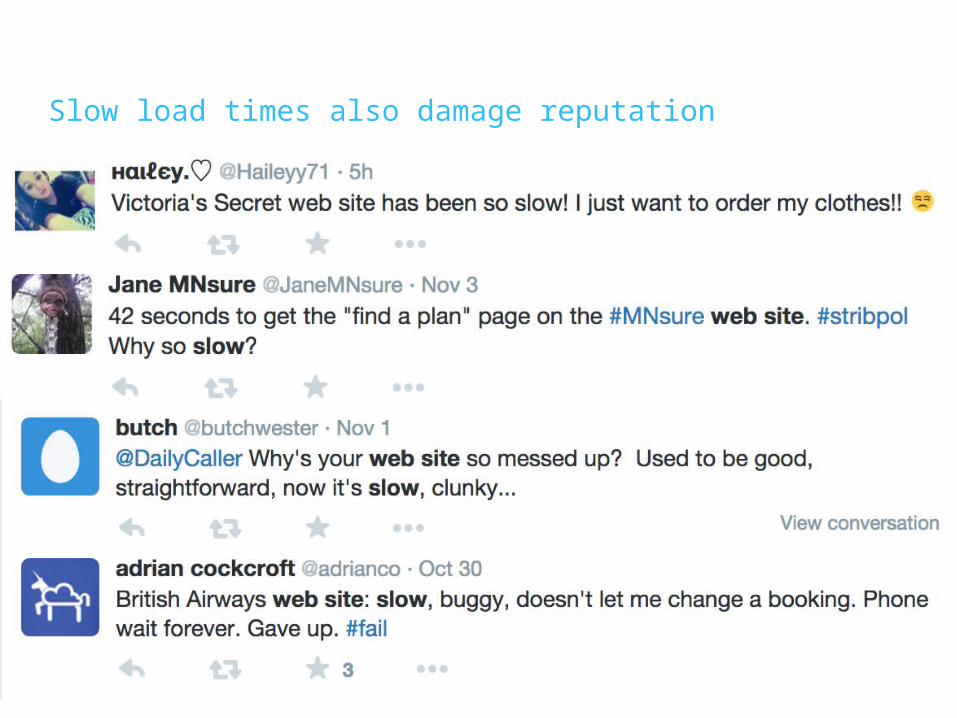
Why Care About Performance?Slow load times also damage reputation
5
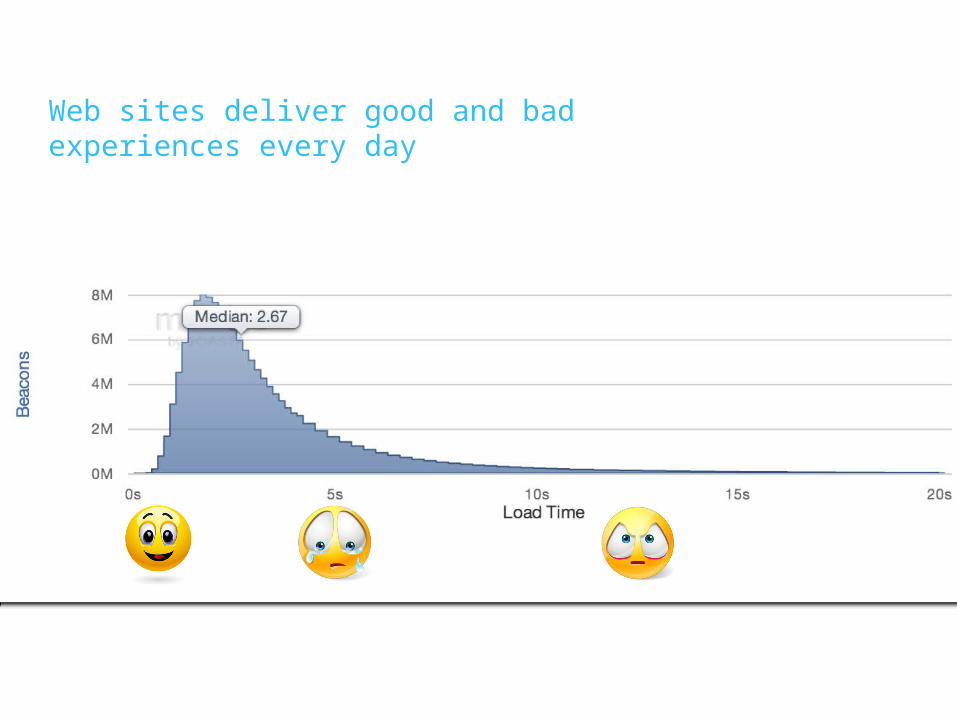
Performance isn’t just one simple numberWeb sites deliver good and bad experiences every day
6
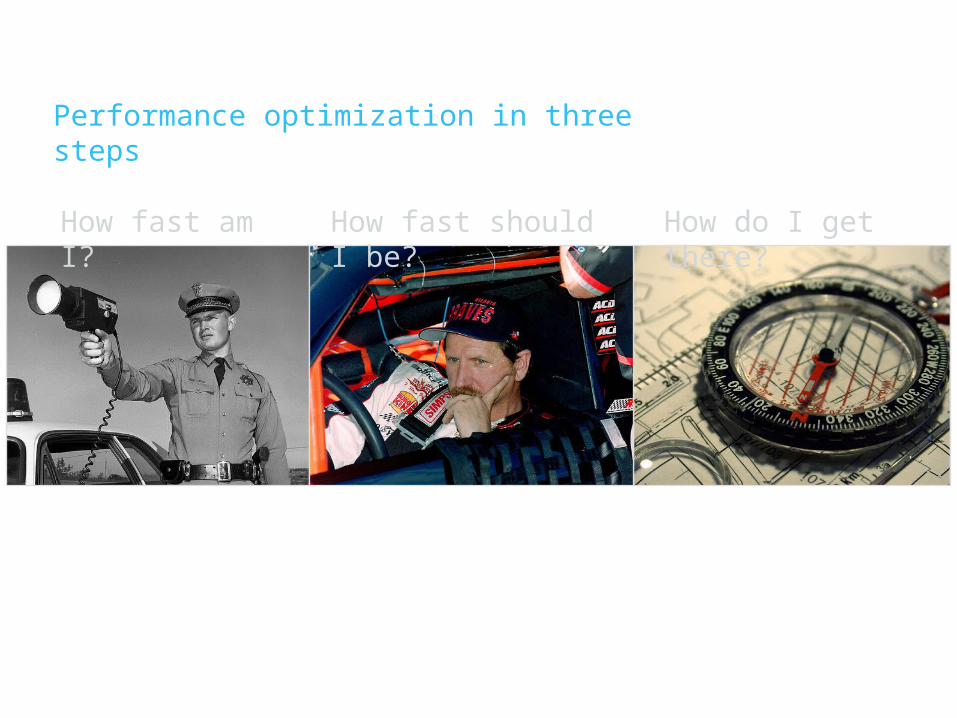
How Should I Approach Performance?Performance optimization in three steps
How fast am I?
How fast should I be?
How do I get there?
7
How fast should I be?The industry has lagged here
4
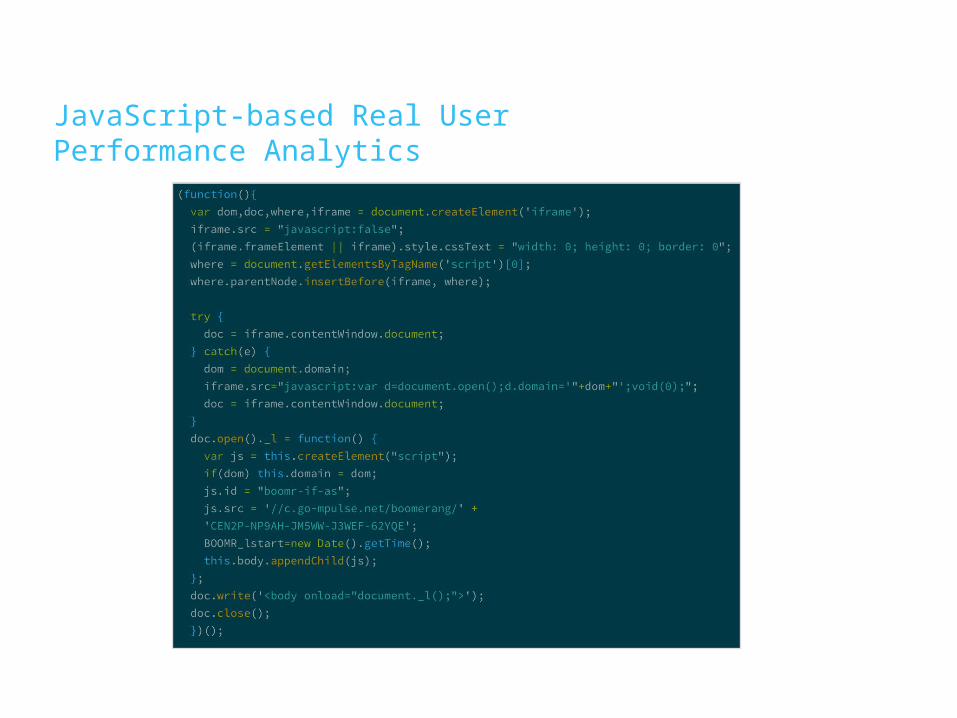
What is Real User Measurement?JavaScript-based Real User Performance Analytics
8
Tracking ConversionsWhat’s a “Conversion”?
OrdersShares, Likes, CommentsPage ViewsSubscriptionsSignupsDealer LocatorsGame Item Purchase
9
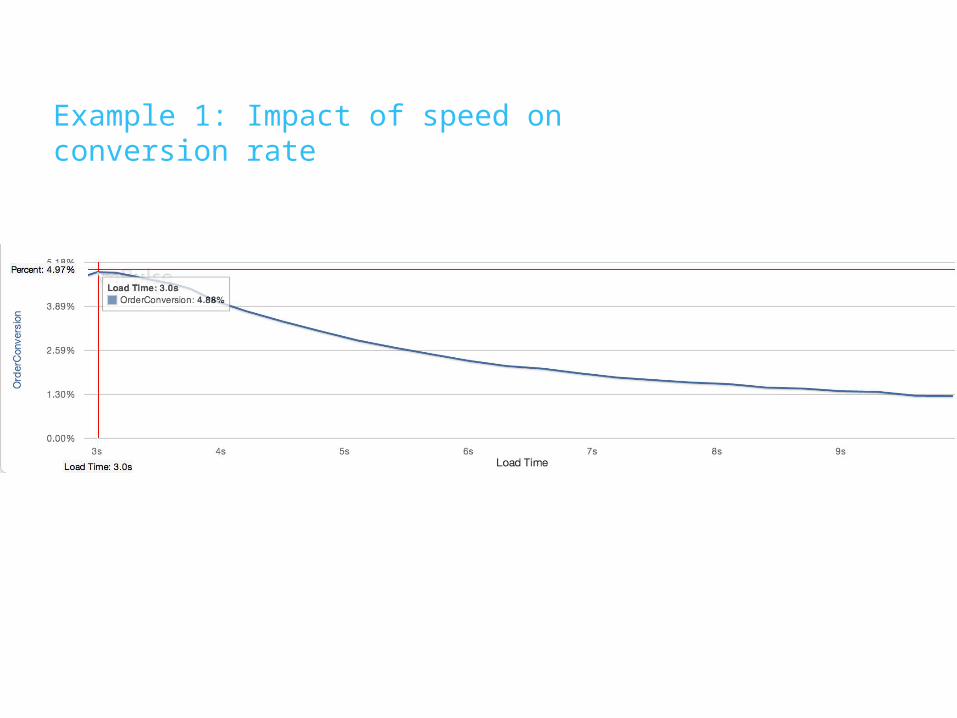
Measuring the impact of speed on businessExample 1: Impact of speed on conversion rate
9
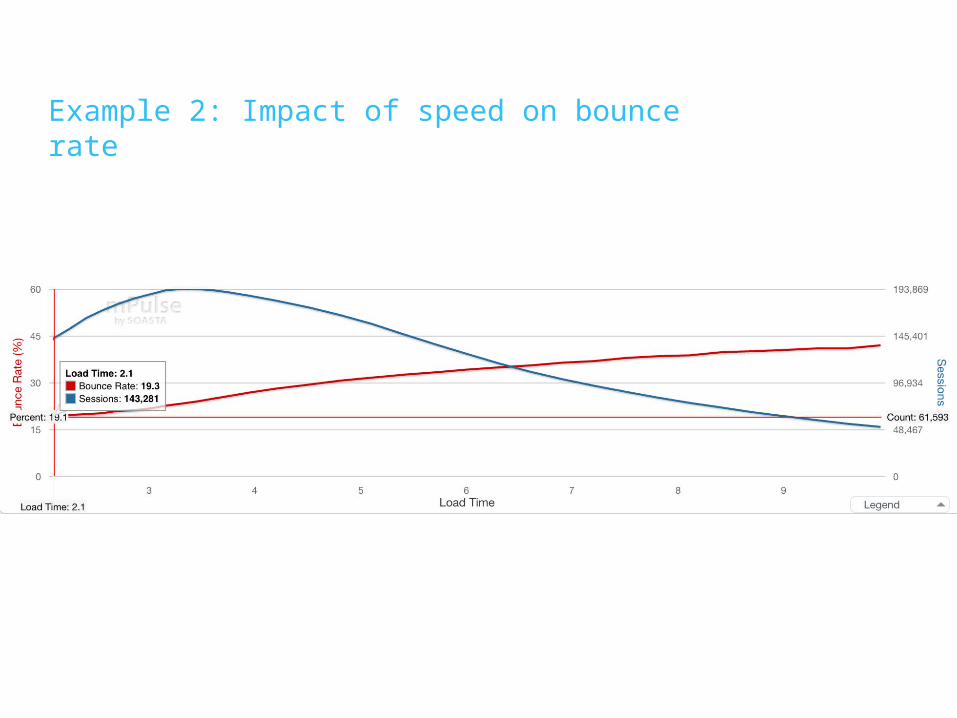
Measuring the impact of speed on businessExample 2: Impact of speed on bounce rate
10
This Means We Can Measure PatienceAnd if we can measure it, we can manage it
11
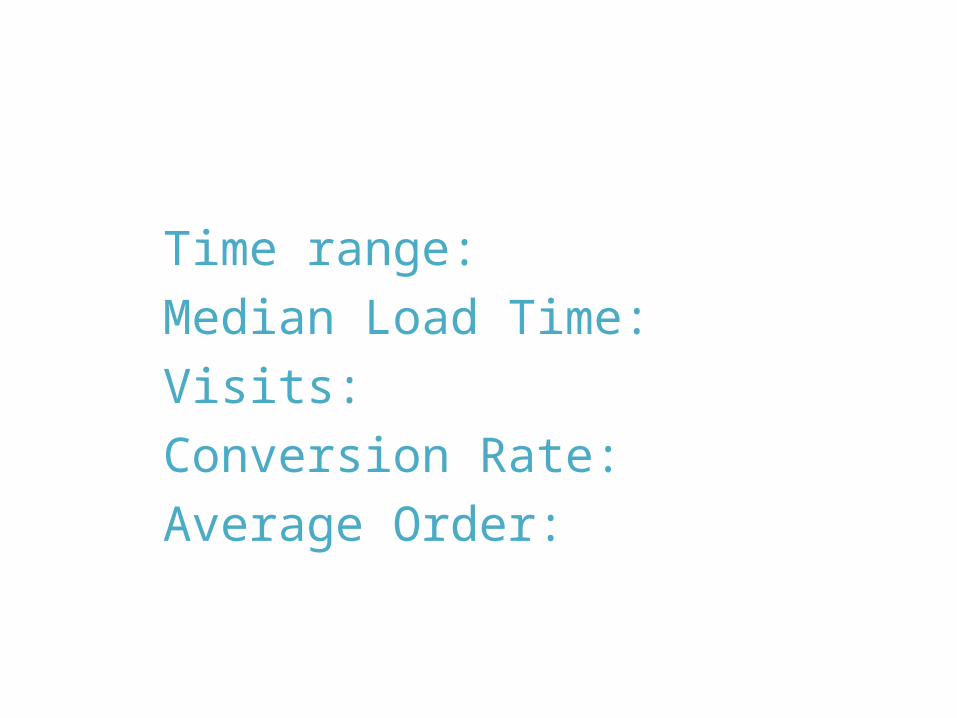
Example
Time range: 1 monthMedian Load Time: 4.12Visits: 25MConversion Rate: 2.7%Average Order: $100
12
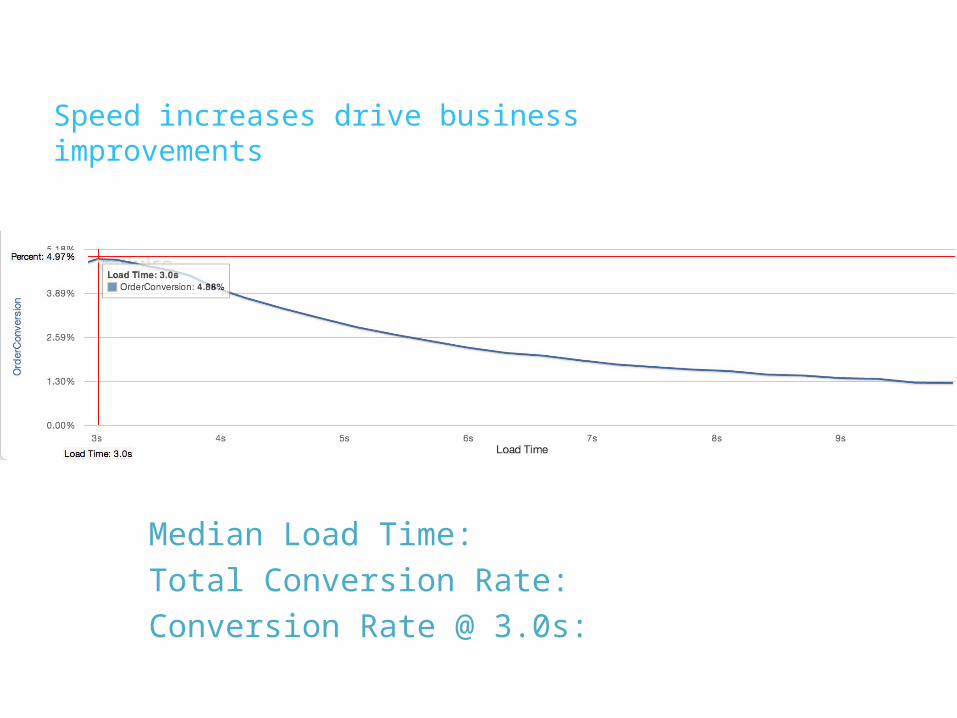
Can We Do Better?Speed increases drive business improvements
Median Load Time: 4.12sTotal Conversion Rate: 2.7%Conversion Rate @ 3.0s: 4.9%
12
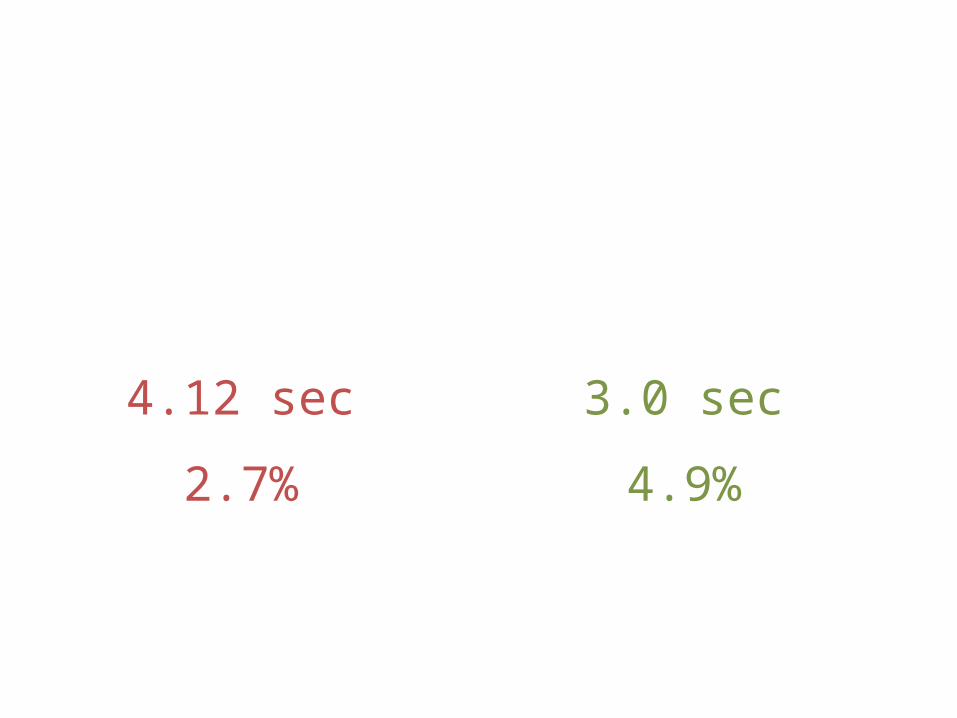
Faster pages convert more frequently
4.12 sec
2.7%
3.0 sec
4.9%
13
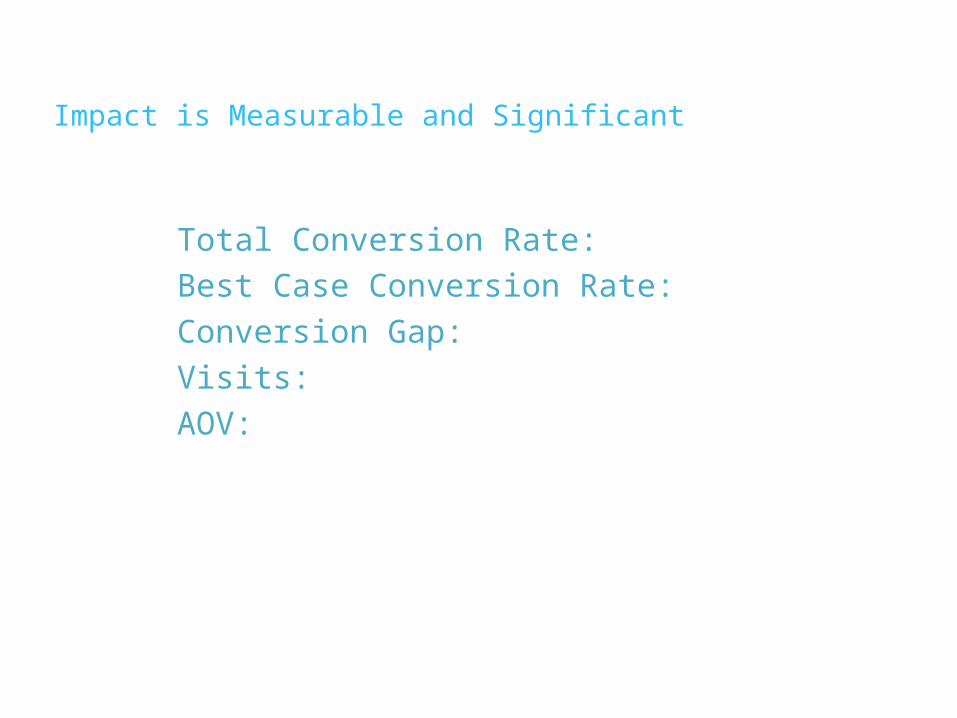
What Are We Playing For?Impact is Measurable and Significant
Total Conversion Rate: 2.7%Best Case Conversion Rate: 4.9%Conversion Gap: 2.2%Visits: 25MAOV: $100
14
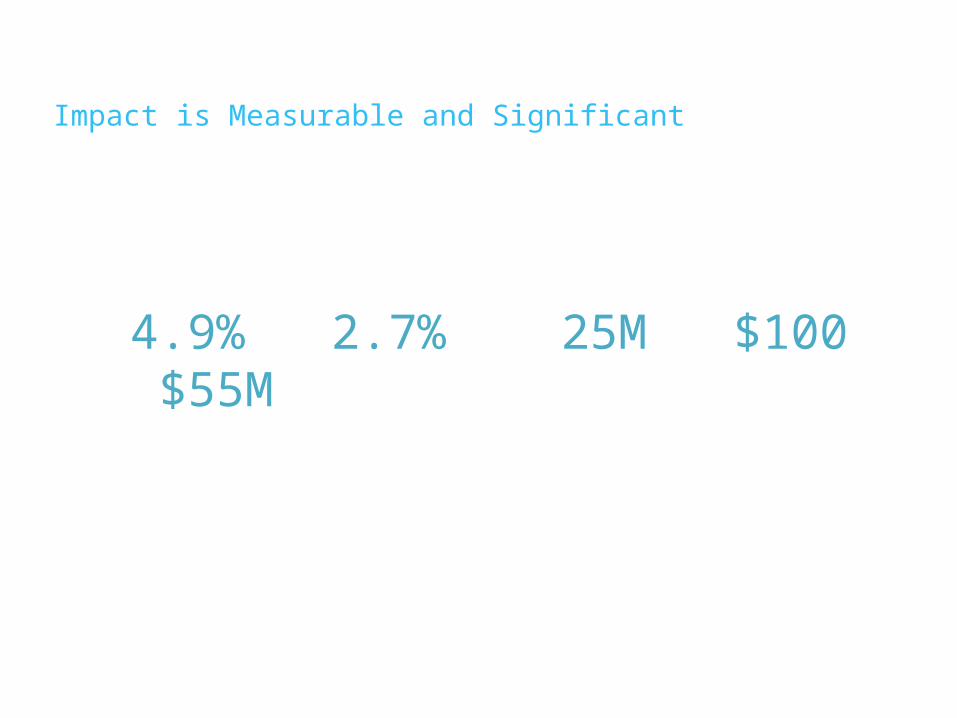
What Are We Playing For?Impact is Measurable and Significant
(4.9% - 2.7%) * 25M * $100 = $55M
15
What Are We Playing For?Impact is Measurable and Significant
1 second = $55M

BUT
12
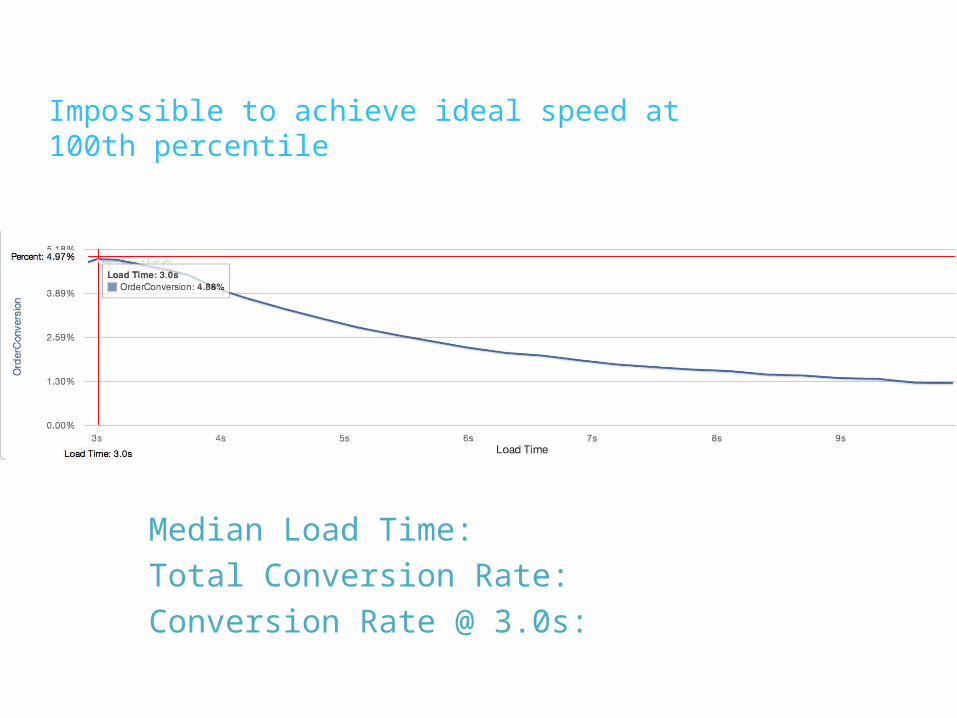
Potential vs Realistic GoalsImpossible to achieve ideal speed at 100th percentile
Median Load Time: 4.12sTotal Conversion Rate: 2.7%Conversion Rate @ 3.0s: 4.9%
13
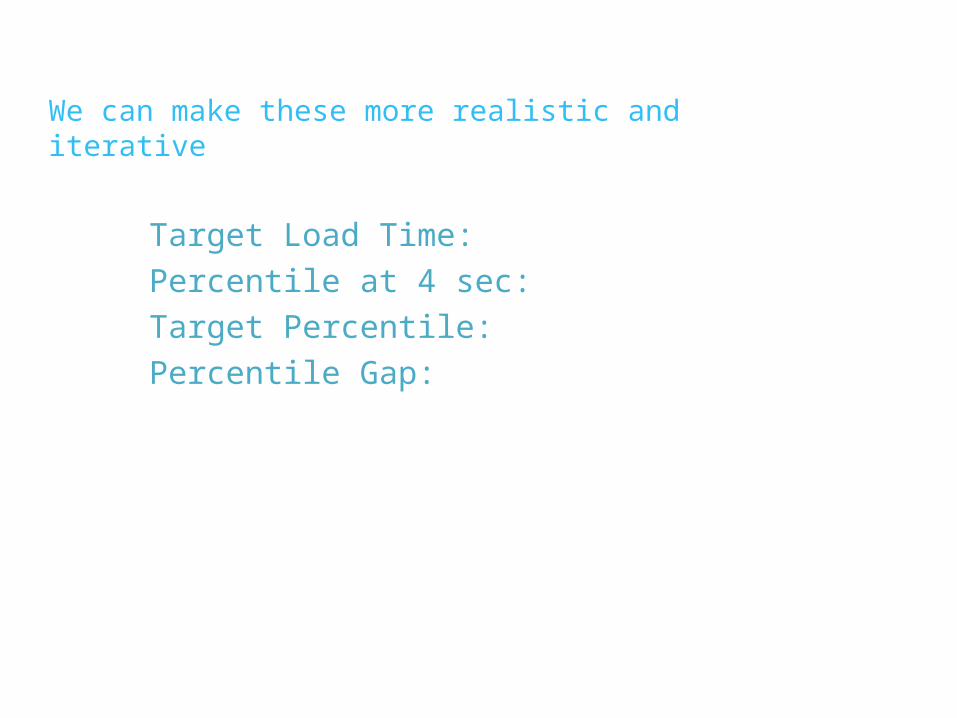
Refining Performance GoalsWe can make these more realistic and iterative
Target Load Time: 4 sec (vs 3 sec)Percentile at 4 sec: 49Target Percentile: 60thPercentile Gap: 11%
14
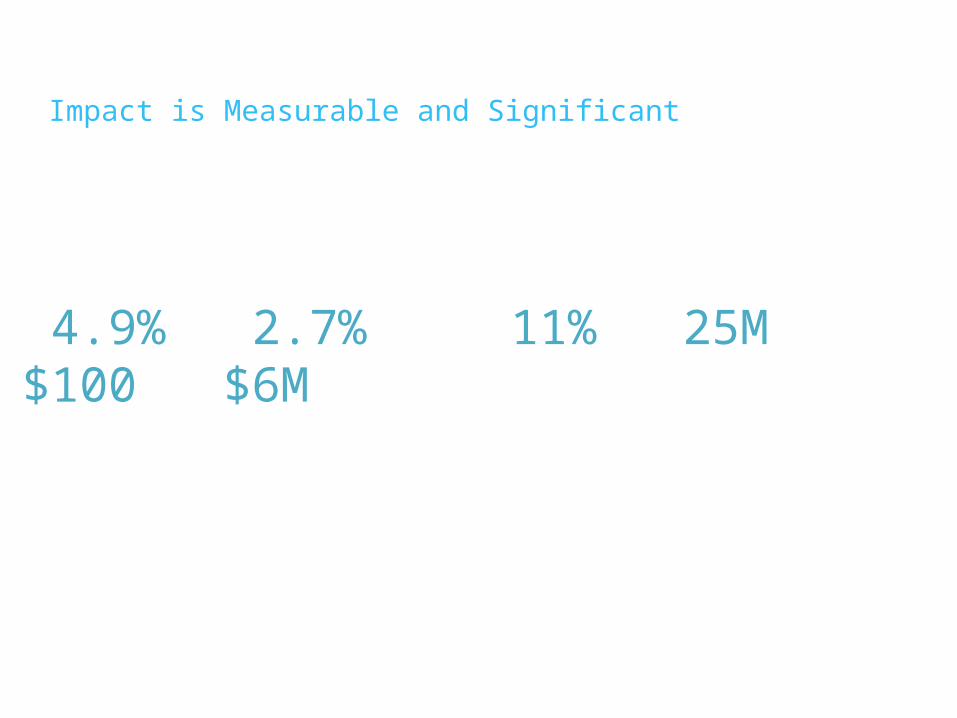
What Are We Playing For?Impact is Measurable and Significant
(4.9% - 2.7%) * (11% * 25M) * $100 = $6M
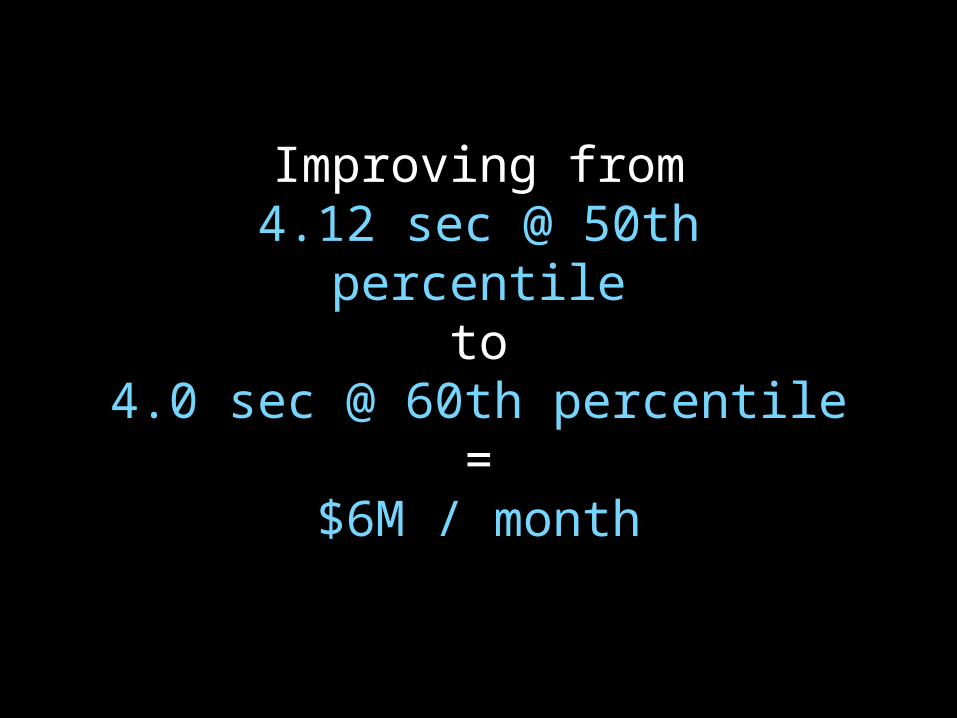
Improving from4.12 sec @ 50th percentile
to4.0 sec @ 60th percentile
=$6M / month
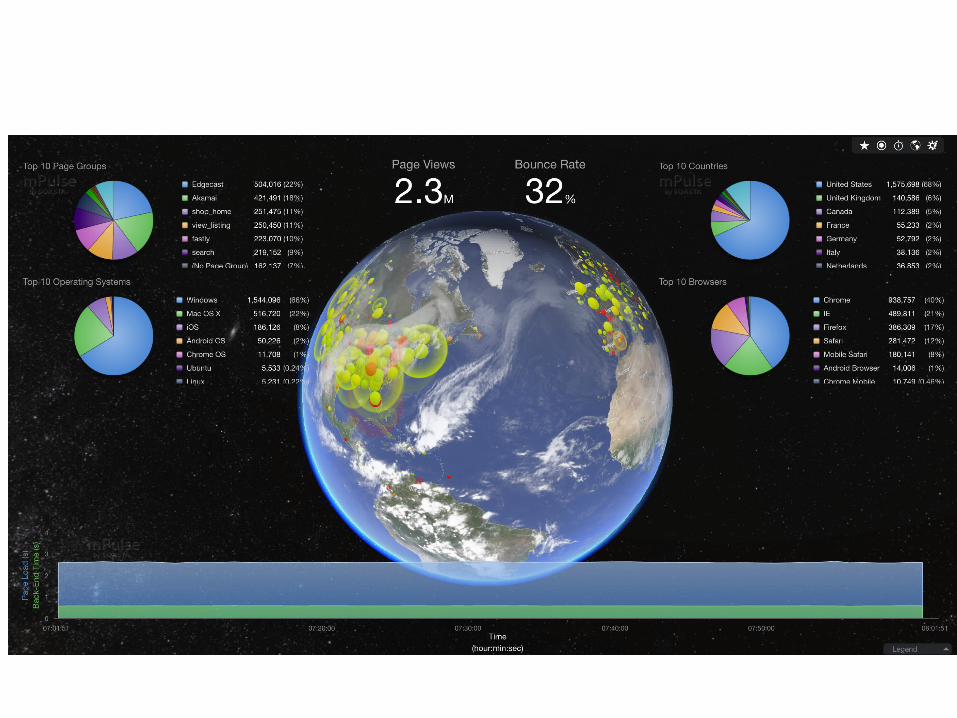
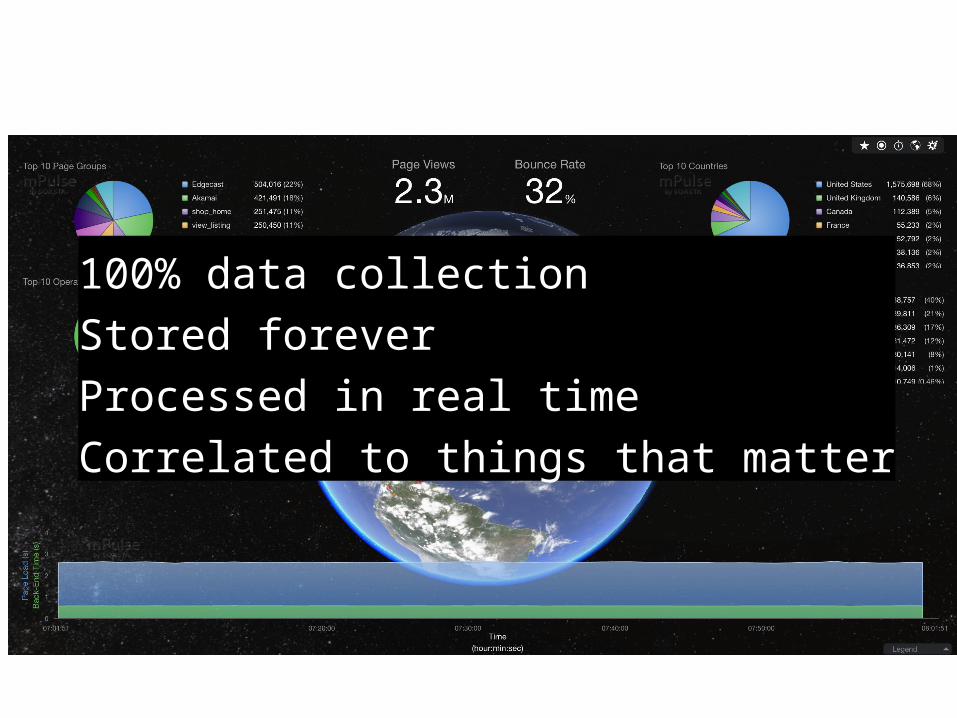
100% data collectionStored foreverProcessed in real timeCorrelated to things that matter
© 2014 SOASTA CONFIDENTIAL - All rights reserved.
8
Customer Spotlight - StaplesPerformance improvements lead to business gains
mPulse data led to changes in JavaScript, CSSReduced JavaScript size by 48%Refactored CSS, reduced size by 83%Shaved 1 full second off of Home page median load timeShaved 6 seconds off the 98th percentileConversion improved by 10%