Embed Size (px)
Citation preview
Scientific Journal of Latvia University of Agriculture
Landscape Architecture and Art, Volume 9, Number 9
7
How to Measure the Impact of Spatial
Aesthetics on the Everyday in Soviet
Housing Estates?
Agnese Sofija Kusmane, Mag. art., Doctoral student at Latvia University of Agriculture
Abstract. This article describes a new method of measuring the influence of spatial aesthetics on preferability
of scenes in the everyday in the Soviet residential areas of Riga – Agenskalna priedes, Kengarags, Zolitude and
Lenina (Brivibas) iela. Serving as a rule, this method can also be used for the assessment of likability in urban
spaces of other periods. In this case, the measurement table needs to be adapted to another scale. Discoveries in
environmental psychology and evolutionary aesthetics inform the method largely. Scientists of this field have
suggested that spaces with certain content, prospects and refuges, for instance, are liked and used by humans.
Conversely, spaces that do not possess these contents are disliked and avoided. The last decade has also shown
some attempts to introduce more specific measurements such as width, heights and length of spaces as well as size
and counts of prospects, measured in meters, to describe the preferable spaces more precisely. The aim of this
article is to analyse recent findings that propose concrete measurements of likable and dislikable spaces,
to assemble them into a so called model of spatial measurements as well as to apply the model to the Soviet housing
estates in Riga. The model of spatial measurements, which constitutes the basic tool of the method described in
this article, can be used only, when open spaces in question have been measured in three dimensions.
The model will be applied in four case studies from Riga, that will be introduced in detail in the chapter about the
results. The application will allow a simple evaluation of any public space regarding its predicted likability,
as long as one can measure its ground width, length, and heights of the buildings surrounding this space as well as
count prospects and refuges. The model needs to be tested by consulting qualitative interview material on
likability and perception in situ. Keywords: spatial aesthetics, preferability, model of measurements.
Introduction
The question of how spatial aesthetics influence
human’s everyday life has challenged many.
Yet, there is no reproducible method existing that can
be used to measure this influence. In the times, when
the Soviet housing estates are prone to be
reconstructed and their reconstruction is meant to
serve as an improvement of livability for the
inhabitants, it is crucial to come up with a method that
permits predicting preference of an outdoor space.
Such method also helps to ascertain people‘s
willingness to use and appropriate an outdoor space in
order to model the reconstruction process accordingly.
The aim of this article is to propose a new model of
spatial measurement, based on evolutionary aesthetics
and environmental psychology theories, that is
capable to predict which spaces are potentially
preferred by inhabitants and which are not. For the
purpose of this article, a preferred scene equals
a scene that is willingly appropriated, a disliked scene
is a scene that is abandoned. The model differs from
all other approaches which are currently in use, as it is
three-dimensional and reproducible. To reach the aim
of the article there are a few objectives in place: the
existent measurements that are already calculated by
numerous scientists on pleasant and unpleasant
spaces, on spaces that induce feelings of safety or
feelings of danger, on spaces that contribute to
restoration or stress and alike need to be assembled
into a united model. Based on layout plans of the
areas, the actual three dimensional measurements need
to be carried out and, based on visits and photographs,
the crucial elements, such as prospect and refuge,
need to be counted. After that, the model of spatial
measurements can be applied and potentially liked and
disliked spaces can be detected.
Importantly, that spatial aesthetics in the context of
this publication is defined as human visual perception
field in situ. In an urban setting, the visual perception
field is mostly defined by walls of houses. As opposed
to a natural landscape, where, for instance, an ever-
lasting field or moving foliage form a very blurred
border of a visual field – the parameters of which are
hard, if not impossible, to measure; a city possesses
spaces that can be expressed in meters. Thus, spatial
aesthetics are defined by the positions of walls of the
buildings, their width, height, length as well as
prospects and refuges these walls build. For the
purpose of this article on the Soviet residential areas,
the walls (not façades) are of specific significance,
since they are the only elements that are expensive in
reconstruction. The remains – façades, greenery, roads
and everything also heavily influencing the sight – can
be constructed or reconstructed if inhabitants voice the
necessity. The created model, however, needs to be
tested by acquiring qualitative data via interviewing
inhabitants of the areas in question, which is the
purpose of another article.
Scientific Journal of Latvia University of Agriculture
Landscape Architecture and Art, Volume 9, Number 9
8
Method
The Choice of Theoretical Framework
There are numerous methods already used in
landscape and urban settings which attempt to reach
a similar aim – namely, to detect the impact of
spatial aesthetics on the everyday, or some part of it,
and I will introduce them shortly. A method that
seems to have established itself in landscape
research studies analyses the character of
landscape in relation to perception [5; 14; 32; 34].
Such a method is largely based on environmental
psychology theories as established by Kaplan’s
seminal work “Peceptions of Landscape:
Conceptions and Misconceptions”, too [17]. Back in
the day, he created a matrix for evaluating the
aesthetical qualities of nature, which are based on
variables as mystery, legibility, coherence and
complexity. These concepts in contemporary
landscape theory turned into a sophisticated matrix
of perceptual values: complexity, unity, cosiness and
grandness [27; 24]. Regardless of their apparent
poetic connotation, these concepts are strictly
defined and thereby, allow researchers to use them
for the analysis of landscapes. Mystery, for instance,
shows how much new information a scene promises,
legibility shows how much information is available
from a certain vantage point and grandness shows
how overwhelming a scene is. These concepts,
applied on rural scenes, seem to be very convenient.
Yet, an urban environment demands precise
measurements of planned space and such concepts,
undoubtedly valuable as we will see in the
framework of the model presented in this text,
cannot stand alone.
A method used in urban studies, namely spatial
syntax, claims to analyse the interaction between
social and physical realms in the city [10].
However, the fact that this empirical approach is
only focussing on pedestrian movement on a two
dimensional layout plan, provides hardly any
possibility to use it for examining the influence
of three-dimensionality on the urban space [3].
Another interesting method used in urban studies
employs Geographic Information Systems (GIS).
This method also gains popularity as it ascertains
urban as well as rural spaces [22]. Yet, this method
lacks theoretical input for choosing exact elements
of analysis.
There is a large body of urban design literature
that focuses on finding the ideal proportions of
urban streets and squares or the “human scale”.
Often, large samples of qualitative data are
used to support the findings. In many cases,
also environmental psychology terms, such as
mystery or legibility, are borrowed to qualify
scenes [6]. However, most of the measures are
expressed in proportions (1:2) and subjectively
given levels (for example medium, high or low level
of mystery), which makes this method not
reproducible on an objective basis.
As we can see, none of the methods mentioned,
employed to investigate the existing urban spaces,
can serve to understand the impact of spatial
aesthetics on the everyday – space, as constituted by
the walls of the buildings, their width, height, length
as well as prospects and refuges, in order to
ascertain which spaces are potentially preferred by
inhabitants. Even though, some environmental
psychologists and evolutionary aestheticians are
interested in the urban environment and attempt to
provide objective points of reference to measure
three-dimensional space and predict its likability.
These attempts are not yet part of a solid, widely
used method, but rather bits and pieces of
discoveries, that could become a method once
connected. One of the objectives of this article is to
compile a model, that can serve as a basis for such a
method. I will shortly introduce now few concepts
popular in both above mentioned fields.
The Main Concepts of Environmental Psychology
and Evolutionary Aesthetics
The main premise of environmental psychology
and evolutionary aesthetics is the belief that every
human’s most important aim is to survive and
reproduce. Spaces, faces, smells, sounds etc., that
promise the achievement of this aim cause happiness
– the ones that predict or promise failure, cause
disgust or fear. These emotions, processed through
human’s consciousness, turn into feelings of
preference – like or dislike regarding to a particular
space or anything else for that matter.
Appleton’s The Experience of Landscape has
been ground-breaking for investigating spaces. He
established two theories of evolutionary aesthetics
about landscapes: habitat theory and prospect-refuge
theory [2]. He writes: “... aesthetical satisfaction,
experienced in the contemplation of landscape,
stems from the spontaneous perception of landscape
features, which in their shapes, colours, spatial
arrangements and other visual attributes, act as
a sign-stimuli indicative of environmental conditions
favourable to survival ...” [2, 69]. Appleton calls the
above mentioned finding habitat theory. Appleton
also states that humans evaluate any physical
surroundings in which they find themselves with
regard to the presence of prospect and refuge
elements in those surroundings [20; 2, 70]. He calls
an ‘unimpeded opportunity’ to see – a prospect, and
an opportunity to hide – a refuge, hence, it is his
prospect-refuge theory [2, 73].
According to Appleton, the physical shapes of
a prospect may be direct or indirect. The first one
ranges from a panorama (360° wide view)
to a straight single as well as a multiple vista
Scientific Journal of Latvia University of Agriculture
Landscape Architecture and Art, Volume 9, Number 9
9
(narrow view or views). The panorama has no
limitations as regarding to sight – vistas, however,
are restricted in some directions. Both direct
prospects, panorama and vista, are available from
the standpoint of a person. Indirect prospects, on the
other hand, are secondary panoramas and secondary
vistas, which are available only potentially, such as
meandering medieval streets.
Appleton was less explicit regarding the
description of the physical shape of a refuge. Later,
Woodcock refines Appleton’s work and defines two
types of refuges: primary and secondary refuge [37].
From now on, I will use Woodcocks terminology
about refuges. “Primary refuge measures the degree
to which the viewer of the scene appears to be
hidden from the view of others; secondary refuge is
a measure of the number and quality of the other
refuges available” [37, 25]. In other words,
secondary refuge, opposed to the primary refuge, is
situated at a distance from the observer.
Primary refuge, in turn, surrounds the observer.
The next spin to this theory comes in 1979,
when Kaplan presents his four categories
(open, undefined scenes; spacious, well-structured
scenes; enclosed scenes and blocked views) under
the name of category-identifying methodologies
(CIM). He provides an empirical theory, where
three-dimensional environments are grouped
according to their spatial shape, information and
the action they cause as well as preference [15].
Kaplan was the first researcher to use so called lay-
man in establishing CIM, while previous studies
were merely based on so-called ‘expert categories’
[18]. Kaplan created CIM with the natural setting in
mind, but they can be used in an urban environment,
too, as already has been done [11]. In scenes
with a low information level, chances of predicting
what Kaplan calls ‘potential actions’ are limited,
and vice-versa [8].
The category open, undefined scene is
characterized by large, empty scenes that hardly
possess any clues for potential actions – an open
field or a large square, for example. Due to a lack of
any space-organizing elements in such settings,
a person’s ‘inner meter’ cannot measure how small
or large it is. According to Kaplan, this category is
ranked with low preference. The category spacious,
well-structured scene assembles environments that
are spacious and provide some landmarks,
structuring the given space into ‘rooms’,
where different potential actions can take place.
This category is the best-liked one [15].
The category enclosed scenes includes settings that
“involve spatially well-defined dimensions with
relatively limited depth” [15, 11]. Kaplan describes
them as having the size of a car. The size will be
‘adjusted’ later in this text. This category is not
particularly popular. The last category blocked
views includes environments where visual access is
denied, as when in front of a blank, long wall.
‘Blocked views’ “make it difficult to find a direction
in which to proceed” [15, 14]. This category is the
least liked one. In one of the studies which apply
Kaplan’s categories in an urban setting, Herzog [11],
who also interviewed lay-man, discovered a similar
correlation between predicted preference ratings and
spatial categories. The categories ‘open, undefined’,
‘blocked-views’, ‘enclosed’ were least liked and
‘spacious, well-structured’ settings were the most
preferred ones. The categories themselves already
propose a matrix that is in tune with the purpose of
this article – to define liked and disliked spaces.
However, there are also some downsides of the
definitions of categories.
Both, Kaplan’s and Herzog’s, works use relative
terms to define spatial categories: “spatially well-
defined dimensions” and “too large”. Yet, how large
is too large to provide cues for potential action?
How enclosed is too enclosed to ban information?
How prominent are structures that organize a space
into well-structured one? It seems that the only
category that can be understood clearly from the
literature is blocked view – which describes
a situation in the city where people find themselves
facing a monotonous wall. Thus, I will not search
the measurements of this particular category, but
look at the work of some scientists who tried to offer
concrete metrics of three other categories.
To render the found measurements into a system that
can be reproduced for further usage, I will correlate
them with the above mentioned categories of space.
The Model of Spatial Measurements
American environmental psychologist Stamps
asked hundreds of lay-man to rank images of
squares, focussing on the relationship between
preference and enclosure [29]. Each of the squares
was 49 m x 49 m large, but the heights of the
buildings comprised three types: two stories (7.8 m),
four stories (13.4 m) and six stories (19.8 m).
The total gap size (the space between the buildings)
varied from 7 m to 21 m, with different gap
locations (middle, corners, both). His research
proves that 49 m x 49 m squares are perceived as
being safe, if the gap size is 14 m and the buildings
are four stories high. Same yards are perceived as
too wide if the buildings are two stories high.
The difference in perception of safety declines,
if the number of stories is larger than six.
Stamps includes only one direct prospect in this
setting and there is no refuge in it. In addition to
that, Galindo and Hidalgo write “… the settings that
… allow the individual to observe the scene from
a safe viewing point and with a wide perspective
(open places) — will also be the aesthetically
preferred settings“ [7, 24].
Scientific Journal of Latvia University of Agriculture
Landscape Architecture and Art, Volume 9, Number 9
10
So how do Stamps’ findings correlate with three
categories, for Stamps does not talk about any of the
categories, even though, he is very well acquainted
with them? His results demonstrate that the safest,
optimally enclosed space is measurable. They also
show that humans feel less comfortable if
parameters change. According to Kaplan, maximum
safety and preference is linked to the category
‘spacious, well-structured space’. This is the reason,
why yards and squares of the above-mentioned
“ideal” dimensions calculated by Stamps will be
further considered as a sample for identifying
spacious, well-structured spaces in my research.
Yet, it is hard to believe that this sample is the
only preferable yard space on earth. A new
perspective to this issue is constituted by Spreiregen
and Hayward & Franklin, who argued that not the
actual size, but the height/depth (HD) ratio plays the
decisive role with regard to the perceived enclosure.
[28; 9]. Furthermore, contemporary scientists such
as Alkhresheh also proved the usefulness of taking
HD ratios into account [1].
The current HD ratio of Stamps’ ideal square
is 0,27. Accordingly, the optimal plaza space
(49 m x 49 m, four stories at a height of about
13.4 m) can be increased proportionally in order to
maintain the ideal size of a space. So, how far
can parameters be stretched proportionally,
while still maintaining their optimal spacious,
well-structured virtue?
In order to resolve this issue, the analysis
of preferred settings done by Herzog et al.
is helpful [12]. These researchers have rated
different urban and rural scenes according to their
likability and assumed restoration effect. Again, in
this research, Herzog does not talk about categories,
but rather about the most preferred scenes.
Thus, scenes which are most liked by non-experts
are scenes that Kaplan calls ‘spacious, well-
structured scenes’; disliked ones are ‘enclosed’ or
‘open, undefined scenes’ or ‘blocked views’ – this
represents a similar outcome compared to the
conclusion of Stamps’ findings. In this case,
I took images depicting the smallest of large
(larger than 49 m x 49 m) least-liked settings into
account. For instance, a square of approximately
75 m x 75 m with few parked cars visible, embraced
by six stories high houses and a gap of 24 m,
demarcated by an approaching street. The relevant
literature does not provide any evidence, neither
photographical nor written, that any smaller disliked
spaces of this particular ratio exist. Below this
margin (75 m x 75 m, 21 m, ratio 0,27), the category
‘spacious, well-structured space’ begins. This space
is an enlargement of 50 % in relation to the ideal
space as defined by Stamps.
The variable that differs in both cases of squares
described above, are prospects. Stamps’ yards had
one primary prospect in form of a gap between the
buildings, yet Herzog’s space possesses a secondary
prospect: a street approaching from the left side.
Scenes with secondary prospects are more popular
than scenes with direct prospects, since secondary
prospects, such as bending streets, promise more
information [23]. This might mean that a visitor
of a yard larger than 75 m x 75 m would find the
space likable, since a secondary refuge would
encourage stronger feelings of preference. I will
explain the significance of elements such as
prospects and refuges subsequently.
Note, that both aforementioned spaces
(plaza of 49 m x 49 m, surrounded by buildings
13,4 m of height and a yard of 75 m x 75 m,
embraced by houses of 21 m of height) have ratios
of 0,27. I will now introduce the ratio mark that
indicates the change of a category, in order to
correlate the measurements and categories according
to the principle of analogy. Based on Stamp’s ideal
square (plaza of 49 m x 49 m, surrounded
by buildings 13,4 m of height), I have chosen a ratio
fluctuation of 0,5 points, as it reflects the difference
of approximately two stories. Stamps indicates that
two stories are enough to feel changes in safety and
there are no other points of reference in the literature
that indicate the perceived changes in ratio [29].
Thus, if the ratio is at least 0,5 points lower than the
ideal ratio of 0,27 - namely, lower or equal to 0,22,
then the space has to be called ‘open and undefined’.
The other side of the scale, a ratio which
is 0,5 points higher than 0,27, marks another
category called ‘enclosed spaces’. So, if the ratio is
higher or equal to 0,32, then the space is called an
‘enclosed space’.
Now, after having established a ratio for all three
categories, I will determine the missing smallest
likable width and length parameters for the category
‘spacious, well-structured’. In order to be precise,
I will use a height of 13,4 m, like I did before.
The ratio of 0,32 points at a height of 13,4 m is
achieved, if the length and width of the square
is 42 m. Thus, one can say that humans are not
comfortable in the existing environment, if the
ground space is smaller than 42 m x 42 m.
Hence, this is the limit at the lower end of
a ‘spacious-well structured space’.
Based on the metrics and ratio fluctuations
detected above, I will now derive the missing width
and length parameters of an ‘enclosed’ and ‘open,
undefined yard space’. The smallest width and
length parameters of an ‘enclosed space’ are
1 m each, the largest ones correlate with the upper
border of ‘spacious, well-structured space’ – 75 m.
The smallest ‘open, undefined space’ length and
width parameters correlate with the smallest
‘spacious, well-structured space’ measurements
– 42 m, the largest are 100 m.
Scientific Journal of Latvia University of Agriculture
Landscape Architecture and Art, Volume 9, Number 9
11
In short, yards that are 42 m – 75 m large and
surrounded by buildings that are 13,4 m – 21 m
high, within a height to width ratio, that is larger
than 0,22 and smaller than 0,32, compose a setting
that is defined as likable within this framework.
Thus, it corresponds with the description of a
‘spacious, well-structured environment’. Spaces
with smaller or larger parameters and spaces with
smaller or larger ratios are either ‘enclosed’ or
‘open, undefined settings’. Spaces that possess at
least one primary prospect like in Stamps’s
examples and fit into the measurements and ratios
given above, are called ‘Standard yard spaces’.
‘Spacious well-structured yard spaces’ within the
above mentioned parameters are liked and, within
the framework of this article it is assumed, that the
liked spaces are the ones that are used and
appropriated in the everyday. Accordingly, the yards
fitting the parameters of disliked spaces are assumed
not to be used and appropriated.
There are some peculiarities that are equally
important as length, width, height and ratio.
Namely, specific prospects and refuges called
legibility and mystery. As it has been indicated,
I will describe them more precisely in the following,
after explaining the measurement system for streets.
Research done by Alkhresheh contributes to the
issue of safety and comfort by investigating
cognitive variables, such as the feeling of enclosure
with regard to streets [1]. Alkhresheh generated
images and conducted a survey on very long,
seemingly endless and straight streetscapes with
setbacks of façades indicating a crossroad in the
middle and background parts. The straight view
complies with the direct type of vista, but the
setbacks comply with the idea of secondary refuge
as identified by Woodcock: a scene with a potential
hiding place in the distance [37]. I will use one
primary prospect and one secondary refuge for all
street space categories in order to define ‘standard
street spaces’.
In his doctoral dissertation, Alkhresheh not
only describes the ideal ratio(s), but also
gives measurements of preferred streetscapes [1].
His extensive empirical research, which was
conducted as a streetscape ranking survey (comfort,
safety, perceived enclosure), has shown that the
most optimal streetscapes are those that comprise a
height to width ratio value of 3:4. The function of
comfort and safety shows an inverted U-shape.
With regard to Stamps, Alkhresheh also does not
talk in terms of ‘spacious, well-structured streets’
and does not use any of the other three categories for
that matter. Yet again, the most comfortable,
safe streetscape should be ranked as ‘spacious, well-
structured’, since that description fully corresponds
to the concept of a ‘spacious, well-structured space’.
Conversely, streets that are too enclosed belong
to the category ‘enclosed space’ as well as streets
that are too large and wide, these ones belong to the
category ‘open, undefined space’.
According to Alkhresheh, streetscapes that make
humans feel comfortable and safe, reveal ratios of
0,5 to 1.5, with 0,75 being the ideal ratio [1].
Alkhresheh’s findings are valuable for my work,
since they provide ratios for streetscapes that I will
use. His presented concept of an ideal street includes
a height and width range of 6 m to 12 m.
This research shows that values between 6 m to 12
m, within the given ratio, define a ‘spacious, well-
structured street’. Ratio and height/width
measurements that exceed the given ones, tend to be
far less popular. The ideal streetscape is 9 m high
and 12 m wide with a ratio of 0,75. The optimal
street view proposed by Alkhresheh clearly fits into
the requirements that Kaplan proposes for the
category ‘spacious, well-structured scenes’ [15].
Lindal and Hartig demonstrate similar findings,
too [21]. Higher buildings or a shorter distance from
the street turn a similar space into an enclosed
setting. They found, that the safest street is 14 m
wide and is surrounded by houses that are 11 m
high. Buildings higher than that create feelings of
extreme enclosure and thus, generate negative
feelings of being entrapped. I will use the
measurements by Lindal and Hartig as a basis for
my research, since they are closer to the real
situation in Riga.
So far, it is known that the ideal streetscape is
11 m high and 14 m wide, this ratio can fluctuate
between 0,5 to 1.5, 0,75 being the ideal ratio.
Such a street has one primary prospect and at least
one secondary refuge. The ratios are relative, as we
have seen in the example with yard spaces.
For instance, a street space that is 75 m high and
100 m wide, is hardly pleasant, even though the ratio
is 0,75. Again, I have to ask a similar question
compared to the one in the part about yards: Where
is the turning point (expressed in meters) that marks
the beginning of streetscapes being too large or
small and disliked? I will use the same enlargement
procedure that I used for yards, too. In case of the
yards, described above, the ‘ideal’ size has been
increased by 50 % to detect the upper boarder
of a ‘spacious, well-structured street’. I will use
Lindal and Hartig’s standard (11 high, 14 wide
street) and enlarge it by 50 % [21]. The result is the
largest possible ‘spacious, well-structured street’
being 16,5 m high and 21 m wide. A street
exceeding these limits is either an ‘open, undefined
street’ or an ‘enclosed street’, depending on ratio.
Alkhresheh himself ranks spaces larger than this as
not particularly safe or comfortable, too [1].
Thus, this is the first divide between two categories
of streetscapes. I will leave the smallest end of
a ‘spacious, well-structured street’ at the point of

Scientific Journal of Latvia University of Agriculture
Landscape Architecture and Art, Volume 9, Number 9
12
TABLE 1
Standard spaces [Source: created by author]
11 m in height and 14 m in width, since in Riga’s
residential areas there are no buildings smaller than
that and of interest for me anyway.
From the ‘ideal’ street space given above,
I will now detect the smallest and largest parameters
for two other categories analogically, as I did for the
yard spaces. I will start with ‘open, undefined street
spaces’ and will continue with ‘enclosed streets’.
Yet, I will use different ratios – these ones already
established by the findings of Alkhresheh.
The starting point is 0,75 – the ideal ratio.
When 0,25 are subtracted, resulting in the smallest
ratio of 0,5, the ratio for the category ‘open,
undefined street’ is achieved. If 0,75 is added, then
the largest ratio is reached – 1,5. Similar to the yard
spaces, the largest ratio corresponds to an ‘enclosed
space’ and the smallest to an ‘open, undefined
environment’. The smallest width parameter of an
‘open, undefined street’, in analogy to the instance
of yard spaces, correlates with the smallest width
parameter of a ‘spacious-well structured street’ and
it is 11 m wide. Further, derived from a maximum
height of 21 m – the highest ‘spacious, well
structured street’ building, which is also the highest
possible height of a building in an ‘open, undefined
street’ environment - one is able to detect the largest
width parameter of an ‘open, undefined street
space’. It must be two times the height in order to
receive the ratio 0,5, hence, it is 42m. Thus, 42 m is
the widest street parameter in the category ‘open,
undefined street’. The smallest enclosed street width
is 1 m. The largest width parameter is 16,5 m,
which corresponds to the largest width parameter of
a ‘spacious, well-structured street space’.
This correlation is similar to the principle used in
case of yard spaces. Accordingly, the highest
building of an ‘enclosed street space’ is 25 m
high – which is derived from the given width
(16,5 m) multiplied with the ratio 1,5.
In short, streets that are 11–16,5 m wide,
surrounded by buildings that are 14–21 m high,
within a height to width ratio of 0,5–1,5,
compose a street that, in this framework, is defined
as a preferred one. Thus, this type of street
corresponds to the description of a ‘spacious,
well-structured environment’. Spaces with smaller
or larger parameters and spaces with lower or higher
ratios, are either ‘enclosed’ or ‘open, undefined
Cat
ego
ry
Set
tin
g
Len
gth
as
bo
rder
ed
by
wal
ls
(m)
Wid
th
as b
ord
ered
by
wal
ls
(m)
Hei
gh
ts o
f bu
ildin
gs
(m)
Rat
io
Pro
spec
t am
oun
t/ t
yp
e
Ref
ug
e am
oun
t/
typ
e
My
ster
y
Leg
ibil
ity
Pre
fere
nce
Spacious-
well
structured
yard
42–75 42–75 13,4–21 0,27
+ -
0,5
1 primary – – – Liked
Open-
undefined
yard
> 42–100 > 42–100
> 8,5–21
< 0,22 1 primary – – – Disliked
Enclosed
yard 1–75 1–75 > 14–26 > 0,32 1 primary – – – Disliked
Spacious-
well
structured
street
Unl. 11–16,5
14–21 0,5–1,5
Ideally
0,78
1 primary 1 secondary – – Liked
Open-
undefined
street
Unl. 11–43 14–21 < 0,5 1 primary 1 secondary – – Disliked
Enclosed
street
Unl. 1–16,5 14–25 >1,5 1 primary 1 secondary – – Disliked
Scientific Journal of Latvia University of Agriculture
Landscape Architecture and Art, Volume 9, Number 9
13
streets’. Spaces that possess one primary prospect as
well as one secondary refuge and fit into the
measurements and ratios given above are called
‘standard street spaces’. Spacious, well-structured
streets are considered to be liked and appropriated in
the everyday. Conversely, the streets that fit into the
parameters of disliked spaces are assumed not to be
used and appropriated.
The specifics of length, width, height, ratios as
well as prospect and refuge of three different
categories explained above, namely, the category
‘spacious, well-structured, open, undefined and
enclosed space’ is summarized in Table 1 below.
As I already mentioned above, the fourth category,
‘blocked views’, is well described in the literature
and does not need to be measured.
Table 1 only provides measurements for
rectangular spaces – but how to treat irregular yards?
In order to attribute a theoretical category and to find
a ratio of the space according to the literature, one
needs to divide height by width or length.
Unfortunately, there is no answer to the question, as
to the procedure applied in the case of irregular
spaces. However, I am convinced that it is
reasonable to analyse slightly irregular yards by
calculating the medium size of the side, which is one
fourth of the sum of all four sides. For example, if
the sides are 60 m, 80 m, 90 m and 110 m long, then
the medium length is 85 m. However, this
calculation only makes sense, if the difference
between the sides is not too vast and also, if the yard
actually has four sides. If the difference between the
sides is two times the smallest side, then the size of
the smallest side is taken as a reference length for
the whole area. This means, if the sides of a yard are
each 30 m, 100 m, 30 m and 100 m long, the
medium length is 30 m (and not 65 m). Such a yard
is more like a street space. In case of a street,
the length of the view is not significant - at least this
is how street spaces are treated within the scope of
this work. When calculating the ratio of a yard,
it makes sense to treat street-like yards the same way
as streets, i.e. to take only the smallest side
(width and not the length of a street) and height of
the buildings into consideration. In the case of
triangles, which only occur rarely, the measurements
are calculated by extracting one third of the
sum of three sides.
In the case of buildings with variant heights
within the visual field of one scene, the same
principle applies. If the difference between the
heights of the buildings is not too large,
then a medium height is calculated by adding
together the different measures of height and
dividing them by the number of the heights added.
If the scene is defined by the buildings,
the height of which is considerably different
(the smallest height is two times smaller than the
second smallest height), then the height of the
largest building is taken as a parameter.
If a scene is constituted by ‘blurred’ arrangement
of buildings, such as houses placed in fishbone or
zig-zag patterns, then the closest corners of the
buildings must imaginatively be linked together.
The link has to be considered as the border
of the given setting.
Adding the Elements of Mystery and Legibility
to the Model
Having constructed the metric standards to
identify three spatial categories, I realized that the
above mentioned prospects and refuges can vary
a lot in any given case. This means, that an
application of such standards to spaces in Riga’s
residential areas turns out to be problematic.
For instance, think of a square or a yard that does
possess the ‘ideal’ size, shape and height.
Namely, a yard that is 49 m wide and long and
surrounded by walls that are 14 m high. However,
this yard has three secondary prospects and two
secondary refuges instead of one direct vista.
Is it more popular and appropriated, rather than the
‘ideal’ square which has only one direct prospect?
Is it possible that a decent amount of secondary
refuges is able to alleviate the dislike of a space that,
according to the standard, would fit into an ‘open,
undefined setting’? Does a balanced feeling –
something between like and dislike – appear in such
cases? If yes, I will preventively call this feeling
‘toleration’ and accordingly, call the corresponding
spaces ‘tolerated spaces’. A tolerated space is, in
terms of like and dislike, in the middle of the
scale. Hypothetically, under certain circumstances
tolerated space can become a space that is
appropriated by inhabitants, especially if there are
no spaces in the proximity that are more popular.
To investigate how and which kinds of prospects
and refuges influence the attachment to certain
spaces, two more supplementary concepts, already
mentioned in this article, need to be included in the
aesthetical assessment framework: legibility and
mystery. The former is a specification of a prospect,
the latter is a particular type of refuge. According to
Kaplan, the prospect as a promise for more
information accessible at the current moment
develops into the concept of mystery. The secondary
refuge as a possibility of making sense of a scene
from a safe vantage point contributes to the concept
of legibility [17]. I include these concepts, but no
other elements such as complexity, coherence etc.
(see above) in the assessment model, as empirical
investigations prove that high levels of mystery and
legibility correlate with higher preferability [23].
Note, that not every secondary refuge represents
legibility and furthermore, that not every secondary
prospect promotes mystery. Legibility is provided by
Scientific Journal of Latvia University of Agriculture
Landscape Architecture and Art, Volume 9, Number 9
14
TABLE 2
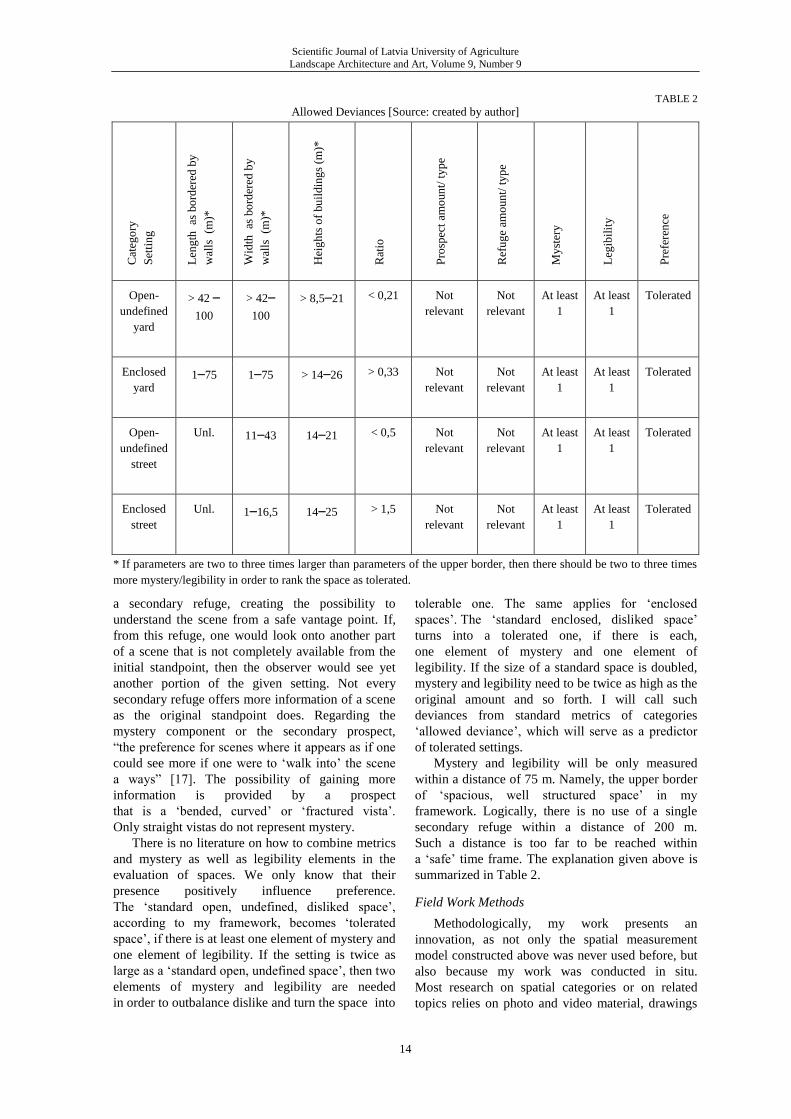
Allowed Deviances [Source: created by author]
* If parameters are two to three times larger than parameters of the upper border, then there should be two to three times
more mystery/legibility in order to rank the space as tolerated.
a secondary refuge, creating the possibility to
understand the scene from a safe vantage point. If,
from this refuge, one would look onto another part
of a scene that is not completely available from the
initial standpoint, then the observer would see yet
another portion of the given setting. Not every
secondary refuge offers more information of a scene
as the original standpoint does. Regarding the
mystery component or the secondary prospect,
“the preference for scenes where it appears as if one
could see more if one were to ‘walk into’ the scene
a ways” [17]. The possibility of gaining more
information is provided by a prospect
that is a ‘bended, curved’ or ‘fractured vista’.
Only straight vistas do not represent mystery.
There is no literature on how to combine metrics
and mystery as well as legibility elements in the
evaluation of spaces. We only know that their
presence positively influence preference.
The ‘standard open, undefined, disliked space’,
according to my framework, becomes ‘tolerated
space’, if there is at least one element of mystery and
one element of legibility. If the setting is twice as
large as a ‘standard open, undefined space’, then two
elements of mystery and legibility are needed
in order to outbalance dislike and turn the space into
tolerable one. The same applies for ‘enclosed
spaces’. The ‘standard enclosed, disliked space’
turns into a tolerated one, if there is each,
one element of mystery and one element of
legibility. If the size of a standard space is doubled,
mystery and legibility need to be twice as high as the
original amount and so forth. I will call such
deviances from standard metrics of categories
‘allowed deviance’, which will serve as a predictor
of tolerated settings.
Mystery and legibility will be only measured
within a distance of 75 m. Namely, the upper border
of ‘spacious, well structured space’ in my
framework. Logically, there is no use of a single
secondary refuge within a distance of 200 m.
Such a distance is too far to be reached within
a ‘safe’ time frame. The explanation given above is
summarized in Table 2.
Field Work Methods
Methodologically, my work presents an
innovation, as not only the spatial measurement
model constructed above was never used before, but
also because my work was conducted in situ.
Most research on spatial categories or on related
topics relies on photo and video material, drawings
Cat
ego
ry
Set
tin
g
Len
gth
as
bo
rder
ed b
y
wal
ls
(m)*
Wid
th
as b
ord
ered
by
wal
ls
(m)*
Hei
gh
ts o
f bu
ildin
gs
(m)*
Rat
io
Pro
spec
t am
oun
t/ t
yp
e
Ref
ug
e am
oun
t/ t
yp
e
My
ster
y
Leg
ibil
ity
Pre
fere
nce
Open-
undefined
yard
> 42 –
100
> 42–100
> 8,5–21 < 0,21 Not
relevant
Not
relevant
At least
1
At least
1
Tolerated
Enclosed
yard 1–75 1–75 > 14–26 > 0,33 Not
relevant
Not
relevant
At least
1
At least
1
Tolerated
Open-
undefined
street
Unl. 11–43 14–21 < 0,5 Not
relevant
Not
relevant
At least
1
At least
1
Tolerated
Enclosed
street
Unl. 1–16,5 14–25 > 1,5 Not
relevant
Not
relevant
At least
1
At least
1
Tolerated
Scientific Journal of Latvia University of Agriculture
Landscape Architecture and Art, Volume 9, Number 9
15
or computer simulated images of spaces as stimuli
for participants to rank spaces according
to preferability and/or feeling of safety,
comfort, enclosure etc. [33; 13; 30; 21; 35].
I will, on the contrary, use formal standards and
deviances in order to predict the category in real
space. In the following part, I will explain the
method used to collect data in this field.
I have selected 80 possible everyday routes in
every housing estate, five of which were selected by
the random choice principle to avoid subjectivity.
Every route runs between two points: the exit of
a dwelling to the nearest facility, such as public
transport stops, shops, libraries, post offices, parking
lots, schools, kindergartens etc. Each route
comprises a distance of at least 500 m. Besides, none
of the routes is longer than 800 m – a distance,
where “psycho-social purposes of neighbourhood
[are] ... strongest” [19, 2107].
Furthermore, on each route five scenes are
marked, except for Lenina iela residential area,
where the routes are significantly shorter than
anywhere else. However, the choice of scenes on the
routes is not random. Each time, the visual field
changes, it reflects a change in the landscape
and a new scene with different visual characteristics
has developed.
After detecting the scenes, they are captured by
using a photo camera according to a shooting script.
A shooting script is a set of guidelines that is closely
linked to the research question [31]. The camera is
situated at the height of the average eye-level
(160 cm) and at the degrees of 180 horizontally
and 90 vertically, always facing the walking
distance. Although the field of the human vision as
well as the informational load of the particular scene
depend on age the usage of peripheral vision or
movement of head permits humans to mostly
perceive the front hemisphere of what is surrounding
them and thus, acquire at least a vague idea of the
scenery at the angle of 180° [36; 4]. Hence, 180°
images represent the field of both – direct and
peripheral sights. All in all, I detected 99 scenes for
further analysis. This method of camera usage
for fieldwork is called photo-documentation [26].
This method forces the researcher to work according
to a certain system or a route, instead of pushing the
button of a photo camera whenever there is an
interesting scene for the analysis [31; 25].
Eventually, the photos and Google earth data
of the particular scenes will be measured and
analysed. The height to width ratios are measured by
using supplementary data from original layout-plans
of the residential areas. The determinant points are
walls and streets. Attribution of theoretical spatial
category is carried out on the basis of measurements
and scene elements. Importantly, the notes on
irregularities and particular features, such as hills
and groups of trees, have to be marked. In the end,
the presence of these elements might play
an important role when data, extracted from the
metric method, is compared to a set of data from
an interview.
Later on, the estimated theoretical preferability
ratings will be attached to each scene. Every scene is
allocated a number of points: 30–21 means liked;
20–11 tolerated, and 10–0 disliked. The precise
number of points depends on the quality and
visibility of the mystery and legibility component in
the scene. All information about each scene will be
displayed in a table.
Lastly, all the scenes in the four residential areas
are depicted on a route map. Theoretical categories
and likability rankings, as well as borders of each
setting, are graphically depicted.
Results and Discussion
The creation of replicable method for evaluation
of influence of spatial aesthetics on the everyday and
particularly the assemblage of the model of spatial
measurements proved to be a complicated process.
It was decided that four spatial categories,
introduced by S. Kaplan in 1979, will serve as the
basic division of all possible spaces in an urban
environment. After that, the measurements stated in
the last decade by various scientists of liked and
disliked, safe and dangerous, too enclosed or too
open spaces etc. were fitted to three (one did not
need any measurements) of categories, which were
also granted different likability options. Categories
had to be expressed as spaces of a rectangularish or
triangularish shape to adapt them to the
measurements. It turned out, that quite a few
parameters of liked and disliked, comfortable and
uncomfortable, safe and unsafe etc. spaces were
already published in the literature. Yet, there were
many others that had to be calculated based on an
analogy principle, which might be considered to be
a downside of the model. To achieve a more
differentiated model, the counts of mystery and
legibility elements were included. The completed
model proved to be easily applicable in most of the
cases. The precision of the measurement of spaces in
three dimensions played an important role in the
process. Yet, there were also a few uncertainties
about the application of the model, caused by
irregularities of spaces, for instance, if an outdoor
space is not a rectangle or triangle, but has a very
asymmetric shape. Here, the space‘s measurement
can hardly be precise - this results to be a downside
of such a model, too.
In short, 99 scenes were analysed by the metric
method, these are:
41 open, undefined disliked scenes;
28 open, undefined tolerated scenes;
19 enclosed disliked scenes;
Scientific Journal of Latvia University of Agriculture
Landscape Architecture and Art, Volume 9, Number 9
16
10 enclosed tolerated scenes;
1 spacious, well-structured liked scene.
there are no blocked views amongst the scenes.
It is expected, that the 60 disliked scenes are
rejected by the inhabitants, all 29 tolerated scenes
are appropriated under certain circumstances, and
the only liked scene is appropriated. Depending on
amount of prospects and refuges, some of the
disliked scenes were rated with the minimum of the
possible points – 1, some were rated with the
maximum – 10. Yet, some tolerated scenes were
ranked with the least possible number of points – 11,
which shows that they were ranked closely to the
disliked scenes. Some other scenes with 20 points
almost reached a liked scene status. The system of
points will gain its importance, once the results are
correlated with qualitative interviews. For the
purpose of shortness, I will not discuss the given
points here.
If one looks closer at the distribution of scenes
among particular residential areas, then the
composition is (in chronological order):
Agenskalna priedes (24 scenes): 13 open,
undefined disliked; six open, undefined tolerated;
three enclosed, disliked; two enclosed
tolerated scenes;
Kengarags (36 scenes): 14 open, undefined
disliked; ten open, undefined tolerated; nine
enclosed, disliked; two enclosed tolerated; one
spacious, well-structured liked scene;
Zolitude (31 scene): twelve open, undefined
disliked; nine open, undefined tolerated;
seven enclosed, disliked; three enclosed
tolerated scenes;
Lenina iela (8 scenes): two open, undefined
disliked; three open, undefined tolerated;
three enclosed, tolerated scenes.
The below given visual data summary represents
bird’s eye view images picturing every route
represented by lines and arrows of different colours.
Next to the arrow, there is a white circle that shows a
letter and a number. The letter indicates
the name of the area (A for Agenskalna priedes,
K–Kengarags, Z–Zolitude, L–Lenina iela), the first
number is the number of the route, the second number
is the number of the scene. Every scene is demarcated
by a rectangle or triangle. They all represent wall to
wall spaces, which can be viewed from a given
standpoint marked as an arrow. The colours reflect the
following meanings: dark blue represents an ‘open,
undefined, disliked scene’; light blue represents an
‘open, undefined, tolerated scene’; dark green
represents an ‘enclosed, disliked scene’; light green
represents an ‘enclosed, tolerated scene’ and yellow
represents a ‘spacious, well-structured scene’.
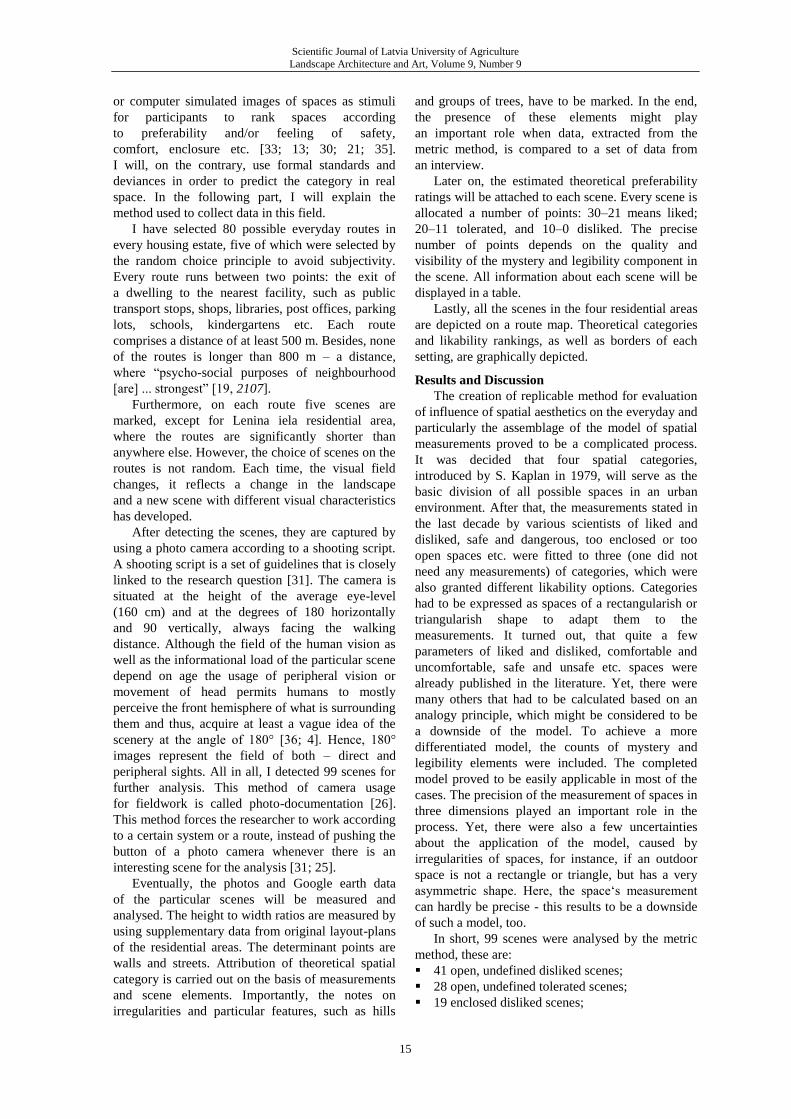
A route (marked in red) in Agenskalna priedes is
composed of five scenes: four yards, one street.
Figure 1 represents these five scenes filled with three
different colours, representing a theoretical ranking of
each scene. The route starts with scene
A11 which is ranked as an ‘open, undefined and
disliked scene’. Then the route proceeds through
settings A12 and A13, categorized as ‘enclosed and
disliked scenes’. In the end, the route leads through
the spaces A14 and A15 which are ‘open,
undefined and tolerated areas’.
As explained earlier in this article, the shape of the
yards is defined by the walls or streets. Note, that the
shape of settings A12 and A13 is defined by the
buildings standing in the front part of the scene.
The points, where buildings end, the straight lines of
the scenes are seemingly formed by empty air and not
by walls or streets. Yet, standing at the viewpoints
A12 and A13, the field of vision is strongly
influenced by these bordering houses close to the
viewer. Hence, the whole shape of the setting is
defined by those houses, even though they only
border a very small fraction of the space.
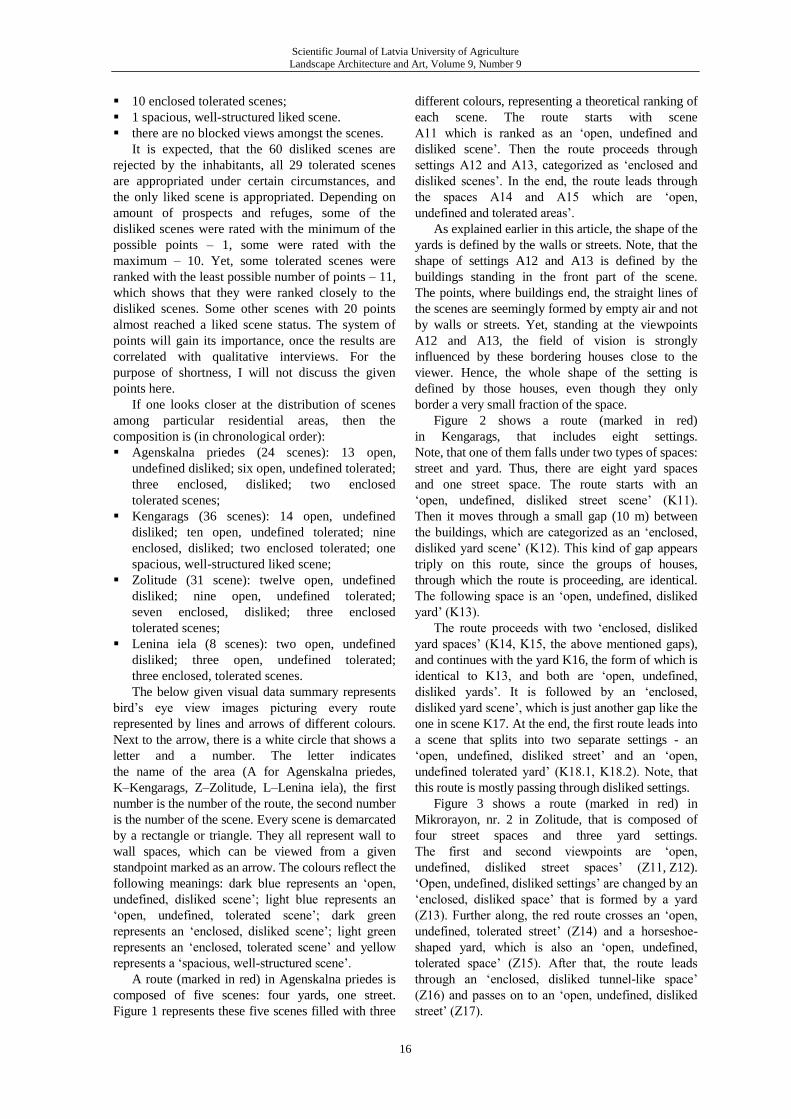
Figure 2 shows a route (marked in red)
in Kengarags, that includes eight settings.
Note, that one of them falls under two types of spaces:
street and yard. Thus, there are eight yard spaces
and one street space. The route starts with an
‘open, undefined, disliked street scene’ (K11).
Then it moves through a small gap (10 m) between
the buildings, which are categorized as an ‘enclosed,
disliked yard scene’ (K12). This kind of gap appears
triply on this route, since the groups of houses,
through which the route is proceeding, are identical.
The following space is an ‘open, undefined, disliked
yard’ (K13).
The route proceeds with two ‘enclosed, disliked
yard spaces’ (K14, K15, the above mentioned gaps),
and continues with the yard K16, the form of which is
identical to K13, and both are ‘open, undefined,
disliked yards’. It is followed by an ‘enclosed,
disliked yard scene’, which is just another gap like the
one in scene K17. At the end, the first route leads into
a scene that splits into two separate settings - an
‘open, undefined, disliked street’ and an ‘open,
undefined tolerated yard’ (K18.1, K18.2). Note, that
this route is mostly passing through disliked settings.
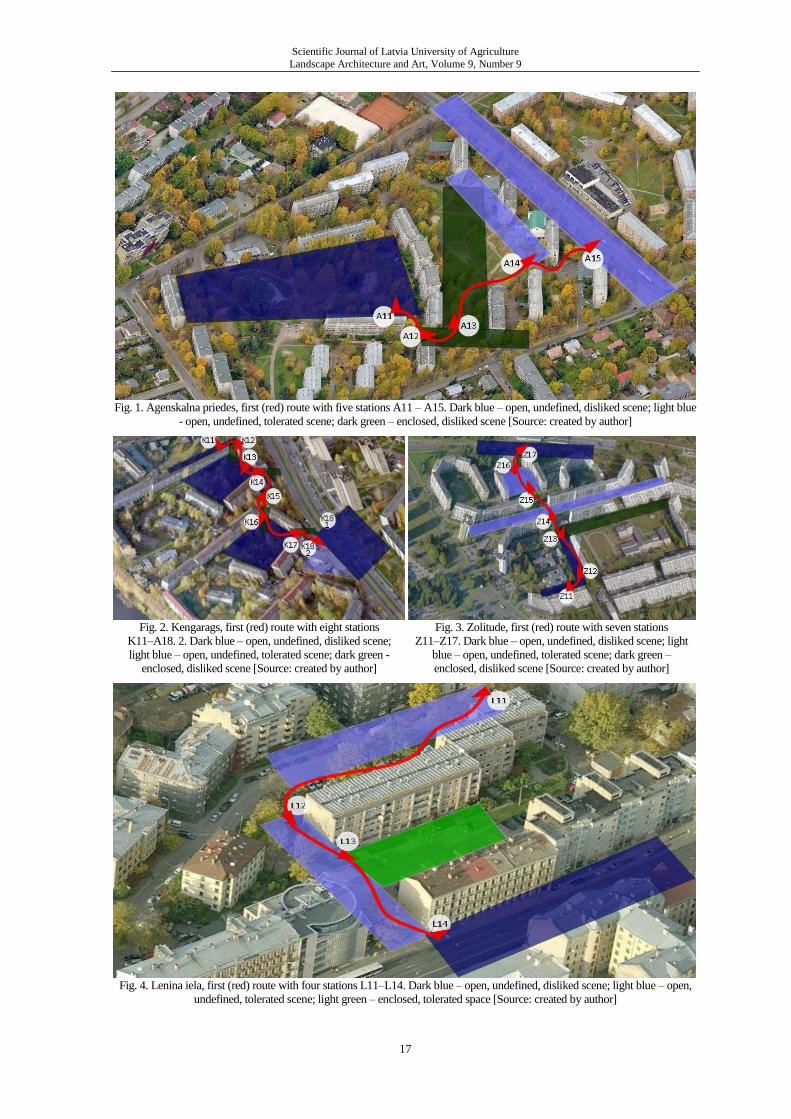
Figure 3 shows a route (marked in red) in
Mikrorayon, nr. 2 in Zolitude, that is composed of
four street spaces and three yard settings.
The first and second viewpoints are ‘open,
undefined, disliked street spaces’ (Z11, Z12).
‘Open, undefined, disliked settings’ are changed by an
‘enclosed, disliked space’ that is formed by a yard
(Z13). Further along, the red route crosses an ‘open,
undefined, tolerated street’ (Z14) and a horseshoe-
shaped yard, which is also an ‘open, undefined,
tolerated space’ (Z15). After that, the route leads
through an ‘enclosed, disliked tunnel-like space’
(Z16) and passes on to an ‘open, undefined, disliked
street’ (Z17).
Scientific Journal of Latvia University of Agriculture
Landscape Architecture and Art, Volume 9, Number 9
17
Fig. 1. Agenskalna priedes, first (red) route with five stations A11 – A15. Dark blue – open, undefined, disliked scene; light blue
- open, undefined, tolerated scene; dark green – enclosed, disliked scene [Source: created by author]
Fig. 2. Kengarags, first (red) route with eight stations
K11–A18. 2. Dark blue – open, undefined, disliked scene;
light blue – open, undefined, tolerated scene; dark green -
enclosed, disliked scene [Source: created by author]
Fig. 3. Zolitude, first (red) route with seven stations
Z11–Z17. Dark blue – open, undefined, disliked scene; light
blue – open, undefined, tolerated scene; dark green –
enclosed, disliked scene [Source: created by author]
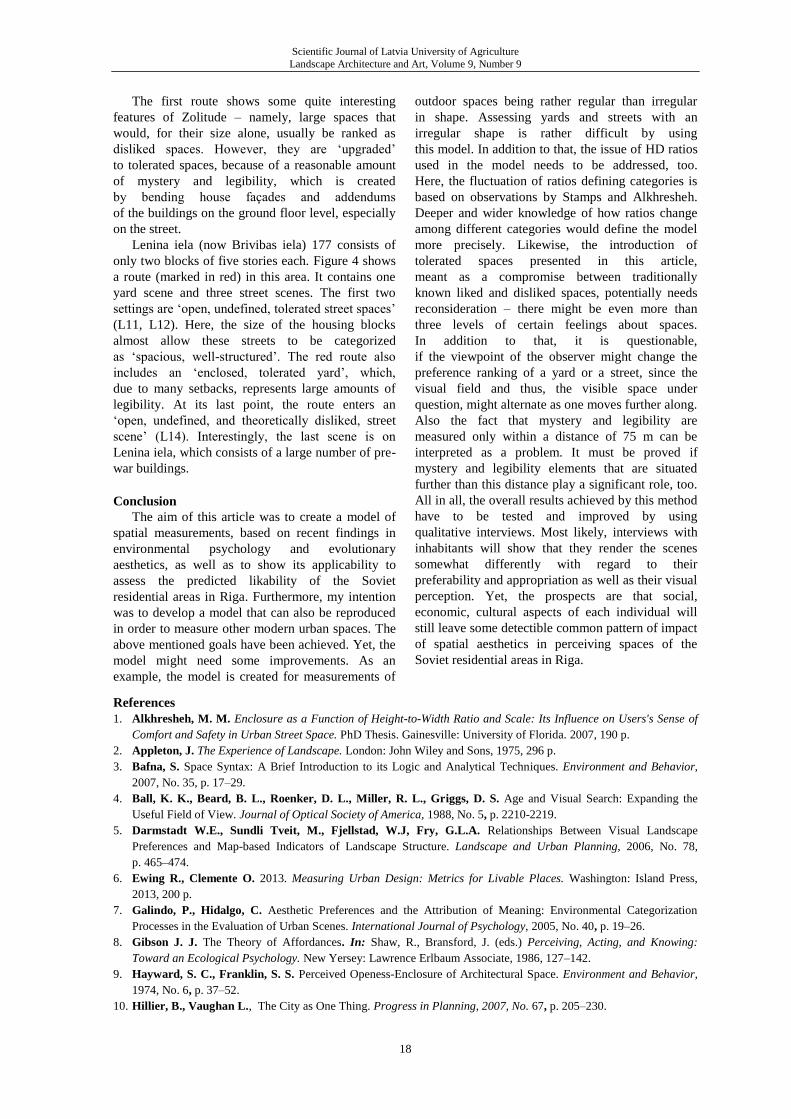
Fig. 4. Lenina iela, first (red) route with four stations L11–L14. Dark blue – open, undefined, disliked scene; light blue – open,
undefined, tolerated scene; light green – enclosed, tolerated space [Source: created by author]
Scientific Journal of Latvia University of Agriculture
Landscape Architecture and Art, Volume 9, Number 9
18
The first route shows some quite interesting
features of Zolitude – namely, large spaces that
would, for their size alone, usually be ranked as
disliked spaces. However, they are ‘upgraded’
to tolerated spaces, because of a reasonable amount
of mystery and legibility, which is created
by bending house façades and addendums
of the buildings on the ground floor level, especially
on the street.
Lenina iela (now Brivibas iela) 177 consists of
only two blocks of five stories each. Figure 4 shows
a route (marked in red) in this area. It contains one
yard scene and three street scenes. The first two
settings are ‘open, undefined, tolerated street spaces’
(L11, L12). Here, the size of the housing blocks
almost allow these streets to be categorized
as ‘spacious, well-structured’. The red route also
includes an ‘enclosed, tolerated yard’, which,
due to many setbacks, represents large amounts of
legibility. At its last point, the route enters an
‘open, undefined, and theoretically disliked, street
scene’ (L14). Interestingly, the last scene is on
Lenina iela, which consists of a large number of pre-
war buildings.
Conclusion
The aim of this article was to create a model of
spatial measurements, based on recent findings in
environmental psychology and evolutionary
aesthetics, as well as to show its applicability to
assess the predicted likability of the Soviet
residential areas in Riga. Furthermore, my intention
was to develop a model that can also be reproduced
in order to measure other modern urban spaces. The
above mentioned goals have been achieved. Yet, the
model might need some improvements. As an
example, the model is created for measurements of
outdoor spaces being rather regular than irregular
in shape. Assessing yards and streets with an
irregular shape is rather difficult by using
this model. In addition to that, the issue of HD ratios
used in the model needs to be addressed, too.
Here, the fluctuation of ratios defining categories is
based on observations by Stamps and Alkhresheh.
Deeper and wider knowledge of how ratios change
among different categories would define the model
more precisely. Likewise, the introduction of
tolerated spaces presented in this article,
meant as a compromise between traditionally
known liked and disliked spaces, potentially needs
reconsideration – there might be even more than
three levels of certain feelings about spaces.
In addition to that, it is questionable,
if the viewpoint of the observer might change the
preference ranking of a yard or a street, since the
visual field and thus, the visible space under
question, might alternate as one moves further along.
Also the fact that mystery and legibility are
measured only within a distance of 75 m can be
interpreted as a problem. It must be proved if
mystery and legibility elements that are situated
further than this distance play a significant role, too.
All in all, the overall results achieved by this method
have to be tested and improved by using
qualitative interviews. Most likely, interviews with
inhabitants will show that they render the scenes
somewhat differently with regard to their
preferability and appropriation as well as their visual
perception. Yet, the prospects are that social,
economic, cultural aspects of each individual will
still leave some detectible common pattern of impact
of spatial aesthetics in perceiving spaces of the
Soviet residential areas in Riga.
References
1. Alkhresheh, M. M. Enclosure as a Function of Height-to-Width Ratio and Scale: Its Influence on Users's Sense of
Comfort and Safety in Urban Street Space. PhD Thesis. Gainesville: University of Florida. 2007, 190 p.
2. Appleton, J. The Experience of Landscape. London: John Wiley and Sons, 1975, 296 p.
3. Bafna, S. Space Syntax: A Brief Introduction to its Logic and Analytical Techniques. Environment and Behavior,
2007, No. 35, p. 17–29.
4. Ball, K. K., Beard, B. L., Roenker, D. L., Miller, R. L., Griggs, D. S. Age and Visual Search: Expanding the
Useful Field of View. Journal of Optical Society of America, 1988, No. 5, p. 2210-2219.
5. Darmstadt W.E., Sundli Tveit, M., Fjellstad, W.J, Fry, G.L.A. Relationships Between Visual Landscape
Preferences and Map-based Indicators of Landscape Structure. Landscape and Urban Planning, 2006, No. 78,
p. 465–474.
6. Ewing R., Clemente O. 2013. Measuring Urban Design: Metrics for Livable Places. Washington: Island Press,
2013, 200 p.
7. Galindo, P., Hidalgo, C. Aesthetic Preferences and the Attribution of Meaning: Environmental Categorization
Processes in the Evaluation of Urban Scenes. International Journal of Psychology, 2005, No. 40, p. 19–26.
8. Gibson J. J. The Theory of Affordances. In: Shaw, R., Bransford, J. (eds.) Perceiving, Acting, and Knowing:
Toward an Ecological Psychology. New Yersey: Lawrence Erlbaum Associate, 1986, 127–142.
9. Hayward, S. C., Franklin, S. S. Perceived Openess-Enclosure of Architectural Space. Environment and Behavior,
1974, No. 6, p. 37–52.
10. Hillier, B., Vaughan L., The City as One Thing. Progress in Planning, 2007, No. 67, p. 205–230.
Scientific Journal of Latvia University of Agriculture
Landscape Architecture and Art, Volume 9, Number 9
19
11. Herzog T. R. A Cognitive Analysis of Preference for Urban Spaces. Journal of Environmental Psychology, 1992,
No. 12, p. 237–248.
12. Herzog T.R., Maguire P., Nebel M.B. Assessing the restorative components of environment. Journal of
Environmental Psychology, 2003, No. 23, p. 159–170.
13. Herzog T. R., Smith, G. A. Danger, Mystery, and Environmental Preference. Environment and Behavior 1988, No,
20, p. 320–344.
14. Jagt, A. P. N. V. D., Craig, T., Anable, J., Brewer, M., J., Pearson, D. G. Unearthing the picturesque: The validity of
the preference matrix as a measure of landscape aesthetics. Landscape and Urban Planning, 2014, No. 124, p. 1–13.
15. Kaplan, S. Concerning the Power of Content-identifying Methodologies. In: Daniel T. C., Zube, E. H. (eds.)
Assessing Amenity Resource Values. USDA Forest Service General Technical Report RM-68. Fort Collins: Rocky
Mountain Forest and Range Experimental Station, 1979a, 35 p.
16. Kaplan, S. Environmental preference in a knowledge-seeking, knowledge-using organism. In: Barkow, J. H.,
Cosmides, L., Tooby, J (Eds). The adapted mind: Evolutionary psychology and the generation of culture , New York:
Oxford University Press,1992, p. 581-598.17.
17. Kaplan, S. Perception and Landscape: Conceptions and Misconceptions [Online 15.02.2013].
http://www.fs.fed.us/psw/publications/documents/psw_gtr035/psw_gtr035_05_s-kaplan.pdf
18. Kaplan, R. Environmental Description and Prediction: A Conceptual Analysis. In: Evans, G. W., Garling, T. (eds.)
Environment, Cognition, and Action : An Integrated Approach. New York: Oxford University Press, 1991, 368 p.
19. Kearns, A., Parkinson, M. The Significance of Neighbourhood. Urban Studies, 2001, No. 28, p. 2103–2110.
20. Konrad L. 1964. Er redete mit dem Vieh, den Vögeln und den Fischen. München: Deutsche Taschenbuch Verlag,
1964, p. 147.
21. Lindal, P.J., Hartig, T. Architectural Variation, Building Height, and the Restorative Quality of Urban Residential
Streetscapes. Journal of Environmental Psychology, 2013, No. 33, p. 26–36.
22. Llobera M. Extending GIS-based Visual Analysis: the Concept of Visualscapes. International journal of
geographical information, 2003, No. 17, p. 25–48.
23. Nasar J.L., Cubucku E. 2010. Evaluative Appraisals of Environmental Mystery and Surprise. Environment and
Behavior, 2010, No. 43, p. 387–414.
24. Nielsena, A. B., Heymamb, E., Richnaua, G. Liked, Disliked and Unseen Forest Attributes: Relation to Modes of
Viewing and Cognitive Constructs. Journal of Environmental Management, 2012, No.113, p. 456–466.
25. Pauwels, L. Visual Sociology Reframed: An Analytical Synthesis and Discussion of Visual Methods in Social and
Cultural Research Sociological Methods and Research, 2010., No. 38, p. 545-581.
26. Rose G. Visual Methodologies. London: Sage, 2012, 465 p.
27. Sevenant, M., Antrop, M. Cognitive Attributes and Aesthetic Preferences in Assessment and Differentiation of
Landscapes. Journal of Environmental Management, 2009, No. 90, p. 2889–2899.
28. Spreiregen, P. D. Urban Design: The Architecture of Towns and Cities, Chicago, McGraw-Hill, 1965, p.243.
29. Stamps, A. E. Enclosure and Safety in Urban Spaces. Environment and Behavior, 2005, No. 37, p. 102-132.
30. Stamps, A. E., Smith, S. Environmental Enclosure in Urban Settings. Environment and Behavior, 2002, No. 34,
p.781–794.
31. Suchar, C. S. Grounding Visual Sociology Research In Shooting Scripts. Qualitative Sociology, 1997, No. 20, p. 33–55.
32. Swanwick, C. The Role of Landscape Character Assessment. In: Davison, R. and Galbraith, C. (Eds). Farming,
Forestry and the National Heritage – Towards a more Integrated Future. The Stationery Office, Edinburgh, 2006, p.
31–57.
33. Thiel, P., Harrison, E. D., Alden, R. S. The Perception of Spatial Enclosure As a Function of the Position of
Architectural Surfaces. Environment and Behavior, 1986, No. 18, p. 227-245.
34. Tveit M., Ode, Å., Fry G. Key Concepts in a Framework for Analyzing Visual Landscape Character. Landscape
research. 2006, No. 31, p. 229–255.
35. Ulrich, R. S., Simson, R. F., Losito, B. D., Fiorito, E., Miles, M. A., Zelson, M. Stress Recovery During Exposure
to Natural and Urban Environments Journal of Environmental Psychology,1991, No.11, p. 201–230.
36. Williams, L. J. Cognitive Load and the Functional Field of View. Human Factors: The Journal of the Human
Factors and Ergonomics Society, 1982, No. 24, p. 683-692.
37. Woodcock, D. M. A Functionalist Approach to Landscape Preference. Landscape Research, 1984, No. 9, p. 24–27.
INFORMATION ABOUT AUTHOR:
Agnese Sofija Kusmane, Mag.art., Doctoral student at Latvia University of Agriculture. Her research
interests include correlation of space and behavior as well as forestry. E-mail:[email protected]
Scientific Journal of Latvia University of Agriculture
Landscape Architecture and Art, Volume 9, Number 9
20
Kopsavilkums. Raksts iepazīstina lasītāju ar jaunu un reproducējamu teorētisko metodi telpiskās
estētikas ietekmes novērtēšanai uz iedzīvotāju ikdienu, kā piemēru izmantojot četrus Padomju laika
tipizētās arhitektūras dzīvojamajos rajonos Rīgā – Āgenskalna priedes, Ķengarags, Zolitūde un
Ļeņina (tagad Brīvības) iela. Izvēlētie ansambļi pārstāv četras atšķirīgas dekādes Padomju laika
pilsētbūvniecībā. To izvēle un analīze pamatojama ar apstākli, ka daudzi no šī laikmeta dzīvojamo
rajonu iedzīvotājiem izrāda interesi par rekonstrukcijas veikšanu. Tomēr ir svarīgi apzināties,
ka ne vienmēr pārbūve uzlabo dzīves kvalitāti. Lai izprastu šo rajonu telpiskās estētikas ietekmi uz
ikdienu ir nepieciešams izveidot metodi, kas ļauj šo ietekmi izmērīt. Rakstā aprakstītā metode ir
reproducējama, tās autore tiecas piedāvāt pielietojamu un atkārtoti izmantojamu veidu, lai noteiktu
Padomju dzīvojamo rajonu rekonstrukcijas optimālāko ceļu. Aprakstīto metodi iespējams izmantot
arī citu laikmetu pilsētvides pētniecībai, tomēr šajā gadījumā rakstā piedāvātā mērījumu skala
jāpielāgo attiecīgo ārtelpu izmēriem. Teorētisko nostādņu pamatā ir evolucionārās estētikas un
vides uztveres psiholoģijas atziņas. Šo lauku zinātnieki jau pirms vairākām desmitgadēm ir
atklājuši, ka ārtelpas, kurās ir vērojami, piemēram, tādi elementi, kā skats un slēpnis, ir daudz
patīkamākas un tiek apmeklētas un lietotas jeb apropriētas biežāk. Ainas, kurās šādi elementi nav
redzami, attiecīgi nav tīkamas un netiek apropriētas. Pēdējās dekādes laikā vairāki zinātnieki ir
aprēķinājuši dažu patīkamo un nepatīkamo telpu izmērus. Rakstā ir apkopoti pieejamie mērījumi,
kas izsaka patīkamu un nepatīkamu telpu lielumus metros. Lielākā daļa rakstā citēto mērījumu ir
izkaisīti vairāku autoru darbos. Trūkstošos lielumus autore ir aprēķinājusi, vadoties pēc analoģijas
principa. Tur klāt visi patīkamo un nepatīkamo telpu mērījumi ir klasificēti, izmantojot četras vides
uztveres psiholoģijā pazīstamas telpu kategorijas. Tās ir: atvērta, nedefinēta telpa; plaša, strukturēta
telpa; ierobežota telpa; bloķēts skats. Plaša strukturēta ārtelpa ir vistīkamākā, bet pārējās cilvēka
acij ir netīkamas ārtelpas. Rakstā citētie un jauniegūtie mērījumi, pakārtoti attiecīgajām
kategorijām, ir apvienoti telpisko mērījumu modelī. Modeļa pielietošanas gaitā ir iespējams noteikt
katras analizētās ārtelpas, šajā gadījumā – pagalma vai ielas – teorētisko pievilcīgumu un iespējamo
apropriācijas intensitāti. Modeļa izmantošana ir iespējama tikai tad, ja interesējošās ārtelpas
ir iespējams izmērīt trijās dimensijās – ir nepieciešams zināt gan telpu ieskujošo ēku augstumu,
gan pagalma vai ielas platumu un garumu. Svarīga ir arī ārtelpas apskate, kuras laikā ir iespējams
identificēt specifiskus skatus un slēpņus, to skaits arī ir būtisks, lai klasificētu ārtelpu kā potenciāli
patīkamu vai nepatīkamu. Svarīgi paturēt prāta, ka metode esošajā stadijā ir izmēģinājuma fāzē,
to ir nepieciešams pārbaudīt un uzlabot, balstoties kvalitatīvo interviju ar iedzīvotājiem materiālā.