Embed Size (px)
Citation preview

VALUE LINE INVESTMENT EDUCATION
How to Read a Value Line Report
Smart research. Smarter investing.™

©2016 Value Line, Inc. All Rights Reserved. Value Line, the Value Line logo, The Value Line Investment Survey, The Most Trusted Name in Investment Research, “Smart research. Smarter investing.”, Timeliness, and Safety are trademarks or registered trademarks of Value Line, Inc. and/or its affiliates in the United States and other countries. All other trademarks are the property of their respective owners. Factual material is obtained from sources believed to be reliable and any information contained herein is provided without warranties of any kind. VALUE LINE IS NOT RESPONSIBLE FOR ANY ERRORS OR OMISSIONS HEREIN OR ANY DAMAGES OR LOSSES ARISING FROM ANY USE OF THIS REPORT. This report is strictly for each subscriber’s own, non-commercial, internal use. No part of this report may be reproduced, resold, stored or transmitted in any printed, electronic or other form, or used for generating or marketing any printed or electronic publication, service or product. Nothing herein should be construed as an offer to buy or sell securities or to give individual investment advice. Value Line Arithmetic and Geometric indices calculated by Thomson Reuters. Information supplied by Thomson Reuters. 1503516

1 How to Read a Value Line Report
How to Read a Value Line Report
In order to make the best use of our products, you’ll want to understand our research reports and put them in context. This guide was designed to help you do just that. Referring to this guide will assist you in using our services as forecast-ers of relative stock price performance as well as a source of interpretive analysis and historical information that will assist you in spotting trends.
I: GETTING STARTED
As a subscriber, you will receive three parts of The Value Line Investment Survey® each week. Part 1 is the Summary & Index, Part 2 is Selection & Opinion and Part 3 is Ratings & Reports. Below we will describe each section and discuss some of the ways to use them.
Part 1 — Summary & Index
Start with the Summary & Index. The front cover contains a Table of Contents, three important market statistics, and a list of all the industries we follow in alphabetical order with their current industry rank shown next to the name of the industry. The page number is to the right. The market statistics are found in three boxes. The first box (A) has the median of estimated price/earnings ratios of all stocks with earnings covered in The Value Line Investment Survey (ap-proximately 1,700). The second box (B) shows the median of estimated dividend yields (total dividends expected to be paid in the next 12 months divided by the recent price) of all dividend-paying stocks in The Value Line Investment Survey. The third box (C) contains the estimated median
price appreciation potential 3 to 5 years into the future for the approximately 1,700 stocks in The Value Line Invest-ment Survey, based on Value Line’s hypothesized economic environment 3 to 5 years hence. By assessing these statistics, a fairly good picture emerges of how the universe of Value Line stocks — which comprises approximately 90% of the market capitalization of all stocks traded in U.S. markets and is therefore quite representative of the stock market as a whole — is currently being evaluated.
Summary & Index
Industries, in alphabetical order .................................................................................................................................. 1Stocks, in alphabetical order .................................................................................................................................. 2-23Noteworthy Rank Changes ....................................................................................................................................... 24
Industries, in order of Timeliness Rank .................. 24Timely Stocks in Timely Industries .................... 25-26Timely Stocks (1 & 2 for Performance) ............. 27-29Conservative Stocks (1 & 2 for Safety) ............. 30-31Highest Dividend Yielding Stocks ........................... 32Stocks with High 3- to 5-year Price Potential ......... 32Biggest ″Free Flow″ Cash Generators ................... 33Best Performing Stocks last 13 Weeks .................. 33Worst Performing Stocks last 13 Weeks ................ 33Widest Discounts from Book Value ........................ 34
Stocks with Lowest P/Es ........................................ 35Stocks with Highest P/Es ........................................ 35Stocks with Highest Annual Total Returns ............. 36Stocks with Highest 3- to 5-year Dividend Yield .... 36High Returns Earned on Total Capital .................... 37Bargain Basement Stocks ...................................... 37Untimely Stocks (5 for Performance) ...................... 38Highest Dividend Yielding Non-utility Stocks .......... 38Highest Growth Stocks ........................................... 39
Advertising (27) ........................... 2386*Aerospace/Defense (37) ............... 701
Air Transport (15) .......................... 301Apparel (38) ................................. 2101Automotive (67) ............................. 101Auto Parts (46) .............................. 974Bank (44) ..................................... 2501
*Bank (Midwest) (47) ...................... 775Beverage (9) ................................ 1961
*Biotechnology (34) .............. 1647, 829Brokers & Exchanges (8) ............ 1790Building Materials (20) ................. 1101Cable TV (57) .............................. 1017Chemical (Basic) (84) .................. 1593Chemical (Diversified) (60) .......... 2437Chemical (Specialty) (36) .............. 554Computers/Peripherals (72) ........ 1396Computer Software (30) .............. 2578Diversified Co. (58) ..................... 1736Drug (31) ..................................... 1605E-Commerce (17) ........................ 1808Educational Services (95) ........... 1993Electrical Equipment (78) ............ 1301Electric Util. (Central) (70) ............. 901Electric Utility (East) (61) .............. 140
Electric Utility (West) (43) ........... 2227Electronics (69) ........................... 1317Engineering & Const (80) ............ 1235Entertainment (42) ....................... 2326Entertainment Tech (59) ............. 2001Environmental (55) ........................ 415Financial Svcs. (Div.) (41) ........... 2531Food Processing (26) .................. 1901Foreign Electronics (83) .............. 1978Funeral Services (21) .................. 1824Furn/Home Furnishings (4) ......... 1147
*Healthcare Information (35) .......... 820Heavy Truck & Equip (87) ............. 155Homebuilding (54) ....................... 1122Hotel/Gaming (48) ....................... 2350Household Products (11) ............. 1188Human Resources (13) ............... 1635Industrial Services (28) ................. 380Information Services (5) ................ 440IT Services (1) ............................. 2600Insurance (Life) (49) .................... 1551
*Insurance (Prop/Cas.) (14) ............ 754Internet (7) ................................... 2619Investment Banking (79) ............. 1801Investment Co. (--) ...................... 1204
Investment Co.(Foreign) (--) .......... 425Machinery (32) ............................ 1701Maritime (81) ................................. 329
*Medical Services (18) ........... 457, 794Med Supp Invasive (10) ................ 172Med Supp Non-Invasive (19) ........ 197
*Metal Fabricating (90) ................... 729Metals & Mining (Div.) (97) ......... 1579Natural Gas Utility (39) .................. 541Natural Gas (Div.) (94) .................. 520Newspaper (86) ........................... 2380Office Equip/Supplies (71) .......... 1415Oil/Gas Distribution (74) ................ 600Oilfield Svcs/Equip. (92) .............. 2409Packaging & Container (66) ........ 1174Paper/Forest Products (73) ......... 1162Petroleum (Integrated) (88) ........... 501Petroleum (Producing) (96) ......... 2395Pharmacy Services (12) ................ 965Pipeline MLPs (85) ........................ 611Power (89) ................................... 1217Precious Metals (93) ................... 1563Precision Instrument (63) .............. 111Public/Private Equity (77) ............ 2646Publishing (50) ............................ 2371
Railroad (62) .................................. 338R.E.I.T. (29) ................................. 1513Recreation (16) ............................ 2301Reinsurance (65) ......................... 2017Restaurant (24) ............................. 350Retail Automotive (2) ................... 2118Retail Building Supply (3) ............ 1138Retail (Hardlines) (64) ......... 457, 2162Retail (Softlines) (76) .......... 457, 2201Retail Store (40) .................. 457, 2132Retail/Wholesale Food (33) ......... 1942Semiconductor (51) ..................... 1348Semiconductor Equip (68) ........... 1386Shoe (22) ..................................... 2153
*Steel (91) ....................................... 739Telecom. Equipment (75) .............. 939Telecom. Services (23) ................. 920Telecom. Utility (82) .................... 1026Thrift (6) ....................................... 1501Tobacco (25) ............................... 1986Toiletries/Cosmetics (52) ............. 1006Trucking (53) ................................. 318Water Utility (56) ......................... 1780Wireless Networking (45) .............. 582
In three parts: This is Part 1, the Summary & Index. Part 2 is Selection & Opinion. Part 3 is Ratings & Reports. Volume LXXI, No. 17.Published weekly by VALUE LINE PUBLISHING LLC, 485 Lexington Avenue, New York, N.Y. 10017-2630
© 2015 Value Line, Inc. All rights reserved. Factual material is obtained from sources believed to be reliable and is provided without warranties of any kind. THE PUBLISHER IS NOTRESPONSIBLE FOR ANY ERRORS OR OMISSIONS HEREIN. This publication is strictly for each subscriber’s own, non-commercial, internal use. No part of this publication may bereproduced, resold, stored or transmitted in any printed, electronic or other form, or used for generating or marketing any printed or electronic publication, service or product.
See back cover for important disclosures.
Part 1
Summary&
Index
THE ALUE LINEInvestment Survey®
File at the front of theRatings & Reports
binder. Last week’sSummary & Index
should be removed.
December 11, 2015
®
TABLE OF SUMMARY & INDEX CONTENTS Summary & IndexPage Number
SCREENS
The Median of EstimatedPRICE-EARNINGS RATIOS
of all stocks with earnings
18.126 Weeks Market Low Market High
Ago19.2
3-9-0910.3
5-21-1519.3
The Median of EstimatedDIVIDEND YIELDS
(next 12 months) of all dividendpaying stocks under review
2.2%26 Weeks Market Low Market High
Ago2.1%
3-9-094.0%
5-21-152.0%
The Estimated Median PriceAPPRECIATION POTENTIALof all 1700 stocks in the Value Line
universe in the hypothesizedeconomic environment 3 to 5 years hence
40%26 Weeks Market Low Market High
Ago35%
3-9-09185%
5-21-1535%
ANALYSES OF INDUSTRIES IN ALPHABETICAL ORDER WITH PAGE NUMBERNumeral in parenthesis after the industry is rank for probable performance (next 12 months).
*Reviewed in this week’s issue.
PAGE PAGE PAGE PAGE
A C
B

2 How to Read a Value Line Report
Beginning on page 2, the Summary & Index also includes an alphabetical listing of all stocks in the publication with references to their location in Part 3, Ratings & Reports. If you are looking for a particular stock, look inside the Summary & Index section, which is updated each week to provide the most current data on all companies included in The Value Line Investment Survey.
To locate a report on an individual company, look for the page number just to the left of the company name. Then turn to that page in Part 3, Ratings & Reports, where the page number is shown in the right hand corner.
In the far left column of the Summary & Index is a page number that refers to recent Supplementary Reports, if any, which are included on the back pages of Ratings & Reports. If two stars (HH) appear in that column, it means that there is a Supplementary Report in the current Issue.
There are many columns in the Summary & Index with more information on each of the approximately 1,700 stocks we cover.
There is also a wealth of information in the stock screens toward the back of the Summary & Index, beginning on page 24.
These screens are a good place to start for anyone looking for investment ideas or help in forming a strategy. The screens are also useful for investors who want a list of stocks relevant to specific strategies they may have in mind.
Part 2—Selection & Opinion
Selection & Opinion (S&O) contains Value Line’s weekly economic and stock market commentary and investment ideas, along with one or more pages of research on interest-ing stocks or industries, and a variety of pertinent economic and stock market statistics. It also includes four model stock portfolios (Stocks with Above-Average Year-Ahead Price Potential, Stocks for Income and Potential Price Apprecia-tion, Stocks with Long-Term Price- Growth Potential, and Stocks with Above-Average Dividend Yields). If you spend time with Selection & Opinion each week, you should be able to get some valuable investment ideas and a good understanding of Value Line’s outlook for the stock market and economy. Also, Value Line posts market commentary at least twice each business day at www.valueline.com.
Part 3—Ratings & Reports
Ratings & Reports is the core of The Value Line Investment Survey with one-page reports on approximately 1,700 companies and one-page reports on approximately 100 industries. The company reports contain Timeliness™, Safety™ and Technical ranks, our 3- to 5-year forecasts for stock prices, income and balance sheet data, as much as 17 years of historical data, and our analysts’ commentaries. They also contain stock price charts; quarterly sales, earnings, and dividend information; and a variety of other very useful data. Each page in this section is updated every 13 weeks. When important, and often unforeseen, news occurs during these 13 week intervals, a Supplementary Report (appearing in the back section of Ratings & Reports) is published. If there is a Supplementary Report, its location will be shown in the far left hand column of the Summary & Index, near the company name. (Two stars—HH—indicate that the Supplementary Report is in the current week’s Issue.)
Every week subscribers receive a new Issue of Ratings & Reports containing approximately 130 company reports grouped by industry and a smaller number of industry reports. The industry reports precede the reports on the companies in that same industry. Over the course of three months, revised reports are issued on all approximately 1,700 companies and nearly 100 industries.
Ratings & Reports
THE VALUE LINEInvestment Survey®
Part 3
Ratings&
Reports
PAGE PAGE
© 2015 Value Line, Inc. All rights reserved. Factual material is obtained from sources believed to be reliable and is provided without warranties of any kind. THE PUBLISHER IS NOTRESPONSIBLE FOR ANY ERRORS OR OMISSIONS HEREIN. This publication is strictly for each subscriber’s own, non-commercial, internal use. No part of this publication may bereproduced, resold, stored or transmitted in any printed, electronic or other form, or used for generating or marketing any printed or electronic publication, service or product.See back cover for important disclosures.
AEROSPACE/DEFENSEINDUSTRY ............................................. 701
AAR Corp. ......................................... 702AeroVironment, Inc. ......................... 703Astronics Corporation ...................... 704B/E Aerospace, Inc. ........................... 705
★ Boeing Co. ......................................... 706Bombardier Inc. ‘B’ ........................... 707CAE Inc. ............................................ 708DigitalGlobe, Inc. ............................. 709
★ Elbit Systems Ltd. ............................ 710Esterline Technologies Corp. ............ 711
★ General Dynamics ............................ 712HEICO Corporation ......................... 713
★ Huntington Ingalls Industries ......... 714L-3 Communications ........................ 715
★ Lockheed Martin Corp. .................... 716MacDonald, Dettwiler and Assoc. ... 717Moog Inc. ‘A’ ...................................... 718
★★ Northrop Grumman Corp. ............... 719Orbital ATK ...................................... 720Precision Castparts .......................... 721Raytheon Co. .................................... 722
★ Rockwell Collins, Inc. ....................... 723Spirit AeroSystems Holdings, Inc. .. 724TASER International, Inc. ............... 725Teledyne Technologies ...................... 726
★ TransDigm Group ............................. 727Triumph Group, Inc. ......................... 728
METAL FABRICATINGINDUSTRY ............................................. 729
Chart Industries, Inc. ....................... 730Dynamic Materials Corp. ................. 731Haynes International, Inc. ............... 732
★ Illinois Tool Works ............................ 733Kennametal Inc. ............................... 734Mueller Industries, Inc. ................... 735NN, Inc. ............................................. 736Tenaris S.A. ...................................... 737The Timken Co. ................................ 738
STEEL INDUSTRY ............................... 739AK Steel Holdings ............................ 740ArcelorMittal .................................... 741Carpenter Technology Corp. ............ 742Cliffs Natural Resources Inc. ........... 743Commercial Metals .......................... 744
★ Gibraltar Industries ......................... 745Nucor Corp. ....................................... 746POSCO (ADR) ................................... 747Reliance Steel & Aluminum ............. 748Russel Metals ................................... 749Schnitzer Steel Industries, Inc. ....... 750Steel Dynamics, Inc. ........................ 751U.S. Steel Corp. ................................ 752Worthington Industries .................... 753
INSURANCE (PROPERTY/CASUALTY) INDUSTRY...................... 754
ACE Limited ..................................... 755Alleghany Corp. ................................ 756Allstate Corp. .................................... 757
★ American Financial Group ............... 758★ Arch Capital Group Ltd. .................. 759
Berkley (W.R.) ................................... 760Berkshire Hathaway ‘B’ ................... 761
CNA Financial Corp. ........................ 762Chubb Corp. ...................................... 763
★ Cincinnati Financial ......................... 764Erie Indemnity Co. ........................... 765
★★ Hanover Insurance Group, Inc. ....... 766★★ Markel Corp. ..................................... 767
Mercury General Corp. .................... 768Old Republic International .............. 769Progressive Corp. (Ohio) .................. 770
★ RLI Corp. .......................................... 771Selective Insurance Group ............... 772
★ Travelers (The) Cos., Inc. ................. 773XL Group plc ..................................... 774
BANK (MIDWEST) INDUSTRY ......... 775Associated Banc-Corp ...................... 776BOK Financial Corp. ........................ 777
★ Chemical Financial Corporation ..... 778Comerica Inc. .................................... 779Commerce Bancshares, Inc. ............. 780Fifth Third Bancorp ......................... 781First Horizon Nat’l ........................... 782First Midwest Bancorp .................... 783FirstMerit Corp. ............................... 784Hancock Holding Co. ........................ 785Huntington Bancshares ................... 786Northern Trust Corp. ....................... 787Old National Bancorp ...................... 788Park National Corporation .............. 789
★ PrivateBancorp, Inc. ........................ 790TCF Financial Corp. ......................... 791U.S. Bancorp ..................................... 792Wintrust Financial Corporation ...... 793
MEDICAL SERVICES INDUSTRY .... 794★ Aetna Inc. .......................................... 795★ Amedisys, Inc. .................................. 796★ Anthem, Inc. ..................................... 797
Brookdale Senior Living Inc. ........... 798★ Centene Corp. ................................... 799
Cigna Corporation ............................ 800Community Health Systems, Inc. ... 801
★ DaVita HealthCare Partners Inc. .... 802Envision Healthcare Holdings ......... 803HCA Holdings, Inc. ........................... 804Health Net, Inc. ................................ 805HealthSouth Corporation ................ 806Healthways, Inc. ............................... 807Humana Inc. ..................................... 808Laboratory Corp. of America ........... 809
★ LifePoint Hospitals, Inc. .................. 810★ Medidata Solutions, Inc. ................... 811
★★ MEDNAX, Inc ................................... 812Quest Diagnostics ............................. 813
★ Quintiles Transnational Holdings ... 814Select Medical Holdings Corp. ......... 815Tenet Healthcare Corp. .................... 816UnitedHealth Group ........................ 817
★ Universal Health Services, Inc. ....... 818★★ VCA Inc. ............................................ 819
HEALTHCARE INFORMATIONSERVICES INDUSTRY ........................ 820
Allscripts Healthcare Solutions, Inc. 821★ athenahealth, Inc. ............................ 822★ Cerner Corp. ..................................... 823
Computer Programs & Sys., Inc. ..... 824
★★★★★★★★★★ Rank 1 (Highest) for Timeliness.★★★★★ Rank 2 (Above Average).
In three parts: Part 1 is the Summary & Index. Part 2 is Selection & Opinion. This is Part 3, Ratings & Reports. Volume LXXI, No. 17
Published weekly by VALUE LINE PUBLISHING LLC, 485 Lexington Avenue, New York, NY 10017-2630
ESPECIALLY NOTEWORTHY:
ISSUE 4Pages 700-850
File in the binder in order ofissue number, removing
previous issue bearingthe same number.
December 11, 2015www.valueline.com
IMS Health Holdings, Inc. ............... 825MedAssets, Inc. ................................ 826Quality Systems, Inc. ....................... 827WebMD Health Corp. ....................... 828
BIOTECHNOLOGY INDUSTRY ........ 829Alnylam Pharmaceuticals, Inc. ....... 830
★ Amgen Inc. ........................................ 831Bio-Techne Corp. .............................. 832BioMarin Pharmaceutical Inc. ........ 833
★ Incyte Corporation ........................... 834Intercept Pharmaceuticals ............... 835Isis Pharmaceuticals, Inc. ................ 836Jazz Pharmaceuticals PLC .............. 837Medivation, Inc. ................................ 838
★ Myriad Genetics ............................... 839QIAGEN N.V. .................................... 840
★★ Regeneron Pharmaceuticals, Inc. .... 841Seattle Genetics, Inc. ....................... 842Senomyx, Inc. ................................... 843United Therapeutics Corp. .............. 844Vertex Pharmaceuticals Inc. ............ 845XenoPort, Inc. ................................... 846
SUPPLEMENTARY REPORTS .......... 850
MedAssets has announced its inten-tion to be acquired by Pamplona Capi-tal Management. Read our view on theproposed marriage on page 826.
Meantime, Chubb’s merger with ACELimited appears on schedule. Readour take on this pending union on pages763 and 755, respectively.
athenahealth (page 822) is seekingexpansion opportunities. We like thetimely shares for both the short and thelong term.
HEICO is positioned to benefit from itsresearch and acquisition programs,which should propel earnings sharplyhigher in both the year ahead and thepull to 2018-2020. Page 713.
B/E Aerospace (page 705) has a hugeand expanding backlog and ought tobenefit from healthy fundamentals inthe airline industry going forward.
VCA should benefit from its dominantposition in the animal healthcare in-dustry. Page 819.

3 How to Read a Value Line Report
II: PLANNING AN INVESTMENT STRATEGY
When planning an investment strategy, it is important to consider a large number of factors, including such things as your age, current financial situation, and risk tolerance. Of course, there are many other factors to think about, but the point is that you should not simply sit down and start picking securities.
We have created a guide called Planning an Investment Strategy that you may wish to read before taking any port-folio action. As a quick summary, you should diversify your portfolio across both asset classes (e.g., stocks, bonds, and foreign securities) and within asset classes (i.e., owning a variety of stocks and bonds).
In addition, you do not have to handle every portion of your portfolio. Instead, you might hire someone else to handle the components that you do not have the desire or experience to oversee. An example of this would be to buy a diversified fixed-income mutual fund for the bond portion of your portfolio, while maintaining a collection of stocks yourself. The right mix of “outsourcing” and personal direction is an individual decision, but in the end you should create a portfolio that offers good returns at a level of risk you can tolerate.
Again, we encourage you to take the time to read through the Planning an Investment Strategy guide so that you can start your portfolio on a solid foundation.
III: CREATING A LIST OF STOCKS FOR FURTHER RESEARCH
Once you have decided on your portfolio approach, you will need to select securities. There are many ways to use The Value Line Investment Survey to find the equities that are most appropriate for your needs.
There are approximately 1,700 stocks in our coverage universe, so opening the first issue and starting to examine each stock report in search of the few you want to own would be a time consuming and, frankly, nearly impossible task. To assist our readers in creating “short lists” of stocks for further consideration, we included a number of stock screens in the back of each Summary & Index.
The screens are updated weekly and cover a broad range of investment options, including Timely Stocks in Timely Industries, Conservative Stocks, Highest Yielding Stocks, and Stocks with Highest 3- to 5-Year Appreciation Poten-tial. A description of the screens is provided if the title of a screen is not self-explanatory. There are, of course, many more screens than the ones listed here, so you should take a look at the pages in the back of the Summary & Index to get a feel for which ones will best fit your specific needs. Regardless of which screens you choose to use, this approach will provide you with a short list of companies to research.
For those who want more advice than a static screen, we have also created four model portfolios: Portfolio I (Stocks with Above-Average Year-Ahead Price Potential), Portfolio II (Stocks for Income and Potential Price Appreciation), Portfolio III (Stocks with Long-Term Price Growth Poten-tial), and Portfolio IV (Stocks with Above-Average Dividend Yields). These portfolios are overseen by Value Line analysts and are updated weekly in the Selection & Opinion section. Periodically, a more in-depth review is provided detailing the most recent performance of each portfolio. A fifth model portfolio (The Value Line $5–$15 Portfolio) is also provided via weekly email. These portfolios offer another convenient starting point for selecting stocks for inclusion in your own portfolio.
On an ongoing basis, we also provide stock screens and Stock Highlights in the Selection & Opinion section. The screens go beyond those included on a weekly basis in the Summary & Index and often provide a different and unique view of an investment approach. The Stock Highlights are a more in-depth review of a company that we believe merits a second look. Although these two options may not be the best starting point for you, they can play an important role in providing new and interesting investment ideas down the road.
IV: RESEARCHING A STOCK USING THE VALUE LINE PAGE
A sample Value Line report is included at the back of this guide. The numbers below reference back to the sample page.
To start studying a stock, we suggest that you concentrate on various features found on every company page of Rat-ings & Reports. Begin by using the Timeliness™, Safety™
4 How to Read a Value Line Report
and Technical ranks that appear in the upper left corner of each page (1). Next, look at the analyst’s commentary in the bottom half of each report (13). Then look at our various forecasts for financial data. Estimated financial data is shown on the right side (bold italic print) of the Statisti-cal Array (12). Growth rates are in the Annual Rates box (17). A stock’s Target Price Range is on the right-hand side of the graph (10), and 3- to 5-year stock price Projections are in the projections box (19). Finally, go to the historical financial data appearing in the left side of the Statistical Array (18). Illustrations and more detail follow.
Value Line Ranks
(see (1) on the sample page)
Timeliness
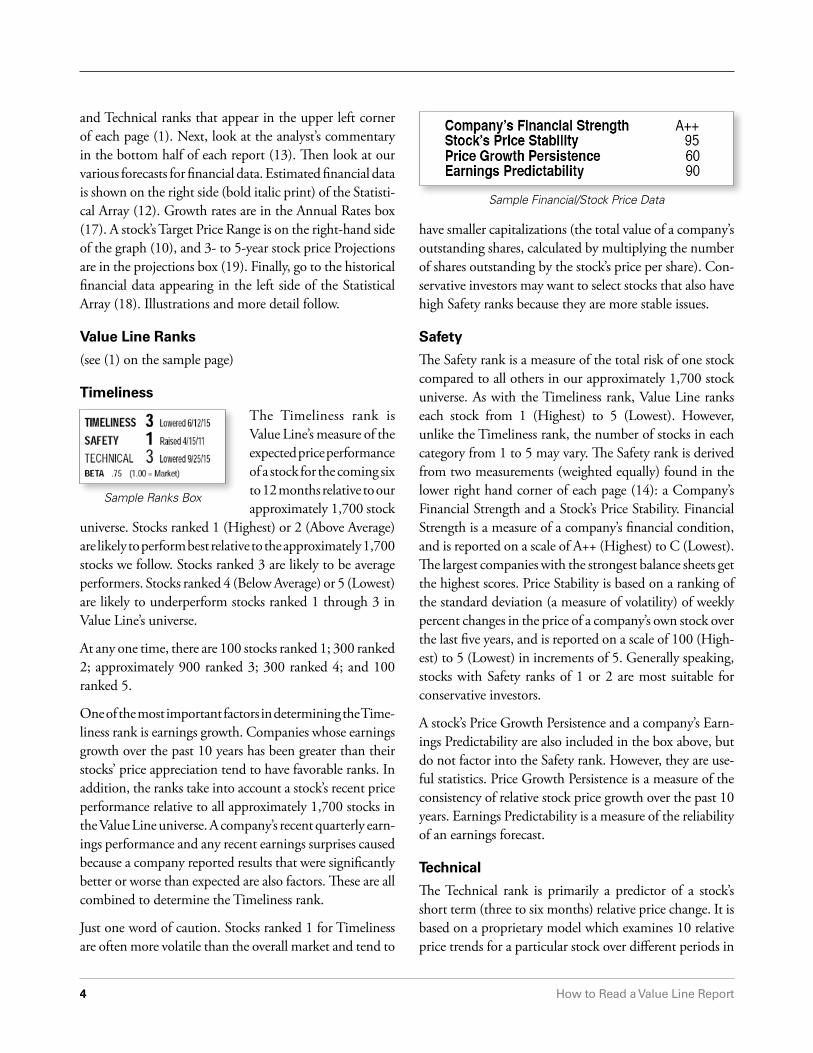
The Timeliness rank is Value Line’s measure of the expected price performance of a stock for the coming six to 12 months relative to our approximately 1,700 stock
universe. Stocks ranked 1 (Highest) or 2 (Above Average) are likely to perform best relative to the approximately 1,700 stocks we follow. Stocks ranked 3 are likely to be average performers. Stocks ranked 4 (Below Average) or 5 (Lowest) are likely to underperform stocks ranked 1 through 3 in Value Line’s universe.
At any one time, there are 100 stocks ranked 1; 300 ranked 2; approximately 900 ranked 3; 300 ranked 4; and 100 ranked 5.
One of the most important factors in determining the Time-liness rank is earnings growth. Companies whose earnings growth over the past 10 years has been greater than their stocks’ price appreciation tend to have favorable ranks. In addition, the ranks take into account a stock’s recent price performance relative to all approximately 1,700 stocks in the Value Line universe. A company’s recent quarterly earn-ings performance and any recent earnings surprises caused because a company reported results that were significantly better or worse than expected are also factors. These are all combined to determine the Timeliness rank.
Just one word of caution. Stocks ranked 1 for Timeliness are often more volatile than the overall market and tend to
have smaller capitalizations (the total value of a company’s outstanding shares, calculated by multiplying the number of shares outstanding by the stock’s price per share). Con-servative investors may want to select stocks that also have high Safety ranks because they are more stable issues.
Safety
The Safety rank is a measure of the total risk of one stock compared to all others in our approximately 1,700 stock universe. As with the Timeliness rank, Value Line ranks each stock from 1 (Highest) to 5 (Lowest). However, unlike the Timeliness rank, the number of stocks in each category from 1 to 5 may vary. The Safety rank is derived from two measurements (weighted equally) found in the lower right hand corner of each page (14): a Company’s Financial Strength and a Stock’s Price Stability. Financial Strength is a measure of a company’s financial condition, and is reported on a scale of A++ (Highest) to C (Lowest). The largest companies with the strongest balance sheets get the highest scores. Price Stability is based on a ranking of the standard deviation (a measure of volatility) of weekly percent changes in the price of a company’s own stock over the last five years, and is reported on a scale of 100 (High-est) to 5 (Lowest) in increments of 5. Generally speaking, stocks with Safety ranks of 1 or 2 are most suitable for conservative investors.
A stock’s Price Growth Persistence and a company’s Earn-ings Predictability are also included in the box above, but do not factor into the Safety rank. However, they are use-ful statistics. Price Growth Persistence is a measure of the consistency of relative stock price growth over the past 10 years. Earnings Predictability is a measure of the reliability of an earnings forecast.
Technical
The Technical rank is primarily a predictor of a stock’s short term (three to six months) relative price change. It is based on a proprietary model which examines 10 relative price trends for a particular stock over different periods in
Sample Ranks Box
Sample Financial/Stock Price Data
5 How to Read a Value Line Report
the past year. It also takes into account the price volatil-ity of each stock. The Technical ranks also range from 1 (Highest) to 5 (Lowest). At any one time, about 100 stocks are ranked 1; 300 ranked 2; 900 ranked 3; 300 ranked 4; and 100 ranked 5.
Beta
Beta is a measure of the volatility of a stock relative to the overall stock market and is calculated by Value Line. A Beta of 1.00 suggests that a stock will move up and down in roughly lock-step with the market, so that a 3% increase or fall in the broader market would likely be accompanied by a similar percentage move in the stock. A Beta higher than 1.00 means a stock tends to move more than the market, while a Beta lower than 1.00 suggest that the stock in question will move in a muted relationship to a move in the market.
Industry Timeliness
Value Line also publishes Industry ranks which show the Timeliness of each industry. The Industry ranks indicate how Value Line believes the prices of stocks within 90 or more industries will perform relative to each other. These ranks are updated weekly and published on the front cover and on page 24 of the Summary & Index. They also appear at the top of each Industry Report in Ratings & Reports. The Industry rank is calculated by averaging the Timeliness ranks of each of the stocks assigned a Timeliness rank in a particular industry.
Analyst’s Commentary
(see 13 on the sample page)
Next, look at the analyst’s written commentary in the lower half of the page. Many readers think this is the most important section of the page. In the commentary, the analyst discusses his/her expectations for the future. There are times when the raw numbers don’t tell the full story. The analyst uses the commentary to explain why the forecast is what it is. The commentary is also particularly useful when a change in trend is occurring or about to occur. As an example, a stock may have a poor Timeliness rank but the analyst thinks earnings could turn around in the future. In this case, the analyst may use the commentary to explain why he/she thinks conditions are likely to get better, thus giving the subscriber insight into what is happening and why.
Value Line Financial Data
(see 12 and 18 on the sample page)
In the Statistical Array in the center of the report (where most of the numbers are), Value Line provides both histori-cal data and financial projections.
Financial Estimates
(see 12 and 16 on the sample page)
The estimates of sales, earnings, net profit margins, income tax rates, and so forth are all derived from spreadsheets maintained on every company and printed in bold ital-ics. The numbers are based on an analyst’s latest thinking about where a company may be in the future. Our analysts regularly review their projections and discuss them with a company’s management. Afterwards, they make whatever adjustments they believe are warranted.
Historical Financial Data
(see 18 on the sample page)
Many investors like to use the Statistical Array to do their own analysis. They, in particular, use the historical data in the center of each report to see how a company has been doing over a long time frame. It‘s worth pointing out that while all of the data are important, different readers find different data items to be most useful.
The numbers are probably most helpful in identifying trends. For example, look at sales per share to see if they have been rising for an extended period of time. Look at operating margins and net profit margins to see if they have
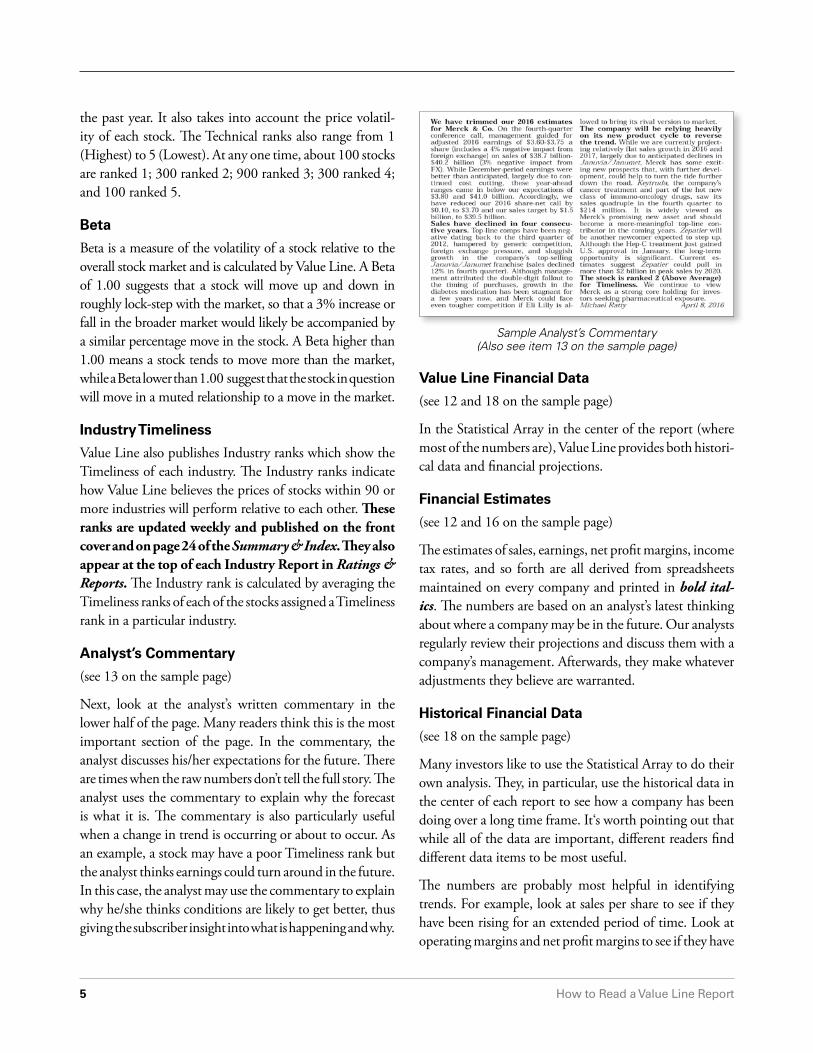
Sample Analyst’s Commentary (Also see item 13 on the sample page)

6 How to Read a Value Line Report
been expanding, narrowing or staying flat. Also check the percentages near the bottom to see if the Return on Total Capital or the Return on Shareholders’ Equity have been rising, falling or remaining about the same.
Annual Rates Of Change
(see 17 on the sample page)
At this point, it may be helpful to look at the Annual Rates box in the left-hand column. This box shows the compound annual growth percentages for sales, cash flow, and other items for the past 5 and 10 years and also Value Line’s projections of growth for each item for the coming 3 to 5 years. Trends are also important here. Check whether
growth has been increasing or slowing to see if Value Line’s analyst thinks it will pick up or fall off in the future. (Specific estimates for various data items for three to five years in the future can be found in bold italicized type in the far right hand column of the Statistical Array.)
Target Price Range and 3- to 5-year Projections
(see 10 and 19 on the sample page)
In the upper right-hand section of each report is a Target Price Range for each stock. This is the range in which the price is likely to fall during the period 3 to 5 years hence.
The range is based on the analyst’s projections, in the period three to five years out, for earnings per share multiplied by the estimated price/earnings ratio in the Statistical Array for the same period. The width of the high-low range depends on the stock’s Safety rank. A stock with a high Safety rank has a narrower range, one with a low rank, a wider one.
In the left hand column of each report, there is also a box which contains 3- to 5-year Projections for a stock price. There you can see the potential high and low average prices we forecast, the % price changes we project, and the expected compound annual total returns (price appreciation plus dividends). To make these calculations, analysts compare the expected prices for the next three to five years (as shown in the Target Price Range and Projections box) with the recent price shown at the top of the report.
Investors whose primary goal is long-term price apprecia-tion should study the 3- to 5-year projections carefully and choose stocks with above-average appreciation potential. For comparative purposes, you can find the Estimated Median Price Appreciation Potential for all approximately 1,700 stocks on the front page of the Summary & Index.Sample Rates Box
Sample Target Price RangeSample Statistical Array

7 How to Read a Value Line Report
V: EXAMINING A VALUE LINE PAGE IN MORE DETAIL
In the following section, we are going to examine an actual Value Line page, with the objectives of interpreting the array of statistical data presented and weighing the data and the accompanying comment against your needs. We have chosen for examination a report on Merck, a large and well-known manufacturer of health care products and member of the Dow Jones Industrial Average.
Putting Data in Perspective
Looking at the top of the page, we can see that Merck’s stock price in April 2016 was $53.32 a share (item 5 on the sample page). By itself, the stock price means very little. In the line below the price, annual high and low prices for each year from 2003 through 2016 are indicated. Below the high and low annual prices is a price chart (graph) that shows monthly price ranges for essentially the same period, along with other useful information that we will discuss below. We note here, though, that while Merck stock has declined of late, it is still significantly higher than its 2009 low.
At the current quotation, is the stock undervalued or overvalued? The fact that the “cash flow” line is slightly above the price of the stock indicates that it appears to be undervalued.
Price-Earnings Ratio — This is probably the most widely used measure of stock valuation. Value Line shows a variety of P/E ratios on every company page, as discussed below:
The P/E ratio on the very top of the Value Line page (item 6 on the sample page). This is calculated by dividing the recent price of the stock by the total of the last three months of earnings and the next nine months of estimated earnings.
The Relative P/E ratio (item 8). This compares the P/E of one stock with the median of estimated P/E ratios of all stocks under Value Line review. A relative P/E of more than 1 indicates that a stock’s P/E ratio is currently higher than that of the Value Line universe; a P/E of less than 1 indicates that this stock’s P/E is less than the Value Line average.
The Trailing P/E ratio (item 7). This is calculated by divid-ing the recent price of the stock by the past 12 months of actual (reported) earnings. This is the figure shown in most newspapers and on financial web sites.
The Median P/E ratio (item 7). This is the average annual P/E ratio of a stock over the past 10 years, with certain statistical adjustments made for unusually low or high ratios.
The Average Annual P/E ratio (items 12 and 18). This figure is calculated by dividing the average price for each year by the actual reported earnings for the same year and is shown in the Statistical Array.
The Relative (Annual) P/E ratio (items 12 and 18). This figure is calculated by dividing the Average Annual P/E of a stock with the Average Annual P/E of all stocks under Value Line review in the same year.
To gauge the significance of the recent price of a stock, the reader must look at the price in relation to a variety of data. As far as P/Es are concerned, the current P/E ratio and relative P/E ratio for Merck’s stock, are below those of most stocks in the Value Line universe. In addition, we expect Merck to continue to trade at a valuation that is below the market average.
Low P/E ratios may mean that the stock is underpriced, unless there are factors indicating that there will be a sig-nificant decline in the company’s fundamentals. Is this the case with Merck? Probably not, since management has been very vigilant in its efforts to maximize returns from its busi-nesses, and the Value Line analyst is expecting continued profit growth over the three to five years subsequent to 2016. Merck’s relative P/E ratio of 0.78 (item 8), a lower valuation than found in the average stock followed by Value Line, likely reflects the fact that the company’s upward earnings trend over the past 15 years has recently moderated.
The Dividend Yield (item 9 in the right top corner of the sample page) shows the expected return from cash dividends on the stock over the next 12 months, as a percentage of the recent price. Merck’s yield of 3.5% is above the median of all dividend-paying stocks in the Value Line universe. (The median is shown each week on the cover of the Sum-mary & Index section.) We also see that the company has increased the dividend over the past few years, as shown in line four of the Statistical Array in the center of our report, and Value Line’s analyst thinks additional increases are forthcoming. Many investors view regular increases in a dividend very positively.
8 How to Read a Value Line Report
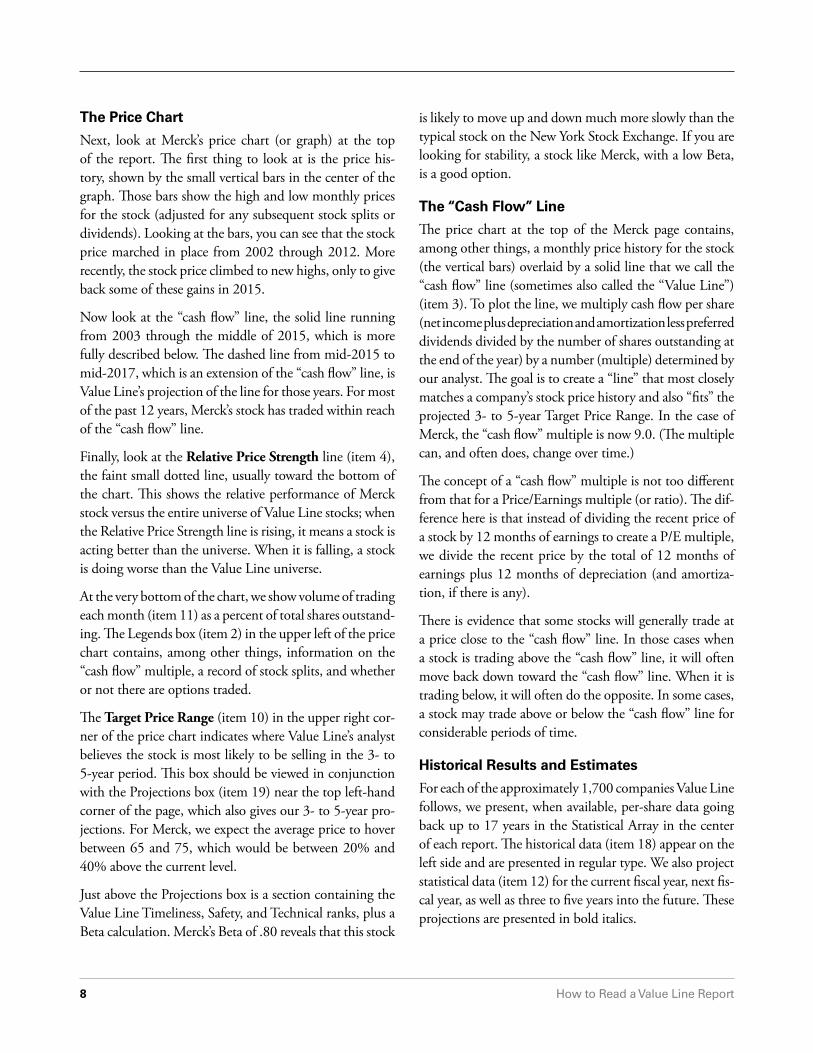
The Price Chart
Next, look at Merck’s price chart (or graph) at the top of the report. The first thing to look at is the price his-tory, shown by the small vertical bars in the center of the graph. Those bars show the high and low monthly prices for the stock (adjusted for any subsequent stock splits or dividends). Looking at the bars, you can see that the stock price marched in place from 2002 through 2012. More recently, the stock price climbed to new highs, only to give back some of these gains in 2015.
Now look at the “cash flow” line, the solid line running from 2003 through the middle of 2015, which is more fully described below. The dashed line from mid-2015 to mid-2017, which is an extension of the “cash flow” line, is Value Line’s projection of the line for those years. For most of the past 12 years, Merck’s stock has traded within reach of the “cash flow” line.
Finally, look at the Relative Price Strength line (item 4), the faint small dotted line, usually toward the bottom of the chart. This shows the relative performance of Merck stock versus the entire universe of Value Line stocks; when the Relative Price Strength line is rising, it means a stock is acting better than the universe. When it is falling, a stock is doing worse than the Value Line universe.
At the very bottom of the chart, we show volume of trading each month (item 11) as a percent of total shares outstand-ing. The Legends box (item 2) in the upper left of the price chart contains, among other things, information on the “cash flow” multiple, a record of stock splits, and whether or not there are options traded.
The Target Price Range (item 10) in the upper right cor-ner of the price chart indicates where Value Line’s analyst believes the stock is most likely to be selling in the 3- to 5-year period. This box should be viewed in conjunction with the Projections box (item 19) near the top left-hand corner of the page, which also gives our 3- to 5-year pro-jections. For Merck, we expect the average price to hover between 65 and 75, which would be between 20% and 40% above the current level.
Just above the Projections box is a section containing the Value Line Timeliness, Safety, and Technical ranks, plus a Beta calculation. Merck’s Beta of .80 reveals that this stock
is likely to move up and down much more slowly than the typical stock on the New York Stock Exchange. If you are looking for stability, a stock like Merck, with a low Beta, is a good option.
The ‘‘Cash Flow’’ Line
The price chart at the top of the Merck page contains, among other things, a monthly price history for the stock (the vertical bars) overlaid by a solid line that we call the “cash flow” line (sometimes also called the “Value Line”)(item 3). To plot the line, we multiply cash flow per share (net income plus depreciation and amortization less preferred dividends divided by the number of shares outstanding at the end of the year) by a number (multiple) determined by our analyst. The goal is to create a “line” that most closely matches a company’s stock price history and also “fits” the projected 3- to 5-year Target Price Range. In the case of Merck, the “cash flow” multiple is now 9.0. (The multiple can, and often does, change over time.)
The concept of a “cash flow” multiple is not too different from that for a Price/Earnings multiple (or ratio). The dif-ference here is that instead of dividing the recent price of a stock by 12 months of earnings to create a P/E multiple, we divide the recent price by the total of 12 months of earnings plus 12 months of depreciation (and amortiza-tion, if there is any).
There is evidence that some stocks will generally trade at a price close to the “cash flow” line. In those cases when a stock is trading above the “cash flow” line, it will often move back down toward the “cash flow” line. When it is trading below, it will often do the opposite. In some cases, a stock may trade above or below the “cash flow” line for considerable periods of time.
Historical Results and Estimates
For each of the approximately 1,700 companies Value Line follows, we present, when available, per-share data going back up to 17 years in the Statistical Array in the center of each report. The historical data (item 18) appear on the left side and are presented in regular type. We also project statistical data (item 12) for the current fiscal year, next fis-cal year, as well as three to five years into the future. These projections are presented in bold italics.

9 How to Read a Value Line Report
Now look at a list of items in the Statistical Array (items 12 and 18).
Sales per share, in the top line, is an important series. When earnings per share are depressed because of poor net profit margins, a high level of sales per share can suggest the potential for an earnings recovery. It would be disconcert-ing, however, if sales per share declined in tandem with earnings per share.
‘‘Cash flow’’ per share (second line), as commonly used by analysts, is the sum of reported earnings plus depreciation, less any preferred dividends, calculated on a per-share basis. It is an indicator of a company’s internal cash-generating ability—the amount of cash it earns to expand or replace plant and equipment, to provide working capital, to pay dividends, or to repurchase stock. Merck’s ‘‘cash flow’’ per share has almost doubled since 2000.
Earnings per share (third line) are shown by Value Line as they were reported to stockholders, excluding nonrecur-ring items and adjusted for any subsequent stock splits or stock dividends. According to current accounting guide-lines, companies now report earnings two ways. The first is basic earnings per share, which is the earnings available to common shareholders divided by the weighted average number of shares outstanding for the period. The second is diluted earnings per share, which reflects the potential dilution that could occur if securities or other contracts to issue common stock (like options and warrants) were exer-cised or converted into common stock. Value Line shows only one earnings figure in our statistical presentation; that figure is clearly identified in the footnotes (item 15), and it is almost always the diluted earnings figure.
For Merck, earnings per share have been inconsistent be-tween 2000 and 2016. As indicated in footnote (B) (item 20) near the bottom edge of the report page, its earnings per share are now based on diluted shares outstanding.
Dividends Declared per share (fourth line) are usually the highest, in proportion to earnings, at older and larger companies, which tend to have slower-than-average growth. Directors of growth-oriented companies more often than not prefer to pay small or “token” dividends, or none at all, so they can reinvest earnings in the business. Merck has paid
out between 40% and 50% of its earnings in dividends and invested the remainder in the business during the past five years and the percentage is likely to be about 46% over the next few years. A payout of 25%-30% is generally typical of larger capitalization stocks followed by Value Line.
Capital Spending per share (fifth line) is the amount that a company spends on new plants and equipment. It doesn’t include funds used for acquisitions of other companies.
Book Value per share (sixth line) is common shareholders’ equity determined on a per-share basis. It includes both tangible assets, like plant and receivables and inventories, as well as intangibles, like the value of patents or brand names, known as ‘‘goodwill.’’ Any significant intangibles will normally be indicated in a footnote. If all assets could be liquidated at the value stated on the company’s books, all liabilities such as accounts payable, taxes, and long-term debt paid, and all preferred stockholders compensated, the book value is what would be left for the common stockholders.
The number of Common Shares Outstanding (seventh line) is also listed in the Statistical Array. Sometimes net income rises, but earnings per share do not, because the number of shares outstanding has increased. This may happen because a company is issuing stock to pay for ac-quisitions or to fund internal growth. As a result, sales and profits may soar, while per-share sales and earnings lag. On the other hand, when cash-rich companies buy their own shares, earnings per share can rise even if net income is stable.
The Average Annual P/E Ratio (eighth line) shows what multiple of earnings investors have been willing to pay for a stock in the past and the P/E ratio the analyst expects out 3 to 5 years. Merck’s average annual P/E was at unusually high levels between 2000 and 2002 when drug and medi-cal stocks were in favor; it has narrowed considerably over the past 13 years.
The Relative P/E Ratio (ninth line) shows how the stock’s price-earnings ratio relates to those of all stocks in the Value Line universe. Merck’s relative P/E of 0.78 in April 2016 was below that of the typical stock. The Value Line analyst thinks it will continue to be below average in the 2019–2021 period.

10 How to Read a Value Line Report
The Average Annual Dividend Yield (10th line) is of special interest to conservative investors, many of whom are more concerned with income than with a stock’s appreciation potential. Income-oriented investors should look for stocks with yields that are higher than the average shown each week in the center box of the front cover of the Summary & Index, but they should also look at the trend of dividends over time. Merck’s dividend has been increased in each of the past few years, and the analyst thinks it will continue to rise. Steady increases are very attractive for many investors. Investors should also look carefully at a company’s Financial Strength to make certain that the company will be able to continue to pay the dividend. A good rule of thumb for conservative investors is to invest only in companies with Financial Strength ratings of at least B+, which is average.
Company Financial Data
The Sales figure (11th line) is the most common measure given when referring to a company’s size. Merck’s sales in 2015 were almost 2.0 times the amount recorded in 2006, a very strong performance.
The Operating Margin (12th line) indicates what per-centage of sales is being converted into operating income. (Operating income is total sales minus the cost of goods sold and selling, general and administrative expenses. It is also referred to as EBITDA, or earnings before interest, taxes, depreciation, and amortization.) At Merck, this figure peaked in 2008, but it appears poised to regain ground in 2016 and beyond.
Depreciation (13th line) shows the amount charged against operating profits to reflect the aging of a company’s plant and equipment.
Net Profit (14th line) is the amount the company earned after all expenses including taxes, but excluding nonrecurring gains or losses and the results of discontinued operations. Usually, the higher the net, the higher the per-share earn-ings. Merck’s net profit has grown considerably since 2006.
Merck’s Income Tax Rate (15th line) has steadily declined from 29.9% in 2006 and the Value Line analyst thinks it will be 25.0% in the foreseeable future. Income tax rates will normally remain steady unless the federal tax rate changes in the U.S. or unless a company increases
or decreases the percentage of business it does overseas, where tax rates are different.
Net Profit Margin (16th line) shows net income after taxes as a percentage of sales (or revenues). Here, the trend is the most important thing, with rising margins usually being favorable. It is often worthwhile to compare the net margin with the operating margin. Usually the two series move together, though not always. Depreciation charges, interest expense, income taxes, and other costs are deducted from (and other income added to) operating income in the determination of net profit. Where there is a disparity in the trends of the net and operating margins, it may be worth taking a second look. (If depreciation, interest charges, or tax rates move sharply in any direction, there will be an impact on net profits, and it would be worthwhile to try to determine why the change occurred.)
We expect that Merck’s net profit margin will increase nicely over the next
Working Capital (17th line), the company’s current assets less current liabilities, indicate the liquid assets available for running the business on a day-to-day basis. The higher a company’s sales, the more working capital it typically has and needs. But we caution that a number of large compa-nies with steady revenue streams no longer believe large amounts of working capital are necessary. In those cases, a negative working capital may be perfectly acceptable because a company can meet normal operating expenses from consistent cash receipts.
Long-term Debt (18th line) is the total debt due more than one year in the future. In the case of Merck, the amount is quite low relative to shareholders’ equity.
Shareholders’ Equity (19th line), also known as net worth, is the total stockholders’ interest (preferred and common) in the company after all liabilities have been deducted from the company’s total assets. All intangible assets such as goodwill, patents, and, sometimes, deferred charges are included in shareholders’ equity. Merck’s equity has grown appreciably over the years, primarily from retained earnings.
Return on Total Capital (20th line) measures the percentage a company earns on its shareholders’ equity and long-term debt obligations. When a company’s return on total capital

11 How to Read a Value Line Report
goes up, there should also be an increase in the return on shareholders’ equity (see below). If not, it simply means that the company is borrowing more and paying interest, but not earning more for the stockholders on their equity in the company’s assets. Unless a company can earn more than the interest cost of its debt over time, the risk of bor-rowing is not worthwhile.
Return on Shareholders’ Equity (21st line) reveals how much has been earned (in percentage terms) every year for the stockholders (common and preferred). Higher figures are usually desirable, often indicating greater productivity and efficiency. Merck’s percent earned on net worth reached a peak in 2008 and has since stabilized around 22.0%.
Trends in both this ratio and the return on total capital—two key gauges of corporate performance—say a great deal about the skill of management.
Retained to Common Equity (22nd line) also known as the ‘‘plowback ratio,’’ is net income less all dividends (common and preferred), divided by common shareholders’ equity and is expressed as a percentage. It measures the extent to which a company has internally generated resources to invest for future growth. A high plowback ratio and rapidly growing book value are positive investment characteristics.
All Dividends to Net Profit, or ‘‘payout ratio,’’ (23rd line) measures the proportion of a company’s profits that is dis-tributed as dividends to all shareholders—both common and preferred. Young, fast-growing firms reinvest most of their profits internally. Mature firms are better able to pay out a large share of earnings. Merck paid out 50% of its profits in the form of cash dividends in 2015. By way of comparison, the typical large company in the Value Line universe usually pays out about 25%-30% of its profits in dividends.

12 How to Read a Value Line Report
12896806448403224
1612
Percentsharestraded
18126
Target Price Range2019 2020 2021
MERCK & CO. NYSE-MRK 53.32 14.5 14.812.0 0.78 3.5%
TIMELINESS 2 Raised 2/26/16
SAFETY 1 Raised 4/15/11
TECHNICAL 4 Lowered 1/15/16BETA .80 (1.00 = Market)
2019-21 PROJECTIONSAnnʼl Total
Price Gain ReturnHigh 75 (+40%) 12%Low 65 (+20%) 8%Insider Decisions
M J J A S O N D Jto Buy 0 0 0 0 0 0 0 0 0Options 2 0 1 0 0 3 1 0 0to Sell 3 0 1 0 0 3 1 0 0Institutional Decisions
2Q2015 3Q2015 4Q2015to Buy 773 790 833to Sell 753 722 711Hldʼs(000)210403220853782040122
High: 35.4 46.4 61.6 61.2 38.4 41.6 37.9 48.0 50.4 62.2 63.6 53.6Low: 25.5 31.8 42.3 22.8 20.0 30.7 29.5 36.9 40.8 49.3 45.7 48.0
% TOT. RETURN 2/16THIS VL ARITH.*
STOCK INDEX1 yr. -11.4 -13.53 yr. 29.8 22.65 yr. 85.8 38.5
CAPITAL STRUCTURE as of 12/31/15Total Debt $26514 mill. Due in 5 Yrs $6544 mill.LT Debt $23929 mill. LT Interest $650 mill.
(35% of Capʼl)
Pension Assets-12/15 $16.5 bill. Oblig. $17.5 bill.
Pfd Stock None
Common Stock 2,775,258,591 shs.as of 1/31/16
MARKET CAP: $148 billion (Large Cap)CURRENT POSITION 2013 2014 12/31/15
($MILL.)Cash Assets 17486 15719 13427Receivables 7184 6626 6484Inventory (LIFO) 6226 5571 4700Other 4789 5257 5153Current Assets 35685 33173 29764Accts Payable 2274 2625 2533Debt Due 4521 2704 2585Other 11073 13437 14085Current Liab. 17868 18766 19203ANNUAL RATES Past Past Estʼd ʼ13-ʼ15of change (per sh) 10 Yrs. 5 Yrs. to ʼ19-ʼ21Sales 3.5% 4.5% 2.5%ʻʻCash Flowʼʼ 6.0% 5.5% 3.5%Earnings 2.5% .5% 6.0%Dividends 1.5% 3.0% 2.0%Book Value 8.0% 2.0% 1.0%
Cal- Fullendar Year
QUARTERLY SALES ($ mill.)Mar.31 Jun.30 Sep.30 Dec.31
2013 10671 11010 11032 11320 440332014 10264 10934 10557 10482 422372015 9425 9785 10073 10215 394982016 9400 9600 10100 10400 395002017 9500 9600 10100 10300 39500Cal- Full
endar YearEARNINGS PER SHARE A
Mar.31 Jun.30 Sep.30 Dec.312013 .85 .84 .92 .88 3.492014 .88 .85 .90 .87 3.492015 .85 .86 .96 .93 3.592016 .86 .89 1.00 .95 3.702017 .88 .92 1.02 .98 3.80Cal- Full
endar YearQUARTERLY DIVIDENDS PAID B■
Mar.31 Jun.30 Sep.30 Dec.312012 .42 .42 .42 .42 1.682013 .43 .43 .43 .43 1.722014 .44 .44 .44 .44 1.762015 .45 .45 .45 .45 1.802016 .46
2000 2001 2002 2003 2004 2005 2006 2007 2008 2009 2010 2011 2012 201317.49 20.99 23.07 10.12 10.39 10.09 10.44 11.14 11.32 8.82 14.92 15.80 15.62 15.04
3.51 3.85 3.85 3.56 3.29 3.34 3.59 2.42 4.48 3.21 5.87 6.29 6.19 5.952.90 3.14 3.14 2.92 2.61 2.53 2.52 1.49 3.64 3.25 3.42 3.77 3.82 3.491.21 1.37 1.41 1.45 1.49 1.52 1.52 1.52 1.52 1.52 1.52 1.52 1.68 1.721.18 1.20 1.06 .86 .78 .64 .45 .47 .62 .47 .54 .57 .65 .536.43 7.06 8.11 7.01 7.83 8.21 8.10 8.37 8.90 19.00 17.64 17.93 17.52 17.00
2307.6 2272.7 2245.0 2221.8 2208.6 2181.9 2167.8 2172.5 2107.7 3108.2 3082.1 3040.8 3026.6 2927.525.6 22.7 17.3 18.2 16.2 12.1 15.2 34.1 10.2 9.1 10.5 9.1 10.8 13.31.66 1.16 .94 1.04 .86 .64 .82 1.81 .61 .61 .67 .57 .69 .75
1.6% 1.9% 2.6% 2.7% 3.5% 5.0% 4.0% 3.0% 4.1% 5.1% 4.2% 4.4% 4.1% 3.7%22636 24198 23850 27428 45987 48047 47267 4403332.9% 31.4% 48.5% 24.1% 23.3% 32.4% 32.9% 31.6%2268.4 1988.0 1631.2 2576.0 7381.0 7427.0 6978.0 6988.05513.0 3275.4 7808.4 7409.3 10715 11697 11743 1044329.9% 2.8% 20.4% 20.0% 20.0% 23.4% 23.8% 21.7%24.4% 13.5% 32.7% 27.0% 23.3% 24.3% 24.8% 23.7%2507.5 2787.2 4986.2 12678 13423 16936 16509 178175551.0 3915.8 3943.3 16075 15482 15525 16254 2053917560 18185 18758 59058 54376 54517 53020 4976524.5% 15.5% 34.8% 10.1% 15.8% 17.2% 17.4% 15.4%31.4% 18.0% 41.6% 12.5% 19.7% 21.5% 22.1% 21.0%12.5% NMF 24.1% 7.1% 11.0% 12.9% 12.5% 10.6%
60% 101% 42% 43% 44% 40% 44% 49%
2014 2015 2016 2017 © VALUE LINE PUB. LLC 19-2114.88 14.20 14.45 14.65 Sales per sh 17.00
5.98 5.96 5.90 6.00 ʻʻCash Flowʼʼ per sh 7.253.49 3.59 3.70 3.80 Earnings per sh A 5.001.76 1.80 1.84 1.88 Divʼds Declʼd per sh B■ 2.00.46 .46 .45 .45 Capʼl Spending per sh .50
17.14 16.06 14.65 14.05 Book Value per sh 17.752838.1 2781.1 2730.0 2700.0 Common Shs Outstʼg C 2650.0
16.4 15.8 Bold figures areValue Lineestimates
Avg Annʼl P/E Ratio 14.0.86 .80 Relative P/E Ratio .90
3.1% 3.2% Avg Annʼl Divʼd Yield 2.9%42237 39498 39500 39500 Sales ($mill) 4500032.4% 33.9% 34.5% 35.0% Operating Margin 38.0%6691.0 6375.0 6000 6000 Depreciation ($mill) 600010271 10195 10100 10260 Net Profit ($mill) 1325024.3% 21.7% 25.0% 25.0% Income Tax Rate 25.0%24.3% 25.8% 25.6% 26.0% Net Profit Margin 29.4%14407 10561 9000 8000 Working Capʼl ($mill) 1000018699 23929 23000 21000 Long-Term Debt ($mill) 1700048647 44676 40000 38000 Shr. Equity ($mill) 4700015.8% 15.3% 16.5% 18.0% Return on Total Capʼl 21.0%21.1% 22.8% 25.5% 27.0% Return on Shr. Equity 28.0%10.5% 11.4% 12.5% 13.5% Retained to Com Eq 17.0%
50% 50% 49% 49% All Divʼds to Net Prof 40%
Companyʼs Financial Strength A++Stockʼs Price Stability 95Price Growth Persistence 60Earnings Predictability 95
(A) Diluted earnings (adjusted). Quarters maynot sum due to rounding. Excludes nonrecur-ring gains (losses): ʼ05, (43¢); ʼ06, (13¢); ʼ09,$2.40; ʼ10, ($3.16); ʼ11, ($1.75); ʼ12, ($1.66);
ʼ13, ($2.02); ʼ14, .58¢; ʼ15, ($2.03). Next egs.report due May 5th.(B) Dividends historically paid in early January,April, July, and October. ■ Dividend reinvest-
ment plan available.(C) In millions.
BUSINESS: Merck & Co., Inc. is a global health care company thatdelivers innovative health solutions through its prescription medi-cines, vaccines, biologic therapies, and animal health products,which it markets directly and through joint ventures. Operationscomprised of four segments: Pharmaceutical, Animal Health, Al-liances and Healthcare Services. Top-grossing drugs in 2015:
Januvia (diabetes) and Zetia (cholesterol). Acquired Schering-Plough, 11/09. Has 68,000 employees. BlackRock owns 6.6% ofcommon; Capital World, 5.9%; Wellington, 5.5%; Vanguard, 5.5%;Off/dirs., less than 1% (4/15 proxy). Chrmn/Pres/CEO: KennethFrazier. Inc.: NJ. Addr.: 2000 Galloping Hill Road., Kenilworth, NJ07033. Tel.: 908-740-4000. Internet: www.merck.com.
We have trimmed our 2016 estimatesfor Merck & Co. On the fourth-quarterconference call, management guided foradjusted 2016 earnings of $3.60-$3.75 ashare (includes a 4% negative impact fromforeign exchange) on sales of $38.7 billion-$40.2 billion (3% negative impact fromFX). While December-period earnings werebetter than anticipated, largely due to con-tinued cost cutting, these year-aheadranges came in below our expectations of$3.80 and $41.0 billion. Accordingly, wehave reduced our 2016 share-net call by$0.10, to $3.70 and our sales target by $1.5billion, to $39.5 billion.Sales have declined in four consecu-tive years. Top-line comps have been neg-ative dating back to the third quarter of2012, hampered by generic competition,foreign exchange pressure, and sluggishgrowth in the company’s top-sellingJanuvia/Janumet franchise (sales declined12% in fourth quarter). Although manage-ment attributed the double-digit fallout tothe timing of purchases, growth in thediabetes medication has been stagnant fora few years now, and Merck could faceeven tougher competition if Eli Lilly is al-
lowed to bring its rival version to market.The company will be relying heavilyon its new product cycle to reversethe trend. While we are currently project-ing relatively flat sales growth in 2016 and2017, largely due to anticipated declines inJanuvia/Janumet, Merck has some excit-ing new prospects that, with further devel-opment, could help to turn the tide furtherdown the road. Keytruda, the company’scancer treatment and part of the hot newclass of immuno-oncology drugs, saw itssales quadruple in the fourth quarter to$214 million. It is widely viewed asMerck’s promising new asset and shouldbecome a more-meaningful top-line con-tributor in the coming years. Zepatier willbe another newcomer expected to step up.Although the Hep-C treatment just gainedU.S. approval in January, the long-termopportunity is significant. Current es-timates suggest Zepatier could pull inmore than $2 billion in peak sales by 2020.The stock is ranked 2 (Above Average)for Timeliness. We continue to viewMerck as a strong core holding for inves-tors seeking pharmaceutical exposure.Michael Ratty April 8, 2016
LEGENDS9.0 x ″Cash Flow″ p sh. . . . Relative Price Strength
Options: YesShaded area indicates recession
© 2016 Value Line, Inc. All rights reserved. Factual material is obtained from sources believed to be reliable and is provided without warranties of any kind.THE PUBLISHER IS NOT RESPONSIBLE FOR ANY ERRORS OR OMISSIONS HEREIN. This publication is strictly for subscriber’s own, non-commercial, internal use. No partof it may be reproduced, resold, stored or transmitted in any printed, electronic or other form, or used for generating or marketing any printed or electronic publication, service or product.
To subscribe call 1-800-VALUELINE
RECENTPRICE
P/ERATIO
RELATIVEP/E RATIO
DIVʼDYLD( )Trailing:
Median:VALUELINE
SAMPLE RESEARCH REPORT
1 2 3 4 5 6 7 8 9
10
11
12
13
14
19
17
15
18
16

www.valueline.com www.valuelinepro.com 1-800-VALUELINE (1-800-825-8354)
Value Line Publishing LLC 485 Lexington Avenue New York, NY 10017-2630 [email protected]
1A-2-3


![The Value Added Technologist.ppt [Read-Only]](https://img.pdfslide.net/doc/110x75/61f51ee9ff2d860ab550ff69/the-value-added-read-only.jpg)