Embed Size (px)
Citation preview
5 Minute Charts Explanationand Guide + Three Free Setups
In this article, we will cover everything you need to knowabout 5-minute charts. First, we will touch on the basics ofthe 5-minute chart. Next, we will move onto two popular chartpatterns using the 5-minute charts. Lastly, we will coveradvanced trading techniques of combining indicators andmultiple time frames.
5-Minute Bar Definition5-minute charts illustrate the summary of a stock’s activityfor every 5-minute period within the trading session. The
core market session is 6.5 hours per day [1]; therefore, a 5-minute chart will have 78 five minute bars printed for everyfull trading session.
Day traders are commonly trading 5-minute charts to identifyshort-term trends and execute their trading strategy of
choice.
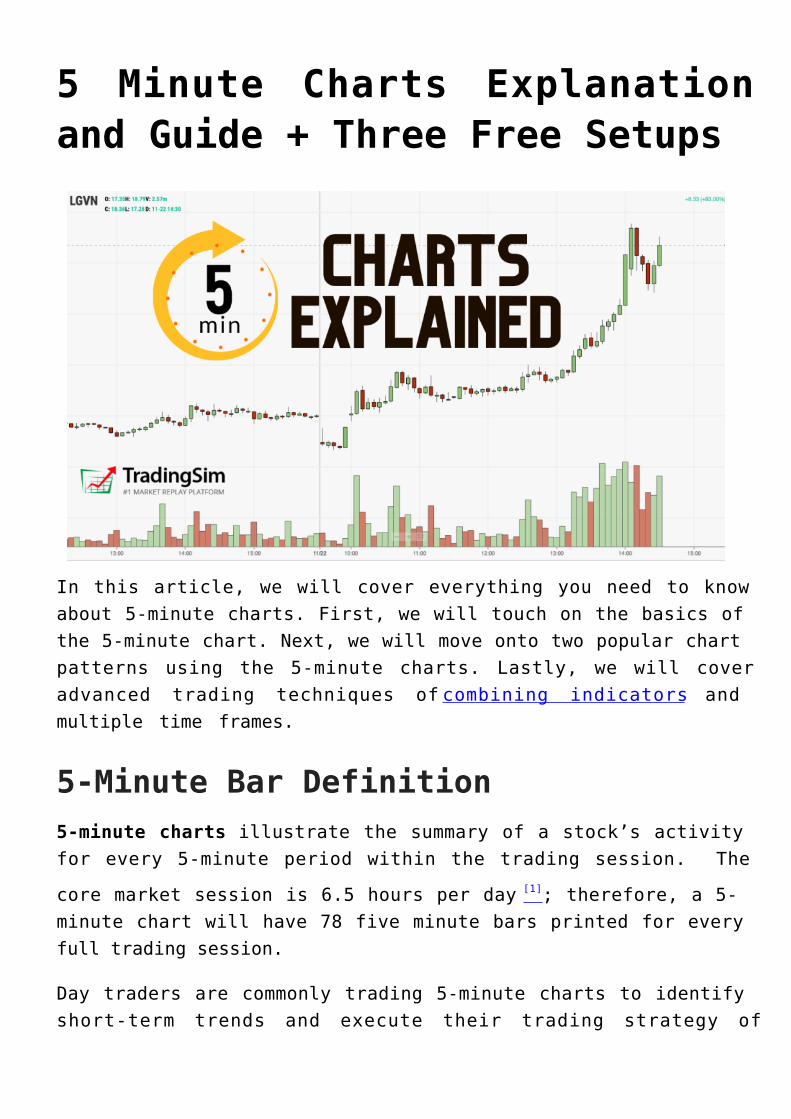
Where to Select the 5-Minute Time FrameMost trading applications will allow you to select the timeframe to analyze price data. Within the Tradingsim platform,you can select the 5-minute interval directly above the chart.
Select 5 Minutes
The close on 5-minute charts gives insight into the immediatemarket direction of the trend for a stock. When a stockcloses at the low or high of the 5-minute bar, there is oftena short-term breather where the stock will go in the oppositedirection.
The psychology behind this is that the stock has been pushedto an extreme as other active traders chase the pricetrend. This breather can mark a major reversal, but in themajority of cases, it creates the environment for a countermove.
How Do You Trade 5 Minute Charts?Bar any exhaustive scientific studies, we would dare to saythe 5-minute chart is one of the most popular time frames forday traders.
5-minutes provides you with the right mix of monitoring thedetails, without scalping, and conversely allowing you toavoid waiting for 10, 15, 30 or 60-minutes to pull the triggeras well.
It’s that fine line where most traders feel comfortable withinthis time unit of measure. It also quietens the noise of 1 and2 minute charts.
Now, let’s dive into a few strategies you can use with thistime frame.
The Morning Reversal StrategyMost of the liquidity and trading activity in the market
occurs in the morning and near the close [2].
In the morning, stocks will trend hard for the first 20-30minutes into the 10 am reversal time zone. Day traders thatare looking to go opposite to the trend can wait for a closeat the high or low of the 5-minute bar to go opposite to themorning move.
The morning reversal short has a high success rate. There issomething about the retail trading market in the morning thatbrings a fresh batch of bag holders chasing the market forquick gains every morning.
The smart money will grab the breakout and ride the market forquick profits. However, new traders will either hold on toolong or jump on the bandwagon too late, perhaps on a breakoutthat fails like this OCUP example below:
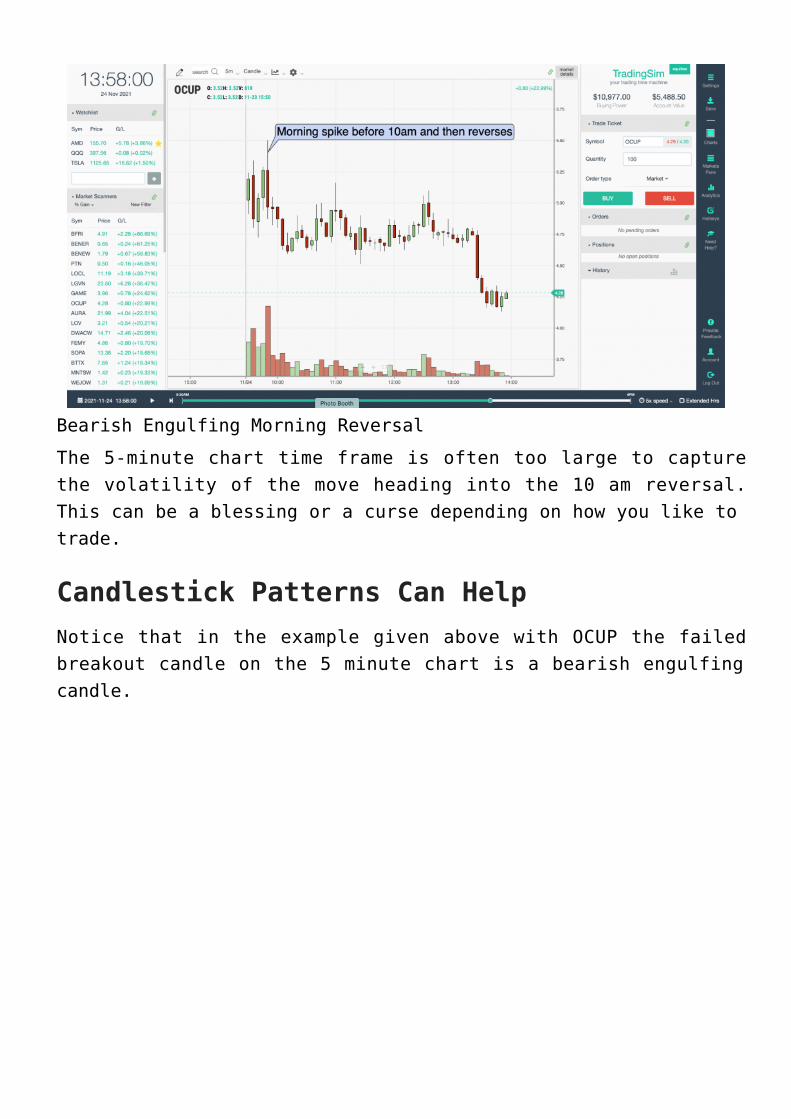
Bearish Engulfing Morning Reversal
The 5-minute chart time frame is often too large to capturethe volatility of the move heading into the 10 am reversal.This can be a blessing or a curse depending on how you like totrade.
Candlestick Patterns Can HelpNotice that in the example given above with OCUP the failedbreakout candle on the 5 minute chart is a bearish engulfingcandle.
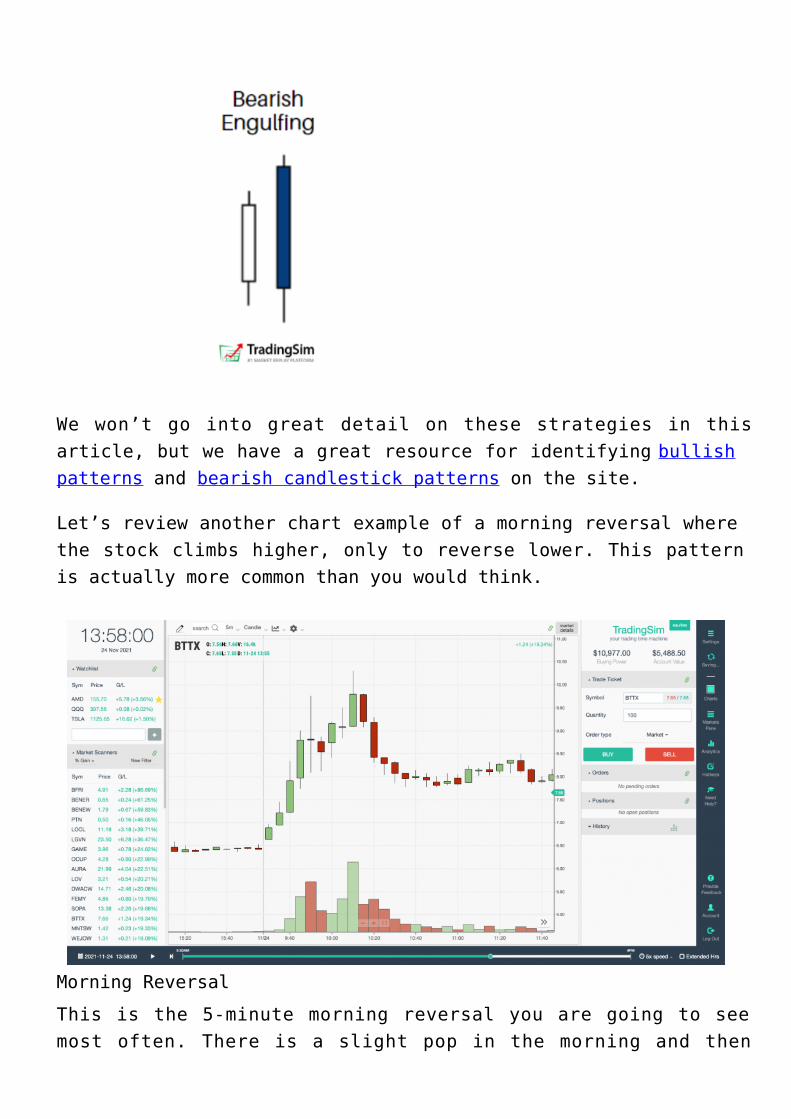
We won’t go into great detail on these strategies in thisarticle, but we have a great resource for identifying bullishpatterns and bearish candlestick patterns on the site.
Let’s review another chart example of a morning reversal wherethe stock climbs higher, only to reverse lower. This patternis actually more common than you would think.
Morning Reversal
This is the 5-minute morning reversal you are going to seemost often. There is a slight pop in the morning and then
after a move higher, a sharp reaction lower.
As you can see from the spinning top at the 6th 5 minute barof the day, we have supply entering the market. We then get abreakout from that level that fails — a great opportunity toget short.
As always, treat trading 5-minute charts in the morningseriously, especially on the short side. Always put your stopsin.
Trading BreakoutsIn addition to pullback trades, breakout trades are also a bigpart of active trading. For these setups, you want to findstocks that are up considerably in the pre-market or withvolume right off the open.
Next, you want to make sure they have little to no overheadresistance.
If you are open to more risk and would like to reap morerewards, then you will want to set your eyes on low floatstocks.
If you are looking to play things a little safer, then look tostocks with a float north of 100 million shares.
But no matter your risk appetite, the key to success iscutting your losers and letting your winners run.
5 Minute Chart Morning Breakout Example1:
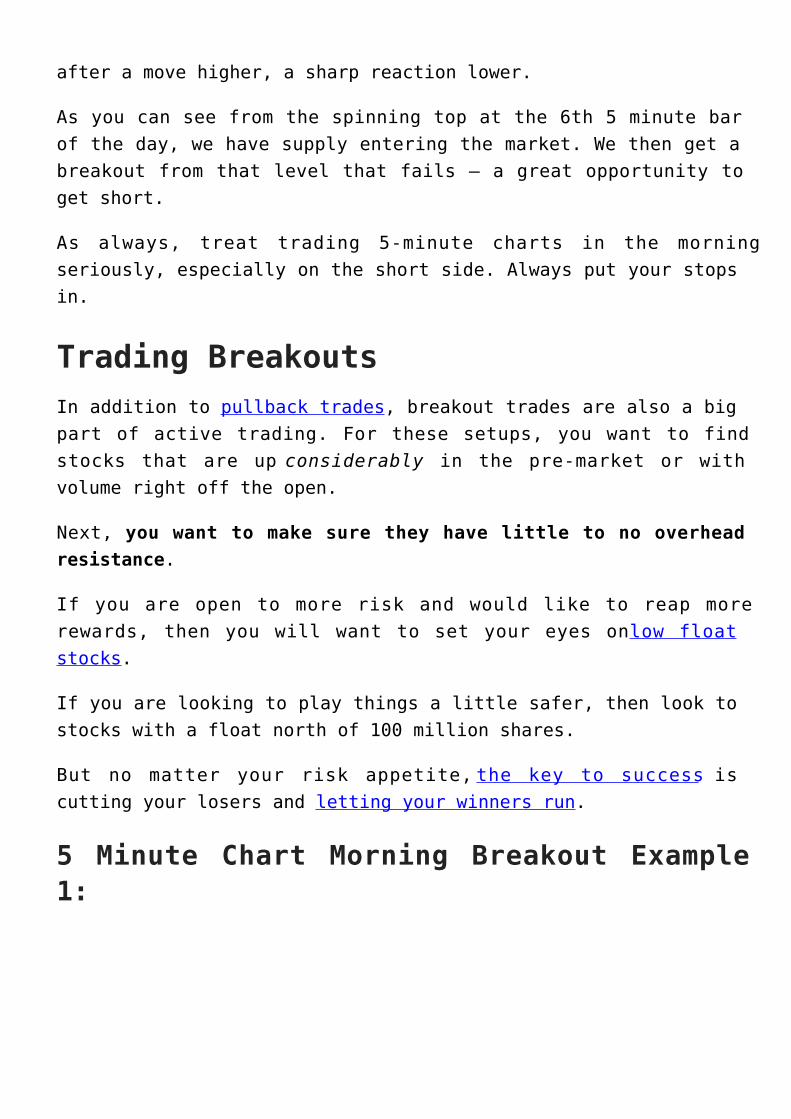
Morning Breakout of 5 Minute Chart
If you trade pre-market, then your range can develop in theearly am and you could be in a trade as early as 9:31 in themorning. However, if you do not use pre-market data, you willwant to focus on the opening range.
You might also find a solid breakout strategy using our smallaccount building setup.
Next, you want a stock with volume that can push the price
higher [3].
Lastly, you shouldn’t fall in love with these high flyers.Most of them will run their course in ten to thirty minutes.
So, remember to keep your stops tight and to take profits asthe stock goes higher.
5 Minute Chart Morning Breakdown Example:
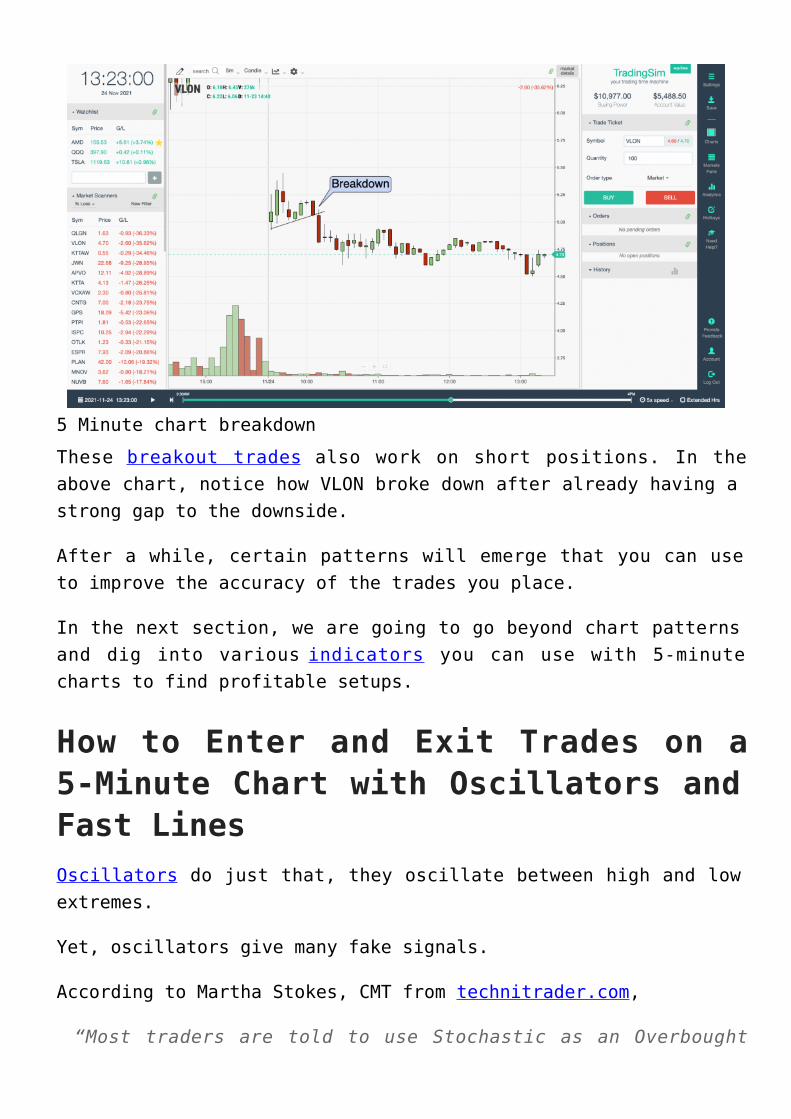
5 Minute chart breakdown
These breakout trades also work on short positions. In theabove chart, notice how VLON broke down after already having astrong gap to the downside.
After a while, certain patterns will emerge that you can useto improve the accuracy of the trades you place.
In the next section, we are going to go beyond chart patternsand dig into various indicators you can use with 5-minutecharts to find profitable setups.
How to Enter and Exit Trades on a5-Minute Chart with Oscillators andFast LinesOscillators do just that, they oscillate between high and lowextremes.
Yet, oscillators give many fake signals.
According to Martha Stokes, CMT from technitrader.com,
“Most traders are told to use Stochastic as an Overbought
exit or sell short signal, and an Oversold entry or buysignal. This simplistic approach worked well prior to the1990s and the advent of electronic trading plus massiveinstitutional trading activity. However, this is far toosimple an approach for the faster-paced more dynamic andcomplex marketplace of today, where short term trading
dominates more than ever.” [4]
Since they are leading indicators, oscillators point out thata trend might emerge, but it is no guarantee.
For this reason, oscillators are one of the most attractivetools for day traders as timing is of the essence.
Nevertheless, if not used properly, they often lead tofailure. Therefore, we recommend combining two oscillatorswhen trading on a 5-minute timeframe in order to validatetrade signals.
Personally, we like oscillators only for trade entry and nottrade management.
Therefore, we recommend you include a fast line on your chartin order to attain exit points on 5-minute stock charts. Someof these lines could be a regular Moving Average, DEMA, TEMA,Hull MA, Least Squares MA, Arnaud Legoux MA, etc.
In this section, we will cover 3 simple strategies you can usewith 5-minute charts and indicators.
Strategy #1 – Stochastic Oscillator+ RSI + Triple EMAThis simple strategy uses a three-pronged approach across twooscillators and an on-chart moving average indicator.
Entering a Trade
Trade entry signals are generated when the stochasticoscillator and relative strength index provide confirmingsignals.
Trade Exit
You should exit the trade once the price closes beyond theTEMA in the opposite direction of the primary trend.
There are many cases when candles move partially beyond theTEMA line. We disregard such exit points and we exit themarket when the price fully breaks the TEMA. Have a look atthe example below:
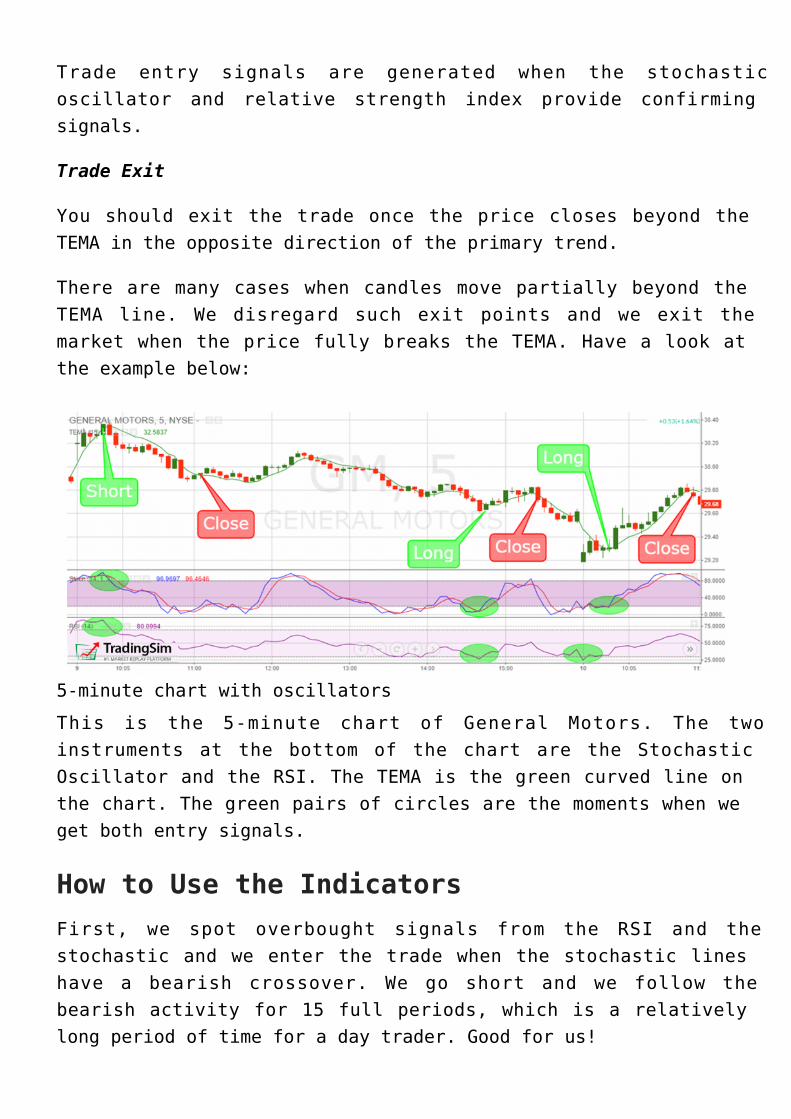
5-minute chart with oscillators
This is the 5-minute chart of General Motors. The twoinstruments at the bottom of the chart are the StochasticOscillator and the RSI. The TEMA is the green curved line onthe chart. The green pairs of circles are the moments when weget both entry signals.
How to Use the IndicatorsFirst, we spot overbought signals from the RSI and thestochastic and we enter the trade when the stochastic lineshave a bearish crossover. We go short and we follow thebearish activity for 15 full periods, which is a relativelylong period of time for a day trader. Good for us!
We exit the trade once the price closes above the TEMA. Thisshort position generated a profit of $0.43 (43 cents) pershare, which is a decent amount even for advanced tradingstrategies.
Later, we receive a few more overbought/oversold signals fromthe stochastic, but they are not confirmed by the RSI. Thus,we stay out of the market until the next RSI signal.
Our second trade comes when the RSI enters the oversold areajust for a moment. This long signal is confirmed by thestochastic, so we go long. The bullish move that ensued isminor, but still in our favor!
We hold this trade for 9 periods before closing the position.We exit the market when a bigger bearish candle closes belowthe TEMA with its full body. This long trade brought us aprofit of $0.09 (9 cents) per share.
On the next day, we manage to identify another long signalfrom the stochastic and the RSI.
We hold the long position open for 14 periods before one ofthe bearish candles on the way up close below the TEMA. Thislong position generated a profit of $0.46 (46 cents) pershare.
Strategy Results3 Positions2 long1 shortTime in the market: 3 hours and 10 minutesTotal profit: $0.98 (98 cents) per share
Strategy #2 – MACD + MFIFor this next strategy, we will combine the Moving Average
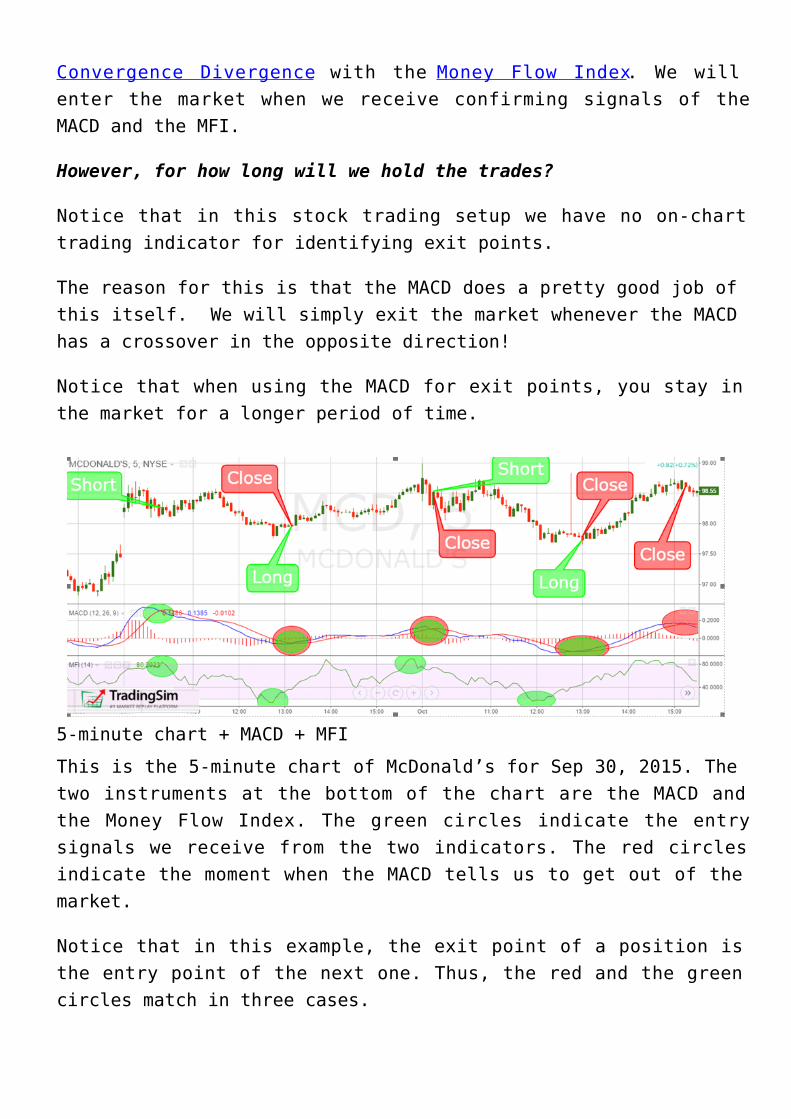
Convergence Divergence with the Money Flow Index. We willenter the market when we receive confirming signals of theMACD and the MFI.
However, for how long will we hold the trades?
Notice that in this stock trading setup we have no on-charttrading indicator for identifying exit points.
The reason for this is that the MACD does a pretty good job ofthis itself. We will simply exit the market whenever the MACDhas a crossover in the opposite direction!
Notice that when using the MACD for exit points, you stay inthe market for a longer period of time.
5-minute chart + MACD + MFI
This is the 5-minute chart of McDonald’s for Sep 30, 2015. Thetwo instruments at the bottom of the chart are the MACD andthe Money Flow Index. The green circles indicate the entrysignals we receive from the two indicators. The red circlesindicate the moment when the MACD tells us to get out of themarket.
Notice that in this example, the exit point of a position isthe entry point of the next one. Thus, the red and the greencircles match in three cases.
How to Use the IndicatorsIn the first trade, we have matching bearish entry signalsfrom the MFI and the MACD. We short McDonald’s.
Although there is strong hesitation in the price movement, noexit signal is provided from the MACD and we hold ourposition. Later on, the price moves in our favor and we closethe trade when the MACD has a bullish crossover. We were shortfor 34 periods and generate a profit of $0.33 (33 cents).
As we said, in this strategy example, we often open a contraryposition right after closing the trade. Therefore, once wereceived the exit crossover from the MACD, the MFI gave us along signal.
We stay in the market for 36 periods until the MACD gives us abearish crossover. We collect a profit of $0.56 (56 cents) pershare from this trade – slightly better than the previousexample.
The MFI is already high and we immediately open a shortposition after the MACD crossover from the previous position.McDonald’s starts to move in our favor, but the directionchanges rapidly. Yet, the two lines of the MACD interact, butthey do not create a crossover. Thus, we hold our shortposition for 39 periods.
In this trade, we accumulated a profit of $0.81 (81 cents) pershare – much better!
With the exit of the previous position came the entry pointfor the next trade. This is so because the MFI was alreadydown when the MACD exit crossover appeared. Thus, we go longand we enter the best trade of the four! We hold McDonald’sfor 27 periods before the MACD gives us a bearish crossover.This long position generated a profit of $0.88 (88 cents) pershare. Well, that my friend is a good trade!
Strategy Results4 Positions2 long2 shortTime in the market: 11 hours and 20 minutesTotal profit: $2.58 per share
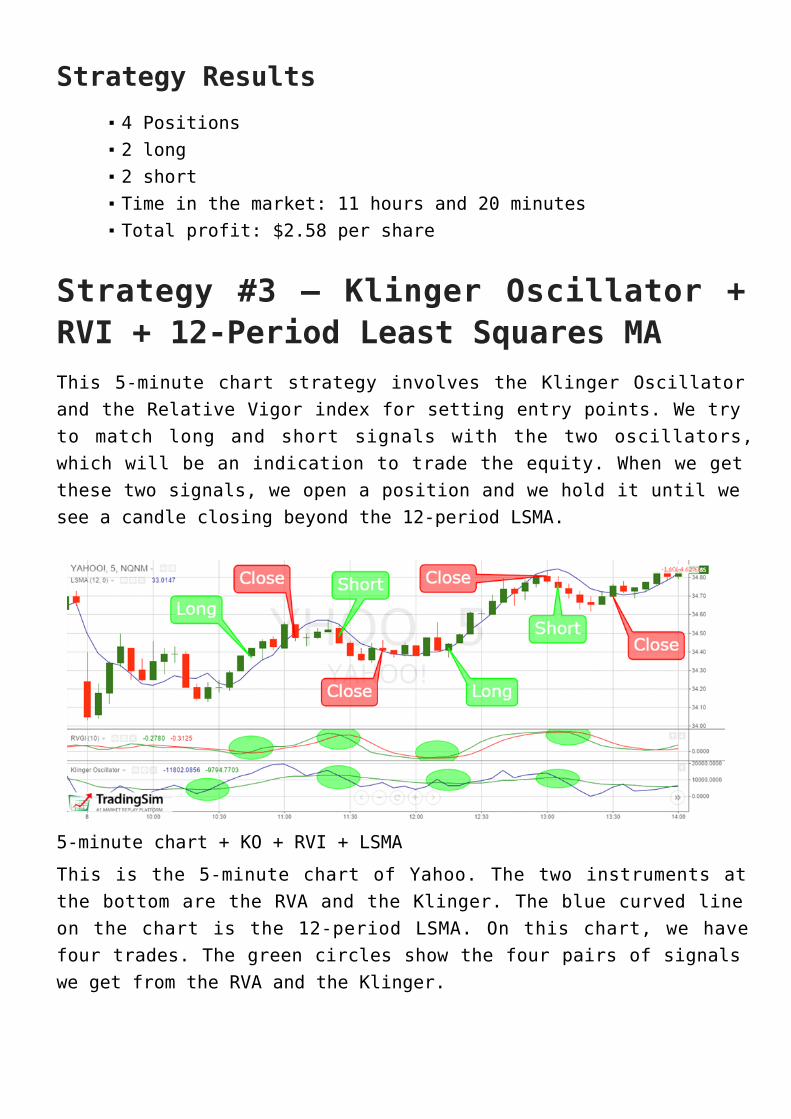
Strategy #3 – Klinger Oscillator +RVI + 12-Period Least Squares MAThis 5-minute chart strategy involves the Klinger Oscillatorand the Relative Vigor index for setting entry points. We tryto match long and short signals with the two oscillators,which will be an indication to trade the equity. When we getthese two signals, we open a position and we hold it until wesee a candle closing beyond the 12-period LSMA.
5-minute chart + KO + RVI + LSMA
This is the 5-minute chart of Yahoo. The two instruments atthe bottom are the RVA and the Klinger. The blue curved lineon the chart is the 12-period LSMA. On this chart, we havefour trades. The green circles show the four pairs of signalswe get from the RVA and the Klinger.
How to Use the IndicatorsFirst, we get a bullish signal from the Klinger, which isconfirmed by the RVA after 4 periods. When we get theconfirmation, we go long. We manage to hold the trade for fourcandles before we see a bearish candle below the LSMA. We get$0.10 (10 cents) per share from this trade.
Four periods later, the Klinger and the RVA give us bearishsignals at once and we go short. We get a slight bearish moveof four periods before a candle closes below the LSMA. Wegenerate $0.12 (12 cents) per share more.
The third trade is the most successful one.
Six periods after the previous position, we get matchingbullish signals from the Klinger and the RVA. Thus, we go longwith Yahoo. We manage to stay for 9 periods in this tradebefore a candle closes with its full body below the 12-periodLSMA.
Notice that at the end of the bullish move, there is anotherbearish candle, which closes below the LSMA, but not with itsfull body. Therefore, we disregard it as an exit signal. Thislong position brings us a profit of $0.37 (37 cents) pershare.
With the next candle, we get bearish signals from the RVA andthe Klinger and we go short with the closing of the previouslong position. We get out of this trade after 5 periods when abigger bullish candle closes above the LSMA. This tradegenerated a profit of only $0.03 (3 cents) per share.
Strategy Results4 Positions2 long2 shortTime in the market: 2 hours and 10 minutes
Total profit: $0.62 (62 cents) per share
Which 5-minute bar trading setup isbetter?The trading strategy we prefer when trading 5-minute charts isthe MACD + MFI. The reason for this is that this strategydistributes the trading along the entire trading day.
In the example above, we covered the whole day with only 4trades. Furthermore, we generated an impressive amount pershare!
In the other two strategies, the number of trades per day willbe significantly more. As you see with MACD + MFI, we traded 4positions for 11 hours, while with Klinger, RVI, and LSMA, wetraded 4 positions for only 2 hours.
Yet, some of you will like fast-paced trading and will like toexit the market more frequently. Just remember in trading,more effort does not equal more money.
Using Multiple TimeframesOne thing you will want to do with 5 -minute charts is to usemultiple time frames to help support your point of view.
In reality, 5-minute charts are great for stocks with lowervolatility. However, if you are trading low float stocks youwill want to use a one-minute or two-minute chart to trackprice movement.
While you are monitoring price movement on a lower level, youwill also need to monitor the bigger trends.
To do this, you will want to look at a daily or hourly chart.
So, when you are setting up your trading desk, have multiple
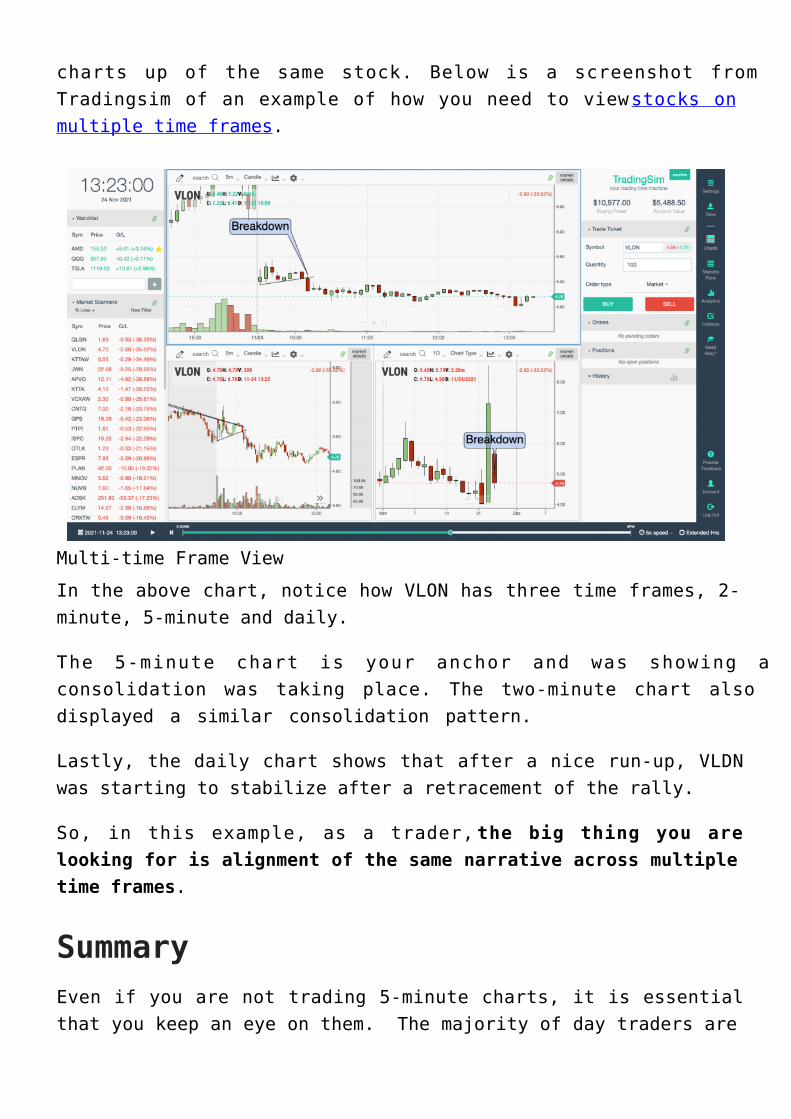
charts up of the same stock. Below is a screenshot fromTradingsim of an example of how you need to view stocks onmultiple time frames.
Multi-time Frame View
In the above chart, notice how VLON has three time frames, 2-minute, 5-minute and daily.
The 5-minute chart is your anchor and was showing aconsolidation was taking place. The two-minute chart alsodisplayed a similar consolidation pattern.
Lastly, the daily chart shows that after a nice run-up, VLDNwas starting to stabilize after a retracement of the rally.
So, in this example, as a trader, the big thing you arelooking for is alignment of the same narrative across multipletime frames.
SummaryEven if you are not trading 5-minute charts, it is essentialthat you keep an eye on them. The majority of day traders are
using 5-minute charts to make their trading decisions. Therefore, these traders tend to control the action.
If you are trading with 15-minute charts, be mindful that asharp counter-trend move can occur at the close of a 5-minutebar.
Remember, a close at the high or low of a 5-minute bar is apotential indication that a minor reversal is in play. Daytraders should not immediately exit their winning position butshould rather look at this as a sign of a potential trendchange.
Be sure to study candlestick patterns to help with yourstrategies.
Also, the morning is where all the action takes place in themarket. If you are going to trade during this time of day,remember the two most common setups – pull back and thebreakout.
Lastly, 5-minute charts can’t do it all by themselves. Youwill need to assist help from other time frames. The oneminute chart for very volatile stocks and the daily charts toidentify long-term trends for support and resistance levels.
External ReferencesHolidays and Trading Volumes. New York Stock Exchange1.Lee, Justina and Peterseil, Yakob. (2019).Wall Street2.Fights Stock Machines With Trend-Chasing on Steroids.Bloomberg.comSincere, Michael. (2011). ‘Start Day Trading Now: A3.Quick and Easy Introduction to Making Money WhileManaging Your Risk‘. Simon & Schuster. p. 41Stokes CMT, Martha. (2015). ‘How To Use Stochastic4.Ideally‘. Seeking Alpha.com