Embed Size (px)
Citation preview

How to use ADePT - Social Protection
World Bank Core Course on Pensions
Washington DC April 25 – May 6, 2016
Presenter: Claudia Rodríguez
Pub
lic D
iscl
osur
e A
utho
rized
Pub
lic D
iscl
osur
e A
utho
rized
Pub
lic D
iscl
osur
e A
utho
rized
Pub
lic D
iscl
osur
e A
utho
rized

What is ADePT
2
ADePT uses micro-level data from various types of surveys, such as
Household Budget Surveys, Demographic and Health Surveys and Labor
Force surveys to produce rich sets of tables and graphs for a particular
area of economic research
User requires knowledge of statistical packages -e.g. Stata and
SPSS – to prepare the dataset. Construction of key variables is not
trivial but a statistician can do it.
ADePT is a software Platform for Automated Economic Analysis.
How to use - ADePT Social Protection

Why ADePT?
3
• ADePT ensures comparability of results across countries/years, in a standardized format.
• ADePT saves time because users do not need to write commands and code to produce the tables and charts. It is automated!
• ADePT it is easy to learn and use. It minimizes human errors in programming!
Download from www.worldbank.org/adept
How to use - ADePT Social Protection
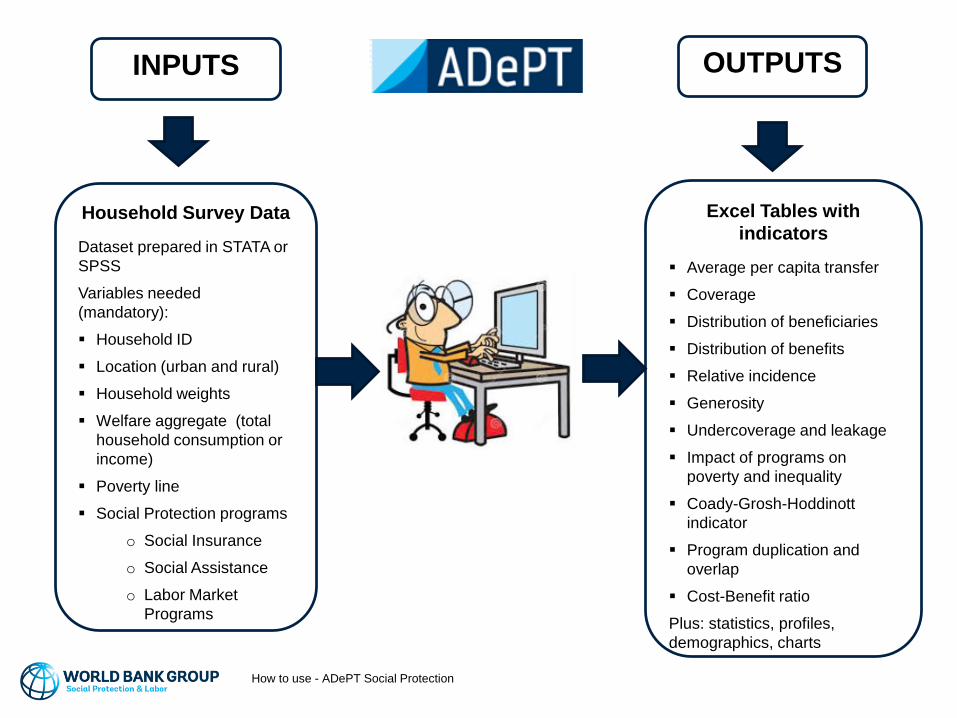
Household Survey Data
Dataset prepared in STATA or
SPSS
Variables needed
(mandatory):
Household ID
Location (urban and rural)
Household weights
Welfare aggregate (total
household consumption or
income)
Poverty line
Social Protection programs
o Social Insurance
o Social Assistance
o Labor Market
Programs
Excel Tables with
indicators
Average per capita transfer
Coverage
Distribution of beneficiaries
Distribution of benefits
Relative incidence
Generosity
Undercoverage and leakage
Impact of programs on
poverty and inequality
Coady-Grosh-Hoddinott
indicator
Program duplication and
overlap
Cost-Benefit ratio
Plus: statistics, profiles,
demographics, charts
INPUTS OUTPUTS
How to use - ADePT Social Protection

5
ADePT-SP Interface
(1)
Load your dataset(s)
(2)Tell ADePT what’s what
(3)Select tables and charts
(4)Choose options and hit “Generate”
How to use ADePT Social Protection

ADePT-SP Steps
1. Upload your datao Click on the “Add” button to open and upload the data you want to use
o Label the dataset. The label will be used in the tables and graphs
o You can add or remove multiple datasets
6

1. Upload your datao Specify if the dataset is at the individual or household level
o The dataset can be opened by clicking on the browse button
7
ADePT-SP Steps

2. Specify variableso Once data has been uploaded, the variable names and labels are shown in
the second tab of the first window to the left.
o The bottom window to the left has three tabs to specify main, program and
welfare variables
8
ADePT-SP Steps
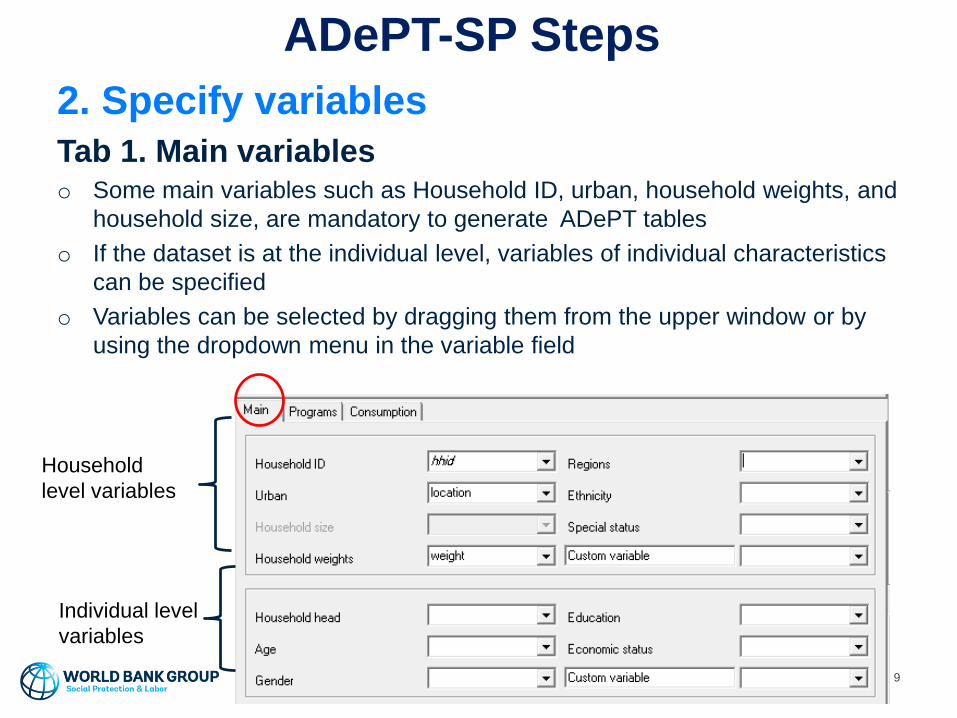
2. Specify variables
Tab 1. Main variableso Some main variables such as Household ID, urban, household weights, and
household size, are mandatory to generate ADePT tables
o If the dataset is at the individual level, variables of individual characteristics
can be specified
o Variables can be selected by dragging them from the upper window or by
using the dropdown menu in the variable field
9
Household
level variables
Individual level
variables
ADePT-SP Steps
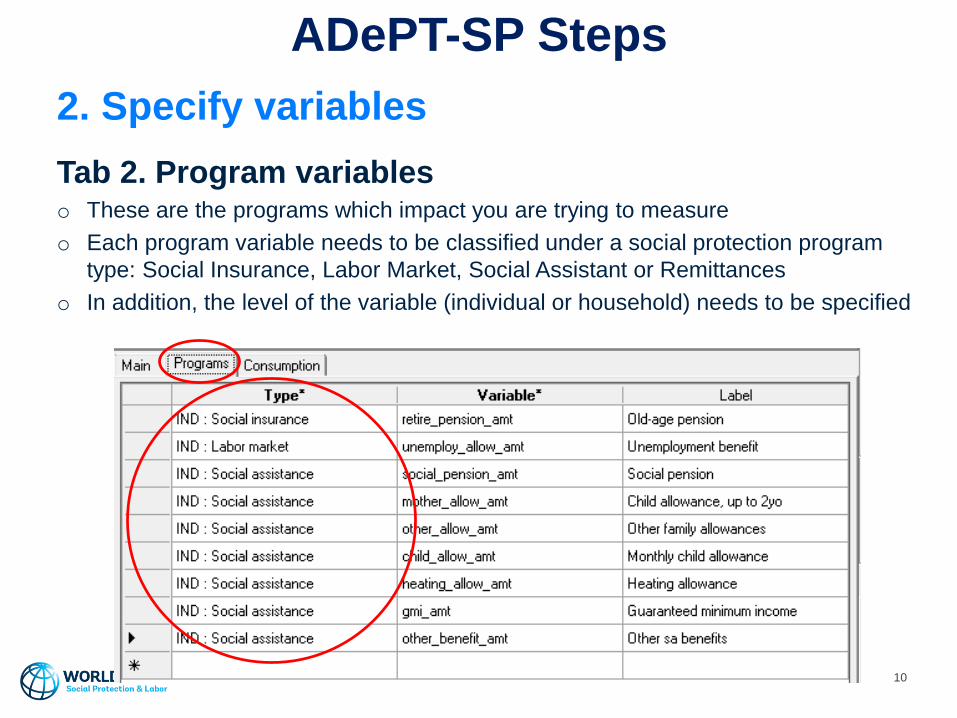
2. Specify variables
Tab 2. Program variableso These are the programs which impact you are trying to measure
o Each program variable needs to be classified under a social protection program
type: Social Insurance, Labor Market, Social Assistant or Remittances
o In addition, the level of the variable (individual or household) needs to be specified
10
ADePT-SP Steps

2. Specify variables
Tab 3. Consumption variableso In this tab you can rank households into poor or nor poor, quintile or decile
groups by using either a monetary or non-monetary welfare aggregate
o If a monetary value is chosen, in the “total consumption” field a variable
containing total consumption or total income can be selected
11
ADePT-SP Steps

2. Specify variables
Tab 3. Consumption variablesThe type of adjustment to the welfare aggregate or counterfactual welfare indicator should
be selected in this tab. ADePT SP can rank the households using four simplified
counterfactuals:
oNo adjustments (post transfer or observed income or consumption) (V0)
oNet of all Social Protection Transfers (V1)
oNet of each Social Protection Transfers (V2)
oNet of all Social Assistance Transfers (V3)
12
ADePT-SP Steps

3. Select tables and chartsA total of 51 tables can be generated by ADePT, depending on the level
of the dataset. You can select the tables and charts relevant to your
analysis.
13
ADePT-SP Steps

4. Generate Excel output tableso The lower window to the right displays the “Generate” button, which actives
once the tables have been selected
o Conditions can be specified to generate the tables (e.g. If gender ==1, etc.)
o The table description window displays the definition of the tables being
generated
o Errors or other messages are displayed in the second tab
14
ADePT-SP Steps

ADePT-SP Tables
ADePT generates an Excel file with the tables and charts displayed in
individual tabs.
15
16
Trainings
If your country office is interested in a training on ADEPT Social Protection and/or Poverty (1/2 day to 3 day courses)Please contact:
RuslanYemtsov
Claudia Rodríguez [email protected]
Brooks Evans
Download ADePT for free
www.worldbank.org/adept
THANK YOU!

World Bank Group
Social Protection and Labor Global Practice
1818 H Street NW
Washington DC 20433
USA