Embed Size (px)
Citation preview

Quality Excellence for Suppliers of Telecommunications Forum
(QuEST Forum)
How to Use QuEST Forum TL 9000 Measurement
Performance Data Reports (PDRs)
Release 3.0
Copyright
How to Use QuEST Forum Measurement Performance Data Reports ii Copyright 2015 QuEST Forum
Copyright 2015 Quality Excellence for Suppliers of Telecommunications Forum
For information about the QuEST Forum, visit the QuEST Forum website at http://questforum.org
For TL 9000 specific information,
visit the TL 9000 website at http://tl9000.org
TL 9000 is a registered trademark of the
Quality Excellence for Suppliers of Telecommunications Forum.
This document is intended to assist TL 9000 registrants and QuEST Forum members in the usage of the TL 9000 Performance Data Reports produced monthly by the QuEST Forum from TL 9000 data submitted by TL 9000 registrants. It is one of the products of the QuEST Forum
Executive Board Initiative on improving value of the PDRs to registrants and member companies.
The team was sponsored by QuEST Forum Executive Board members
Ken Koffman, JDSU
Team members: Ken Koffman, EB Lead Sponsor, JDSU
John Wronka, Chair, Alcatel-Lucent Beth Ford, AT&T
Art Morrical, Alcatel-Lucent Bao Tran, University of Texas at Dallas
Vijay Srikanth, University of Texas at Dallas Duk Kim, University of Texas at Dallas
Brian Newman, Verizon Tom Land, Cisco Systems
Debbie MacBean, Juniper Networks Brad Burchnell, CABLCON Janet McLean, GENBAND
Alice Woo, Juniper Networks Mike Gaines, AT&T
Tom Yohe, Telmar Networks
First issued October 1, 2008
Revised August, 2010
Revised January, 2015

Table of Contents
How to Use QuEST Forum Measurement Performance Data Reports iii Copyright 2015 QuEST Forum
Table of Contents
How to Use TL 9000 Performance Data Reports 1-1
1 Purpose 1-1 1.1 Background 1-1 1.2 Questions, Comments, Suggestions 1-1
2 TL 9000 Industry Trend Data - What, How, and When 2-1 2.1 What is published? 2-1 2.2 How - Overview of Data Rules 2-1
3 Access the PDRs (High Level) 2-2
4 How to Analyze and Use Trend Data 1 4.1 How Can Trend Data Be Used to Set Measurement Targets? 1
4.1.1 Positioning Your Product with the PDRs 1 4.1.2 Validating Data in a Product Category 2 4.1.3 How do I determine how much influence my own company’s data has on the
PDRs? 5 4.1.4 Setting Targets 5
4.2 Identifying and Addressing Anomalies in PDRs 6 4.2.1 Why do Anomalies Occur? 6 4.2.2 What are examples of some Anomalies? 6
4.3 Tracking Performance to Targets and Taking Action 12 4.3.1 Techniques for tracking performance against targets and PDR outputs 12 4.3.2 When do I take Action? 14
Table of Contents
How to Use QuEST Forum Measurement Performance Data Reports iv Copyright 2015 QuEST Forum
List of Figures Figure 2.1 – TL 9000 Certified Registrations by Product Category.............................................. 2-2 Figure 4.1.1-1 – On-Time Delivery Example Chart .......................................................................... 1 Figure 4.1.1-2 – On-time Items Delivery Chart................................................................................. 2 Figure 4.1.2-1 – Screenshot for Finding Certified Registrations ...................................................... 3 Figure 4.1.2-2 – List of Edge Router Certified Registrations (as of 2014) ....................................... 4 Figure 4.2.2-1 – Example of Perfect Performance in OFR3 ............................................................ 8 Figure 4.2.2-2 – SO3 Product Category 3.2.2.1.2.1 .......................................................................10 Figure 4.2.2-3 – NPR1 Product Category 1.2.9.3 ..........................................................................11 Figure 4.2.2-4 – SO2 Product Category 1.2.9.3 .............................................................................12 Figure 4.2.2-5 – SO2 Product Category 1.2.9.3 .............................................................................12
Section 1 - Purpose
How to Use QuEST Forum Measurement Performance Data Reports 1-1 Copyright 2015 QuEST Forum
How to Use TL 9000 Performance Data Reports
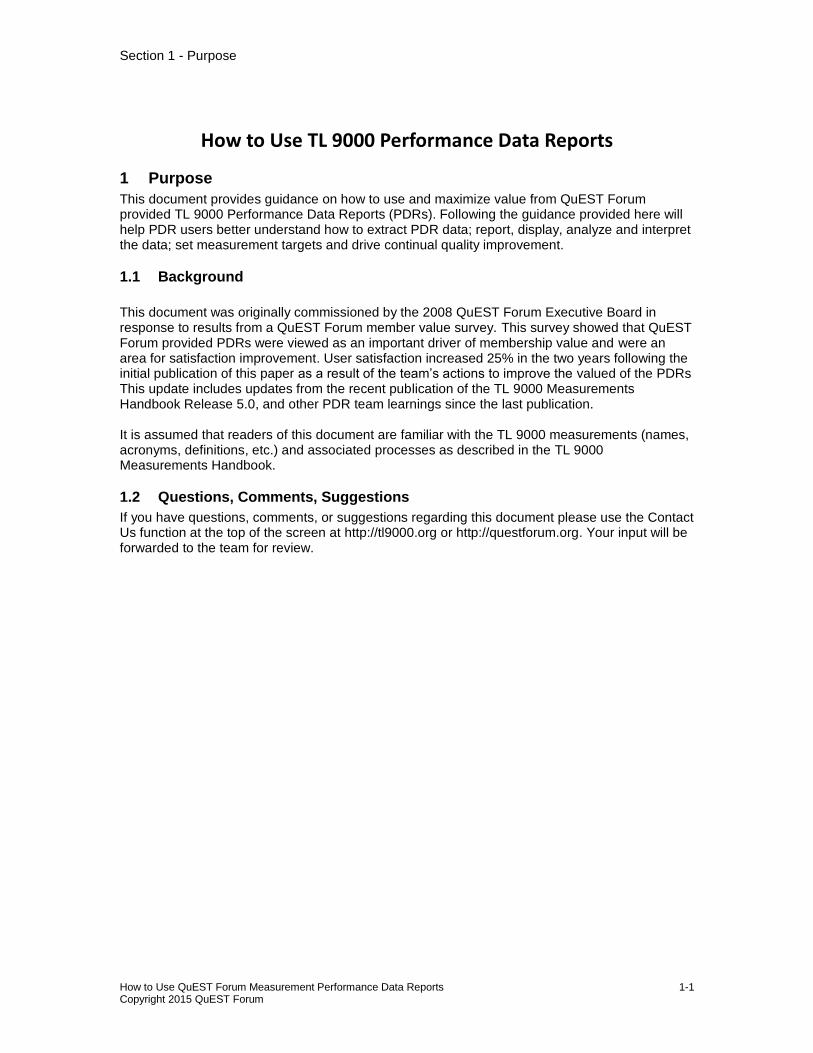
1 Purpose
This document provides guidance on how to use and maximize value from QuEST Forum provided TL 9000 Performance Data Reports (PDRs). Following the guidance provided here will help PDR users better understand how to extract PDR data; report, display, analyze and interpret the data; set measurement targets and drive continual quality improvement.
1.1 Background
This document was originally commissioned by the 2008 QuEST Forum Executive Board in response to results from a QuEST Forum member value survey. This survey showed that QuEST Forum provided PDRs were viewed as an important driver of membership value and were an area for satisfaction improvement. User satisfaction increased 25% in the two years following the initial publication of this paper as a result of the team’s actions to improve the valued of the PDRs This update includes updates from the recent publication of the TL 9000 Measurements Handbook Release 5.0, and other PDR team learnings since the last publication. It is assumed that readers of this document are familiar with the TL 9000 measurements (names, acronyms, definitions, etc.) and associated processes as described in the TL 9000 Measurements Handbook.
1.2 Questions, Comments, Suggestions
If you have questions, comments, or suggestions regarding this document please use the Contact Us function at the top of the screen at http://tl9000.org or http://questforum.org. Your input will be forwarded to the team for review.
Section 3– Access and Reporting of Industry Trend Data
How to Use QuEST Forum Measurement Performance Data Reports 2-1 Copyright 2015 QuEST Forum
2 TL 9000 Industry Trend Data - What, How, and When
The following material describes in brief the TL 9000 Industry Trend data published in PDRs. For full details on how the PDR calculations are made, please see the document TL 9000 Measurement Outputs and Calculations, available through this link: http://tl9000.org/pdrs/documents/TL_9000_Measurement_Outputs_and_Calculations.pdf This paper will be referred to in this document as the Calculation Paper.
2.1 What is published?
All calculations are based on the formulas in the TL 9000 Measurements Handbook using only data from certified registrations. To maintain anonymity of the data, there must be data submissions from at least three different companies before any data is published for a given measurement and product category in a PDR. The four TL 9000 outputs published are:
– Monthly Average = the measurement value based on the sum of all of the data submitted for the month
– Best in Class = the best performance from a single eligible registration over the last
six or twelve months (smoothing period) depending on the measurement
– Worst in Class = the worst performance from a single eligible registration over the smoothing period
– Industry Average = the measurement value based on the sum of all of the eligible
data submitted over the smoothing period for all measurements except FRT and OFR
2.2 How - Overview of Data Rules
An eligible registration is a certified registration that has submitted data for each month in the smoothing period and whose data represent 2% or more of the sum of the denominators from all submissions for the measurement or is greater than the minimum threshold value defined for the product category. Not all product categories have a threshold value defined. Those product category thresholds are defined in the Data Inclusion Thresholds file located at: http://tl9000.org/pdrs/documents/Data_Inclusion_Thresholds.pdf For the Worst in Class calculation, a certified registration whose data represent 5% or more of the sum of the numerators for that measurement is also considered eligible. By rule, the value of FRT or OFR for any month with no data is set to 100%. To accurately reflect this in the industry data, the Industry Average, Best in Class, and Worst in Class values for FRT and OFR are calculated based on the eligible registrations’ monthly calculated values such that their months with no problem reports due or overdue are included as 100% and impact the smoothing averages. The smoothing period is six months for the NPR, FRT, OFR, OTI, SFQ, and SPR measurements. It is twelve months for OTS, SO, SONE, SSO, and FR.
Section 3– Access and Reporting of Industry Trend Data
How to Use QuEST Forum Measurement Performance Data Reports 2-2 Copyright 2015 QuEST Forum
Table 1 in the Calculation Paper describes how data with a denominator value of zero is
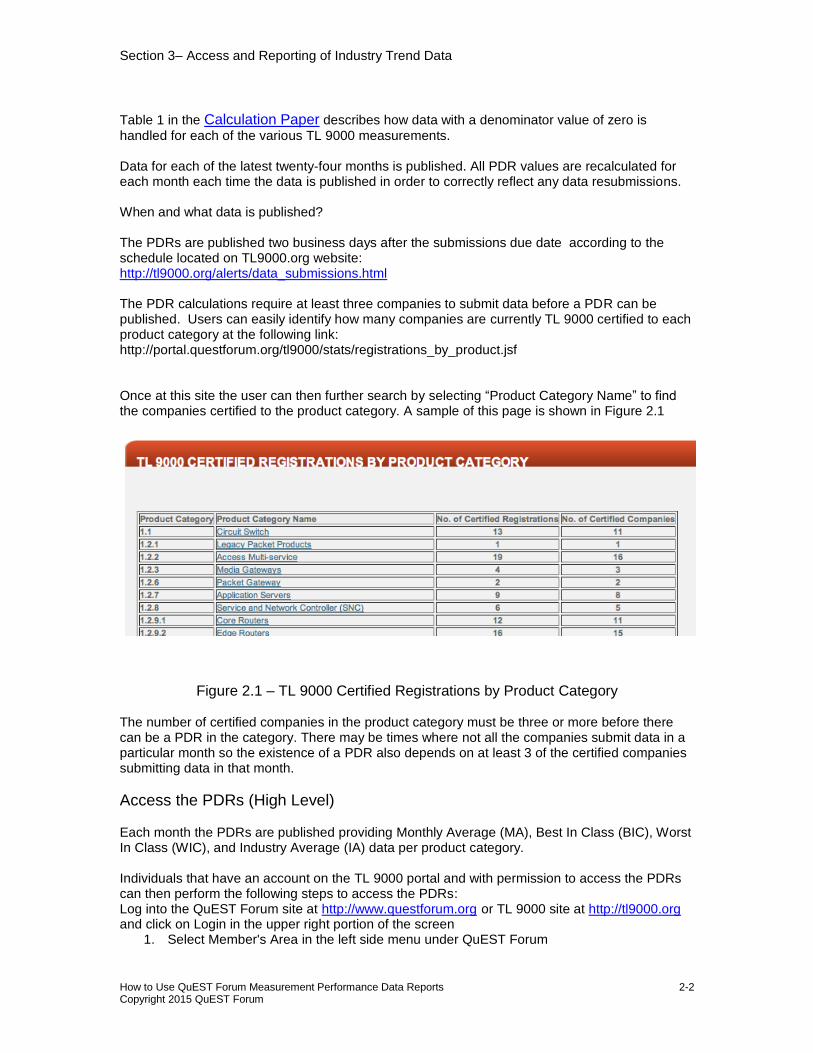
handled for each of the various TL 9000 measurements. Data for each of the latest twenty-four months is published. All PDR values are recalculated for each month each time the data is published in order to correctly reflect any data resubmissions. When and what data is published? The PDRs are published two business days after the submissions due date according to the schedule located on TL9000.org website: http://tl9000.org/alerts/data_submissions.html The PDR calculations require at least three companies to submit data before a PDR can be published. Users can easily identify how many companies are currently TL 9000 certified to each product category at the following link: http://portal.questforum.org/tl9000/stats/registrations_by_product.jsf Once at this site the user can then further search by selecting “Product Category Name” to find the companies certified to the product category. A sample of this page is shown in Figure 2.1
Figure 2.1 – TL 9000 Certified Registrations by Product Category The number of certified companies in the product category must be three or more before there can be a PDR in the category. There may be times where not all the companies submit data in a particular month so the existence of a PDR also depends on at least 3 of the certified companies submitting data in that month.
Access the PDRs (High Level) Each month the PDRs are published providing Monthly Average (MA), Best In Class (BIC), Worst In Class (WIC), and Industry Average (IA) data per product category. Individuals that have an account on the TL 9000 portal and with permission to access the PDRs can then perform the following steps to access the PDRs: Log into the QuEST Forum site at http://www.questforum.org or TL 9000 site at http://tl9000.org and click on Login in the upper right portion of the screen
1. Select Member's Area in the left side menu under QuEST Forum

Section 3– Access and Reporting of Industry Trend Data
How to Use QuEST Forum Measurement Performance Data Reports 2-3 Copyright 2015 QuEST Forum
2. Select Performance Data Reports in the Resources section and, when prompted, select I Agree
3. Select a Product Category file from the drop down box and download the csv file to your computer (.csv)
4. Note that all the PDRs can be downloaded in one step by selecting the zip file at the bottom of the drop down box. There is also the ability to add in your own data and thus make a report of your results benchmarked against the industry: http://portal.questforum.org/members/graphical_pdrs.jsf
XML access to the trend data is also possible. Contact UTD through the “Contact Us” button on the QuEST Forum web site or e-mail to [email protected] for information on setting up XML access. The automated XML interface will require programming on the user side that is provided by an IT department or consultant. While not as comprehensive as the monthly industry data, there is annual data available to all TL 9000 registrants that may be utilized by the same techniques discussed in this paper.
How to Use QuEST Forum Measurement Performance Data Reports Copyright 2015 QuEST Forum
3 How to Analyze and Use Trend Data
3.1 How Can Trend Data Be Used to Set Measurement Targets?
3.1.1 Positioning Your Product with the PDRs
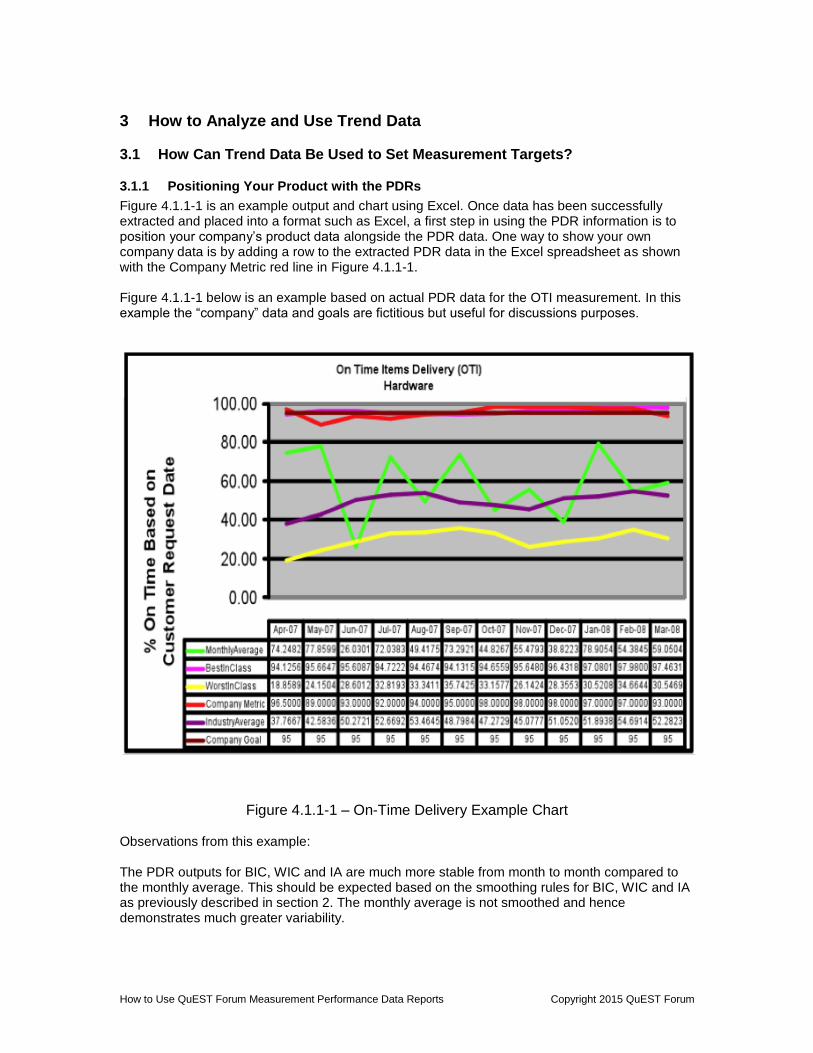
Figure 4.1.1-1 is an example output and chart using Excel. Once data has been successfully extracted and placed into a format such as Excel, a first step in using the PDR information is to position your company’s product data alongside the PDR data. One way to show your own company data is by adding a row to the extracted PDR data in the Excel spreadsheet as shown with the Company Metric red line in Figure 4.1.1-1. Figure 4.1.1-1 below is an example based on actual PDR data for the OTI measurement. In this example the “company” data and goals are fictitious but useful for discussions purposes.
Figure 4.1.1-1 – On-Time Delivery Example Chart Observations from this example: The PDR outputs for BIC, WIC and IA are much more stable from month to month compared to the monthly average. This should be expected based on the smoothing rules for BIC, WIC and IA as previously described in section 2. The monthly average is not smoothed and hence demonstrates much greater variability.
How to Use QuEST Forum Measurement Performance Data Reports Copyright 2015 QuEST Forum
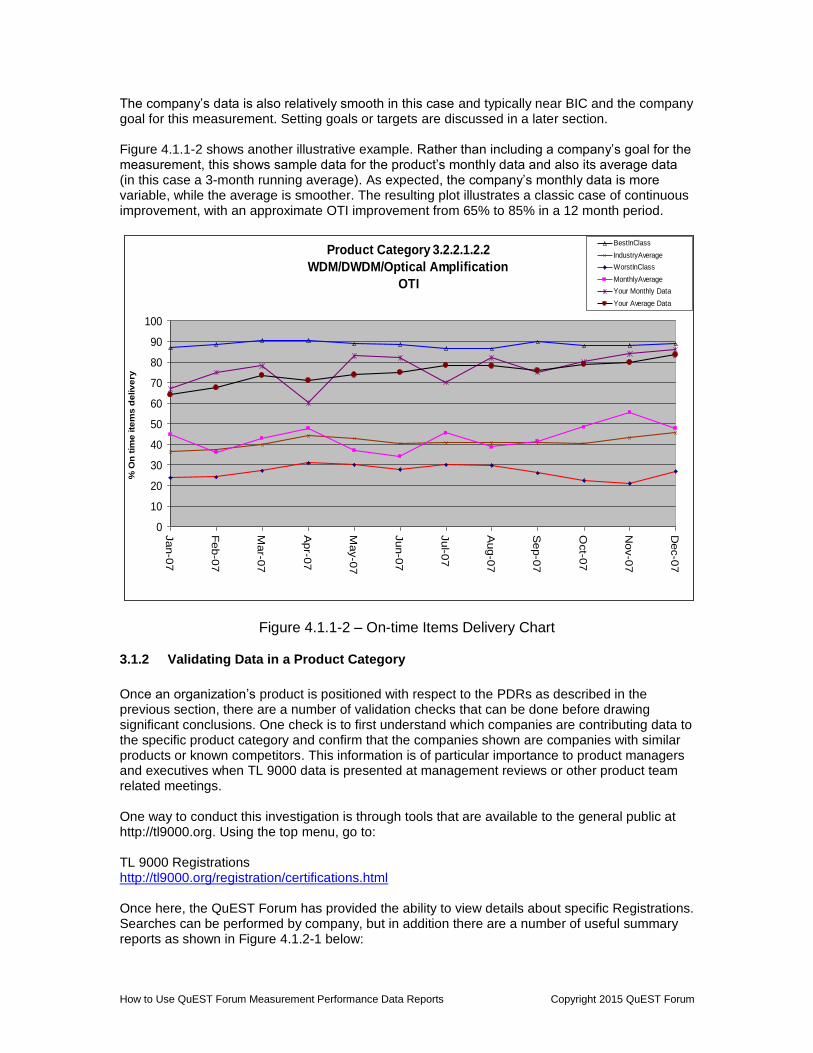
The company’s data is also relatively smooth in this case and typically near BIC and the company goal for this measurement. Setting goals or targets are discussed in a later section. Figure 4.1.1-2 shows another illustrative example. Rather than including a company’s goal for the measurement, this shows sample data for the product’s monthly data and also its average data (in this case a 3-month running average). As expected, the company’s monthly data is more variable, while the average is smoother. The resulting plot illustrates a classic case of continuous improvement, with an approximate OTI improvement from 65% to 85% in a 12 month period.
Figure 4.1.1-2 – On-time Items Delivery Chart
3.1.2 Validating Data in a Product Category
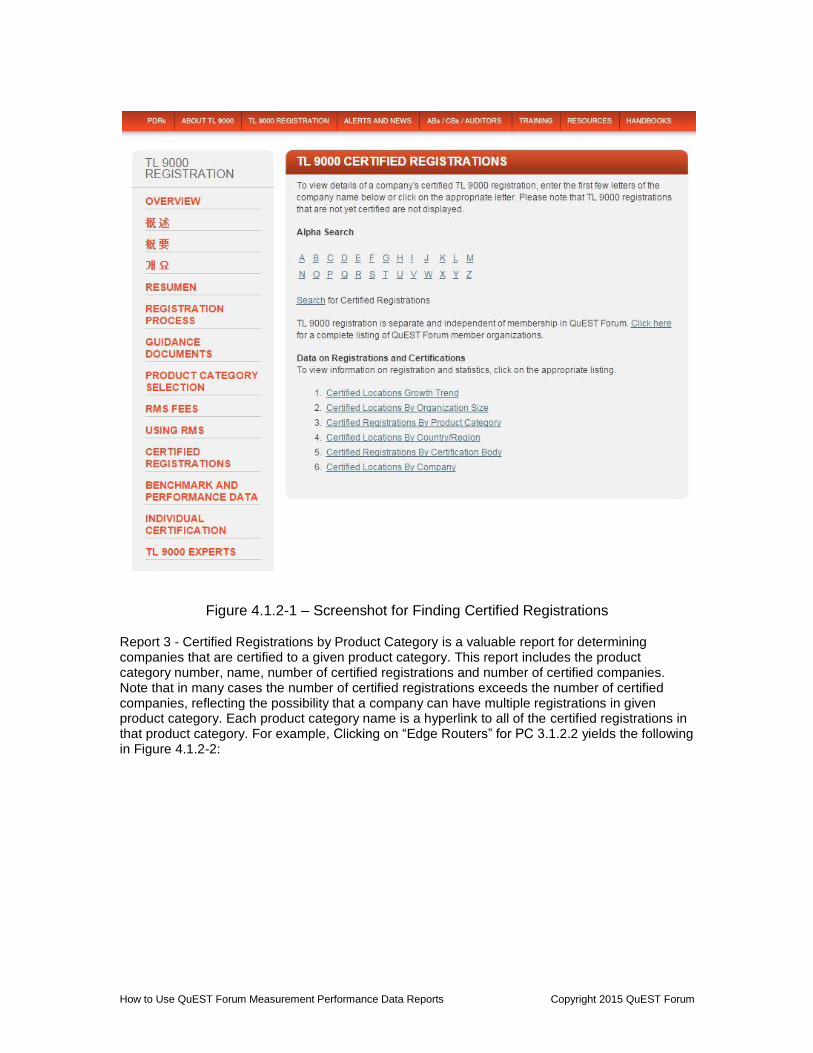
Once an organization’s product is positioned with respect to the PDRs as described in the previous section, there are a number of validation checks that can be done before drawing significant conclusions. One check is to first understand which companies are contributing data to the specific product category and confirm that the companies shown are companies with similar products or known competitors. This information is of particular importance to product managers and executives when TL 9000 data is presented at management reviews or other product team related meetings. One way to conduct this investigation is through tools that are available to the general public at http://tl9000.org. Using the top menu, go to: TL 9000 Registrations http://tl9000.org/registration/certifications.html Once here, the QuEST Forum has provided the ability to view details about specific Registrations. Searches can be performed by company, but in addition there are a number of useful summary reports as shown in Figure 4.1.2-1 below:
Product Category 3.2.2.1.2.2
WDM/DWDM/Optical Amplification
OTI
0
10
20
30
40
50
60
70
80
90
100
Jan-0
7
Feb-0
7
Mar-0
7
Apr-0
7
May-0
7
Jun-0
7
Jul-0
7
Aug-0
7
Sep-0
7
Oct-0
7
Nov-0
7
Dec-0
7%
On
tim
e ite
ms
de
liv
ery
BestInClass
IndustryAverage
WorstInClass
MonthlyAverage
Your Monthly Data
Your Average Data
How to Use QuEST Forum Measurement Performance Data Reports Copyright 2015 QuEST Forum
Figure 4.1.2-1 – Screenshot for Finding Certified Registrations Report 3 - Certified Registrations by Product Category is a valuable report for determining companies that are certified to a given product category. This report includes the product category number, name, number of certified registrations and number of certified companies. Note that in many cases the number of certified registrations exceeds the number of certified companies, reflecting the possibility that a company can have multiple registrations in given product category. Each product category name is a hyperlink to all of the certified registrations in that product category. For example, Clicking on “Edge Routers” for PC 3.1.2.2 yields the following in Figure 4.1.2-2:
How to Use QuEST Forum Measurement Performance Data Reports Copyright 2015 QuEST Forum
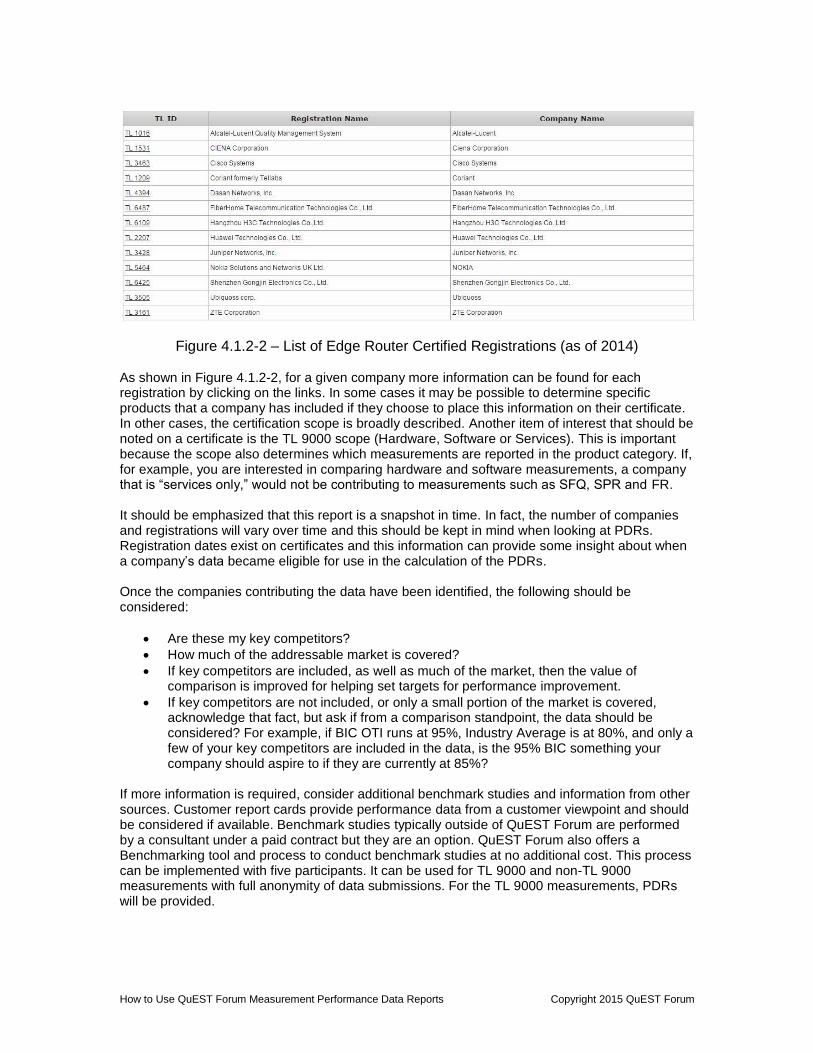
Figure 4.1.2-2 – List of Edge Router Certified Registrations (as of 2014) As shown in Figure 4.1.2-2, for a given company more information can be found for each registration by clicking on the links. In some cases it may be possible to determine specific products that a company has included if they choose to place this information on their certificate. In other cases, the certification scope is broadly described. Another item of interest that should be noted on a certificate is the TL 9000 scope (Hardware, Software or Services). This is important because the scope also determines which measurements are reported in the product category. If, for example, you are interested in comparing hardware and software measurements, a company that is “services only,” would not be contributing to measurements such as SFQ, SPR and FR. It should be emphasized that this report is a snapshot in time. In fact, the number of companies and registrations will vary over time and this should be kept in mind when looking at PDRs. Registration dates exist on certificates and this information can provide some insight about when a company’s data became eligible for use in the calculation of the PDRs. Once the companies contributing the data have been identified, the following should be considered:
Are these my key competitors?
How much of the addressable market is covered?
If key competitors are included, as well as much of the market, then the value of comparison is improved for helping set targets for performance improvement.
If key competitors are not included, or only a small portion of the market is covered, acknowledge that fact, but ask if from a comparison standpoint, the data should be considered? For example, if BIC OTI runs at 95%, Industry Average is at 80%, and only a few of your key competitors are included in the data, is the 95% BIC something your company should aspire to if they are currently at 85%?
If more information is required, consider additional benchmark studies and information from other sources. Customer report cards provide performance data from a customer viewpoint and should be considered if available. Benchmark studies typically outside of QuEST Forum are performed by a consultant under a paid contract but they are an option. QuEST Forum also offers a Benchmarking tool and process to conduct benchmark studies at no additional cost. This process can be implemented with five participants. It can be used for TL 9000 and non-TL 9000 measurements with full anonymity of data submissions. For the TL 9000 measurements, PDRs will be provided.
How to Use QuEST Forum Measurement Performance Data Reports Copyright 2015 QuEST Forum
Questions regarding competitors and addressable market may not always be simple to answer. It is recommended to work with product managers or other resources in marketing or competitive analysis functions in your company to help with the answers. In conclusion, from a competitive and market viewpoint, this section has provided insight into how to assess and validate the use of the TL 9000 PDRs before drawing significant conclusions. No set of data will ever perfectly match the desired competitive market for comparison purposes. However, data for certified registrations is readily available to QuEST Forum members without further additional benchmarking cost, and using the techniques suggested here can maximize its potential value.
3.1.3 How do I determine how much influence my own company’s data has on the PDRs?
Once the data in a given product category has been validated and better understood (e.g. is the data reflective of the market place?), another valid question to ask is: “How much is my own product’s data influencing the PDRs?” If a company’s product has a high market share, then the PDRs might have to be “adjusted” to reflect that fact. For example, if a company knows its product has a 50% market share, and its monthly data is positioned close to but below the Industry Average for on-time delivery, then it is very likely that the Industry Average without the product’s data is considerably higher (i.e., the performance for the high market share product is dragging down the Industry Average). Likewise, if the monthly average for the product is positioned above the Industry Average, then the Industry Average without that product would be lower. i.e., the performance for the high market share product is pulling up the Industry Average. Either conclusion would clearly impact the true positioning of the product relative to the rest of the industry for that product category and would influence what target should be selected.
3.1.4 Setting Targets
The previous sections showed the importance of plotting a company’s data along with the PDR data, and also validating the relevancy of the data. Once done, much has been accomplished towards setting the stage for determining appropriate goals for a given measurement. The final ingredient is to understand the business strategy for the product in question. Is it a key growth product? Is it a high volume, high profit mature product in its prime? Is it near End-of-life? Has an exit strategy been developed due to a change in market focus? What about capability and cost to deliver various performance levels for the measure in question? How important is superior performance for this measurement from a customer viewpoint? Answers to these questions can have a significant impact on the target setting strategy. It is quite likely that the goal strategy for the individual TL 9000 measurements for a given product may be quite different from each other. Striving for BIC for all measurements should not be assumed to be appropriate. Customer expectations, sometimes even stated in specific Service Level Agreements (SLAs) can have an impact on the strategy that is picked. The following are some examples to illustrate this point: Referring back to Figure 4.1.1-1, a target of 95% was set, which was very close to BIC. Such a target would be appropriate if it was a mature, key strategic product in the company’s portfolio, and providing that level of service is consistent with process capability and cost constraints. The customer base for this product would also rate timeliness as very important.
How to Use QuEST Forum Measurement Performance Data Reports Copyright 2015 QuEST Forum
But what if the scenario were different? What might an appropriate target be? Here are some possible scenario/target examples to consider: If historical performance is at Industry Average (around 50% per Figure 4.1.1-1) but a company is planning to exit the market, it may be appropriate to set a target closer to IA. This scenario is one example where striving for BIC may not be in the best business interest. If historical performance is at Industry Average (around 50% per Figure 4.1.1-1) but the product is considered key to the company’s future and the customer base puts a premium on timeliness, then a drive to BIC (approximately 95%) could be justified. If the product has high availability, high reliability customer requirements, then it is very likely that at least some of its TL 9000 measurement goals will be set above the Industry Average and should be striving for BIC. For example, for a product that is key to the Customer’s network operations, the company could set the product’s goals for System Outage (SO3 and SO4) and Problem Reports (NPR1 and NPR2) measurements approaching BIC. The primary reason for measuring a product’s current performance versus the PDRs and then setting measurement targets is to promote performance improvement activities within the organization. Following the steps outlined in this document will promote performance improvement in areas most impacting to a company and their customers. As some of the examples showed, setting a target, especially those approaching BIC, will require extensive action to achieve that level based on historical performance. In these scenarios, a capital investment(s) and/or improvement initiative(s) would be in order using accepted techniques for business process improvement. It is important that such initiatives be treated as a “project”, with appropriate level of project management including regular reviews, communication of progress and tracking against project goals. In cases where major improvement is required, it is typically useful to set a goal roadmap. As an example, assume that a product’s current OTD performance is about 60%, but the organization has committed to achieving 90% within the next 18 months. Assuming that making this improvement is not trivial and requires an improvement project, and then perhaps a 6-month goal to achieve 70%, followed by a subsequent 6-month goal for 80%, and a final goal of 90% for the last 6 months would be a more reasonable approach. This approach allows for interim success and monitoring, versus setting the goal at 90% and likely not being able to demonstrate any success for more than 12 months.
3.2 Identifying and Addressing Anomalies in PDRs
Data variability and anomalies are a normal part of “real” data. The existence of these does not render a given data set “worthless”. Dismissing such data out of hand is a missed opportunity for comparing a product’s performance with its competition. There are techniques to identify, rationalize and address anomalies to help interpret the data to aid in benchmarking and target setting. The QuEST Forum has set up counting rules, alerts, audits, and advisories that are all intended to promote data consistency and accuracy.
3.2.1 Why do Anomalies Occur?
Anomalies commonly occur in field data because variability and outliers are a natural part of field data. The existence of these anomalies does not mean the data can’t be used for benchmarking and target setting purposes.
3.2.2 What are examples of some Anomalies?
Understanding the anomalies allows for better judgment when evaluating the data. What may appear to be an outlier or anomaly can be real. Here are some examples:
How to Use QuEST Forum Measurement Performance Data Reports Copyright 2015 QuEST Forum
Best in Class is Perfect
It is common when reviewing PDRs to see that the Best-in-Class (BIC) output is “perfect”. Examples include an on time delivery or overdue fix response time of 100%, or a return rate of 0. There are various reasons that can cause these to happen depending on the measure. There are also implications in determining targets when this aspect occurs. In understanding how a perfect BIC can occur, it is important to consider the BIC definition: “The BIC data point in a particular month is the best performance for a single certified registration for that measurement over the appropriate time window (6 or 12 months)”. Also note that the Calculation Paper states that for BIC designation in a given month, an eligible registration’s data must meet either of these two conditions:
1. the data represent 2% or more of the sum of the denominators for that measurement over the time window
2. For certain measurements and product categories, the data are greater than a non-zero threshold as shown in the “Data Inclusion Thresholds” file located at: http://tl9000.org/pdrs/documents/Data_Inclusion_Thresholds.pdf
Based on this definition, there are various reasons that can cause a perfect BIC:
Relatively Small Population - in a single registration that meets the 2% rule or is close to the non-zero threshold (e.g. 100 NEs) can result in zero “events” from occurring (problem reports, outages or returns) over the appropriate BIC calculation time window (6 or 12 months depending on the measurement).
Mature Product – in this scenario, a very mature and stable product in the category, even if it comprises a more significant part of the population in the product category, can also result in “zero” events.
Combination of the above – A registration that encompasses a mature product, but comprises a relatively small part of the population in a product category is much more likely to experience zero events. But in addition, other measures such as OFR are more likely to be perfect. Fewer problem reports increases the chances of having either no overdue problem reports, or the likelihood of closing them all in the given month, hence resulting in 100%. Similarly, a mature product may not have significant “strain” on the supply chain in meeting on-time delivery agreements, hence making the ability to achieve 100% much more likely.
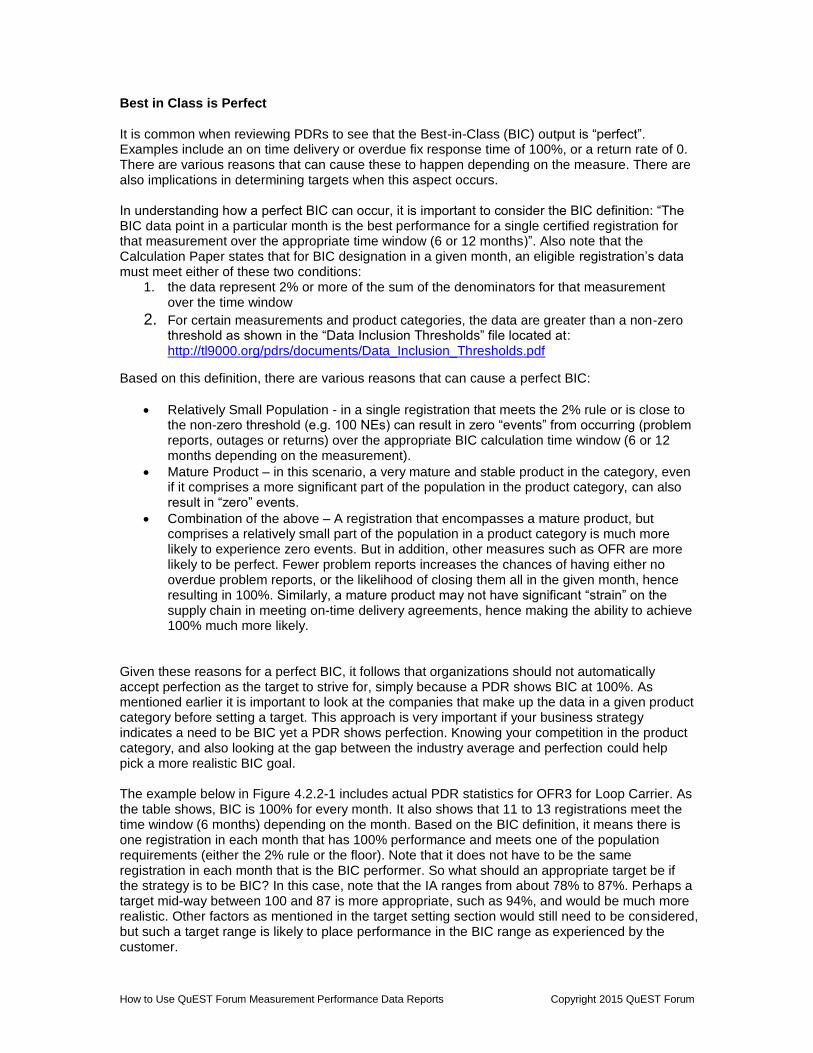
Given these reasons for a perfect BIC, it follows that organizations should not automatically accept perfection as the target to strive for, simply because a PDR shows BIC at 100%. As mentioned earlier it is important to look at the companies that make up the data in a given product category before setting a target. This approach is very important if your business strategy indicates a need to be BIC yet a PDR shows perfection. Knowing your competition in the product category, and also looking at the gap between the industry average and perfection could help pick a more realistic BIC goal. The example below in Figure 4.2.2-1 includes actual PDR statistics for OFR3 for Loop Carrier. As the table shows, BIC is 100% for every month. It also shows that 11 to 13 registrations meet the time window (6 months) depending on the month. Based on the BIC definition, it means there is one registration in each month that has 100% performance and meets one of the population requirements (either the 2% rule or the floor). Note that it does not have to be the same registration in each month that is the BIC performer. So what should an appropriate target be if the strategy is to be BIC? In this case, note that the IA ranges from about 78% to 87%. Perhaps a target mid-way between 100 and 87 is more appropriate, such as 94%, and would be much more realistic. Other factors as mentioned in the target setting section would still need to be considered, but such a target range is likely to place performance in the BIC range as experienced by the customer.
How to Use QuEST Forum Measurement Performance Data Reports Copyright 2015 QuEST Forum
Figure 4.2.2-1 – Example of Perfect Performance in OFR3
Worst in Class (WIC) is much worse than average
How Can “Worst in Class” Be Much Worse Than the “Industry Average?” The Worst in Class (WIC) can also be much worse than the Industry average with understandable reasons. The Worst-in Class data point, in a particular month, is the worst performance for a single certified registration for that measurement over the appropriate time window (6 or 12 months depending on the measurement) from all eligible data submitted.” For the WIC output, in order for data from a registration to be eligible, one or more of the following three conditions must be met:
1. The data represent 2% or more of the sum of the denominators for that measurement over the time window.
2. For certain measurement and product categories, the data are greater than a non-zero threshold as shown in Table 6 of the Calculation Paper (e.g. 10000 terminations for return rates for 3.2.2.2 Loop Carrier).
3. The data from the registration represent 5% or more of the sum of the numerators for that measurement over the time window.
Given this definition, it is very possible for a registration with a small population to meet eligibility requirements 1 or 2. In this case even a few problems can drive poor performance. Any “event” that occurs for such a small population can have a dramatic negative impact on the WIC output. And since the data may make up only a fraction of all the data in a product category, the registration will have minimal impact on the averages, and WIC will appear to be much worse than the IA. It is also possible that only eligibility requirement 3 is met. In this scenario it is possible that even if the registration population contributes a modest amount to the overall product category population, the WIC can appear much worse than the average. Again, looking at the previous example for OFR3, this same example shows WIC being much less than the industry average. WIC ranges from about 5.5%, whereas the IA ranges from about
How to Use QuEST Forum Measurement Performance Data Reports Copyright 2015 QuEST Forum
78% to 86%. Again, note that in this particular situation, the WIC registration can indeed be different each month.
How can products be worse than “Worst in Class”?
There are a several ways that a given product can be measuring worse than the TL 9000 Worst in Class value. Many of the same reasons could cause a given product to be measuring better than Best in Class, but that is typically not noticed as often. These reasons are probably not the only reasons that an organization might find its measurement to be worse than the Worst in Class value; however, these reasons do occur somewhat frequently and are likely explanations.
1) There are some volume thresholds that are used to include or exclude organizations from the Worst in Class calculations. If an organization does not have sufficient volume, their data may not have been used to compute the Worst in Class value.
2) An organization may be submitting data for more than one product within a product category. The Worst in Class designation will be for the average of all products from each organization within the product category. If there is product-to-product variation in the results, that organization may have one product that is worse than the industry Worst in Class and another that is better than the industry Worst in Class. It is possible that an organization that is not the Worst in Class as a whole may have an individual product within a product category that is worse than the Worst in Class.
3) The Worst in Class value is a long-run average, either a six or a twelve month average depending on the measurement. If the organization is comparing its average for a different length of time than the length used to compute Worst in Class, that organization may find that it has some average values that are worse than the Worst in Class value. For example, to compare FRT WIC, an organization would need to compare WIC values
to their 6 month FRT average. These calculation rules can be found in the Calculation Paper.
How can monthly averages spike or dip?
4) Monthly averages can have variable spikes in the data that may seem out of place for the norm but still can be valid. For example, a circuit card bust can drive up return rates. Measures with typically low counts can show wide variability when a rash of events occur such as outages. For some measures like outages, major fluctuations in PDR outputs can occur due to major events. Outage data is known to have spikes that can occur because long outages can severely impact the monthly data. Since that spike could be counted in the averages for a year, the data can swing back to the previous averages after that month rolls off the charts. Changes in populations submitting the data can cause apparent anomalies such as the WIC leaving or a new BIC coming into the calculation as reflected in a change in the data counts.
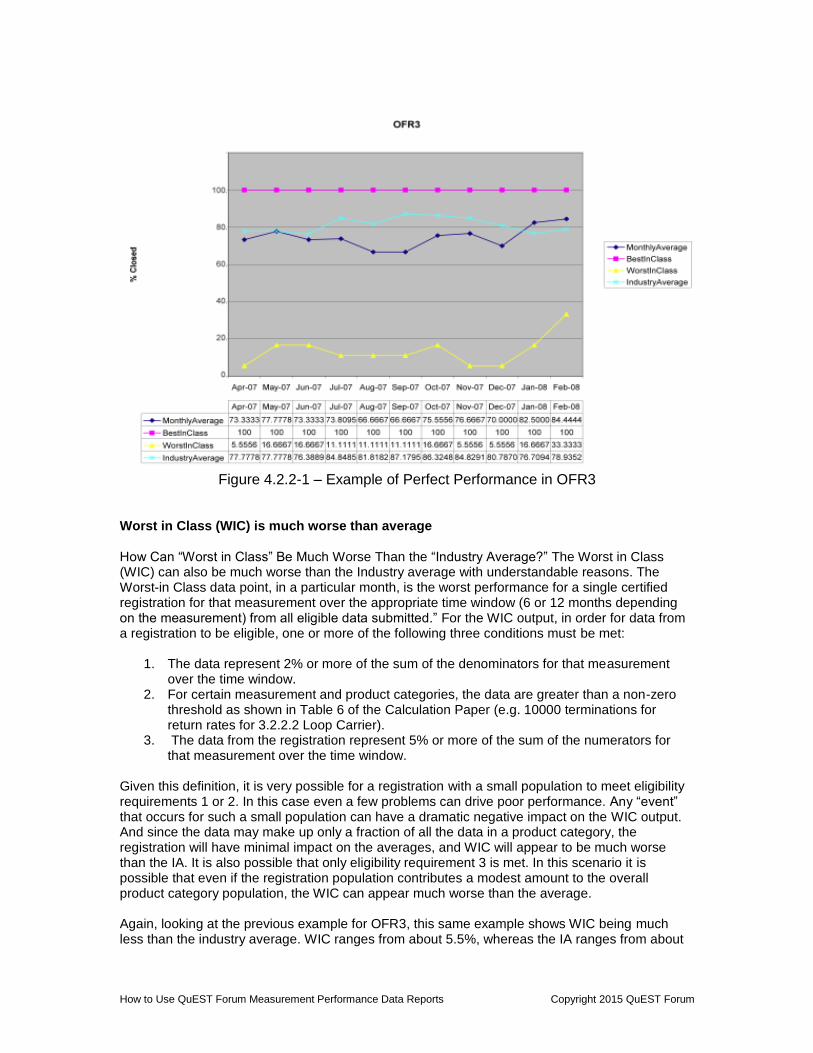
5) Consider Figure 4.2.2-2 below with System Outage from Product Category 3.2.2.1.2.1 Optical Transport Systems. BIC has a perfect December with no outages. December is known for fewer system outages as minimal upgrades and field activity is typically performed during this month. Since outages are known for spikes and dips in the data, the Monthly Average displays that variation in the chart. The IA remains moderately flat once the 11 of the Monthly Average counts are excluded. These numbers are not included because they did not meet the criteria for being included with the most likely reason being a gap in the Industry numbers. Gaps occur as organizations may discontinue a product or fail to send in the data. Probations and suspensions will occur for late data submissions.
How to Use QuEST Forum Measurement Performance Data Reports Copyright 2015 QuEST Forum
Measurement-SO3 7/2006 8/2006 9/2006 10/2006 11/2006 12/2006
MonthlyAverage 0.0040330 0.0021358 0.0010849 0.0019784 0.0005955 0.0002202
BestInClass 0.0000014 0.0000012 0.0000012 0.0000012 0.0000004 0.0000000
WorstInClass 0.0013355 0.0018348 0.0020769 0.0025764 0.0026765 0.0026906
IndustryAverage 0.0001934 0.0003734 0.0007497 0.0009207 0.0009628 0.0009817
MonthlyAveCount 15 15 15 15 15 15
BestInClassCount 4 5 6 6 6 6
WorstInClassCount 4 5 6 6 6 6
IndustryAveCount 4 5 6 6 6 6
Figure 4.2.2-2 – SO3 Product Category 3.2.2.1.2.1
How can a long run average undergo a large sudden change? The BIC, IA, and WIC are all multi-month averages. These long run averages help smooth the variability in the data. Despite the smoothing, the data is sometimes so variable that sudden changes still appear in the long run averages. The WIC is the most susceptible to these changes, but such step function changes can occur in any of the averages. There are several potential causes of these step function changes.
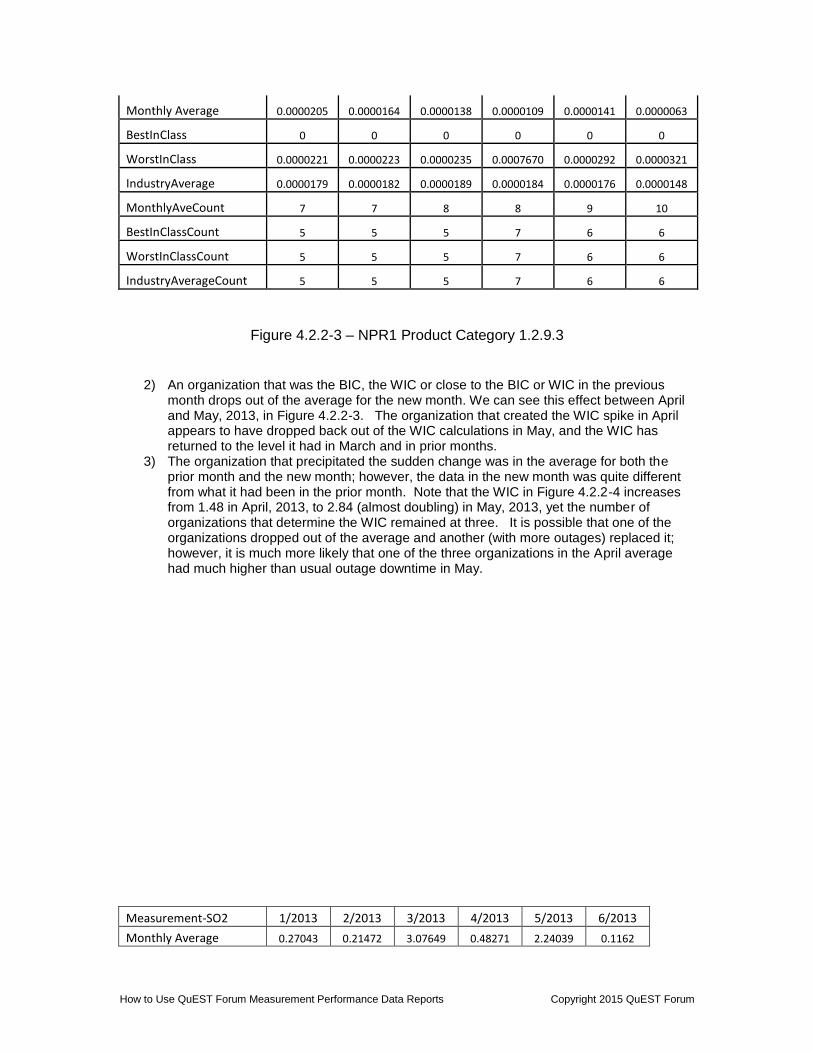
1) A new organization whose results are substantially different (better or worse) from the organizations that had been included the previous month becomes part of the average for the new month. From Figure 4.2.2-3, the WIC for Access Routers (NPR1 measurement) is approximately .000022 from January through March, 2013 with five organizations in the calculation. In April, two more organizations join the BIC, IA and WIC measurements. This addition has minimal effect on the BIC and the IA, but creates more than a threefold increase in the WIC. Most likely, one of these two new organizations was substantially worse than the others and became the new WIC. It probably had a relatively small share of the market and hence had minimal effect on the IA. A much higher than typical rate for critical problem reports might be one of the reasons that it has a small market share.
Measurement-NPR1 1/2013 2/2013 3/2013 4/2013 5/2013 6/2013
How to Use QuEST Forum Measurement Performance Data Reports Copyright 2015 QuEST Forum
Monthly Average 0.0000205 0.0000164 0.0000138 0.0000109 0.0000141 0.0000063
BestInClass 0 0 0 0 0 0
WorstInClass 0.0000221 0.0000223 0.0000235 0.0007670 0.0000292 0.0000321
IndustryAverage 0.0000179 0.0000182 0.0000189 0.0000184 0.0000176 0.0000148
MonthlyAveCount 7 7 8 8 9 10
BestInClassCount 5 5 5 7 6 6
WorstInClassCount 5 5 5 7 6 6
IndustryAverageCount 5 5 5 7 6 6
Figure 4.2.2-3 – NPR1 Product Category 1.2.9.3
2) An organization that was the BIC, the WIC or close to the BIC or WIC in the previous
month drops out of the average for the new month. We can see this effect between April and May, 2013, in Figure 4.2.2-3. The organization that created the WIC spike in April appears to have dropped back out of the WIC calculations in May, and the WIC has returned to the level it had in March and in prior months.
3) The organization that precipitated the sudden change was in the average for both the prior month and the new month; however, the data in the new month was quite different from what it had been in the prior month. Note that the WIC in Figure 4.2.2-4 increases from 1.48 in April, 2013, to 2.84 (almost doubling) in May, 2013, yet the number of organizations that determine the WIC remained at three. It is possible that one of the organizations dropped out of the average and another (with more outages) replaced it; however, it is much more likely that one of the three organizations in the April average had much higher than usual outage downtime in May.
Measurement-SO2 1/2013 2/2013 3/2013 4/2013 5/2013 6/2013
Monthly Average 0.27043 0.21472 3.07649 0.48271 2.24039 0.1162
How to Use QuEST Forum Measurement Performance Data Reports Copyright 2015 QuEST Forum
BestInClass 0 0 0 0 0 0
WorstInClass 1.86336 1.72952 1.74293 1.48222 2.83992 2.71446
IndustryAverage 0.41977 0.41219 0.73248 0.7472 0.96518 0.89602
MonthlyAveCount 4 4 4 4 5 6
BestInClassCount 3 3 3 3 3 3
WorstInClassCount 3 3 3 3 3 3
IndustryAverageCount 3 3 3 3 3 3
Figure 4.2.2-4 – SO2 Product Category 1.2.9.3
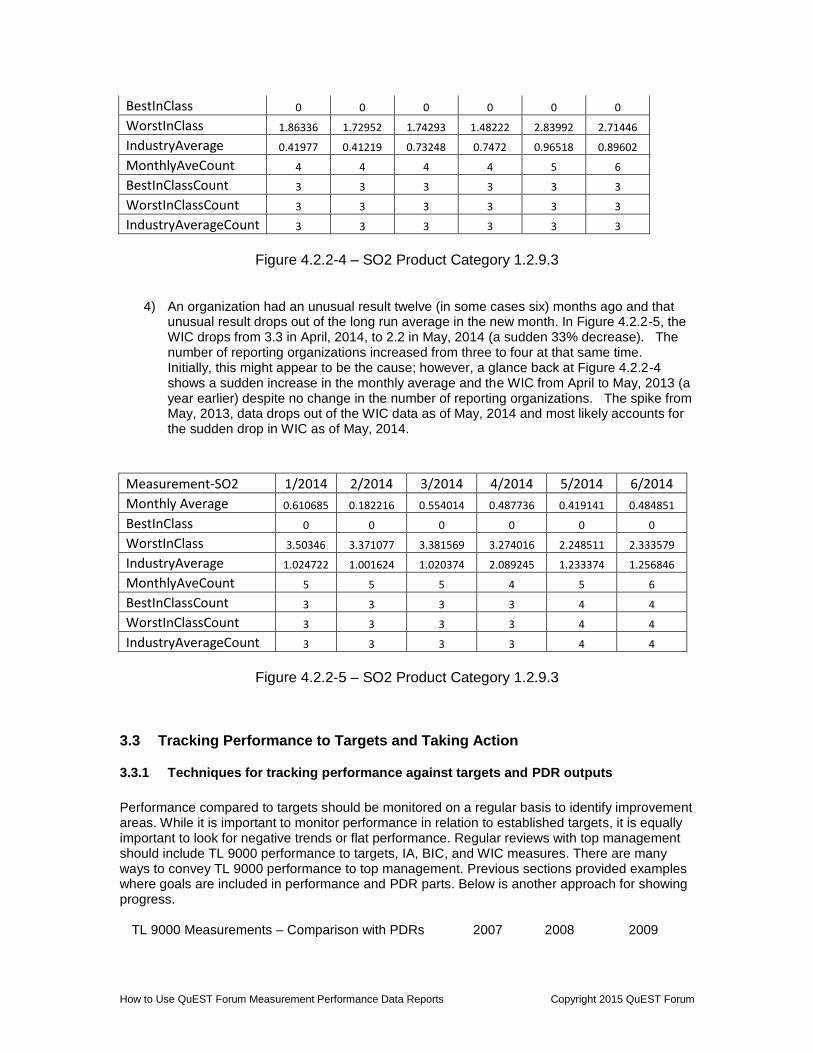
4) An organization had an unusual result twelve (in some cases six) months ago and that unusual result drops out of the long run average in the new month. In Figure 4.2.2-5, the WIC drops from 3.3 in April, 2014, to 2.2 in May, 2014 (a sudden 33% decrease). The number of reporting organizations increased from three to four at that same time. Initially, this might appear to be the cause; however, a glance back at Figure 4.2.2-4 shows a sudden increase in the monthly average and the WIC from April to May, 2013 (a year earlier) despite no change in the number of reporting organizations. The spike from May, 2013, data drops out of the WIC data as of May, 2014 and most likely accounts for the sudden drop in WIC as of May, 2014.
Measurement-SO2 1/2014 2/2014 3/2014 4/2014 5/2014 6/2014
Monthly Average 0.610685 0.182216 0.554014 0.487736 0.419141 0.484851
BestInClass 0 0 0 0 0 0
WorstInClass 3.50346 3.371077 3.381569 3.274016 2.248511 2.333579
IndustryAverage 1.024722 1.001624 1.020374 2.089245 1.233374 1.256846
MonthlyAveCount 5 5 5 4 5 6
BestInClassCount 3 3 3 3 4 4
WorstInClassCount 3 3 3 3 4 4
IndustryAverageCount 3 3 3 3 4 4
Figure 4.2.2-5 – SO2 Product Category 1.2.9.3
3.3 Tracking Performance to Targets and Taking Action
3.3.1 Techniques for tracking performance against targets and PDR outputs
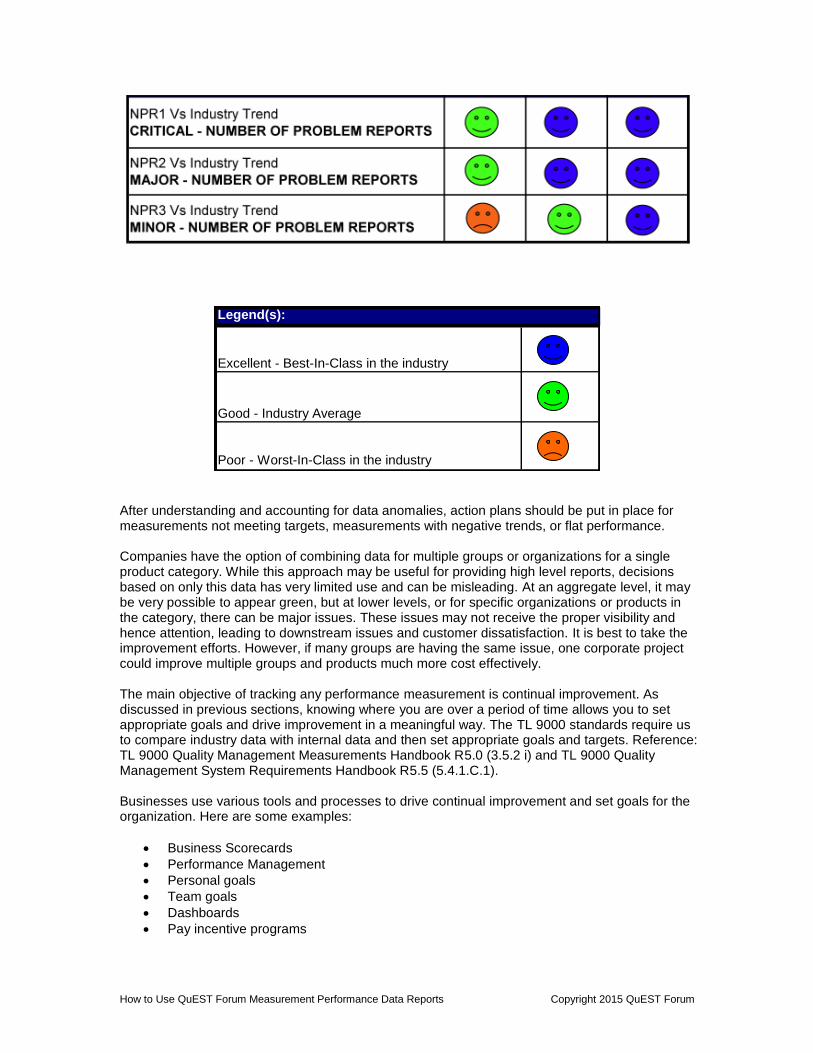
Performance compared to targets should be monitored on a regular basis to identify improvement areas. While it is important to monitor performance in relation to established targets, it is equally important to look for negative trends or flat performance. Regular reviews with top management should include TL 9000 performance to targets, IA, BIC, and WIC measures. There are many ways to convey TL 9000 performance to top management. Previous sections provided examples where goals are included in performance and PDR parts. Below is another approach for showing progress.
TL 9000 Measurements – Comparison with PDRs 2007 2008 2009
How to Use QuEST Forum Measurement Performance Data Reports Copyright 2015 QuEST Forum
After understanding and accounting for data anomalies, action plans should be put in place for measurements not meeting targets, measurements with negative trends, or flat performance. Companies have the option of combining data for multiple groups or organizations for a single product category. While this approach may be useful for providing high level reports, decisions based on only this data has very limited use and can be misleading. At an aggregate level, it may be very possible to appear green, but at lower levels, or for specific organizations or products in the category, there can be major issues. These issues may not receive the proper visibility and hence attention, leading to downstream issues and customer dissatisfaction. It is best to take the improvement efforts. However, if many groups are having the same issue, one corporate project could improve multiple groups and products much more cost effectively. The main objective of tracking any performance measurement is continual improvement. As discussed in previous sections, knowing where you are over a period of time allows you to set appropriate goals and drive improvement in a meaningful way. The TL 9000 standards require us to compare industry data with internal data and then set appropriate goals and targets. Reference: TL 9000 Quality Management Measurements Handbook R5.0 (3.5.2 i) and TL 9000 Quality Management System Requirements Handbook R5.5 (5.4.1.C.1). Businesses use various tools and processes to drive continual improvement and set goals for the organization. Here are some examples:
Business Scorecards
Performance Management
Personal goals
Team goals
Dashboards
Pay incentive programs
Legend(s):
Excellent - Best-In-Class in the industry
Good - Industry Average
Poor - Worst-In-Class in the industry
How to Use QuEST Forum Measurement Performance Data Reports Copyright 2015 QuEST Forum
3.3.2 When do I take Action?
Taking action is usually a business decision based on many factors. When you have the proper data and analysis your decisions are more accurate and effective. As detailed earlier, it is very important to validate PDR data when using it to set targets. It is equally important when taking action. When looking at the TL 9000 data it is important to understand what makes up the data.
Are 5 or 50 companies reporting?
Are your key competitors included in the data?
Is the measurement stable?
Is the data easily affected by one company?
Is the data easily affected by one submission?
Is this a mature product or process? Once you have decided the data is meaningful, you can set targets and goals for improvement. Goals should be aggressive but not impossible. For a new products or processes, some companies may drive an annual improvement such as 68%. However, mature products may set goals to maintain best in class. Whatever the case, annual improvement goals should be set based on data, performance and business to achieve continual improvement.