Embed Size (px)
Citation preview

EUROGRAPHICS 2019 E Galin and M Tarini Education Paper
How to Write a Visualization Survey Paper A Starting Point
Liam McNabb and Robert S Laramee
1Visual and Interactive Computing Group Swansea University Wales
AbstractThis paper attempts to explain the mechanics of writing a survey paper in data visualization or visual analytics It serves asa useful starting point for those who have never written a survey paper or have very little experience A literature review orsurvey paper is often considered the starting point of a PhD candidatersquos scientific degree However there are no dedicatedpapers that focus on guidelines for the planning or writing of a survey paper or literature review in visualization or visualanalytics We provide guidelines and our recommendations for a foundational structure on which to build a survey paperwhilst also considering intermediate goals and offer helpful advice to improve the survey process and literature analysis Theresult is a useful starting point for those wishing to write a survey paper or state-of-the-art (STAR) review in visualization orvisual analytics The guidelines and recommendations we make can also be generalized to other areas of computing and science
An abstract is a required feature of a survey paper and should identity the topic of the literature review A good abstractaddresses why the given topic is interesting and why it is helpful A good abstract features the following elements (1) topicintroduction (2) the motivation (3) the goal of the review and the benefits the review provides to the reader A good literaturesurvey offers a helpful classification of the literature mature areas of research and open unsolved problems in visualization orvisual analytics
CCS Conceptsbull General and reference rarr Surveys and overviews Reference works bull Human-centered computing rarr Visual analyticsInformation visualization
1 Introduction and Motivation
A survey paper is an incredibly useful tool for both newcomersand experts of a given field Twenty years ago Jim Blinn statedTherersquos lots of other journals and it takes more and more effortto make sure that you know whatrsquos happening [Bli98] One of asurvey paperrsquos primary goals is to assist the reader in the hunt forpreviously published research papers on a given topicWe discussa general approach to planning and writing a typical survey papersection-by-section and provide more details and guidelines as toappropriate content for each section
The target audience of this paper is a PhD student in their firstyear and their supervisor This paper presents and follows a ver-satile template which the reader can follow to accelerate and fa-cilitate the creation of a survey paper In addition we discuss im-portant considerations in the preparation phase of a survey paperFor this we use the symbol (u) to designate aspects that are ex-amined as part of the preparation but are not necessarily discussedin the actual text itself The guidelines and recommendations arebased on our experience of reading and writing survey papers in vi-sualization [PVHlowast03LHDlowast04LHZP07PL09MLPlowast10ELClowast12LLClowast12 BKClowast13 CLKH14 TRBlowast18 FL18 RL18 RL19] as well
as meta-surveys or surveys of surveys (SoS) [ML17 AAMlowast17AL18 AL19]
A well written introduction motivates the topic including appli-cations of the topic why the research direction is important andwhat the contributions of the survey or state-of-the-art (STAR) re-port are Here we use the term STAR to refer to literature re-views with a special focus on recent literature eg within the last10 years Survey papers are more comprehensive and may includeliterature from all years
The introduction and motivation describe some of the big re-search challenges that are faced by the topic covered by the sur-vey Some generic aspects that can be considered common chal-lenges are the rapidly increasing size and complexity of the dataheterogeneous data sources uncertainty challenges associated withequipment such as cost or speed cognition and perception under-standing or representation of observations the limitations of exist-ing software and hardware or software performance limitations
11 Contributions
The contributions are clearly presented in either the introduction(and motivation) section or a subsection A reader can recognize the
ccopy 2019 The Author(s)Eurographics Proceedings ccopy 2019 The Eurographics Association
Liam McNabb and Robert S Laramee How to Write a Visualization Survey Paper A Starting Point
importance and novelty of any paper by the end of the introductionand the insight and benefits that can be gained from reading it Werecommend authors strive for approximately three contributionsThese contributions are described in conjunction with the rest ofthe first section to make it clear how the survey paper fits into thevisualization fieldrsquos landscape Examples of a typical contributioninclude
bull A novel classification of the literature (how your classificationdiffers from previous surveys or whether the survey is the firstof itrsquos kind in the field)bull A compilation of future challenges or trends in the domainbull The identification of both mature and less explored research di-
rections in the field
A good review paper considers key questions in the field Whathas been published so far Are there any controversies debates orcontradictions that should be brought to light Which methodolo-gies have researchers used and which appear to be best Who arethe leading experts in the field And how the topic fits into thelandscape of visualization By analyzing questions like these yoursurvey presents some clear contributions to discuss
The contributions of this paper include
1 The first guidelines (to our knowledge) on how to write a surveypaper in data visualization or visual analytics
2 Guidelines on the process of preparing a literature survey3 A structured survey paper template that can be followed with
in-depth guidelines describing the content of each section
Temporal Planning u We believe a high quality full survey pa-per can take approximately a full year (part-time) to incrementallyprepare and write including the literature search A significant por-tion of this time concentrates on gathering the related literature on agiven literature review topic Due to the length of full survey papers(20-30 pages) it is time-consuming and difficult to undertake mul-tiple internal full paper reviews and revisions therefore it is helpfulto distribute the preparation discussion and intermediate feedbacksessions periodically over the preparation time frame to reduce thedrafting and corrections process in the final stages A tested strat-egy can separate the individual paper browsing and summarizationprocess from the main survey paper organization [Lar10] Individ-ual research paper summaries can be written on a weekly basis forthe first six months yielding roughly 24 summarized topic papersbefore any final decisions have been made on the organization orliterature classification This provides a good basis for potential pa-per classifications to develop
12 Challenges of Writing a Survey
We identify seven main challenges associated with writing a surveypaper
1 Managing the amount of previously published literature (dis-cussed throughout this paper)
2 Identifying a starting point (the purpose of this paper)3 Deciding on a topic (see Scope Section 15)4 Performing a search (see Search Methodology Section 13)5 Interpreting individual research papers (see Section 31)
Literature Sources
Google Scholar [Goo16]
IEEE Xplore Digital Library [IEE16]
ACM Digital Library
Vispubdata [IHKlowast17]
The Annual EuroVis Conference
IEEE TVCG Journal
IEEE Pacific Visualization Symposium
IEEE VAST Conference
The Annual Eurographics Conference
The Eurographics Digital Library
Journal of Visual Languages amp Computing
Information Visualization Journal
Computer Graphics Forum
Computer amp Graphics
ACM Computing Surveys
Table 1 A shortlist of literature sources
6 Deriving a classification of literature on the given topic (see Sec-tion 32)
7 Determining related unsolved problems and future challenges(see Section 5)
In the following sections we address some of these central chal-lenges
13 Literature Search Methodology u
It is important to clearly describe how you search for the paperscited in the survey When a reader browses the literature reviewit is likely that you have found research papers that they may nothave seen A new PhD student usually has not yet discovered allof the relevant conferences and journals to search The literaturesearch methodology provides the names of digital libraries searchengines search terms and literature sources used to find literaturein your survey paper If we are looking for research papers on thetopic of treemaps we can use the Google Scholar search engine forexample [Goo16] to search the term treemap This gives us (atthe time of writing) over 16000 related search results By doing thesame using the IEEE Xplore Digital Library [IEE16] we get 115items and using vispubdata [IHKlowast17] we get 58 items For visu-alization purposes the three previously-mentioned search enginesare a great tool Combined with the use of Google Scholarrsquos Citedby option to find related work you should be able to gather afairly complete set of papers A complete list of sources to searchis provided in Table 1
The other search consideration is a manual search When youhave found one matching paper it is likely that you will find anumber of related research papers in the related work of the givenmatch This can be especially useful if there are related survey pa-pers If you find the majority of papers this way providing a break-down of conferences and journals may be a beneficial method ofpresenting your literature search The goal is to provide enoughinformation to make your literature search thorough and repro-ducible
ccopy 2019 The Author(s)Eurographics Proceedings ccopy 2019 The Eurographics Association
Liam McNabb and Robert S Laramee How to Write a Visualization Survey Paper A Starting Point
14 Literature Classification Overview
Organizing the research papers in your survey is a central topicin any literature review Classification dimensions can be derivedfor the task Each of your classification dimensions is presented inthis section One dimension of a literature classification is often alist of (subjects or) topics Describe each topic in the classificationhow each research paper is classified and possibly some excep-tions where research fits into multiple subject categories A high-quality literature classification is often composed of more than onedimension eg subject category and data dimensionality By talk-ing about dimensions separately you allow the reader to understandwhat is presented in the classification before discussing the individ-ual topics and papers Images or tables are a good way of conveyingan overview
Refer to McNabb and Larameersquos Survey of Surveys for an ex-ample [ML17] One axis consists of an adapted Information Visu-alization pipeline A second dimension is a set of topic clustersA section is presented to discuss how their pipeline differs fromCard et alrsquos original [CMS99] and why modifications have beenmade The topic clusters are discussed in a separate section Howthe subjects were gathered and selected is explained Both sectionsprovide a visual representation to aid in the understanding of eachmain axis
It is important to clearly explain each axis of your proposed lit-erature classification as this is one of the most important aspectsof a survey paper which can clearly impact whether a survey papermakes it through the review process Please review Section 32 fora detailed guide to developing a classification
15 Survey Scope u
Defining the scope of a survey ndash subject categories or the topicsit covers (and does not cover) can be a very challenging aspect ofwriting any literature review The scope defines the topic bound-aries of literature that are included or excluded from the survey Ifthe scope is too broad then the survey includes too many researchpapers to manage If the scope is too narrow then not enough liter-ature may be included for a good classification from which deduc-tions may be drawn Therefore it is important to accurately des-ignate what does and does not meet the scope of your paper Thescope is flexible as long as you clarify the scope boundaries clearlyFor example if you paper reviews a specific topic of interest (iea technique or application) then it makes sense to explicitly statethat this is the case
Aim to create a scope that encompasses roughly 40-50 researchpapers If you cannot see any avenues of narrowing your scopeyear of publication is always an option and can be used as a soft-cap for example Alsallakh et al with their state-of-the-art in setsand set-typed data [AMAlowast14] Limiting your survey to the mostrecent 10 years also turns it into a STAR Doing this can be a wayof reducing the focus research papers while still including olderpapers for other types of analysis if necessary Provide exampleswhen pointing out what is and isnrsquot in scope Lipsa et al providean informative example of a scope [LLClowast12] The survey clearlypresents papers that do or do not meet the scope criteria with givenexamples of papers
Figure 1 The colored time flattening operation for space-timecubes An example depicting a technique using visual rerpresen-tation Image courtesy of Bach et al [BDAlowast14] Refer to Section41
A very common problem is defining a scope that is too broad Werecommend a scope that includes approximately 50 research papersper PhD student and supervisor pair on the author list You can useGoogle Scholar and the other search engines described in Section13 to make early assessments of scope For example if you enterIsosurface into a search engine for research papers you will geta broad scope including over 100 research papers The scope couldbe narrowed by focusing on isosurfaces for time-dependent data
Survey Type u It is important to consider the type of surveythat you would like to present within your scope A lsquoLiterature Re-viewrsquo refers to a more comprehensive list of papers on a given re-search direction whilst a lsquoState-of-the-Artrsquo (STAR) report refers tothe more recent research or techniques Some examples of this in-clude Beck et al with their state-of-the-art in visualizing dynamicgraphs [BBDW14] and Laramee et al with the state-of-the-art inflow visualization [LHDlowast04] On top of this surveys can focus ontask taxonomies rather than the field itself Examples of this in-clude Kerracher et al and their task taxonomy for temporal graphvisualization [KKC15] or Schulz et al with their design space ofvisualization tasks [SNHS13] These are important considerationsto discuss with any potential co-author
16 Survey Paper Organization
The organization of the survey refers to the order in which researchpapers and subject topics are presented in the main body of theliterature review Organization of a survey can be trivial when theclassification has been developed Research topics and papers canbe discussed in linear order based on the primary dimension inyour classification where the secondary dimension will representthe sub-sections of your survey In each section a sub-organizationcan be applied either based on another classification or publicationyear Tong et al present their classification dimensions and followchronological order when presenting their summarized research pa-pers in each sub-section [TRBlowast18]
2 Related Work
There are a number of other related educational papers readers mayfind very useful Sastry and Mohammed develop a tool named asummary-comparison matrix (SCM) to aid in the organization andextraction of information in research papers [SM13] Our paper dif-fers to this by contextualizing the entire survey writing processLaramee presents a starting point on how to write an individual
ccopy 2019 The Author(s)Eurographics Proceedings ccopy 2019 The Eurographics Association
Liam McNabb and Robert S Laramee How to Write a Visualization Survey Paper A Starting Point
visualization research paper [Lar10] The paper covers each as-pect of the individual paper including the introduction methodimplementation and performance The paper also covers impor-tant considerations such as planning procedure diagrams figuresand images and supplementary material This paper is consideredsibling reading and is encouraged for discussions on paper writ-ing titles latex and collaboration Laramee also presents guide-lines on how to read and summarize a visualization research pa-per [Lar11] We extend this in Section 31 to guide uses in ex-tracting the essentials of a survey paper Daniel Patel provide aneducational paper focused on the requirements of an article-basedPhD in visualization [PGB11] Munzner provides an overview ofpitfalls authors may fall into leading to rejection during the re-viewing process [Mun08] Although closer to complimentary ma-terial Laramee produces an audio-visual representation of the pa-per topic The video gives a clear structure to design your surveypaper [Lar16] There are several pieces of software that can aid inthe collection and usage of literature reviews including MendeleyJabRef and Papers [men18 jab18 Dig19 ref18]
21 Background
Depending on your chosen topic it may be appropriate to include abackground section A background section reviews the history of atopic such as how a technique originally emerged and itrsquos evolutionor how its use has changed Nusrat and Kobourov give an excellentexample by looking at the evolution of cartograms in the 19th and20th century [NK16] Borgo et al present the history of glyphs andtheir applications [BKClowast13]
3 Presenting the Main Literature Survey
Section 3 discusses individual research papers developing a litera-ture classification and different types of paper classification
31 Summarizing An Individual Research Paper
This sub-section is adapted from the paper by Laramee and focuseson extracting essential information from a single visualization pa-per [Lar11] This is a helpful exercise during both the preparationand writing phases of a literature review It also facilitates the de-velopment of a literature classification (Section 32) We extend thisto provide guidance when summarizing an individual survey paperbased on the experience gathered writing the SoS [ML17] This ishelpful for describing survey papers that may be included in therelated work section (Section 2) When summarizing an individualresearch paper the core elements to extract are the concept relatedwork data characteristics visualization techniques and applicationdomain
The focus elements of a survey paper vary in what may be con-sidered the important essentials or aspects For example it is un-likely that a survey has a regular set of data characteristics For asurvey we focus on the concept the scope the classification clas-sification dimensions and unsolved problems or future work Hereis a sample survey summary of space-time cube operations by Bachet al [BDAlowast14]
Title A Review of Temporal Data Visualizations Based on Space-TimeCube Operations by Bach et al [BDAlowast14]
Figure 2 Keimrsquos Classification of information visualization tech-niques Courtesy of Keim [Kei02]
1 The Concept Bach et al survey a variety of temporal data visualizationtechniques and discuss how their operations represented by space-timecubes are used in the context of a volume visualization from the 2D+timemodel [BDAlowast14]
2 The Scope The paper discusses common space-time cube operations in-cluding time-cutting time flattening time juxtaposition space cuttingspace flattening sampling and 3D rendering Bach et al then presentthe taxonomy of space-time cube operations they designed before pro-viding the reader a selection of multi-operation systems
3 Classification The taxonomy (ltFigure 24 of original papergt) presents aclassification of elementary space-time cube operations such as drillingcutting and chopping These are broken down into sub-categories withschematic illustrations in order to enable the user to easily understandwhat effect the operation has For example the flattening section is bro-ken down into planar flattening and non-planar flattening Planar flatten-ing is sub-divided into orthogonal flattening and oblique flattening
4 Figure ltFigure 24 of original papergt5 Classification Dimensions
X-Axis Operations Time SpaceY-Axis Extraction [Point Extraction Planar Drilling Planar Cutting Non-
Planar Cutting Planar Chopping Non-Planar Chopping]Geometry Transformation [Rigid Transformation Scaling BendingUnfolding]Content Transformation [Recoloring Labeling Re-positioningShading Filtering Aggregation]Flattening Filling
bull Supplementary URL httpspacetimecubeviscombull Papers There are 91 Papers cited in the survey (1970-2013)
6 Unsolved ProblemsFuture Research There are many open research ar-eas discussed Some of these include interaction techniques such as fo-cus+context applied to different operations research into operations forextended data dimensions and understanding which operation is mostappropriate for a given task
You can see the initial summary follows a template This is use-ful for treating the survey papers systematically including collect-ing meta-data in a consistent and helpful manner When the papersstart to be placed into the survey the template format can be ad-justed into more naturally written text
32 Developing a Literature Classification (How To) u
Deriving a literature classification is one major challenge of writinga survey A classification categorizes each research paper such that
ccopy 2019 The Author(s)Eurographics Proceedings ccopy 2019 The Eurographics Association
Liam McNabb and Robert S Laramee How to Write a Visualization Survey Paper A Starting Point
similar papers fall into the same group Deriving groups categoriesand dimensions for your classification requires careful thought
One property of a good classification is that it is easy to properlyplace research papers into categories If you have great difficultyplacing individual research papers into the categories identified inyour classification this may be a sign that it requires adjustment
33 Identifying Classification Dimensions u
There has been a lot of work invested in generating tax-onomies A good classification dimension eg subject-categorydata-dimensionality etc is descriptive and easy to communicateYour classification may change during survey drafting If you findit difficult to insert literature into a classification modificationis always an option We recommend aiming for a 2D classifica-tion to begin with If you are looking for ideas adapting exist-ing taxonomies or principles can yield useful classification top-ics For example Keimrsquos technique taxonomy [Kei02] is usedto group visualization techniques into 5 key categories (standard2D3D displays geometrically-transformed displays iconic dis-plays dense pixel displays and stacked displays) (See Figure 2)This is used by Ko et al [KCAlowast16] in their survey of finan-cial data visualization where each paper is mapped to these dif-ferent techniques that are used within the literature Another op-tion is automatic taxonomy generation There is a lot of workon text extraction [DGBPL00 PBB02] and taxonomy generation[BOS09 TWCL10 OGG07 VCP07 MFSlowast10 COD18]
We recommend looking for natural recurring topic clusters Ifyou follow the temporal planning guide suggested in Section 1 andextract meaningful meta-data you may produce some classificationcandidates by brainstorming Some other candidate classificationsare subject category data dimensionality visualization techniquedesign dimensionality field challenge type user task type applica-tion domain data processing size performance visualization de-sign type data type and field of view
User tasks are a useful and frequently-used classification dimen-sion They are the main focus of many survey papers [APS14BM13 SNHS13] For task taxonomies we recommend readingKerracher and Kennedyrsquos work that focuses on the process andconsiderations for visualization task classifications [KK17] As agood starting point for tasks Schneidermanrsquos task by data-typetaxonomy is recommended [Shn96] where overview zoom filterdetails-on-demand relate history and extract are presented as ma-jor visualization tasks
34 Literature Classification Types u
We base this discussion on the work of McNabb and Laramee[ML17] We identify three important characteristics of classifica-tions dimension structure and mapping schema For this discus-sion D denotes a classification dimension
The dimensionality organizes the space in which the classifica-tion is laid out for example in a table or matrix A typical classifi-cation usually has no more than 3 dimensions (2 axes + 1 additionalvisual attribute) Common ways to represent an additional attributeare through color shape or symbols More than 3 dimensions is
D1 D1 D2
L1 L1 3 3
Ln L2 3 3D2L2 Ln 3 3
(A) (B)
L1L4L5
(C) L3L6L7L8D1L2
Figure 3 Examples of classification schemes using unique-mapping D refers to a classification dimension and L refers to areviewed item (in most cases the literature reviewed)
D1 D1 D2
L1L1L2
L1 3 3 3 3
L2 L2 L2 3 3 3 3D2
L1L1L2
Ln 3 3
(A) (B)
L1L4L5L6L7
(C) L3L6L7L8D1L2 L6L7
Figure 4 Examples of classification schemes using 1-N mappingD refers to a classification dimension and L refers to a revieweditem
definitely possible however it may be worth considering multiplerepresentations at this point if the classification becomes too com-plex
A structure represents the organization of the classificationThis category is sub-divided into two types flat or hierarchicalFlat structures usually represent subject categories (D) with a dis-crete linear ordering Johansson and Forsell present an example ofthis with their evaluation of parallel coordinates [JF16] where theuser-task is mapped for each reviewed literature A hierarchy pro-vides the subject categories (D) with a more complex arrangementby grouping overlapping subjects together Draper et al use this tocategorize radial visualization techniques [DLR09]
Mapping schema describes how the surveyrsquos reviewed litera-ture (L) is mapped to classification dimensions (D) We introduceL to refer to a reviewed item (in most cases the literature beingreviewed) This is split into three categories Unique-mapping 1-nmapping and indirect mapping A unique-mapping schema assignseach reviewed item (L) once for every dimension eg subject cate-gory data dimensionality etc (D) This mapping schema is suitablefor finding areas in the field with extensive or limited work whichmay guide researchers to immature areas for new research
Figure 3 presents some examples of unique mapping Exam-ples (A) and (B) map L to each of D once However example (A)structures the table such that both classification dimensions are rep-resented by an axis and map L to the appropriate intersection Ex-ample (B) maps L to the Y-Axis and each classification dimensionD on the X-Axis Example (C) links each of the reviewed items
ccopy 2019 The Author(s)Eurographics Proceedings ccopy 2019 The Eurographics Association
Liam McNabb and Robert S Laramee How to Write a Visualization Survey Paper A Starting Point
(L) to the appropriate classification dimension in the form of a listExamples (A) and (B) show the same information
An example of Figure 3(A) would be Vehlowrsquos taxonomy ofgroup visualizations and group structures [VBW15] An exampleof Figure 3(B) is with Nusrat and Kobourov with their task taxon-omy for cartograms [NK15] An example of Figure 3(C) is withBehrisch et al and their review of matrix re-ordering methods innetwork visualization [BBRlowast16a]
1-n Mapping differs from the unique-mapping schema by allow-ing a reviewed item (L) to be mapped up to n times for each classi-fication dimension (D) where n is the number of chosen attributesMultiple-Attribute mapping matrices are most suited to comparingdifferent elements such as techniques or frameworks against oneanother These papers usually offer a checklist and present the cri-terion each paper fulfills or does not
Examples of 1-n mapping can be found in Figure 4 Examples(A) and (B) can map L to each of D multiple times Example (A)structures the table such that both classification dimensions are rep-resented by the X and Y axes and map the reviewed topics at theirappropriate intersection Example (B) plots reviewed items to theY-Axis and each classification dimension on the X-Axis This ex-ample provides a clear comparison of reviewed itemrsquos (L) Example(C) links each of the reviewed items (L) to the appropriate classifi-cation topics in the form of a list Examples (A) and (B) show thesame information We do not recommend (A) or (C) as they cancause some confusion with literature being listed multiple timesAn example of Figure 4(B) can be found with Tominski et al andtheir look at interactive lenses in visualization [TGKlowast14]
Some papers do not map L explicitly in their categorization andchoose to display just their classification using symbols rather thanexplicit citations We call this indirect mapping Some examplesof this can be found in Sedlmair et alrsquos taxonomy [STMT12] whichclassifies data characteristics between two different classificationdimensions class-factors and influences Another example of thisis Heinrich and Weiskopfrsquos state-of-the art report for Parallel Coor-dinates [HW13] which presents a hierarchical view of the impor-tant topics within the field This representation does not explicitlyshow how literature maps the specified topics
35 Paper Centered vs Topic Centered u
If your goal is to help users understand an area you can produce asurvey focused on underlying topics rather than the research litera-ture We consider surveys that dedicate more space and content totopics (as opposed to individual research papers) to be topic cen-tered In this case the literature is surveyed in the hope of creatinga novel framework that can be applied to a field Landesberger et alprovide a good example of this is their state of the art in the visualanalysis of large graphs [VLKSlowast11] See Tong et al for an exam-ple of a paper-centered survey where the content is more focusedon research papers [TRBlowast18]
4 Complementary Material
Although the core of your survey resides in the classification andsurveyed material your paper does not need to end there In this
Figure 5 (a) explicit node-link layout (b) implicit node-link byinclusion (c) implicit node-link by overlap (d) implicit node-linkby adjacency These figures display the same system Courtesy ofSchulz et al [SHS11]
Figure 6 Yearly number of publications on dynamic graph visual-ization according to our literature database light gray bars indi-cate the total number of publications colored bars distinguish thepublications by type Courtesy of Beck et al [BBDW14]
section we discuss some additional options to improve your surveypaper We first focus on collective meta-data and some additionalfigures to improve the comparison of papers followed by some op-tions derived from the literature
41 Figures
As well as presenting some of the work from the summarized pa-pers figures can be used to enhance understanding of the pre-sented concepts Bach et al provide an excellent example withhand-drawn illustrations of operations for space-time cube flatten-ing operations (Figure 1) [BDAlowast14] Hadlak et al present differentfacets of graph-structured data that are commonly visualized onthe survey of multi-faceted graph visualization [HSS15] Figurescan be used to present more than just an introduction to a conceptCaserta and Zendra present a comparison of similar systems us-ing different visual techniques to give a comparative view [CZ11]Schulz et al present a similar example in their design space of im-plicit hierarchy visualization [SHS11] (Figure 5) Borgo et al usecomparisons to present visual variables as well as their glyph de-sign criteria in their glyph-based visualization survey [BKClowast13]Javed and Elmqvist use figures to present the differences betweencomposite visualization using a scatter plot and bar graph as exam-ples [JE12] Vehlow et al present something similar in their state of
ccopy 2019 The Author(s)Eurographics Proceedings ccopy 2019 The Eurographics Association
Liam McNabb and Robert S Laramee How to Write a Visualization Survey Paper A Starting Point
Meta-Data types Examples
Publication year Beck et al [BBDW14] Federico et al [FHKM16]
Publication venue Ko et al [KCAlowast16] Henry et al [HGEF07] Isenberg et al [IHKlowast17]
Data Origin Janicke et al [JFCS16] Wanner et al [WSJlowast14]
Number of citations or impact Alharbi and Laramee [AL18] Isenberg et al [IHKlowast17] Schneiderman et al [SDSW12]
Year span of cited literature McNabb and Laramee [ML17]
Evaluation Methods Isenberg et al [IIClowast13] Lam et al [LBIlowast12]
LiteratureAuthor Relationships Edmunds et al [ELClowast12] Laramee et al [LHDlowast04]
Test result comparisons Lam et al [LBIlowast12] Zhang et al [ZSBlowast12]
Task Types Fuchs et al [FIBK16] Ahn et al [APS14] Nusrat and Kerrarcher [NK15]
Additional frameworks Chen et al [CGW15] Dasgupta et al [DCK12]
Interactive Literature Browsers Beck et al [BKW16] Kucher and Kerren [KK15]
Any un-used classification dimensions (refer to Section 33)Examples Visual Design [TRBlowast18] Data Set Size Data Characteristics [JFCS16WSJlowast14] Data Dimensionality [IIClowast13FIBK16] Keywords [IISlowast17]Pipeline classification [LMWlowast17] Feature Comparison [BCGlowast13] Supplementary Material Classification [CLKlowast11 GOBlowast10 SS13]
Table 2 A shortlist of potential collective and comparative meta-data
the art in visualizing group structures in graphs [VBW15] Tomin-ski et alrsquos duology of surveys on interactive lenses in visualizationprovide good examples of comparative views of techniques and adepiction of an interactive lens technique [TGKlowast14 TGKlowast16]
Mentioned in Section 14 figures can be used to break downyour dimensions For example if you use a pipeline presenting itas an image is a useful approach in making sure the reader under-stands the concept Chi use this concept to present the informationvisualization data state reference model which they use to create ataxonomy of visualization techniques [Chi00] Cottam et al super-impose sources of dynamics onto Chen et alrsquos information visual-ization pipeline [CLW12CMS99] Landesberger et al present theirscope and organization in the form of a venn diagram looking at themain components of visual analysis of large graphs [VLKSlowast11]Wagner et al present a pipeline depicting the scope and organiza-tion of the paper reviewing malware systems [WFLlowast15] For moreinformation on frameworks Wang et al present a survey on visualanalytics pipelines which may be a good starting point [WZMlowast16]
42 Collective Meta-Data for Comparison
A full survey can occupy more than twice the length of most re-search papers and therefore pacing is very important In order tofacilitate comparison of research literature and enhance the sec-tions you can use the collective meta data to present interestingobservations and trends in the literature and make comparisons
A common set of meta-data to visualize is a distribution of theliterature Beck et al present a histogram to present the numberof literature papers per year with the publication type distributionmapped to color (Figure 6) [BBDW14] Federico et al also presenta histogram of literature distributed by the year [FHKM16] Bothof these are very prevalent and are often presented together for ex-ample Blumenstein et al present a stacked bar chart to displaythe selected literaturersquos venue stacked based on the publicationyear [BNWlowast16]
Another common example comes with the venues (conferences
or journals for example) Ko et al use a histogram to present thisin their survey paper [KCAlowast16] Lipsa et al present a line chart topresent the distribution of papers amongst years and their venues[LLClowast12] Rather than looking at the venue Janicke et al break upthe reviewed literature by the field origin (visualization or digitalhumanities) [JFCS16] Alharbi and Laramee compare the numberof methods presented in a paper against the number of citationsusing a bar graph They also present a word cloud of their focuspapers to present the differences in the vocabulary used within each[AL18] Isenberg et al produce a line chart depicting paper countsper year showing trends within each publication venue [IHKlowast17]Schneiderman et al provide a similar example presenting papercounts for three types of tree innovations [SDSW12] McNabb andLaramee present a gantt chart depicting the time frame for citationsacross their reviewed literature with number of citations mappedto color [ML17]
Edmunds et al classify their papers using relationship diagramsto indicate how concepts are built upon each other [ELClowast12]Laramee et al present a similar hierarchy of related literaturewith their presented techniquersquos dimensionality mapped to glyphs[LHDlowast04]
Merino et al produce a sankey diagram to present the rela-tionship between data collection and empirical evaluation in theirsurvey software visualization evaluation [MGAN18] Henry et alpresent a wide arrange of meta-data visualization on timelines ofpaper scope citation counts and collaboaration diagrams as wellas more [HGEF07]
A collection of literature can often aid in the creation of a newframework Even if you do not use this as a dimension in your clas-sification their is no reason to not include one Chen et al presenta conceptual pipeline of traffic data visualization for the survey onthe same topic [CGW15] Dasgupta et al end their paper by pre-senting their visual uncertainty pipeline which they believe extendspast the scope of their parallel coordinates survey [DCK12] Liangand Huang provide multiple models including a conceptual modelof highlighting and a framework of viewing control [LH10] Lu et
ccopy 2019 The Author(s)Eurographics Proceedings ccopy 2019 The Eurographics Association
Liam McNabb and Robert S Laramee How to Write a Visualization Survey Paper A Starting Point
Figure 7 Kucher and Kerrenrsquos interactive literature browser [KK15]
al present a predictive visual analytics pipeline for their survey ofthe same topic [LCMlowast16] Mattila et al design a pipeline to presentthe stages of research [MIKlowast16] Zhou et al present a frameworkdepicting an edge-bundling framework for their survey on the sametopic [ZXYQ13]
If you have clearly labeled a scope you may be able to presentsome data about options outside of your scope Fuchs et al use astacked bar chart to display the ratio of two different evaluationtypes where a lower saturation indicates experiments evaluatingdesign variations of the marks (those being reviewed) and a highersaturation for other experiments (not reviewed) [FIBK16]
Lam et al review studies presented in their papers [LBIlowast12] Abar chart is used to show the distribution between process scenariosand visualization scenarios They use lines to further evaluate visu-alization and process scenarios between 1995ndash2010 by breakingdown the scenarios Isenberg et al review evaluation scenarios us-ing both histograms and line charts [IIClowast13] Zhang et al performstress tests on the different commercial systems they review andpresent them in the form of a bar graph [ZSBlowast12] See Table 2 fora breakdown of collect meta-data samples
43 Interactive Literature Browsers
Interactive literature browsers have become increasingly popularin the realm of visualization survey papers The browser enablesreaders to interactively browse the findings of the paper to aidexploration McNabb and Larameersquos SoS paper find 13 literaturebrowsers from the last 5 years making this a worthwhile considera-tion Although it is possible to produce a unique browser design werecommend SurVis [BKW16] as an option due to itrsquos open sourceand easy-to-implement design
Kucher and Kerren create their own interactive browser provid-ing the opportunity for users to filter through different text visual-ization techniques as well as allowing for user submitted entries(Figure 7) [KK15] Behrisch et al provide a complimentary web-site to help readers compare matrix plots as well as present addi-tional meta data on the reviewed literature [BBRlowast16b] Dumas etal present a website to review visualization focused on financialdata [DML14]
5 Discussion and Future Challenges
The discussion and future challenges sections are critical areaswithin survey papers The section summarizes any challenges pre-sented in the research papers in generalized terms By the endof this section readers could clearly understand what directionsshould be taken to further the field If you are having trouble find-ing the content domain expert feedback can be used to draw outmore areas with less work undertaken
We recommend referring to the classification that you have de-signed It is likely that you have noticed trends throughout the com-pilation process such as missing or less mature areas within yourclassification dimensions Two dimensional classifications are verygood at pointing out both mature and immature research directionsLook for holes in your classification table or matrix Your papersummaries can also be used to identify future research topics Ifyou notice key topics that seem to be missing or less mature (otherpotential classification dimensions for example) this is also worthmentioning Look out for the following when developing your dis-cussion 1) Empty spaces in the classification table 2) mature areaswith dense research 3) temporal trends such as early pioneers inthe field and trends in only the last few years and 4) trends in pub-lication venues
6 Future Work
There are many avenues of future work that we could invest ourefforts into for further papers For this paper we have focused onour own expertise and experience however there our many differ-ent survey authors with many different styles and pieces of adviceto share Therefore we would like to expand our guidance to holdmore perspectives We also think that exploring more example fig-ures to discuss what makes them effective and how they are usedFinally we only briefly talk about the journey you follow in thetemporal planning section We believe discussing the intermediatestages and milestones could aid prospective writers overcome men-tal barriers in writing a successful survey paper
7 Conclusions
We provide starting point guidelines with a flexible template for thereader to follow in order to produce a full visualization survey pa-per The paper offers step-by-step instructions in order to guide thereader through each section of a typical survey as well as additionalconsiderations that need to be made during the writing cycle Thepaper reviews what we consider essential topics and supplementaryoptions that can be used to improve the quality of a survey paperand increase the chance of succeeding through the review process
8 Acknowledgments
We would like to thank KESS for contributing funding towardsthis endeavor Knowledge Economy Skills Scholarships (KESS)is a pan-Wales higher level skills initiative led by Bangor Univer-sity on behalf of the HE sector in Wales It is partially funded bythe Welsh Governmentrsquos European Social Fund (ESF) convergenceprogramme for West Wales and the Valleys We would also like tothank Dylan Rees and Carlo Sarli for help with proofreading thepaper before submission
ccopy 2019 The Author(s)Eurographics Proceedings ccopy 2019 The Eurographics Association
Liam McNabb and Robert S Laramee How to Write a Visualization Survey Paper A Starting Point
References[AAMlowast17] ALHARBI N ALHARBI M MARTINEZ X KRONE M
ROSE A BAADEN M LARAMEE R S CHAVENT M Molecularvisualization of computational biology data A survey of surveys InEuroVis 2017 - Short Papers (2017) The Eurographics Association 1
[AL18] ALHARBI M LARAMEE R S Sos textvis A survey ofsurveys on text visualization In The Computer Graphics amp VisualComputing (CGVC) Conference 2018 (Swansea UK September 2018)The Eurographics Association pp 143ndash152 doi102312cgvc20181219 1 7
[AL19] ALHARBI M LARAMEE R S Sos textvis An extended surveyof surveys on text visualization Computers 8 1 (2019) 17 1
[AMAlowast14] ALSALLAKH B MICALLEF L AIGNER W HAUSER HMIKSCH S RODGERS P Visualizing sets and set-typed data State-of-the-art and future challenges In Eurographics conference on Visualiza-tion (EuroVis)ndashState of The Art Reports (2014) The Eurographics As-sociation pp 1ndash21 URL httpskarkentacuk390073
[APS14] AHN J-W PLAISANT C SHNEIDERMAN B A task taxon-omy for network evolution analysis IEEE Transactions on Visualizationand Computer Graphics 20 3 (2014) 365ndash376 5 7
[BBDW14] BECK F BURCH M DIEHL S WEISKOPF D The stateof the art in visualizing dynamic graphs In EuroVis - State of theArt Reports (2014) The Eurographics Association doi102312eurovisstar20141174 3 6 7
[BBRlowast16a] BEHRISCH M BACH B RICHE N H SCHRECK TFEKETE J-D Matrix Reordering Methods for Table and Network Vi-sualization Computer Graphics Forum 35 3 (2016) 693ndash716 doi101111cgf12935 6
[BBRlowast16b] BEHRISCH M BACH B RICHE N H SCHRECKT FEKETE J-D Matrix reordering survey httpmatrixreorderingdbvisde 2016 [Online accessed 05-January-2016] 8
[BCGlowast13] BREZOVSKY J CHOVANCOVA E GORA A PAVELKA ABIEDERMANNOVA L DAMBORSKY J Software tools for identifica-tion visualization and analysis of protein tunnels and channels Biotech-nology advances 31 1 (2013) 38ndash49 7
[BDAlowast14] BACH B DRAGICEVIC P ARCHAMBAULT D HURTERC CARPENDALE S A review of temporal data visualizations basedon space-time cube operations In EuroVis 2014 - State of the Art Re-ports (2014) The Eurographics Association pp 1ndash21 URL httpskarkentacuk39007 3 4 6
[BKClowast13] BORGO R KEHRER J CHUNG D H MAGUIRE ELARAMEE R S HAUSER H WARD M CHEN M glyph-basedvisualization Foundations design guidelines techniques and applica-tions Eurographics State of the Art Reports (may 2013) 39ndash63 URL httpswwwcgtuwienacatresearchpublications2013borgo-2013-gly 1 4 6
[BKW16] BECK F KOCH S WEISKOPF D Visual analysis anddissemination of scientific literature collections with SurVis IEEETransactions on Visualization and Computer Graphics 22 01 (2016)180ndash189 URL httpwwwvisusuni-stuttgartdeuploadstx_vispublicationsvast15-survispdfdoi101109TVCG20152467757 7 8
[Bli98] BLINN J F Ten more unsolved problems in computer graphicsIEEE Computer Graphics and Applications 18 5 (Sep 1998) 86ndash89doi10110938708564 1
[BM13] BREHMER M MUNZNER T A multi-level typology of abstractvisualization tasks IEEE Transactions on Visualization and ComputerGraphics 19 12 (2013) 2376ndash2385 doi101109TVCG2013124 5
[BNWlowast16] BLUMENSTEIN K NIEDERER C WAGNER MSCHMIEDL G RIND A AIGNER W Evaluating informationvisualization on mobile devices Gaps and challenges in the empirical
evaluation design space In Proceedings of the Sixth Workshop onBeyond Time and Errors on Novel Evaluation Methods for Visualization(2016) ACM pp 125ndash132 7
[BOS09] BAKAR A A OTHMAN Z A SHUIB N L M Build-ing a new taxonomy for data discretization techniques In Data Min-ing and Optimization 2009 DMOrsquo09 2nd Conference on (2009) IEEEpp 132ndash140 5
[CGW15] CHEN W GUO F WANG F-Y A survey of trafficdata visualization IEEE Transactions on Intelligent TransportationSystems 16 6 (2015) 2970ndash2984 URL httpdxdoiorg101109TITS20152436897 doi101109TITS20152436897 7
[Chi00] CHI E H-H A taxonomy of visualization techniques using thedata state reference model In Information Visualization 2000 InfoVis2000 IEEE Symposium on (2000) IEEE pp 69ndash75 doi101109INFVIS2000885092 7
[CLKlowast11] CHAVENT M LEacuteVY B KRONE M BIDMON K NOM-INEacute J-P ERTL T BAADEN M Gpu-powered tools boost molecularvisualization Briefings in Bioinformatics 12 6 (2011) 689ndash701 7
[CLKH14] CHUNG D H LARAMEE R S KEHRER J HAUSERH Glyph-based multi-field visualization In Scientific VisualizationSpringer 2014 pp 129ndash137 1
[CLW12] COTTAM J A LUMSDAINE A WEAVER C Watch thisA taxonomy for dynamic data visualization In Visual Analytics Sci-ence and Technology (VAST) 2012 IEEE Conference on (2012) IEEEpp 193ndash202 7
[CMS99] CARD S K MACKINLAY J D SHNEIDERMAN B Read-ings in information visualization using vision to think Morgan Kauf-mann 1999 3 7
[COD18] CARRION B ONORATI T DIAZ P Designing a semi-automatic taxonomy generation tool In The 22nd International Confer-ence on Information Visualization (IV) (Salerno Italy July 2018) acircAc5
[CZ11] CASERTA P ZENDRA O Visualization of the static aspects ofsoftware A survey IEEE transactions on visualization and computergraphics 17 7 (2011) 913ndash933 6
[DCK12] DASGUPTA A CHEN M KOSARA R Conceptualizing vi-sual uncertainty in parallel coordinates Computer Graphics Forum 313pt2 (2012) 1015ndash1024 doi101111j1467-8659201203094x 7
[DGBPL00] DIAS G GUILLOREacute S BASSANO J-C PEREIRA LOPESJ G Combining linguistics with statistics for multiword term extrac-tion A fruitful association In Content-Based Multimedia InformationAccess-Volume 2 (2000) LE CENTRE DE HAUTES ETUDES INTER-NATIONALES DrsquoINFORMATIQUE DOCUMENTAIRE pp 1473ndash1491 5
[Dig19] DIGITAL SCIENCE RESEARCH amp SOLUTIONS INC Pa-pers 2019 date accessed 2019-02-28 URL httpswwwpapersappcom 4
[DLR09] DRAPER G M LIVNAT Y RIESENFELD R F A surveyof radial methods for information visualization IEEE Transactions onVisualization and Computer Graphics 15 5 (2009) 759ndash776 doi101109TVCG200923 5
[DML14] DUMAS M MCGUFFIN M J LEMIEUX V L Financevisnet-a visual survey of financial data visualizations In Poster Abstractsof IEEE Conference on Visualization (2014) vol 2 8
[ELClowast12] EDMUNDS M LARAMEE R S CHEN G MAX NZHANG E WARE C Surface-based flow visualization Computersamp Graphics 36 8 (2012) 974ndash990 1 7
[FHKM16] FEDERICO P HEIMERL F KOCH S MIKSCH S A surveyon visual approaches for analyzing scientific literature and patents IEEETransactions on Visualization and Computer Graphics (2016) doi101109TVCG20162610422 7
ccopy 2019 The Author(s)Eurographics Proceedings ccopy 2019 The Eurographics Association
Liam McNabb and Robert S Laramee How to Write a Visualization Survey Paper A Starting Point
[FIBK16] FUCHS J ISENBERG P BEZERIANOS A KEIM D A sys-tematic review of experimental studies on data glyphs IEEE Transac-tions on Visualization and Computer Graphics (2016) doi101109TVCG20162549018 7 8
[FL18] FIRAT E E LARAMEE R S Towards a survey of interac-tive visualization for education In The Computer Graphics amp VisualComputing (CGVC) Conference 2018 (Swansea UK September 2018)The Eurographics Association pp 91ndash101 doi102312cgvc20181211 1
[GOBlowast10] GEHLENBORG N OrsquoDONOGHUE S I BALIGA N SGOESMANN A HIBBS M A KITANO H KOHLBACHER ONEUWEGER H SCHNEIDER R TENENBAUM D ET AL Visual-ization of omics data for systems biology Nature methods 7 3s (2010)S56 7
[Goo16] GOOGLE Google scholar httpsscholargooglecouk 2016 Accessed 2016-1-20 2
[HGEF07] HENRY N GOODELL H ELMQVIST N FEKETE J-D20 years of four hci conferences A visual exploration InternationalJournal of Human-Computer Interaction 23 3 (2007) 239ndash285 7
[HSS15] HADLAK S SCHUMANN H SCHULZ H-J A survey ofmulti-faceted graph visualization In Eurographics Conference on Vi-sualization (EuroVis) (2015) vol 33 of VGTC The Eurographics Asso-ciation pp 1ndash20 doi101016jjvlc201509004 6
[HW13] HEINRICH J WEISKOPF D State of the art of parallel coordi-nates STAR Proceedings of Eurographics 2013 (2013) 95ndash116 6
[IEE16] IEEE IEEE Xplore httpieeexploreieeeorgXplorehomejsp 2016 Accessed 2016-9-26 2
[IHKlowast17] ISENBERG P HEIMERL F KOCH S ISENBERG T XU PSTOLPER C D SEDLMAIR M M CHEN J MOumlLLER T STASKOJ vispubdataorg A Metadata Collection about IEEE Visualization(VIS) Publications IEEE Transactions on Visualization and ComputerGraphics 23 (2017) To appear URL httpshalinriafrhal-01376597 doihttpdxdoiorg101109TVCG20162615308 2 7
[IIClowast13] ISENBERG T ISENBERG P CHEN J SEDLMAIR MMOLLER T A systematic review on the practice of evaluating visu-alization IEEE Transactions on Visualization and Computer Graphics19 12 (2013) 2818ndash2827 7 8
[IISlowast17] ISENBERG P ISENBERG T SEDLMAIR M CHEN JMOumlLLER T Visualization as seen through its research paper keywordsvol 23 pp 771ndash780 7
[jab18] Jabref 2018 date accessed 2019-02-28 URL httpwwwjabreforg 4
[JE12] JAVED W ELMQVIST N Exploring the design space of com-posite visualization In Visualization Symposium (PacificVis) 2012 IEEEPacific (2012) IEEE pp 1ndash8 6
[JF16] JOHANSSON J FORSELL C Evaluation of parallel coordinatesOverview categorization and guidelines for future research IEEE Trans-actions on Visualization and Computer Graphics 22 1 (2016) 579ndash5885
[JFCS16] JAumlNICKE S FRANZINI G CHEEMA M SCHEUERMANNG Visual text analysis in digital humanities Computer Graphics Forum36 6 (2016) 7
[KCAlowast16] KO S CHO I AFZAL S YAU C CHAE J MALIK ABECK K JANG Y RIBARSKY W EBERT D S A survey on visualanalysis approaches for financial data Computer Graphics Forum 30 3(2016) 599 ndash 617 doi101111cgf12931 5 7
[Kei02] KEIM D A Information visualization and visual data miningIEEE Transactions on Visualization and Computer Graphics 8 1 (2002)pp 1ndash8 4 5
[KK15] KUCHER K KERREN A Text visualization techniques Tax-onomy visual survey and community insights In 2015 IEEE PacificVisualization Symposium (PacificVis) (2015) IEEE pp 117ndash121 7 8
[KK17] KERRACHER N KENNEDY J Constructing and evaluating vi-sualisation task classifications Process and considerations ComputerGraphics Forum 36 3 (2017) 47ndash59 5
[KKC15] KERRACHER N KENNEDY J CHALMERS K A task tax-onomy for temporal graph visualisation Visualization and ComputerGraphics IEEE Transactions on 21 10 (2015) 1160ndash1172 doi101109TVCG20152424889 3
[Lar10] LARAMEE R S How to write a visualization research paper Astarting point Computer Graphics Forum 29 8 (2010) 2363ndash2371 2 4
[Lar11] LARAMEE R S How to read a visualization research paperExtracting the essentials IEEE computer graphics and applications 313 (2011) 78ndash82 4
[Lar16] LARAMEE R S How to conduct a scientific literature surveyA starting point 2016 date accessed 2019-02-28 URL httpswwwyoutubecomwatchv=frYooEN360Q 4
[LBIlowast12] LAM H BERTINI E ISENBERG P PLAISANT C CARPEN-DALE S Empirical studies in information visualization Seven scenar-ios IEEE Transactions on Visualization and Computer Graphics 18 9(2012) 1520ndash1536 7 8
[LCMlowast16] LU J CHEN W MA Y KE J LI Z ZHANG F MA-CIEJEWSKI R Recent progress and trends in predictive visual analyticsFrontiers of Computer Science (2016) 1ndash16 8
[LH10] LIANG J HUANG M L Highlighting in information visual-ization A survey In 2010 14th International Conference InformationVisualisation (2010) IEEE pp 79ndash85 7
[LHDlowast04] LARAMEE R S HAUSER H DOLEISCH H VROLIJK BPOST F H WEISKOPF D The state of the art in flow visualizationDense and texture-based techniques Computer Graphics Forum 23 2(2004) 203ndash221 1 3 7
[LHZP07] LARAMEE R S HAUSER H ZHAO L POST F HTopology-based flow visualization the state of the art In Topology-based methods in visualization Springer 2007 pp 1ndash19 1
[LLClowast12] LIPSA D R LARAMEE R S COX S J ROBERTS J CWALKER R BORKIN M A PFISTER H Visualization for the phys-ical sciences Computer graphics forum 31 8 (2012) 2317ndash2347 1 37
[LMWlowast17] LIU S MALJOVEC D WANG B BREMER P-T PAS-CUCCI V Visualizing high-dimensional data Advances in the pastdecade IEEE Transactions on Visualization and Computer Graphics3 (2017) 1249ndash1268 7
[men18] Mendely 2018 date accessed 2019-02-28 URL httpswwwmendeleycom 4
[MFSlowast10] MURTHY K FARUQUIE T A SUBRAMANIAM L VPRASAD K H MOHANIA M Automatically generating term-frequency-induced taxonomies In Proceedings of the ACL 2010 Con-ference Short Papers (2010) Association for Computational Linguisticspp 126ndash131 5
[MGAN18] MERINO L GHAFARI M ANSLOW C NIER-STRASZ O A systematic literature review of software vi-sualization evaluation Journal of Systems and Software 144(2018) 165 ndash 180 URL httpwwwsciencedirectcomsciencearticlepiiS0164121218301237doihttpsdoiorg101016jjss2018060277
[MIKlowast16] MATTILA A-L IHANTOLA P KILAMO T LUOTO ANURMINEN M VAumlAumlTAumlJAuml H Software visualization today System-atic literature review In Proceedings of the 20th International AcademicMindtrek Conference (New York NY USA 2016) AcademicMindtrekrsquo16 ACM pp 262ndash271 URL httpdoiacmorg10114529943102994327 doi10114529943102994327 8
[ML17] MCNABB L LARAMEE R S Survey of surveys (sos)-mapping the landscape of survey papers in information visualizationComputer Graphics Forum 36 3 (2017) 589ndash617 1 3 4 5 7
ccopy 2019 The Author(s)Eurographics Proceedings ccopy 2019 The Eurographics Association
Liam McNabb and Robert S Laramee How to Write a Visualization Survey Paper A Starting Point
[MLPlowast10] MCLOUGHLIN T LARAMEE R S PEIKERT R POSTF H CHEN M Over two decades of integration-based geometricflow visualization Computer Graphics Forum 29 6 (2010) 1807ndash18291
[Mun08] MUNZNER T Process and pitfalls in writing information visu-alization research papers In Information visualization Springer 2008pp 134ndash153 4
[NK15] NUSRAT S KOBOUROV S Task taxonomy for cartograms17th IEEE Eurographics Conference on Visualization (EUROVIS - shortpapers) (2015) 6 7
[NK16] NUSRAT S KOBOUROV S The state of the art in cartogramsEurographics conference on Visualization (EuroVis)ndashState of The Art Re-ports 35 3 (2016) 619ndash642 URL httpsarxivorgabs160508485 4
[OGG07] OTTENS K GLEIZES M-P GLIZE P A multi-agent systemfor building dynamic ontologies In Proceedings of the 6th internationaljoint conference on Autonomous agents and multiagent systems (2007)ACM p 227 5
[PBB02] PARK Y BYRD R J BOGURAEV B K Automatic glossaryextraction beyond terminology identification In Proceedings of the 19thinternational conference on Computational linguistics-Volume 1 (2002)Association for Computational Linguistics pp 1ndash7 5
[PGB11] PATEL D GROumlLLER M E BRUCKNER S Phd educationthrough apprenticeship In Eurographics (Education Papers) (2011)pp 23ndash28 4
[PL09] PENG Z LARAMEE R S Higher dimensional vector field vi-sualization A survey In Theory and Practice of Computer Graphics(2009) pp 149ndash163 1
[PVHlowast03] POST F H VROLIJK B HAUSER H LARAMEE R SDOLEISCH H The state of the art in flow visualisation Feature ex-traction and tracking Computer Graphics Forum 22 4 (2003) 775ndash7921
[ref18] REFNWRITE Academic writing tools and research software - acomprehensive guide 2018 date accessed 2019-02-28 URL httpsbitly2NPqXoF 4
[RL18] ROBERTS R LARAMEE R S Visualising business dataA survey Information 9 11 (November 2018) doi103390info9110285 1
[RL19] REES D LARAMEE R S A survey of information visualiza-tion books Computer Graphics Forum (2019) doi101111cgf13595 1
[SDSW12] SHNEIDERMAN B DUNNE C SHARMA P WANGP Innovation trajectories for information visualizations Comparingtreemaps cone trees and hyperbolic trees Information Visualization11 2 (2012) 87ndash105 doi1011771473871611424815 7
[Shn96] SHNEIDERMAN B The eyes have it A task by data type tax-onomy for information visualizations In Visual Languages 1996 Pro-ceedings IEEE Symposium on (1996) IEEE pp 336ndash343 5
[SHS11] SCHULZ H-J HADLAK S SCHUMANN H The design spaceof implicit hierarchy visualization A survey IEEE Transactions on Vi-sualization and Computer Graphics 17 4 (2011) 393ndash411 6
[SM13] SASTRY M K MOHAMMED C The summary-comparisonmatrix A tool for writing the literature review In Professional Com-munication Conference (IPCC) 2013 IEEE International (2013) IEEEpp 1ndash5 3
[SNHS13] SCHULZ H-J NOCKE T HEITZLER M SCHUMANN HA design space of visualization tasks IEEE Transactions on Visu-alization and Computer Graphics 19 12 (2013) 2366ndash2375 doi101109TVCG2013120 3 5
[SS13] SECRIER M SCHNEIDER R Visualizing time-related data inbiology a review Briefings in bioinformatics 15 5 (2013) 771ndash782 7
[STMT12] SEDLMAIR M TATU A MUNZNER T TORY M A tax-onomy of visual cluster separation factors Computer Graphics Forum31 3pt4 (2012) 1335ndash1344 6
[TGKlowast14] TOMINSKI C GLADISCH S KISTER U DACHSELT RSCHUMANN H A survey on interactive lenses in visualization EuroVisState-of-the-Art Reports 3 (2014) 6 7
[TGKlowast16] TOMINSKI C GLADISCH S KISTER U DACHSELT RSCHUMANN H Interactive lenses for visualization An extended sur-vey In Computer Graphics Forum (2016) Wiley Online Library 7
[TRBlowast18] TONG C ROBERTS R BORGO R WALTON S LARAMEER S WEGBA K LU A WANG Y QU H LUO Q ET AL Story-telling and visualization An extended survey Information 9 3 (2018)65 1 3 6 7
[TWCL10] TSUI E WANG W M CHEUNG C F LAU A S Aconceptndashrelationship acquisition and inference approach for hierarchicaltaxonomy construction from tags Information processing amp manage-ment 46 1 (2010) 44ndash57 5
[VBW15] VEHLOW C BECK F WEISKOPF D The state of the art invisualizing group structures in graphs In Eurographics Conference onVisualization (EuroVis)-STARs (2015) VGTC The Eurographics Asso-ciation pp 21ndash40 doi102312eurovisstar20151110 67
[VCP07] VELARDI P CUCCHIARELLI A PETIT M A taxonomylearning method and its application to characterize a scientific web com-munity IEEE Transactions on Knowledge and Data Engineering 19 2(2007) 5
[VLKSlowast11] VON LANDESBERGER T KUIJPER A SCHRECK TKOHLHAMMER J VAN WIJK J J FEKETE J-D FELLNER D WVisual analysis of large graphs state-of-the-art and future research chal-lenges Computer graphics forum 30 6 (2011) 1719ndash1749 6 7
[WFLlowast15] WAGNER M FISCHER F LUH R HABERSON A RINDA KEIM D A AIGNER W A survey of visualization systems formalware analysis In Eurographics Conference on Visualization (Eu-roVis) - STARs (2015) The Eurographics Association pp 105ndash125doi102312eurovisstar20151114 7
[WSJlowast14] WANNER F STOFFEL A JAumlCKLE D KWON B CWEILER A KEIM D A ISAACS K E GIMEacuteNEZ A JUSUFI IGAMBLIN T State-of-the-art report of visual analysis for event de-tection in text data streams Computer Graphics Forum 33 3 (2014)doi102312eurovisstar20141176 7
[WZMlowast16] WANG X-M ZHANG T-Y MA Y-X XIA J CHEN WA survey of visual analytic pipelines Journal of Computer Science andTechnology 31 4 (2016) 787ndash804 7
[ZSBlowast12] ZHANG L STOFFEL A BEHRISCH M MITTELSTADT SSCHRECK T POMPL R WEBER S LAST H KEIM D Visual ana-lytics for the big data era - a comparative review of state-of-the-art com-mercial systems In Visual Analytics Science and Technology (VAST)2012 IEEE Conference on (2012) IEEE pp 173ndash182 7 8
[ZXYQ13] ZHOU H XU P YUAN X QU H Edge bundling in in-formation visualization Tsinghua Science and Technology 18 2 (2013)145ndash156 8
ccopy 2019 The Author(s)Eurographics Proceedings ccopy 2019 The Eurographics Association

Liam McNabb and Robert S Laramee How to Write a Visualization Survey Paper A Starting Point
References[AAMlowast17] ALHARBI N ALHARBI M MARTINEZ X KRONE M
ROSE A BAADEN M LARAMEE R S CHAVENT M Molecularvisualization of computational biology data A survey of surveys InEuroVis 2017 - Short Papers (2017) The Eurographics Association 1
[AL18] ALHARBI M LARAMEE R S Sos textvis A survey ofsurveys on text visualization In The Computer Graphics amp VisualComputing (CGVC) Conference 2018 (Swansea UK September 2018)The Eurographics Association pp 143ndash152 doi102312cgvc20181219 1 7
[AL19] ALHARBI M LARAMEE R S Sos textvis An extended surveyof surveys on text visualization Computers 8 1 (2019) 17 1
[AMAlowast14] ALSALLAKH B MICALLEF L AIGNER W HAUSER HMIKSCH S RODGERS P Visualizing sets and set-typed data State-of-the-art and future challenges In Eurographics conference on Visualiza-tion (EuroVis)ndashState of The Art Reports (2014) The Eurographics As-sociation pp 1ndash21 URL httpskarkentacuk390073
[APS14] AHN J-W PLAISANT C SHNEIDERMAN B A task taxon-omy for network evolution analysis IEEE Transactions on Visualizationand Computer Graphics 20 3 (2014) 365ndash376 5 7
[BBDW14] BECK F BURCH M DIEHL S WEISKOPF D The stateof the art in visualizing dynamic graphs In EuroVis - State of theArt Reports (2014) The Eurographics Association doi102312eurovisstar20141174 3 6 7
[BBRlowast16a] BEHRISCH M BACH B RICHE N H SCHRECK TFEKETE J-D Matrix Reordering Methods for Table and Network Vi-sualization Computer Graphics Forum 35 3 (2016) 693ndash716 doi101111cgf12935 6
[BBRlowast16b] BEHRISCH M BACH B RICHE N H SCHRECKT FEKETE J-D Matrix reordering survey httpmatrixreorderingdbvisde 2016 [Online accessed 05-January-2016] 8
[BCGlowast13] BREZOVSKY J CHOVANCOVA E GORA A PAVELKA ABIEDERMANNOVA L DAMBORSKY J Software tools for identifica-tion visualization and analysis of protein tunnels and channels Biotech-nology advances 31 1 (2013) 38ndash49 7
[BDAlowast14] BACH B DRAGICEVIC P ARCHAMBAULT D HURTERC CARPENDALE S A review of temporal data visualizations basedon space-time cube operations In EuroVis 2014 - State of the Art Re-ports (2014) The Eurographics Association pp 1ndash21 URL httpskarkentacuk39007 3 4 6
[BKClowast13] BORGO R KEHRER J CHUNG D H MAGUIRE ELARAMEE R S HAUSER H WARD M CHEN M glyph-basedvisualization Foundations design guidelines techniques and applica-tions Eurographics State of the Art Reports (may 2013) 39ndash63 URL httpswwwcgtuwienacatresearchpublications2013borgo-2013-gly 1 4 6
[BKW16] BECK F KOCH S WEISKOPF D Visual analysis anddissemination of scientific literature collections with SurVis IEEETransactions on Visualization and Computer Graphics 22 01 (2016)180ndash189 URL httpwwwvisusuni-stuttgartdeuploadstx_vispublicationsvast15-survispdfdoi101109TVCG20152467757 7 8
[Bli98] BLINN J F Ten more unsolved problems in computer graphicsIEEE Computer Graphics and Applications 18 5 (Sep 1998) 86ndash89doi10110938708564 1
[BM13] BREHMER M MUNZNER T A multi-level typology of abstractvisualization tasks IEEE Transactions on Visualization and ComputerGraphics 19 12 (2013) 2376ndash2385 doi101109TVCG2013124 5
[BNWlowast16] BLUMENSTEIN K NIEDERER C WAGNER MSCHMIEDL G RIND A AIGNER W Evaluating informationvisualization on mobile devices Gaps and challenges in the empirical
evaluation design space In Proceedings of the Sixth Workshop onBeyond Time and Errors on Novel Evaluation Methods for Visualization(2016) ACM pp 125ndash132 7
[BOS09] BAKAR A A OTHMAN Z A SHUIB N L M Build-ing a new taxonomy for data discretization techniques In Data Min-ing and Optimization 2009 DMOrsquo09 2nd Conference on (2009) IEEEpp 132ndash140 5
[CGW15] CHEN W GUO F WANG F-Y A survey of trafficdata visualization IEEE Transactions on Intelligent TransportationSystems 16 6 (2015) 2970ndash2984 URL httpdxdoiorg101109TITS20152436897 doi101109TITS20152436897 7
[Chi00] CHI E H-H A taxonomy of visualization techniques using thedata state reference model In Information Visualization 2000 InfoVis2000 IEEE Symposium on (2000) IEEE pp 69ndash75 doi101109INFVIS2000885092 7
[CLKlowast11] CHAVENT M LEacuteVY B KRONE M BIDMON K NOM-INEacute J-P ERTL T BAADEN M Gpu-powered tools boost molecularvisualization Briefings in Bioinformatics 12 6 (2011) 689ndash701 7
[CLKH14] CHUNG D H LARAMEE R S KEHRER J HAUSERH Glyph-based multi-field visualization In Scientific VisualizationSpringer 2014 pp 129ndash137 1
[CLW12] COTTAM J A LUMSDAINE A WEAVER C Watch thisA taxonomy for dynamic data visualization In Visual Analytics Sci-ence and Technology (VAST) 2012 IEEE Conference on (2012) IEEEpp 193ndash202 7
[CMS99] CARD S K MACKINLAY J D SHNEIDERMAN B Read-ings in information visualization using vision to think Morgan Kauf-mann 1999 3 7
[COD18] CARRION B ONORATI T DIAZ P Designing a semi-automatic taxonomy generation tool In The 22nd International Confer-ence on Information Visualization (IV) (Salerno Italy July 2018) acircAc5
[CZ11] CASERTA P ZENDRA O Visualization of the static aspects ofsoftware A survey IEEE transactions on visualization and computergraphics 17 7 (2011) 913ndash933 6
[DCK12] DASGUPTA A CHEN M KOSARA R Conceptualizing vi-sual uncertainty in parallel coordinates Computer Graphics Forum 313pt2 (2012) 1015ndash1024 doi101111j1467-8659201203094x 7
[DGBPL00] DIAS G GUILLOREacute S BASSANO J-C PEREIRA LOPESJ G Combining linguistics with statistics for multiword term extrac-tion A fruitful association In Content-Based Multimedia InformationAccess-Volume 2 (2000) LE CENTRE DE HAUTES ETUDES INTER-NATIONALES DrsquoINFORMATIQUE DOCUMENTAIRE pp 1473ndash1491 5
[Dig19] DIGITAL SCIENCE RESEARCH amp SOLUTIONS INC Pa-pers 2019 date accessed 2019-02-28 URL httpswwwpapersappcom 4
[DLR09] DRAPER G M LIVNAT Y RIESENFELD R F A surveyof radial methods for information visualization IEEE Transactions onVisualization and Computer Graphics 15 5 (2009) 759ndash776 doi101109TVCG200923 5
[DML14] DUMAS M MCGUFFIN M J LEMIEUX V L Financevisnet-a visual survey of financial data visualizations In Poster Abstractsof IEEE Conference on Visualization (2014) vol 2 8
[ELClowast12] EDMUNDS M LARAMEE R S CHEN G MAX NZHANG E WARE C Surface-based flow visualization Computersamp Graphics 36 8 (2012) 974ndash990 1 7
[FHKM16] FEDERICO P HEIMERL F KOCH S MIKSCH S A surveyon visual approaches for analyzing scientific literature and patents IEEETransactions on Visualization and Computer Graphics (2016) doi101109TVCG20162610422 7
ccopy 2019 The Author(s)Eurographics Proceedings ccopy 2019 The Eurographics Association
Liam McNabb and Robert S Laramee How to Write a Visualization Survey Paper A Starting Point
[FIBK16] FUCHS J ISENBERG P BEZERIANOS A KEIM D A sys-tematic review of experimental studies on data glyphs IEEE Transac-tions on Visualization and Computer Graphics (2016) doi101109TVCG20162549018 7 8
[FL18] FIRAT E E LARAMEE R S Towards a survey of interac-tive visualization for education In The Computer Graphics amp VisualComputing (CGVC) Conference 2018 (Swansea UK September 2018)The Eurographics Association pp 91ndash101 doi102312cgvc20181211 1
[GOBlowast10] GEHLENBORG N OrsquoDONOGHUE S I BALIGA N SGOESMANN A HIBBS M A KITANO H KOHLBACHER ONEUWEGER H SCHNEIDER R TENENBAUM D ET AL Visual-ization of omics data for systems biology Nature methods 7 3s (2010)S56 7
[Goo16] GOOGLE Google scholar httpsscholargooglecouk 2016 Accessed 2016-1-20 2
[HGEF07] HENRY N GOODELL H ELMQVIST N FEKETE J-D20 years of four hci conferences A visual exploration InternationalJournal of Human-Computer Interaction 23 3 (2007) 239ndash285 7
[HSS15] HADLAK S SCHUMANN H SCHULZ H-J A survey ofmulti-faceted graph visualization In Eurographics Conference on Vi-sualization (EuroVis) (2015) vol 33 of VGTC The Eurographics Asso-ciation pp 1ndash20 doi101016jjvlc201509004 6
[HW13] HEINRICH J WEISKOPF D State of the art of parallel coordi-nates STAR Proceedings of Eurographics 2013 (2013) 95ndash116 6
[IEE16] IEEE IEEE Xplore httpieeexploreieeeorgXplorehomejsp 2016 Accessed 2016-9-26 2
[IHKlowast17] ISENBERG P HEIMERL F KOCH S ISENBERG T XU PSTOLPER C D SEDLMAIR M M CHEN J MOumlLLER T STASKOJ vispubdataorg A Metadata Collection about IEEE Visualization(VIS) Publications IEEE Transactions on Visualization and ComputerGraphics 23 (2017) To appear URL httpshalinriafrhal-01376597 doihttpdxdoiorg101109TVCG20162615308 2 7
[IIClowast13] ISENBERG T ISENBERG P CHEN J SEDLMAIR MMOLLER T A systematic review on the practice of evaluating visu-alization IEEE Transactions on Visualization and Computer Graphics19 12 (2013) 2818ndash2827 7 8
[IISlowast17] ISENBERG P ISENBERG T SEDLMAIR M CHEN JMOumlLLER T Visualization as seen through its research paper keywordsvol 23 pp 771ndash780 7
[jab18] Jabref 2018 date accessed 2019-02-28 URL httpwwwjabreforg 4
[JE12] JAVED W ELMQVIST N Exploring the design space of com-posite visualization In Visualization Symposium (PacificVis) 2012 IEEEPacific (2012) IEEE pp 1ndash8 6
[JF16] JOHANSSON J FORSELL C Evaluation of parallel coordinatesOverview categorization and guidelines for future research IEEE Trans-actions on Visualization and Computer Graphics 22 1 (2016) 579ndash5885
[JFCS16] JAumlNICKE S FRANZINI G CHEEMA M SCHEUERMANNG Visual text analysis in digital humanities Computer Graphics Forum36 6 (2016) 7
[KCAlowast16] KO S CHO I AFZAL S YAU C CHAE J MALIK ABECK K JANG Y RIBARSKY W EBERT D S A survey on visualanalysis approaches for financial data Computer Graphics Forum 30 3(2016) 599 ndash 617 doi101111cgf12931 5 7
[Kei02] KEIM D A Information visualization and visual data miningIEEE Transactions on Visualization and Computer Graphics 8 1 (2002)pp 1ndash8 4 5
[KK15] KUCHER K KERREN A Text visualization techniques Tax-onomy visual survey and community insights In 2015 IEEE PacificVisualization Symposium (PacificVis) (2015) IEEE pp 117ndash121 7 8
[KK17] KERRACHER N KENNEDY J Constructing and evaluating vi-sualisation task classifications Process and considerations ComputerGraphics Forum 36 3 (2017) 47ndash59 5
[KKC15] KERRACHER N KENNEDY J CHALMERS K A task tax-onomy for temporal graph visualisation Visualization and ComputerGraphics IEEE Transactions on 21 10 (2015) 1160ndash1172 doi101109TVCG20152424889 3
[Lar10] LARAMEE R S How to write a visualization research paper Astarting point Computer Graphics Forum 29 8 (2010) 2363ndash2371 2 4
[Lar11] LARAMEE R S How to read a visualization research paperExtracting the essentials IEEE computer graphics and applications 313 (2011) 78ndash82 4
[Lar16] LARAMEE R S How to conduct a scientific literature surveyA starting point 2016 date accessed 2019-02-28 URL httpswwwyoutubecomwatchv=frYooEN360Q 4
[LBIlowast12] LAM H BERTINI E ISENBERG P PLAISANT C CARPEN-DALE S Empirical studies in information visualization Seven scenar-ios IEEE Transactions on Visualization and Computer Graphics 18 9(2012) 1520ndash1536 7 8
[LCMlowast16] LU J CHEN W MA Y KE J LI Z ZHANG F MA-CIEJEWSKI R Recent progress and trends in predictive visual analyticsFrontiers of Computer Science (2016) 1ndash16 8
[LH10] LIANG J HUANG M L Highlighting in information visual-ization A survey In 2010 14th International Conference InformationVisualisation (2010) IEEE pp 79ndash85 7
[LHDlowast04] LARAMEE R S HAUSER H DOLEISCH H VROLIJK BPOST F H WEISKOPF D The state of the art in flow visualizationDense and texture-based techniques Computer Graphics Forum 23 2(2004) 203ndash221 1 3 7
[LHZP07] LARAMEE R S HAUSER H ZHAO L POST F HTopology-based flow visualization the state of the art In Topology-based methods in visualization Springer 2007 pp 1ndash19 1
[LLClowast12] LIPSA D R LARAMEE R S COX S J ROBERTS J CWALKER R BORKIN M A PFISTER H Visualization for the phys-ical sciences Computer graphics forum 31 8 (2012) 2317ndash2347 1 37
[LMWlowast17] LIU S MALJOVEC D WANG B BREMER P-T PAS-CUCCI V Visualizing high-dimensional data Advances in the pastdecade IEEE Transactions on Visualization and Computer Graphics3 (2017) 1249ndash1268 7
[men18] Mendely 2018 date accessed 2019-02-28 URL httpswwwmendeleycom 4
[MFSlowast10] MURTHY K FARUQUIE T A SUBRAMANIAM L VPRASAD K H MOHANIA M Automatically generating term-frequency-induced taxonomies In Proceedings of the ACL 2010 Con-ference Short Papers (2010) Association for Computational Linguisticspp 126ndash131 5
[MGAN18] MERINO L GHAFARI M ANSLOW C NIER-STRASZ O A systematic literature review of software vi-sualization evaluation Journal of Systems and Software 144(2018) 165 ndash 180 URL httpwwwsciencedirectcomsciencearticlepiiS0164121218301237doihttpsdoiorg101016jjss2018060277
[MIKlowast16] MATTILA A-L IHANTOLA P KILAMO T LUOTO ANURMINEN M VAumlAumlTAumlJAuml H Software visualization today System-atic literature review In Proceedings of the 20th International AcademicMindtrek Conference (New York NY USA 2016) AcademicMindtrekrsquo16 ACM pp 262ndash271 URL httpdoiacmorg10114529943102994327 doi10114529943102994327 8
[ML17] MCNABB L LARAMEE R S Survey of surveys (sos)-mapping the landscape of survey papers in information visualizationComputer Graphics Forum 36 3 (2017) 589ndash617 1 3 4 5 7
ccopy 2019 The Author(s)Eurographics Proceedings ccopy 2019 The Eurographics Association
Liam McNabb and Robert S Laramee How to Write a Visualization Survey Paper A Starting Point
[MLPlowast10] MCLOUGHLIN T LARAMEE R S PEIKERT R POSTF H CHEN M Over two decades of integration-based geometricflow visualization Computer Graphics Forum 29 6 (2010) 1807ndash18291
[Mun08] MUNZNER T Process and pitfalls in writing information visu-alization research papers In Information visualization Springer 2008pp 134ndash153 4
[NK15] NUSRAT S KOBOUROV S Task taxonomy for cartograms17th IEEE Eurographics Conference on Visualization (EUROVIS - shortpapers) (2015) 6 7
[NK16] NUSRAT S KOBOUROV S The state of the art in cartogramsEurographics conference on Visualization (EuroVis)ndashState of The Art Re-ports 35 3 (2016) 619ndash642 URL httpsarxivorgabs160508485 4
[OGG07] OTTENS K GLEIZES M-P GLIZE P A multi-agent systemfor building dynamic ontologies In Proceedings of the 6th internationaljoint conference on Autonomous agents and multiagent systems (2007)ACM p 227 5
[PBB02] PARK Y BYRD R J BOGURAEV B K Automatic glossaryextraction beyond terminology identification In Proceedings of the 19thinternational conference on Computational linguistics-Volume 1 (2002)Association for Computational Linguistics pp 1ndash7 5
[PGB11] PATEL D GROumlLLER M E BRUCKNER S Phd educationthrough apprenticeship In Eurographics (Education Papers) (2011)pp 23ndash28 4
[PL09] PENG Z LARAMEE R S Higher dimensional vector field vi-sualization A survey In Theory and Practice of Computer Graphics(2009) pp 149ndash163 1
[PVHlowast03] POST F H VROLIJK B HAUSER H LARAMEE R SDOLEISCH H The state of the art in flow visualisation Feature ex-traction and tracking Computer Graphics Forum 22 4 (2003) 775ndash7921
[ref18] REFNWRITE Academic writing tools and research software - acomprehensive guide 2018 date accessed 2019-02-28 URL httpsbitly2NPqXoF 4
[RL18] ROBERTS R LARAMEE R S Visualising business dataA survey Information 9 11 (November 2018) doi103390info9110285 1
[RL19] REES D LARAMEE R S A survey of information visualiza-tion books Computer Graphics Forum (2019) doi101111cgf13595 1
[SDSW12] SHNEIDERMAN B DUNNE C SHARMA P WANGP Innovation trajectories for information visualizations Comparingtreemaps cone trees and hyperbolic trees Information Visualization11 2 (2012) 87ndash105 doi1011771473871611424815 7
[Shn96] SHNEIDERMAN B The eyes have it A task by data type tax-onomy for information visualizations In Visual Languages 1996 Pro-ceedings IEEE Symposium on (1996) IEEE pp 336ndash343 5
[SHS11] SCHULZ H-J HADLAK S SCHUMANN H The design spaceof implicit hierarchy visualization A survey IEEE Transactions on Vi-sualization and Computer Graphics 17 4 (2011) 393ndash411 6
[SM13] SASTRY M K MOHAMMED C The summary-comparisonmatrix A tool for writing the literature review In Professional Com-munication Conference (IPCC) 2013 IEEE International (2013) IEEEpp 1ndash5 3
[SNHS13] SCHULZ H-J NOCKE T HEITZLER M SCHUMANN HA design space of visualization tasks IEEE Transactions on Visu-alization and Computer Graphics 19 12 (2013) 2366ndash2375 doi101109TVCG2013120 3 5
[SS13] SECRIER M SCHNEIDER R Visualizing time-related data inbiology a review Briefings in bioinformatics 15 5 (2013) 771ndash782 7
[STMT12] SEDLMAIR M TATU A MUNZNER T TORY M A tax-onomy of visual cluster separation factors Computer Graphics Forum31 3pt4 (2012) 1335ndash1344 6
[TGKlowast14] TOMINSKI C GLADISCH S KISTER U DACHSELT RSCHUMANN H A survey on interactive lenses in visualization EuroVisState-of-the-Art Reports 3 (2014) 6 7
[TGKlowast16] TOMINSKI C GLADISCH S KISTER U DACHSELT RSCHUMANN H Interactive lenses for visualization An extended sur-vey In Computer Graphics Forum (2016) Wiley Online Library 7
[TRBlowast18] TONG C ROBERTS R BORGO R WALTON S LARAMEER S WEGBA K LU A WANG Y QU H LUO Q ET AL Story-telling and visualization An extended survey Information 9 3 (2018)65 1 3 6 7
[TWCL10] TSUI E WANG W M CHEUNG C F LAU A S Aconceptndashrelationship acquisition and inference approach for hierarchicaltaxonomy construction from tags Information processing amp manage-ment 46 1 (2010) 44ndash57 5
[VBW15] VEHLOW C BECK F WEISKOPF D The state of the art invisualizing group structures in graphs In Eurographics Conference onVisualization (EuroVis)-STARs (2015) VGTC The Eurographics Asso-ciation pp 21ndash40 doi102312eurovisstar20151110 67
[VCP07] VELARDI P CUCCHIARELLI A PETIT M A taxonomylearning method and its application to characterize a scientific web com-munity IEEE Transactions on Knowledge and Data Engineering 19 2(2007) 5
[VLKSlowast11] VON LANDESBERGER T KUIJPER A SCHRECK TKOHLHAMMER J VAN WIJK J J FEKETE J-D FELLNER D WVisual analysis of large graphs state-of-the-art and future research chal-lenges Computer graphics forum 30 6 (2011) 1719ndash1749 6 7
[WFLlowast15] WAGNER M FISCHER F LUH R HABERSON A RINDA KEIM D A AIGNER W A survey of visualization systems formalware analysis In Eurographics Conference on Visualization (Eu-roVis) - STARs (2015) The Eurographics Association pp 105ndash125doi102312eurovisstar20151114 7
[WSJlowast14] WANNER F STOFFEL A JAumlCKLE D KWON B CWEILER A KEIM D A ISAACS K E GIMEacuteNEZ A JUSUFI IGAMBLIN T State-of-the-art report of visual analysis for event de-tection in text data streams Computer Graphics Forum 33 3 (2014)doi102312eurovisstar20141176 7
[WZMlowast16] WANG X-M ZHANG T-Y MA Y-X XIA J CHEN WA survey of visual analytic pipelines Journal of Computer Science andTechnology 31 4 (2016) 787ndash804 7
[ZSBlowast12] ZHANG L STOFFEL A BEHRISCH M MITTELSTADT SSCHRECK T POMPL R WEBER S LAST H KEIM D Visual ana-lytics for the big data era - a comparative review of state-of-the-art com-mercial systems In Visual Analytics Science and Technology (VAST)2012 IEEE Conference on (2012) IEEE pp 173ndash182 7 8
[ZXYQ13] ZHOU H XU P YUAN X QU H Edge bundling in in-formation visualization Tsinghua Science and Technology 18 2 (2013)145ndash156 8
ccopy 2019 The Author(s)Eurographics Proceedings ccopy 2019 The Eurographics Association
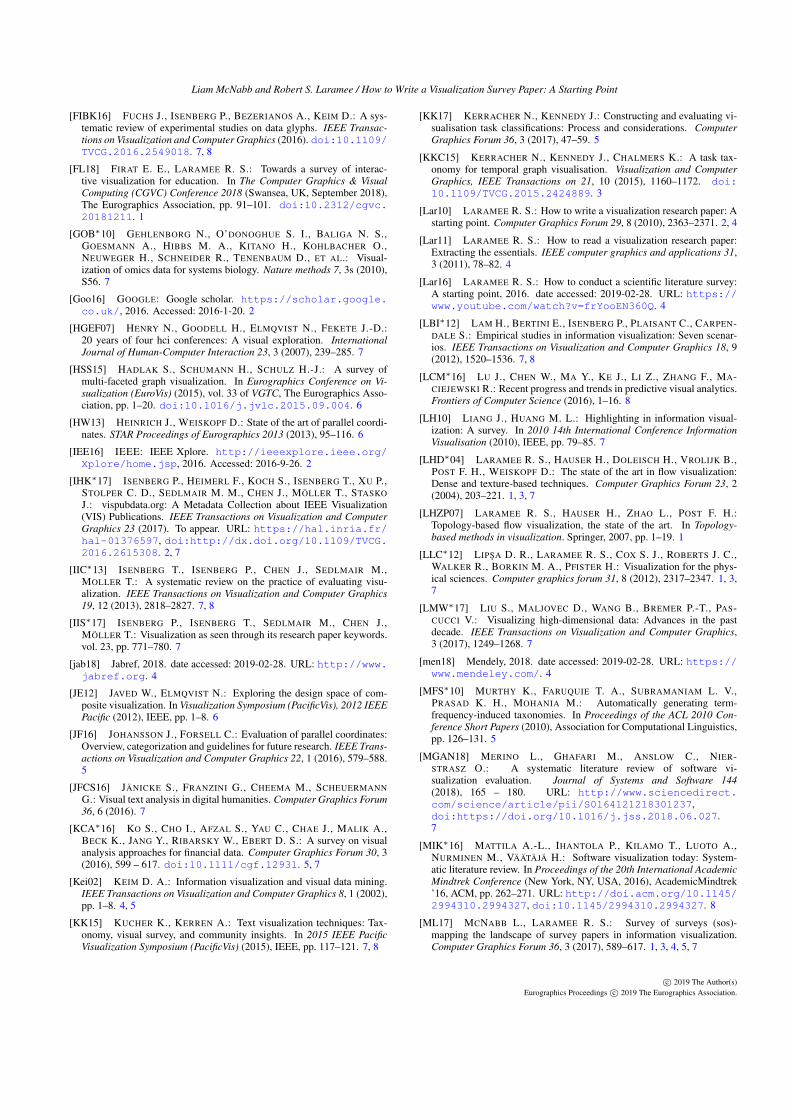
Liam McNabb and Robert S Laramee How to Write a Visualization Survey Paper A Starting Point
[MLPlowast10] MCLOUGHLIN T LARAMEE R S PEIKERT R POSTF H CHEN M Over two decades of integration-based geometricflow visualization Computer Graphics Forum 29 6 (2010) 1807ndash18291
[Mun08] MUNZNER T Process and pitfalls in writing information visu-alization research papers In Information visualization Springer 2008pp 134ndash153 4
[NK15] NUSRAT S KOBOUROV S Task taxonomy for cartograms17th IEEE Eurographics Conference on Visualization (EUROVIS - shortpapers) (2015) 6 7
[NK16] NUSRAT S KOBOUROV S The state of the art in cartogramsEurographics conference on Visualization (EuroVis)ndashState of The Art Re-ports 35 3 (2016) 619ndash642 URL httpsarxivorgabs160508485 4
[OGG07] OTTENS K GLEIZES M-P GLIZE P A multi-agent systemfor building dynamic ontologies In Proceedings of the 6th internationaljoint conference on Autonomous agents and multiagent systems (2007)ACM p 227 5
[PBB02] PARK Y BYRD R J BOGURAEV B K Automatic glossaryextraction beyond terminology identification In Proceedings of the 19thinternational conference on Computational linguistics-Volume 1 (2002)Association for Computational Linguistics pp 1ndash7 5
[PGB11] PATEL D GROumlLLER M E BRUCKNER S Phd educationthrough apprenticeship In Eurographics (Education Papers) (2011)pp 23ndash28 4
[PL09] PENG Z LARAMEE R S Higher dimensional vector field vi-sualization A survey In Theory and Practice of Computer Graphics(2009) pp 149ndash163 1
[PVHlowast03] POST F H VROLIJK B HAUSER H LARAMEE R SDOLEISCH H The state of the art in flow visualisation Feature ex-traction and tracking Computer Graphics Forum 22 4 (2003) 775ndash7921
[ref18] REFNWRITE Academic writing tools and research software - acomprehensive guide 2018 date accessed 2019-02-28 URL httpsbitly2NPqXoF 4
[RL18] ROBERTS R LARAMEE R S Visualising business dataA survey Information 9 11 (November 2018) doi103390info9110285 1
[RL19] REES D LARAMEE R S A survey of information visualiza-tion books Computer Graphics Forum (2019) doi101111cgf13595 1
[SDSW12] SHNEIDERMAN B DUNNE C SHARMA P WANGP Innovation trajectories for information visualizations Comparingtreemaps cone trees and hyperbolic trees Information Visualization11 2 (2012) 87ndash105 doi1011771473871611424815 7
[Shn96] SHNEIDERMAN B The eyes have it A task by data type tax-onomy for information visualizations In Visual Languages 1996 Pro-ceedings IEEE Symposium on (1996) IEEE pp 336ndash343 5
[SHS11] SCHULZ H-J HADLAK S SCHUMANN H The design spaceof implicit hierarchy visualization A survey IEEE Transactions on Vi-sualization and Computer Graphics 17 4 (2011) 393ndash411 6
[SM13] SASTRY M K MOHAMMED C The summary-comparisonmatrix A tool for writing the literature review In Professional Com-munication Conference (IPCC) 2013 IEEE International (2013) IEEEpp 1ndash5 3
[SNHS13] SCHULZ H-J NOCKE T HEITZLER M SCHUMANN HA design space of visualization tasks IEEE Transactions on Visu-alization and Computer Graphics 19 12 (2013) 2366ndash2375 doi101109TVCG2013120 3 5
[SS13] SECRIER M SCHNEIDER R Visualizing time-related data inbiology a review Briefings in bioinformatics 15 5 (2013) 771ndash782 7
[STMT12] SEDLMAIR M TATU A MUNZNER T TORY M A tax-onomy of visual cluster separation factors Computer Graphics Forum31 3pt4 (2012) 1335ndash1344 6
[TGKlowast14] TOMINSKI C GLADISCH S KISTER U DACHSELT RSCHUMANN H A survey on interactive lenses in visualization EuroVisState-of-the-Art Reports 3 (2014) 6 7
[TGKlowast16] TOMINSKI C GLADISCH S KISTER U DACHSELT RSCHUMANN H Interactive lenses for visualization An extended sur-vey In Computer Graphics Forum (2016) Wiley Online Library 7
[TRBlowast18] TONG C ROBERTS R BORGO R WALTON S LARAMEER S WEGBA K LU A WANG Y QU H LUO Q ET AL Story-telling and visualization An extended survey Information 9 3 (2018)65 1 3 6 7
[TWCL10] TSUI E WANG W M CHEUNG C F LAU A S Aconceptndashrelationship acquisition and inference approach for hierarchicaltaxonomy construction from tags Information processing amp manage-ment 46 1 (2010) 44ndash57 5
[VBW15] VEHLOW C BECK F WEISKOPF D The state of the art invisualizing group structures in graphs In Eurographics Conference onVisualization (EuroVis)-STARs (2015) VGTC The Eurographics Asso-ciation pp 21ndash40 doi102312eurovisstar20151110 67
[VCP07] VELARDI P CUCCHIARELLI A PETIT M A taxonomylearning method and its application to characterize a scientific web com-munity IEEE Transactions on Knowledge and Data Engineering 19 2(2007) 5
[VLKSlowast11] VON LANDESBERGER T KUIJPER A SCHRECK TKOHLHAMMER J VAN WIJK J J FEKETE J-D FELLNER D WVisual analysis of large graphs state-of-the-art and future research chal-lenges Computer graphics forum 30 6 (2011) 1719ndash1749 6 7
[WFLlowast15] WAGNER M FISCHER F LUH R HABERSON A RINDA KEIM D A AIGNER W A survey of visualization systems formalware analysis In Eurographics Conference on Visualization (Eu-roVis) - STARs (2015) The Eurographics Association pp 105ndash125doi102312eurovisstar20151114 7
[WSJlowast14] WANNER F STOFFEL A JAumlCKLE D KWON B CWEILER A KEIM D A ISAACS K E GIMEacuteNEZ A JUSUFI IGAMBLIN T State-of-the-art report of visual analysis for event de-tection in text data streams Computer Graphics Forum 33 3 (2014)doi102312eurovisstar20141176 7
[WZMlowast16] WANG X-M ZHANG T-Y MA Y-X XIA J CHEN WA survey of visual analytic pipelines Journal of Computer Science andTechnology 31 4 (2016) 787ndash804 7
[ZSBlowast12] ZHANG L STOFFEL A BEHRISCH M MITTELSTADT SSCHRECK T POMPL R WEBER S LAST H KEIM D Visual ana-lytics for the big data era - a comparative review of state-of-the-art com-mercial systems In Visual Analytics Science and Technology (VAST)2012 IEEE Conference on (2012) IEEE pp 173ndash182 7 8
[ZXYQ13] ZHOU H XU P YUAN X QU H Edge bundling in in-formation visualization Tsinghua Science and Technology 18 2 (2013)145ndash156 8
ccopy 2019 The Author(s)Eurographics Proceedings ccopy 2019 The Eurographics Association