Embed Size (px)
Citation preview
How To Write an IB/AP Lab Report In order to be successful in the lab portion of this class, you will need to write a lab report for each experiment/lab activity you do. In order to receive credit for a written report it will be necessary for it to be complete and in the appropriate format. Your title should be centered at the top of the 1st page and it should be appropriate. Design
1. Purpose: A defined problem or research question or reason for doing the lab. Include with this or as a separate point under this section, should be some background information of the topic (I will usually guide you with a particular question).
2. Hypothesis: Is a proposed solution for the purpose and includes an explanation why you believe what you do. *Not all labs have a hypothesis but you should still list it but say there is none.
3. Controls & Variables: a. The controls are the lab parts that are there to keep the experiment consistent from
one set-up to another, thereby eliminating all variables expect the one being tested. b. The variable that is deliberately changed is called the or “independent variable.”
Not all labs involve us manipulating something like time or light or gender etc.—you don’t have to list this if there is no independent variables.
c. The variable that is observed and that changes in response to the manipulated variable is called the “dependent variable.”
4. Materials: Since most of your lab materials are given to you, all you do is list any hazardous materials or warnings associated with the lab. A drawing of the lab set up is recommended for future and current AP/IB Biology students.
5. Procedures: List any precautions or warnings. Also give a brief overview of what we are doing in the lab. Think of how you would describe the lab to your partner if they missed the lab-besides it sucked!
For some AP and IB labs you may be asked to… 1. Design a method/procedure with appropriate materials. 2. Design a method/procedure for the control of variables. 3. Design a method for the collection of raw data.
Data Collection and Processing: This consists of 2 main criteria: 1. Observations:
Make sure all drawings are in pencil, realistic and to scale. See example drawing on the backside of this page.
2. Recording and presentation of data with the appropriate units. For any given lab, everyone needs their own set of raw data tables and drawings. If
your partner is absent, we can still collect class data to post online for the other students to use.
Carefully record all raw data in neatly, organized tables (use rulers and write legibly.)
3. Transforming and manipulation of raw data: this includes answering all questions in complete sentences.
When applicable give formulas and show all calculations. 4. Presentation of processed data: data/results are presented appropriately and
effectively, i.e. graphs of data, statistic data tables etc..
Conclusions and evaluations: Consists of 3 parts: 1. Interpretation of results: drawing valid conclusions (i.e. support or reject your
hypothesis) based on your data, with an explanation. Where appropriate, results are compared with given/known values.
2. Evaluate procedure: The procedure (i.e. materials and methods) including limitations, weaknesses or errors in manipulation are evaluated (discussion of the limitations of data analysis may be included.)
3. Modifying the Procedure: Suggest ways to improve the lab or suggest an area for further study. This should be based on the identification of weaknesses or limitations. This is not the time to slam the instructor on how useless the lab was in your eyes.
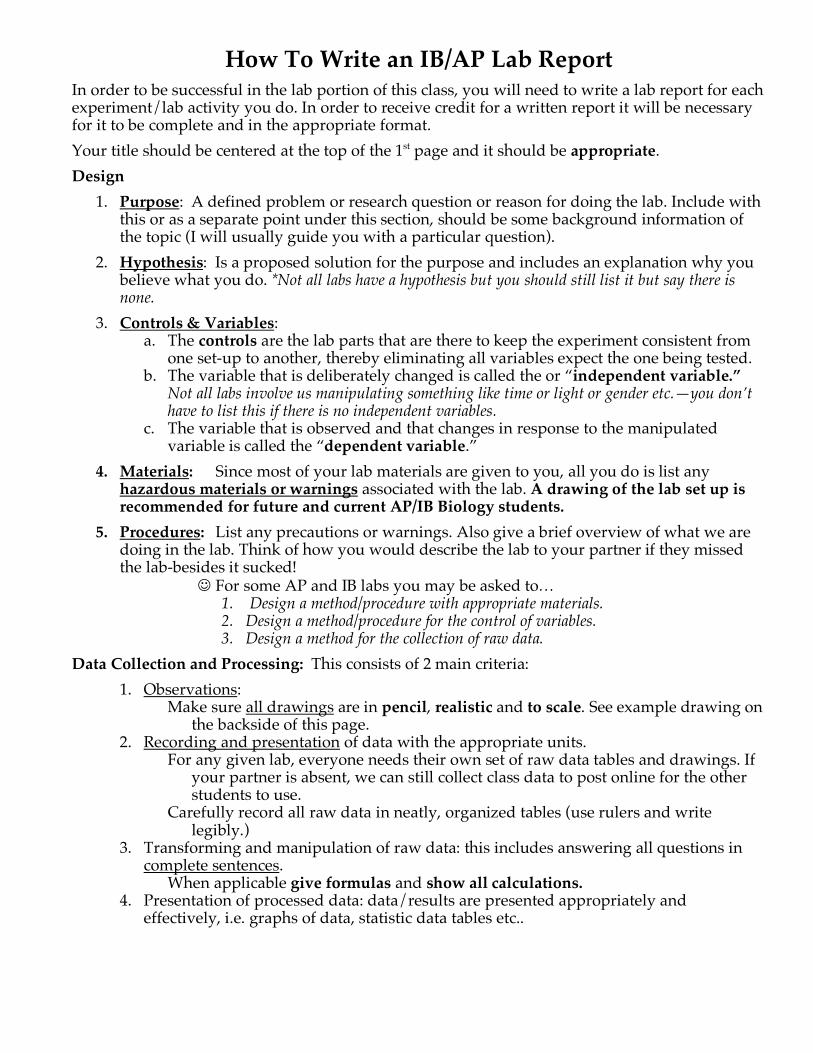
Microscopic Drawing Instructions: 1. Drawings should be done in pencil on unlined paper and graphs should be on
graphing paper. Each partner needs his or her own drawings for any lab. 2. Use ruler to draw lines. 3. Either they should be left or right side of drawing shouldn’t cross over. 4. Labels should be at end of line, not on the line. 5. Use petri dish (or approximately 3” diameter circular object) to draw field of vision. 6. Make sure picture is realistic. I’m not expecting Rembrandt, but something better than
stick figures. Color is not expected, but it adds to realism in most cases. 7. The size of the object should be to scale for field of vision, i.e. it should take up the same
amount of the circle on your paper as when you look at it in the scope.
receding hairline
ultrasonic ears
beady eyes
goofy smile
scruffy goat tee
Microscopic Mr. Ingham
Title - should reflect what your drawing
Total Mag. 400X
multiply objective by eye piece
Sloped forehead
Flat feet
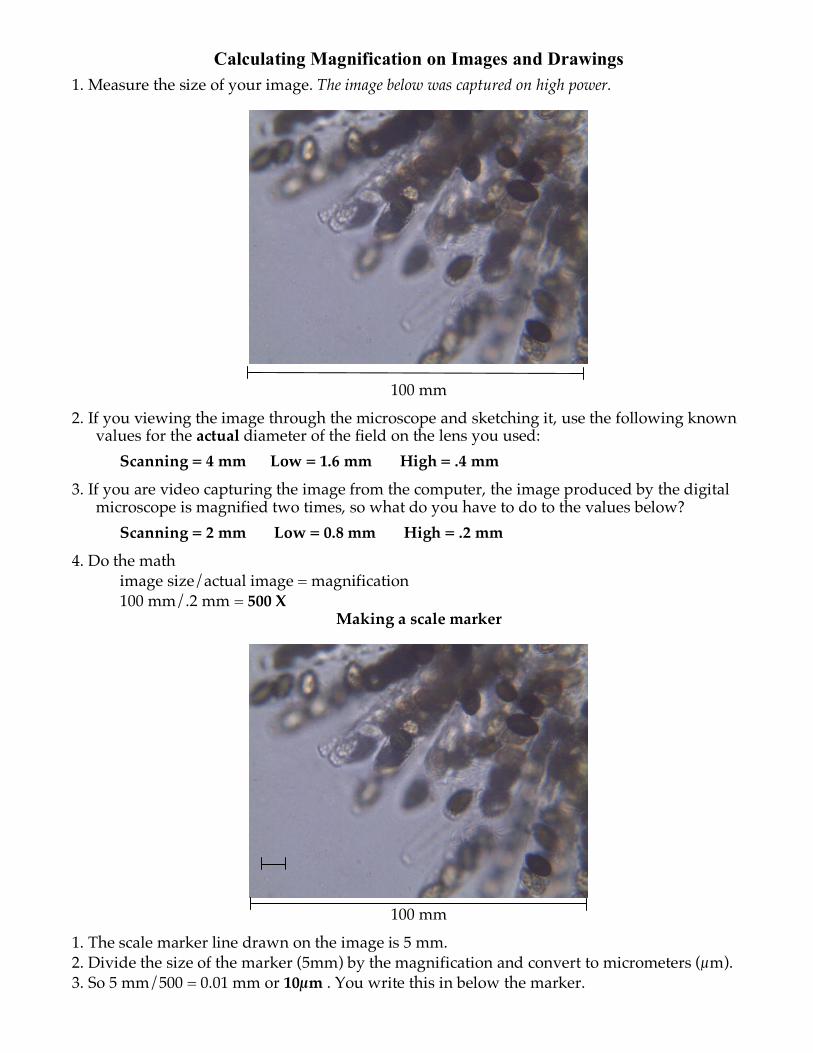
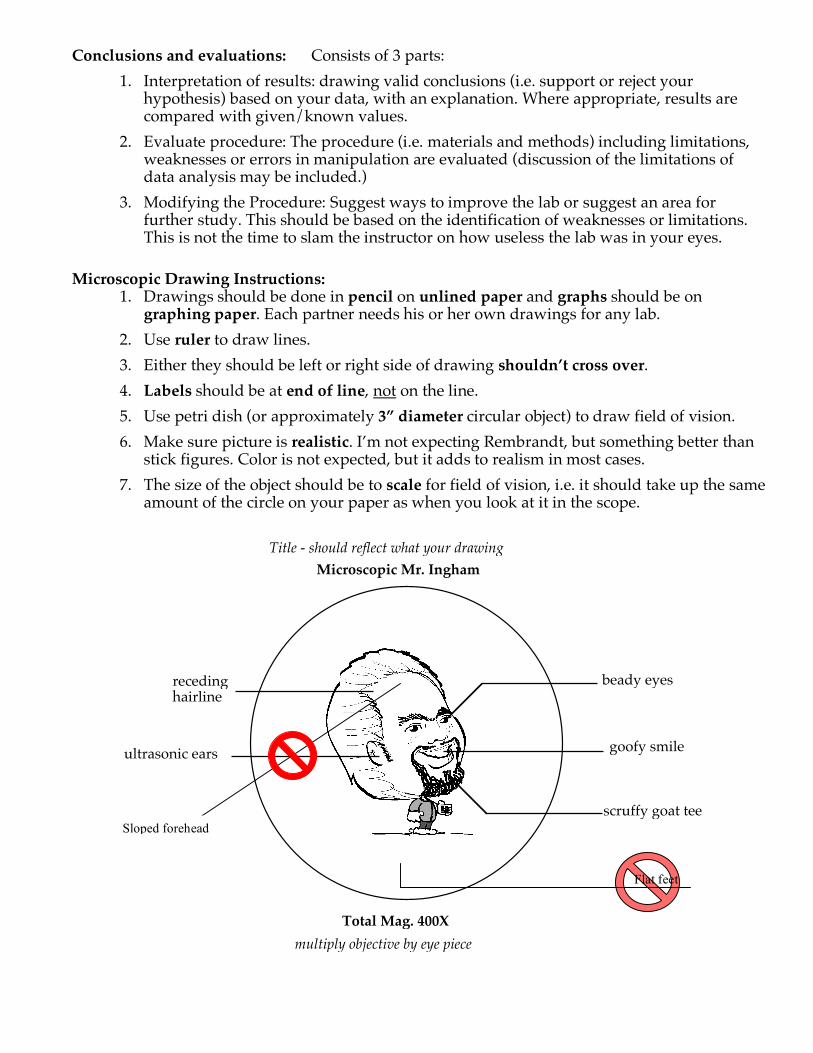
Calculating Magnification on Images and Drawings
1. Measure the size of your image. The image below was captured on high power.
100 mm 2. If you viewing the image through the microscope and sketching it, use the following known
values for the actual diameter of the field on the lens you used: Scanning = 4 mm Low = 1.6 mm High = .4 mm 3. If you are video capturing the image from the computer, the image produced by the digital
microscope is magnified two times, so what do you have to do to the values below? Scanning = 2 mm Low = 0.8 mm High = .2 mm 4. Do the math image size/actual image = magnification
100 mm/.2 mm = 500 X Making a scale marker
100 mm
1. The scale marker line drawn on the image is 5 mm. 2. Divide the size of the marker (5mm) by the magnification and convert to micrometers (µm). 3. So 5 mm/500 = 0.01 mm or 10µm . You write this in below the marker.
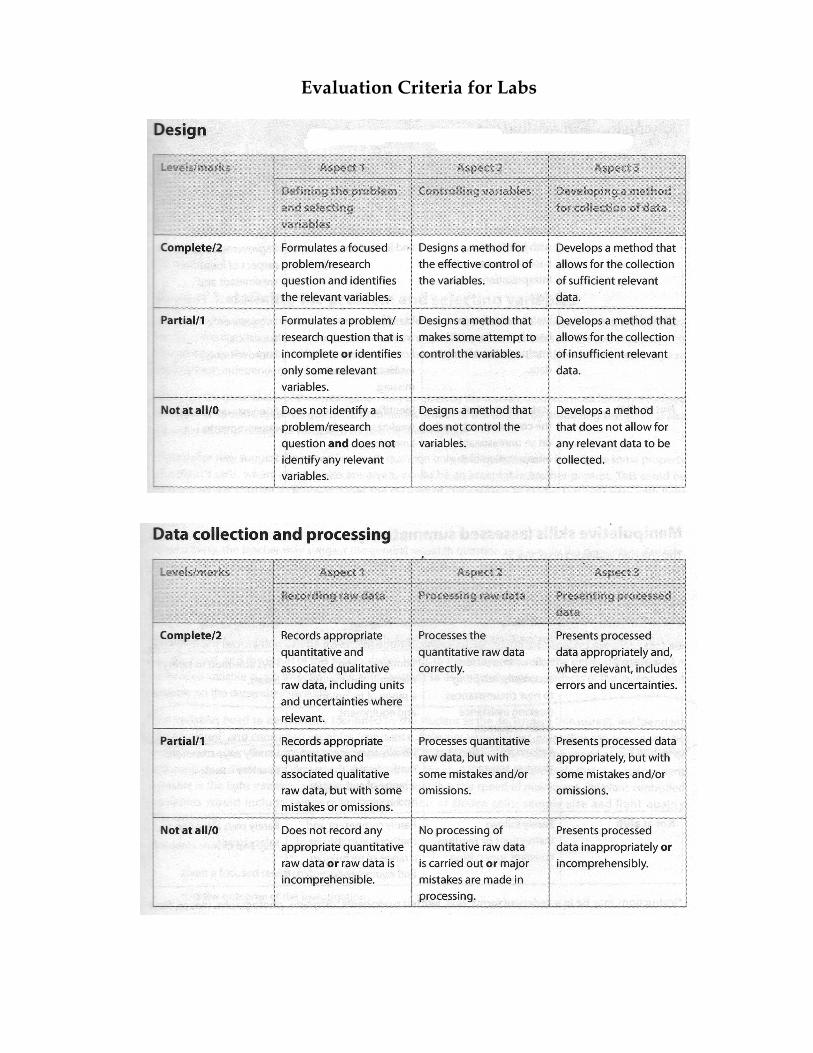
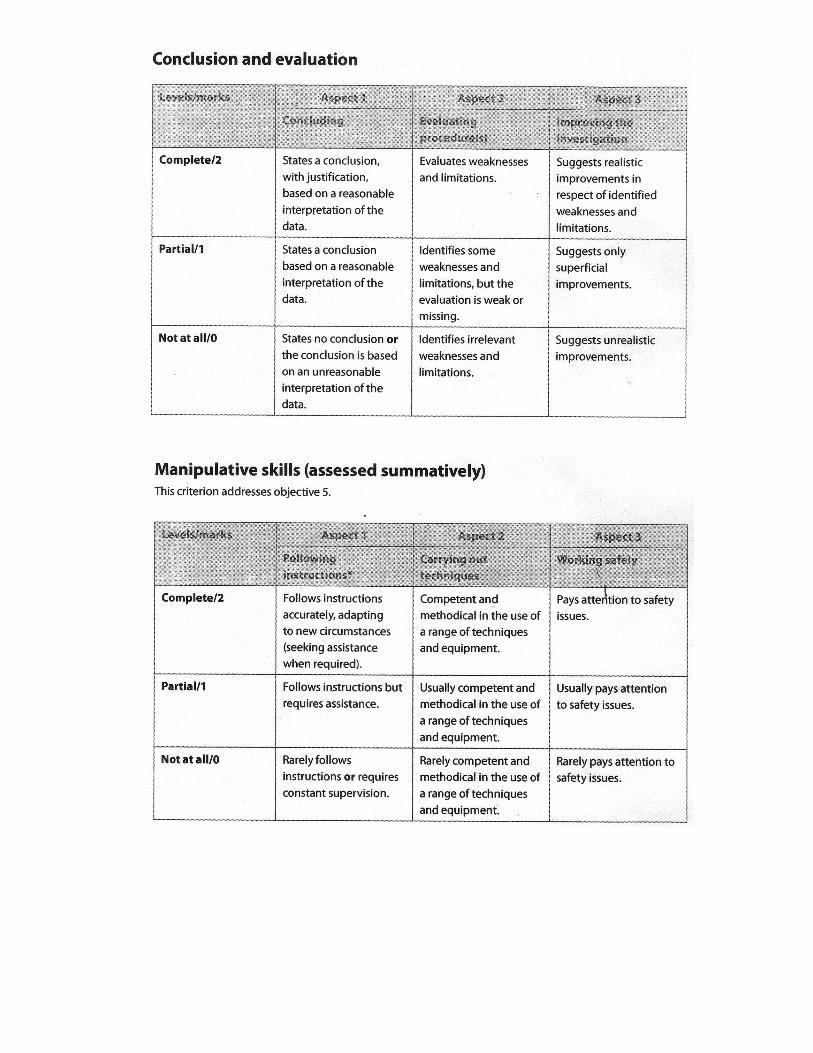
Evaluation Criteria for Labs
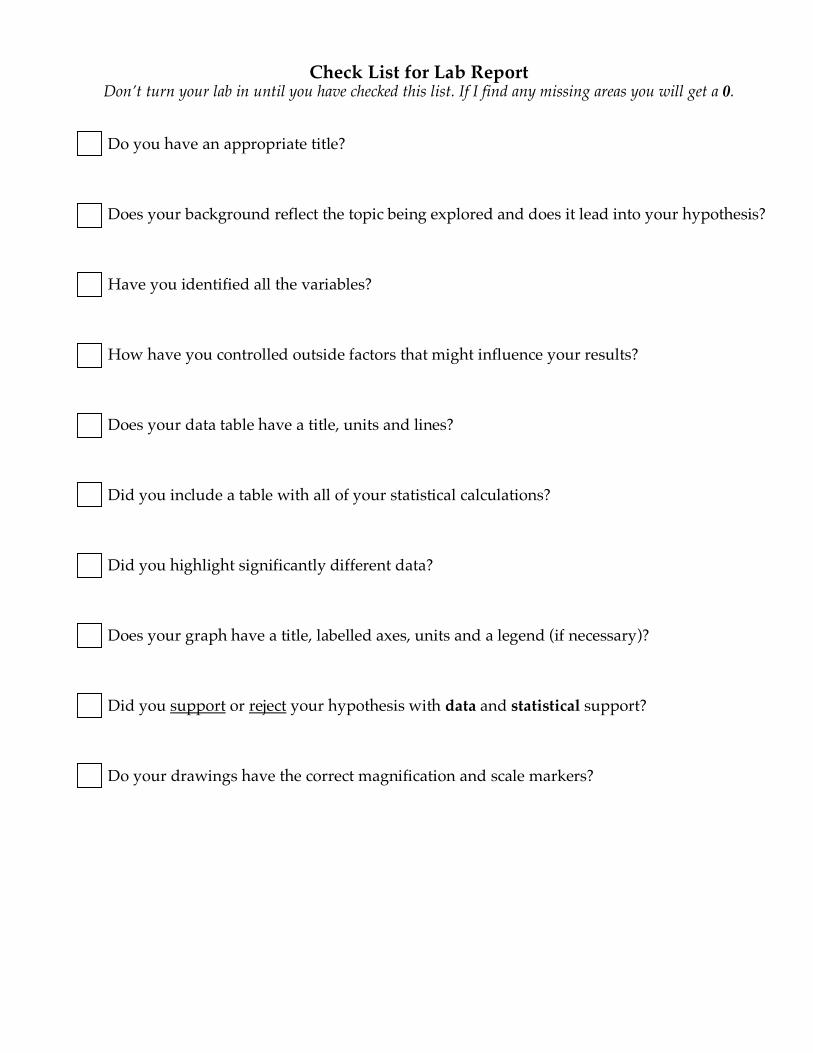
Check List for Lab Report
Don’t turn your lab in until you have checked this list. If I find any missing areas you will get a 0.
Do you have an appropriate title? Does your background reflect the topic being explored and does it lead into your hypothesis? Have you identified all the variables? How have you controlled outside factors that might influence your results? Does your data table have a title, units and lines? Did you include a table with all of your statistical calculations? Did you highlight significantly different data? Does your graph have a title, labelled axes, units and a legend (if necessary)? Did you support or reject your hypothesis with data and statistical support? Do your drawings have the correct magnification and scale markers?