Embed Size (px)
Citation preview
1
PEW RESEARCH CENTER
www.pewresearch.org
How we analyzed Twitter social media networks with NodeXL
Social media include all the ways people connect to people through computation. Mobile devices, social networks,
email, texting, micro-blogging and location sharing are just a few of the many ways people engage in computer-
mediated collective action. As people link, like, follow, friend, reply, retweet, comment, tag, rate, review, edit,
update, and text one another (among other channels) they form collections of connections. These collections
contain network structures that can be extracted, analyzed and visualized. The result can be insights into the
structure, size, and key positions in these networks.
Social media networks form in Twitter around a wide range of terms. People talk about the news of the day,
celebrities, companies, technology, entertainment, and more. As each person uses Twitter they form networks as
they follow, reply and mention one another. These connections are visible in the text of each tweet or by
requesting lists of the users that follow the author of each tweet from Twitter.
We collected, analyzed and visualized social media network data from Twitter using NodeXL, the free and open
add-in for Excel 2007/2010/2013. NodeXL is a project from the Social Media Research Foundation1, a not-for-
profit organization dedicated to creating open tools, open data, and open scholarship related to social media.
NodeXL is a general purpose network analysis application that supports network overview, discovery and
exploration2. The tool enables the automation of a data flow that starts with the collection of network data and
moves through multiple steps until final processed network visualizations and reports are generated (figure 1).
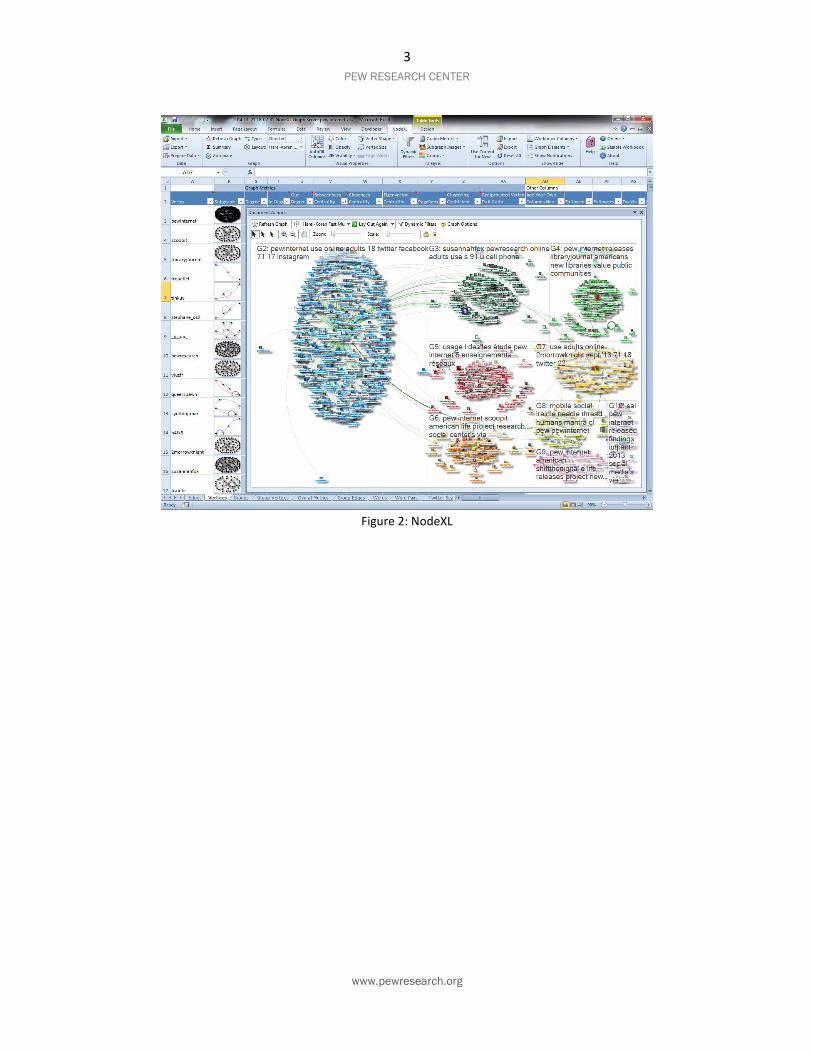
NodeXL allows non-programmers to quickly generate useful network statistics; metrics and visualizations in the
context of the familiar Excel spreadsheet (figure 2). Simple filtering and flexible display attributes can be used to
highlight important structures in networks easily.
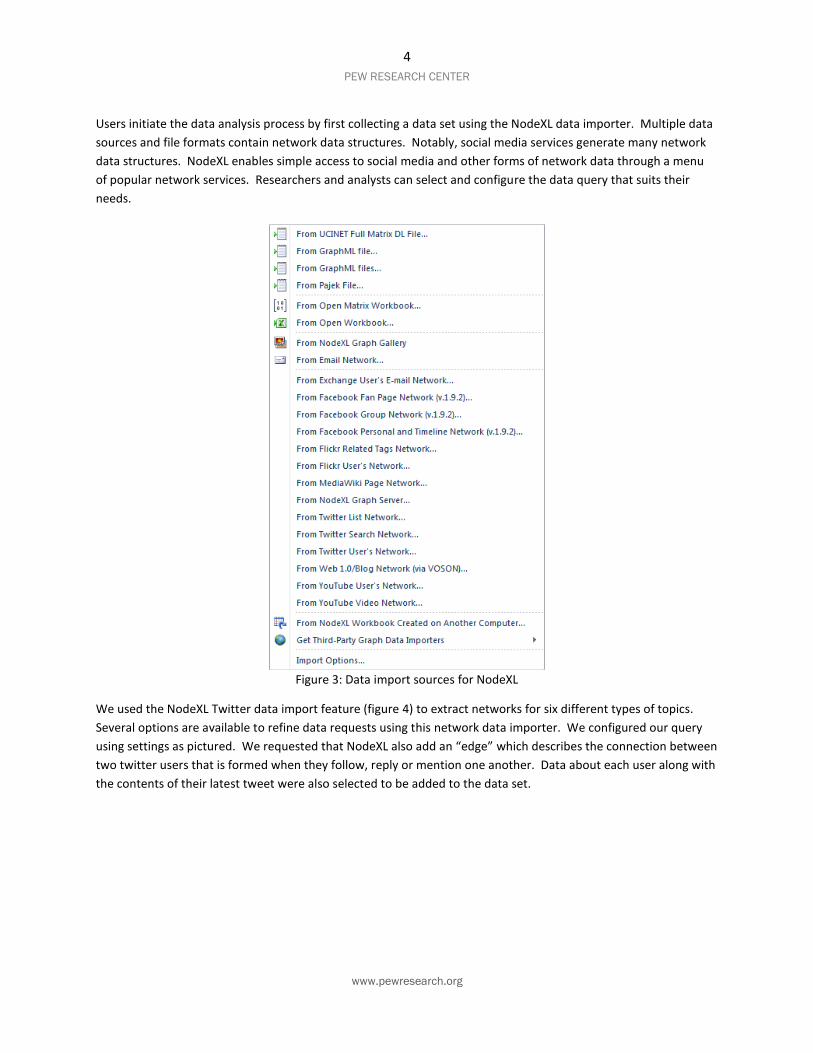
NodeXL supports the exploration of social media with import features that extract network data from a range of
data sources like personal email indexes on the desktop, Twitter, Flickr, YouTube, Facebook, Wikis and WWW
hyper-links (see figure 3). Other sources of data can be imported through text, CSV, or GraphML files.
1 The Social Media Research Foundation: http://www.smrfoundation.org
2 Technical questions about NodeXL can be asked on the project discussion boards at
http://nodexl.codeplex.com/Thread/List.aspx. A book Analyzing Social Media Networks with NodeXL: Insights from a connected world is available from Morgan-Kaufmann.
NUMBERS, FACTS AND TRENDS SHAPING THE WORLD
In association with the Social Media
Research Foundation
2
PEW RESEARCH CENTER
www.pewresearch.org
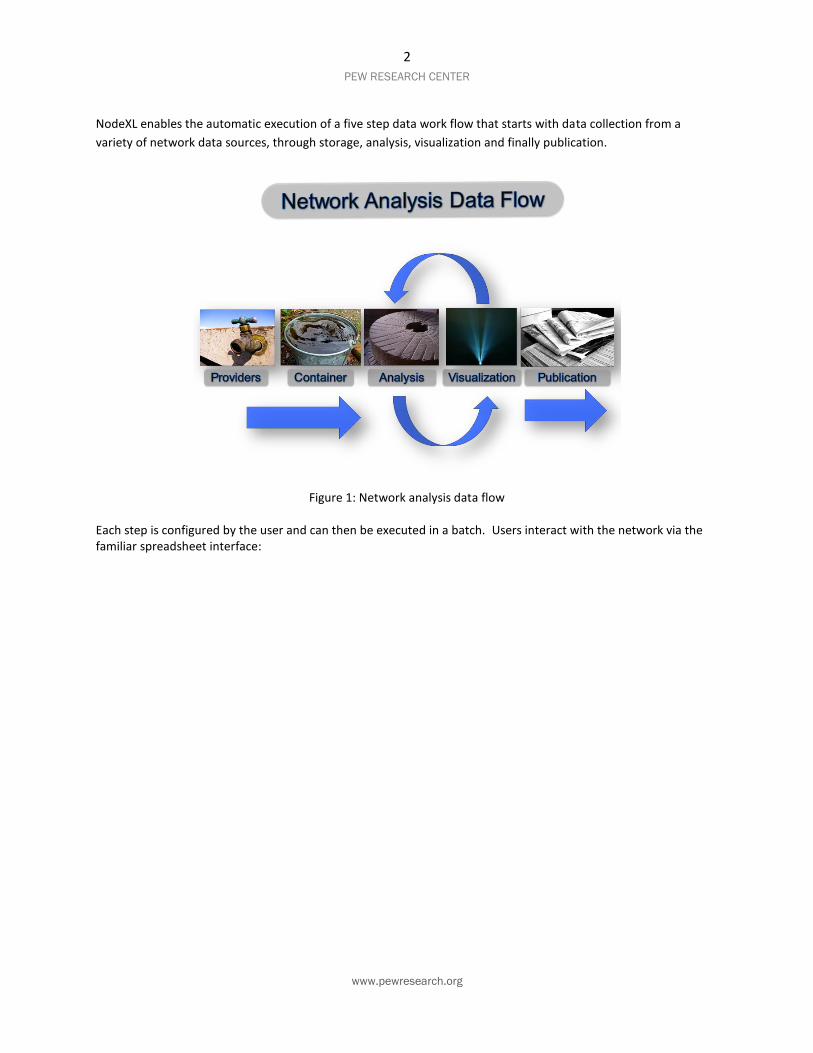
NodeXL enables the automatic execution of a five step data work flow that starts with data collection from a
variety of network data sources, through storage, analysis, visualization and finally publication.
Figure 1: Network analysis data flow
Each step is configured by the user and can then be executed in a batch. Users interact with the network via the familiar spreadsheet interface:
3
PEW RESEARCH CENTER
www.pewresearch.org
Figure 2: NodeXL
4
PEW RESEARCH CENTER
www.pewresearch.org
Users initiate the data analysis process by first collecting a data set using the NodeXL data importer. Multiple data
sources and file formats contain network data structures. Notably, social media services generate many network
data structures. NodeXL enables simple access to social media and other forms of network data through a menu
of popular network services. Researchers and analysts can select and configure the data query that suits their
needs.
Figure 3: Data import sources for NodeXL
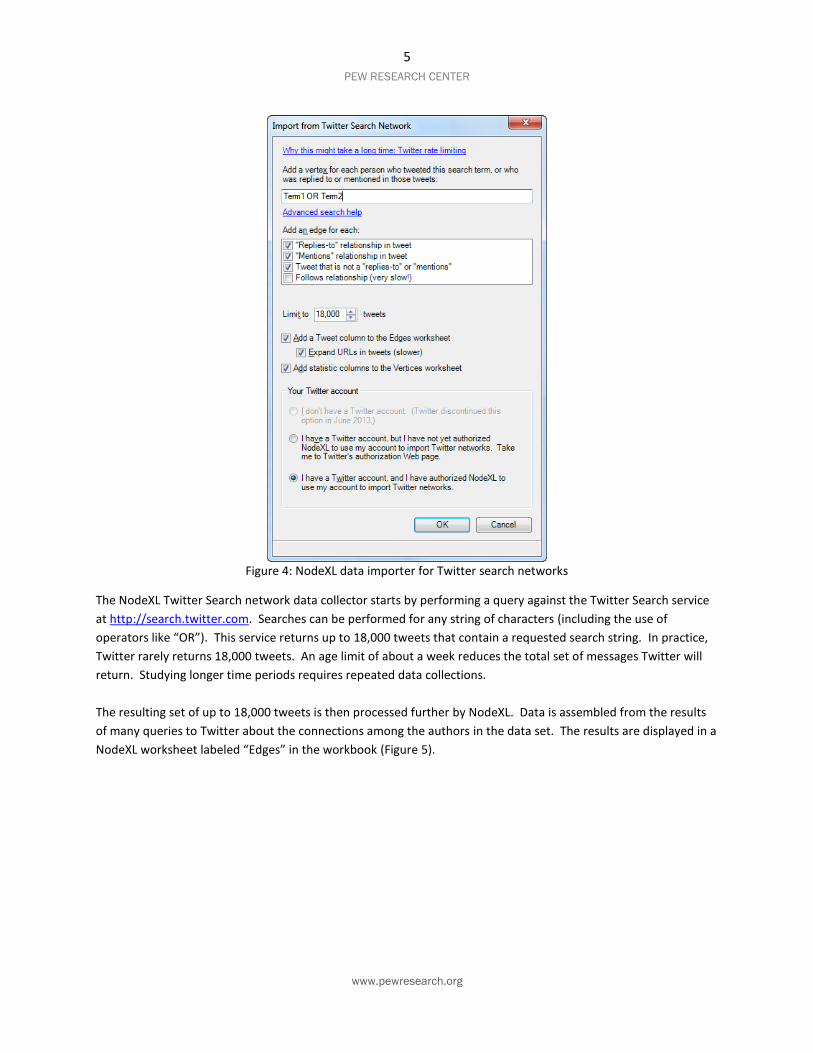
We used the NodeXL Twitter data import feature (figure 4) to extract networks for six different types of topics.
Several options are available to refine data requests using this network data importer. We configured our query
using settings as pictured. We requested that NodeXL also add an “edge” which describes the connection between
two twitter users that is formed when they follow, reply or mention one another. Data about each user along with
the contents of their latest tweet were also selected to be added to the data set.
5
PEW RESEARCH CENTER
www.pewresearch.org
Figure 4: NodeXL data importer for Twitter search networks
The NodeXL Twitter Search network data collector starts by performing a query against the Twitter Search service
at http://search.twitter.com. Searches can be performed for any string of characters (including the use of
operators like “OR”). This service returns up to 18,000 tweets that contain a requested search string. In practice,
Twitter rarely returns 18,000 tweets. An age limit of about a week reduces the total set of messages Twitter will
return. Studying longer time periods requires repeated data collections.
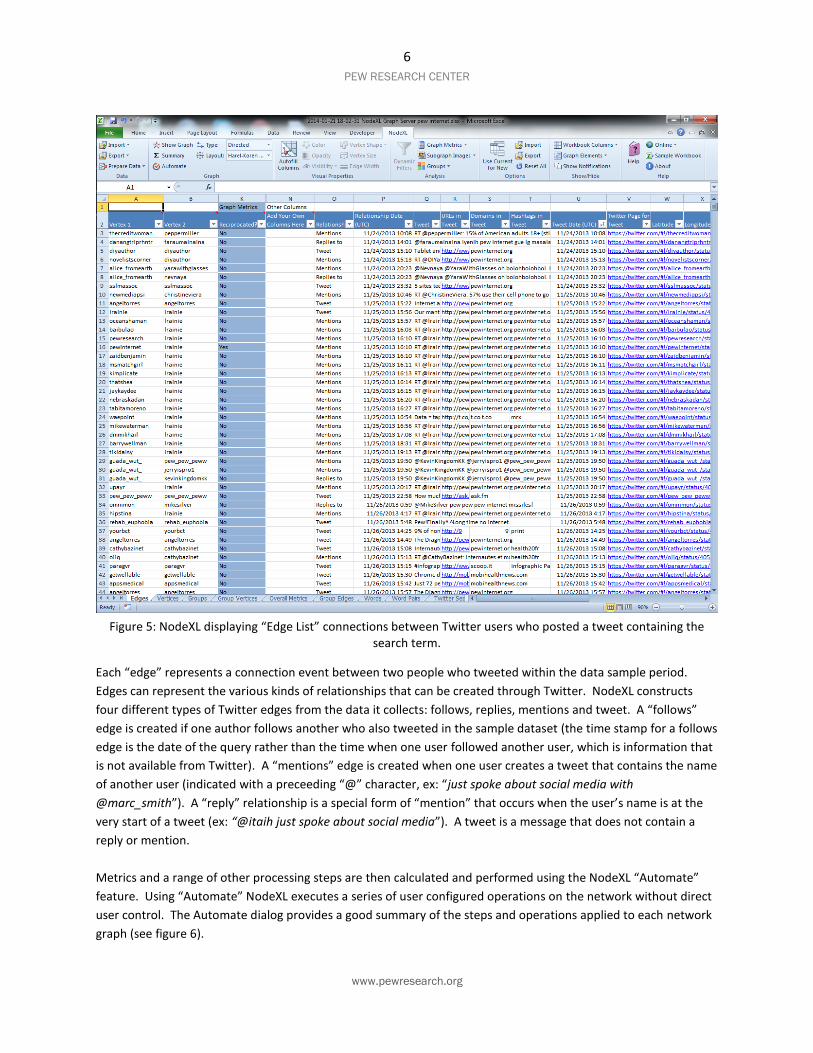
The resulting set of up to 18,000 tweets is then processed further by NodeXL. Data is assembled from the results
of many queries to Twitter about the connections among the authors in the data set. The results are displayed in a
NodeXL worksheet labeled “Edges” in the workbook (Figure 5).
6
PEW RESEARCH CENTER
www.pewresearch.org
Figure 5: NodeXL displaying “Edge List” connections between Twitter users who posted a tweet containing the
search term.
Each “edge” represents a connection event between two people who tweeted within the data sample period.
Edges can represent the various kinds of relationships that can be created through Twitter. NodeXL constructs
four different types of Twitter edges from the data it collects: follows, replies, mentions and tweet. A “follows”
edge is created if one author follows another who also tweeted in the sample dataset (the time stamp for a follows
edge is the date of the query rather than the time when one user followed another user, which is information that
is not available from Twitter). A “mentions” edge is created when one user creates a tweet that contains the name
of another user (indicated with a preceeding “@” character, ex: “just spoke about social media with
@marc_smith”). A “reply” relationship is a special form of “mention” that occurs when the user’s name is at the
very start of a tweet (ex: “@itaih just spoke about social media”). A tweet is a message that does not contain a
reply or mention.
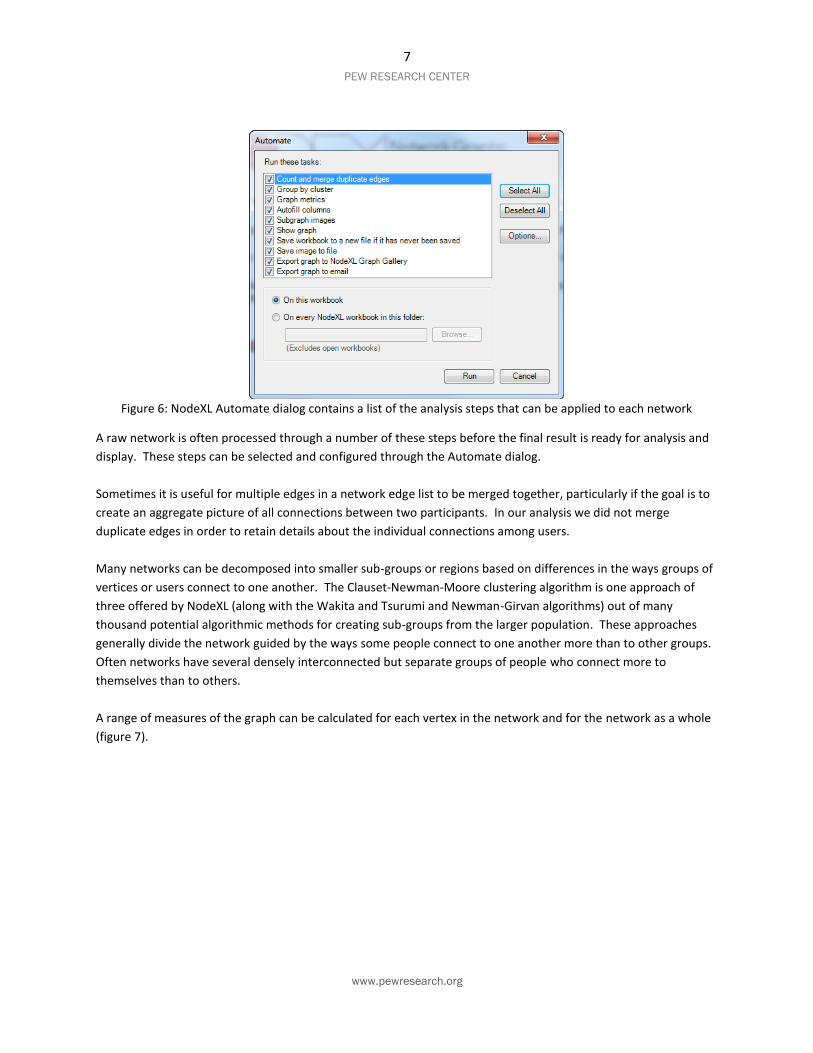
Metrics and a range of other processing steps are then calculated and performed using the NodeXL “Automate”
feature. Using “Automate” NodeXL executes a series of user configured operations on the network without direct
user control. The Automate dialog provides a good summary of the steps and operations applied to each network
graph (see figure 6).
7
PEW RESEARCH CENTER
www.pewresearch.org
Figure 6: NodeXL Automate dialog contains a list of the analysis steps that can be applied to each network
A raw network is often processed through a number of these steps before the final result is ready for analysis and
display. These steps can be selected and configured through the Automate dialog.
Sometimes it is useful for multiple edges in a network edge list to be merged together, particularly if the goal is to
create an aggregate picture of all connections between two participants. In our analysis we did not merge
duplicate edges in order to retain details about the individual connections among users.
Many networks can be decomposed into smaller sub-groups or regions based on differences in the ways groups of
vertices or users connect to one another. The Clauset-Newman-Moore clustering algorithm is one approach of
three offered by NodeXL (along with the Wakita and Tsurumi and Newman-Girvan algorithms) out of many
thousand potential algorithmic methods for creating sub-groups from the larger population. These approaches
generally divide the network guided by the ways some people connect to one another more than to other groups.
Often networks have several densely interconnected but separate groups of people who connect more to
themselves than to others.
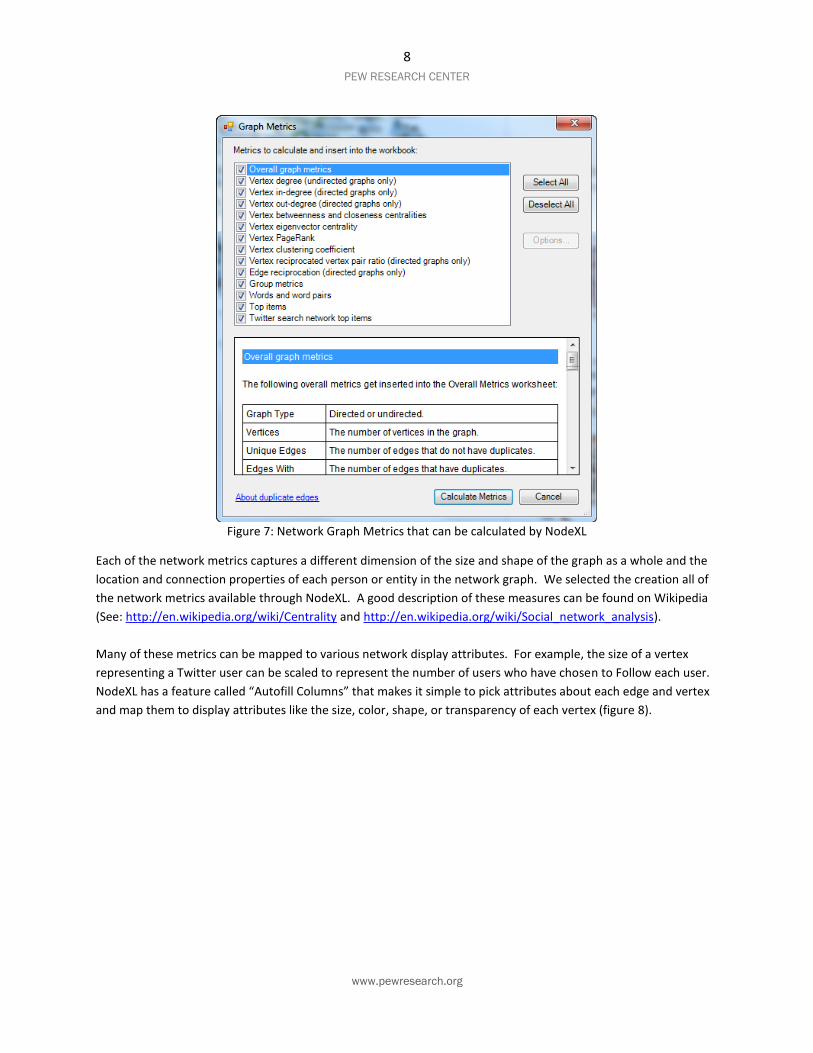
A range of measures of the graph can be calculated for each vertex in the network and for the network as a whole
(figure 7).
8
PEW RESEARCH CENTER
www.pewresearch.org
Figure 7: Network Graph Metrics that can be calculated by NodeXL
Each of the network metrics captures a different dimension of the size and shape of the graph as a whole and the
location and connection properties of each person or entity in the network graph. We selected the creation all of
the network metrics available through NodeXL. A good description of these measures can be found on Wikipedia
(See: http://en.wikipedia.org/wiki/Centrality and http://en.wikipedia.org/wiki/Social_network_analysis).
Many of these metrics can be mapped to various network display attributes. For example, the size of a vertex
representing a Twitter user can be scaled to represent the number of users who have chosen to Follow each user.
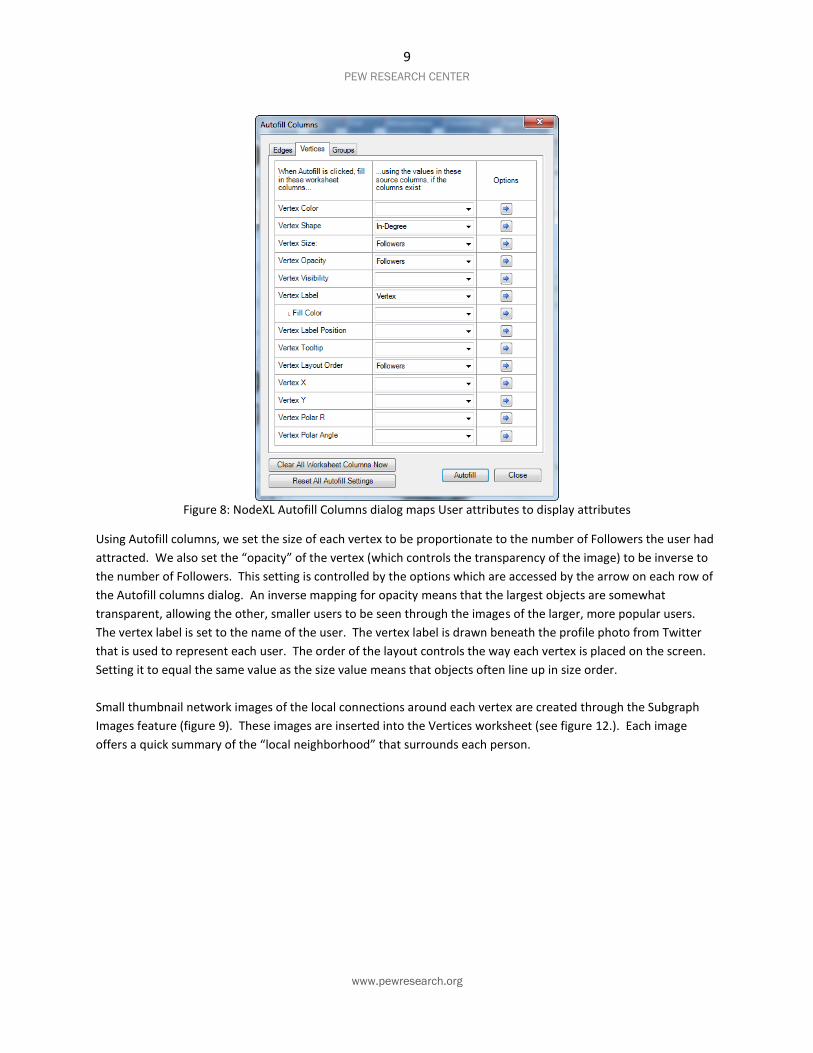
NodeXL has a feature called “Autofill Columns” that makes it simple to pick attributes about each edge and vertex
and map them to display attributes like the size, color, shape, or transparency of each vertex (figure 8).
9
PEW RESEARCH CENTER
www.pewresearch.org
Figure 8: NodeXL Autofill Columns dialog maps User attributes to display attributes
Using Autofill columns, we set the size of each vertex to be proportionate to the number of Followers the user had
attracted. We also set the “opacity” of the vertex (which controls the transparency of the image) to be inverse to
the number of Followers. This setting is controlled by the options which are accessed by the arrow on each row of
the Autofill columns dialog. An inverse mapping for opacity means that the largest objects are somewhat
transparent, allowing the other, smaller users to be seen through the images of the larger, more popular users.
The vertex label is set to the name of the user. The vertex label is drawn beneath the profile photo from Twitter
that is used to represent each user. The order of the layout controls the way each vertex is placed on the screen.
Setting it to equal the same value as the size value means that objects often line up in size order.
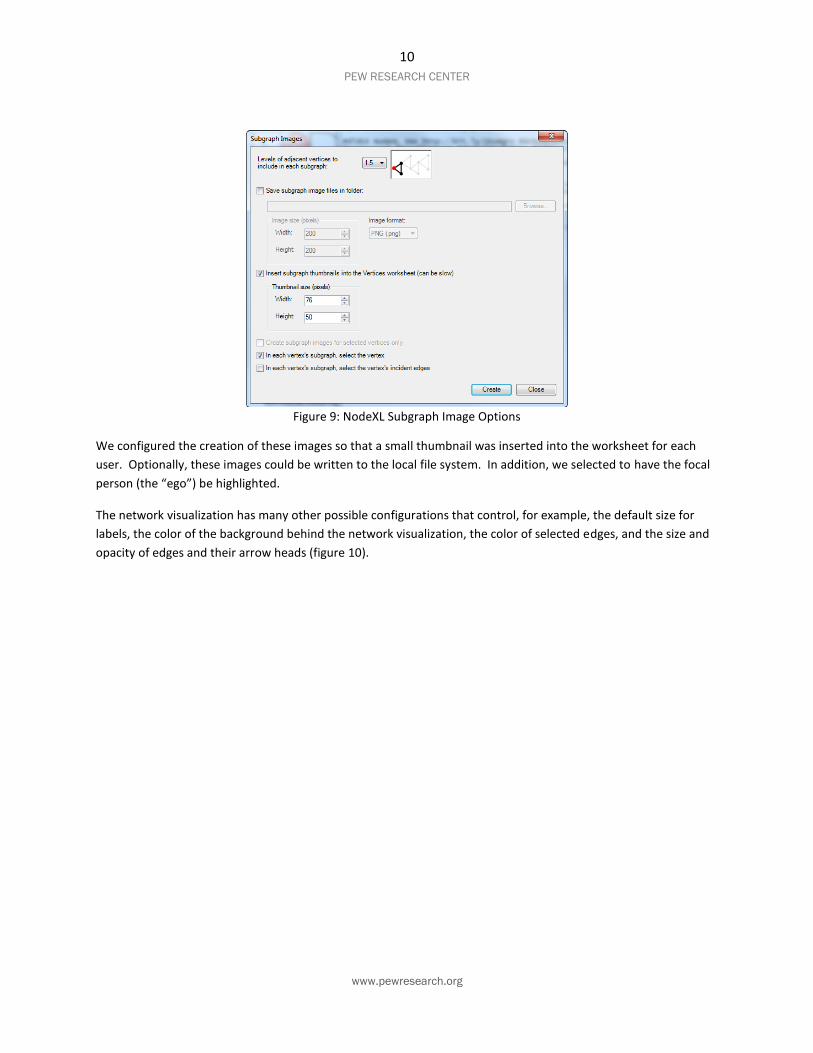
Small thumbnail network images of the local connections around each vertex are created through the Subgraph
Images feature (figure 9). These images are inserted into the Vertices worksheet (see figure 12.). Each image
offers a quick summary of the “local neighborhood” that surrounds each person.
10
PEW RESEARCH CENTER
www.pewresearch.org
Figure 9: NodeXL Subgraph Image Options
We configured the creation of these images so that a small thumbnail was inserted into the worksheet for each
user. Optionally, these images could be written to the local file system. In addition, we selected to have the focal
person (the “ego”) be highlighted.
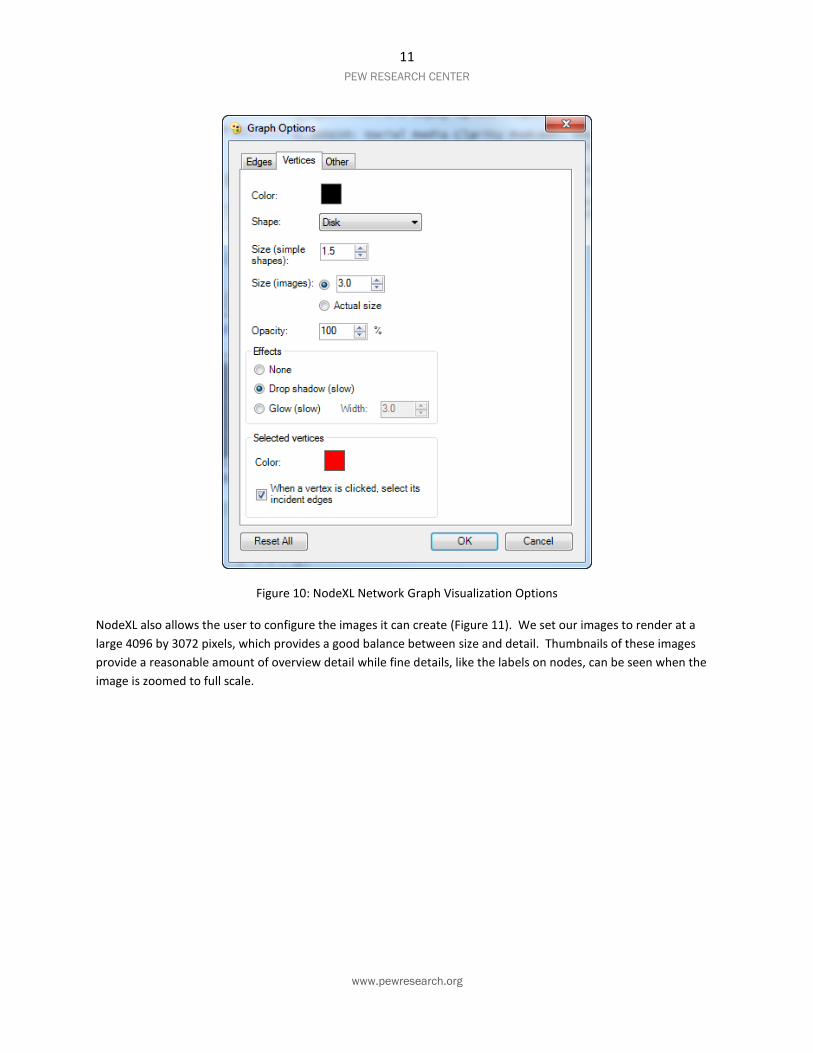
The network visualization has many other possible configurations that control, for example, the default size for
labels, the color of the background behind the network visualization, the color of selected edges, and the size and
opacity of edges and their arrow heads (figure 10).
11
PEW RESEARCH CENTER
www.pewresearch.org
Figure 10: NodeXL Network Graph Visualization Options
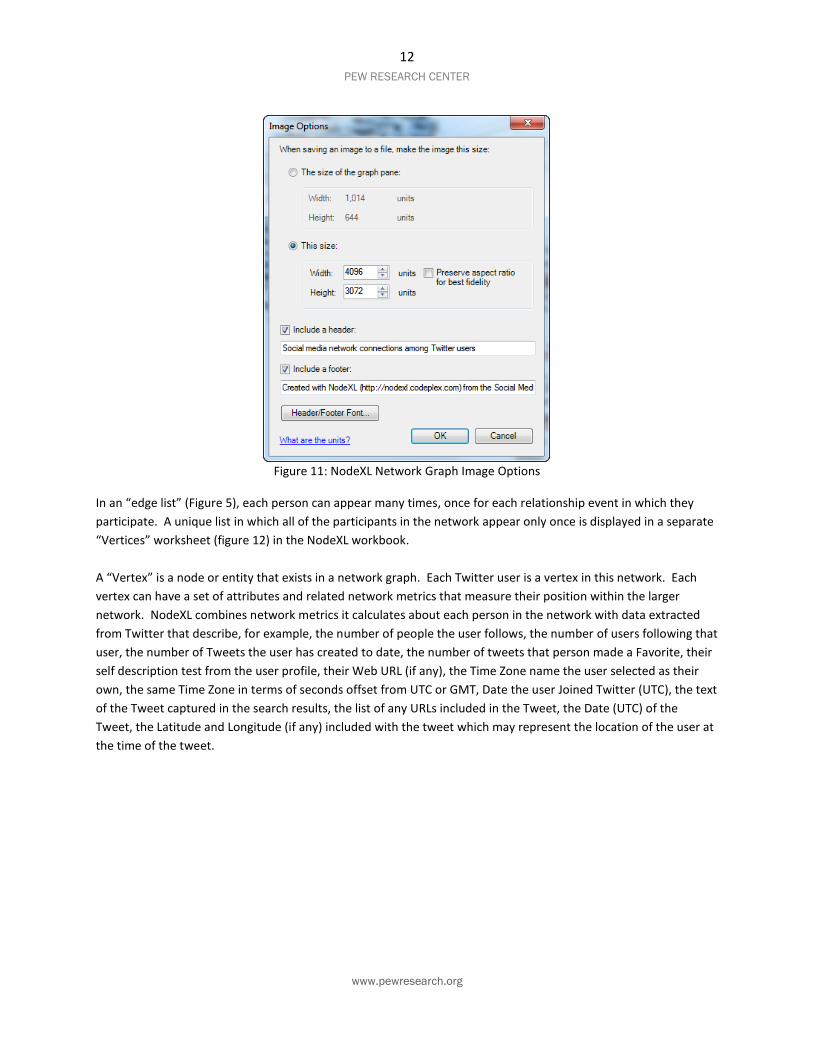
NodeXL also allows the user to configure the images it can create (Figure 11). We set our images to render at a
large 4096 by 3072 pixels, which provides a good balance between size and detail. Thumbnails of these images
provide a reasonable amount of overview detail while fine details, like the labels on nodes, can be seen when the
image is zoomed to full scale.
12
PEW RESEARCH CENTER
www.pewresearch.org
Figure 11: NodeXL Network Graph Image Options
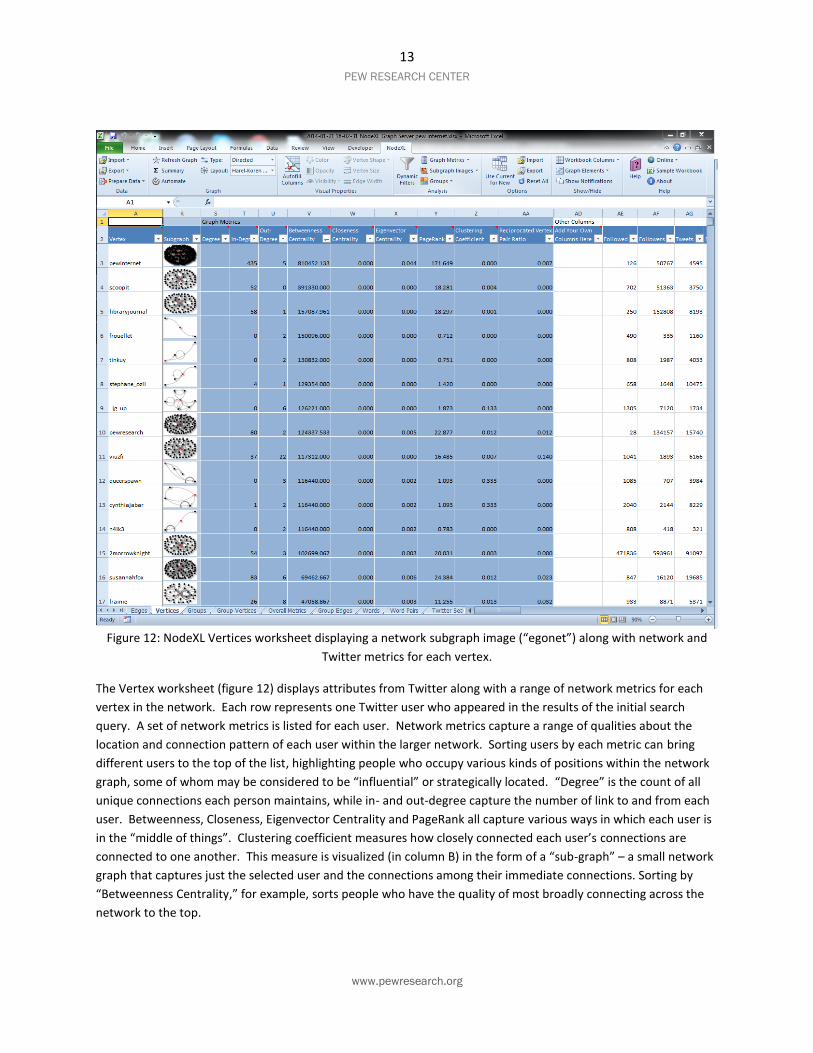
In an “edge list” (Figure 5), each person can appear many times, once for each relationship event in which they
participate. A unique list in which all of the participants in the network appear only once is displayed in a separate
“Vertices” worksheet (figure 12) in the NodeXL workbook.
A “Vertex” is a node or entity that exists in a network graph. Each Twitter user is a vertex in this network. Each
vertex can have a set of attributes and related network metrics that measure their position within the larger
network. NodeXL combines network metrics it calculates about each person in the network with data extracted
from Twitter that describe, for example, the number of people the user follows, the number of users following that
user, the number of Tweets the user has created to date, the number of tweets that person made a Favorite, their
self description test from the user profile, their Web URL (if any), the Time Zone name the user selected as their
own, the same Time Zone in terms of seconds offset from UTC or GMT, Date the user Joined Twitter (UTC), the text
of the Tweet captured in the search results, the list of any URLs included in the Tweet, the Date (UTC) of the
Tweet, the Latitude and Longitude (if any) included with the tweet which may represent the location of the user at
the time of the tweet.
13
PEW RESEARCH CENTER
www.pewresearch.org
Figure 12: NodeXL Vertices worksheet displaying a network subgraph image (“egonet”) along with network and
Twitter metrics for each vertex.
The Vertex worksheet (figure 12) displays attributes from Twitter along with a range of network metrics for each
vertex in the network. Each row represents one Twitter user who appeared in the results of the initial search
query. A set of network metrics is listed for each user. Network metrics capture a range of qualities about the
location and connection pattern of each user within the larger network. Sorting users by each metric can bring
different users to the top of the list, highlighting people who occupy various kinds of positions within the network
graph, some of whom may be considered to be “influential” or strategically located. “Degree” is the count of all
unique connections each person maintains, while in- and out-degree capture the number of link to and from each
user. Betweenness, Closeness, Eigenvector Centrality and PageRank all capture various ways in which each user is
in the “middle of things”. Clustering coefficient measures how closely connected each user’s connections are
connected to one another. This measure is visualized (in column B) in the form of a “sub-graph” – a small network
graph that captures just the selected user and the connections among their immediate connections. Sorting by
“Betweenness Centrality,” for example, sorts people who have the quality of most broadly connecting across the
network to the top.
14
PEW RESEARCH CENTER
www.pewresearch.org
When sorted by betweenness centrality, this worksheet displays a ranked list of the most central and, arguably,
influential, people in this network. These users have strategic locations within the network created by their
pattern of connections (and the connection pattern of others).
Sorting by other metrics can bring to the top of the list other people who have little or no connections to the large
connected set of people at the core of the network. These people are called “isolates” when they have no
connection at all to anyone else seen in the data sample. The presence or absence of many isolates is an indication
of how “public” or “popular” a topic is. Very popular topics are talked about by many people who otherwise have
little or no connection. In contrast, topics and keywords specific to a group often have few or no isolates.
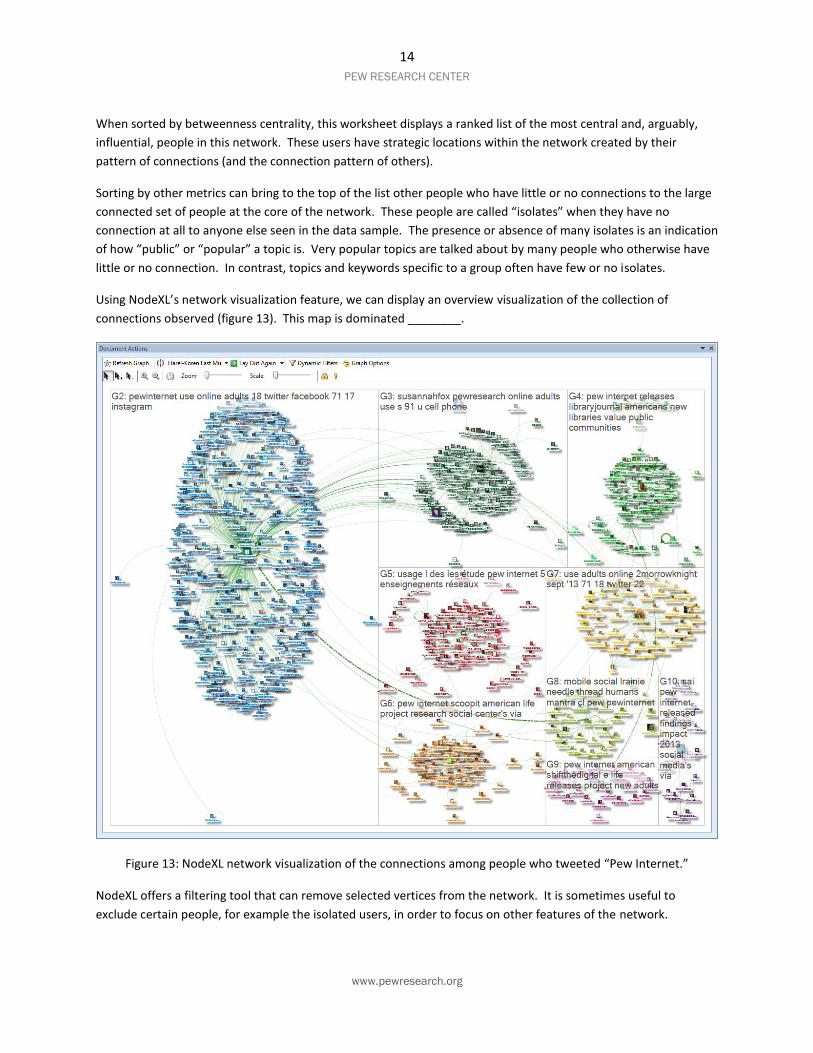
Using NodeXL’s network visualization feature, we can display an overview visualization of the collection of
connections observed (figure 13). This map is dominated ________.
Figure 13: NodeXL network visualization of the connections among people who tweeted “Pew Internet.”
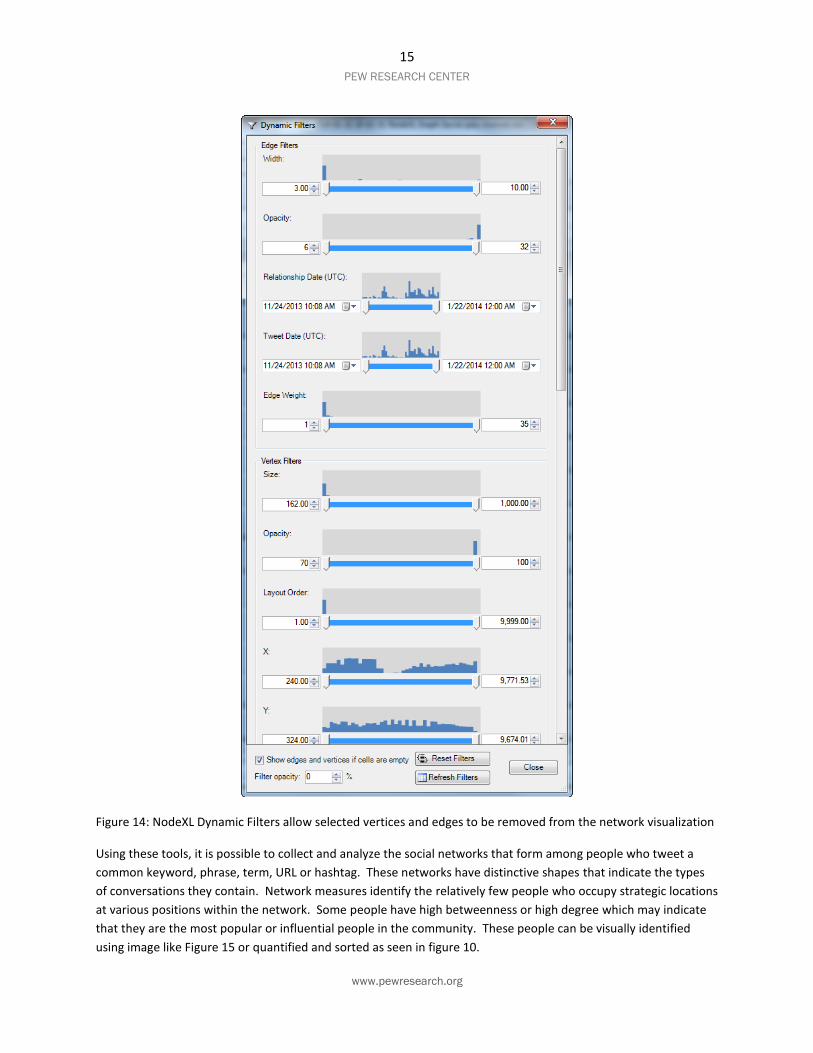
NodeXL offers a filtering tool that can remove selected vertices from the network. It is sometimes useful to
exclude certain people, for example the isolated users, in order to focus on other features of the network.
15
PEW RESEARCH CENTER
www.pewresearch.org
Figure 14: NodeXL Dynamic Filters allow selected vertices and edges to be removed from the network visualization
Using these tools, it is possible to collect and analyze the social networks that form among people who tweet a
common keyword, phrase, term, URL or hashtag. These networks have distinctive shapes that indicate the types
of conversations they contain. Network measures identify the relatively few people who occupy strategic locations
at various positions within the network. Some people have high betweenness or high degree which may indicate
that they are the most popular or influential people in the community. These people can be visually identified
using image like Figure 15 or quantified and sorted as seen in figure 10.
16
PEW RESEARCH CENTER
www.pewresearch.org
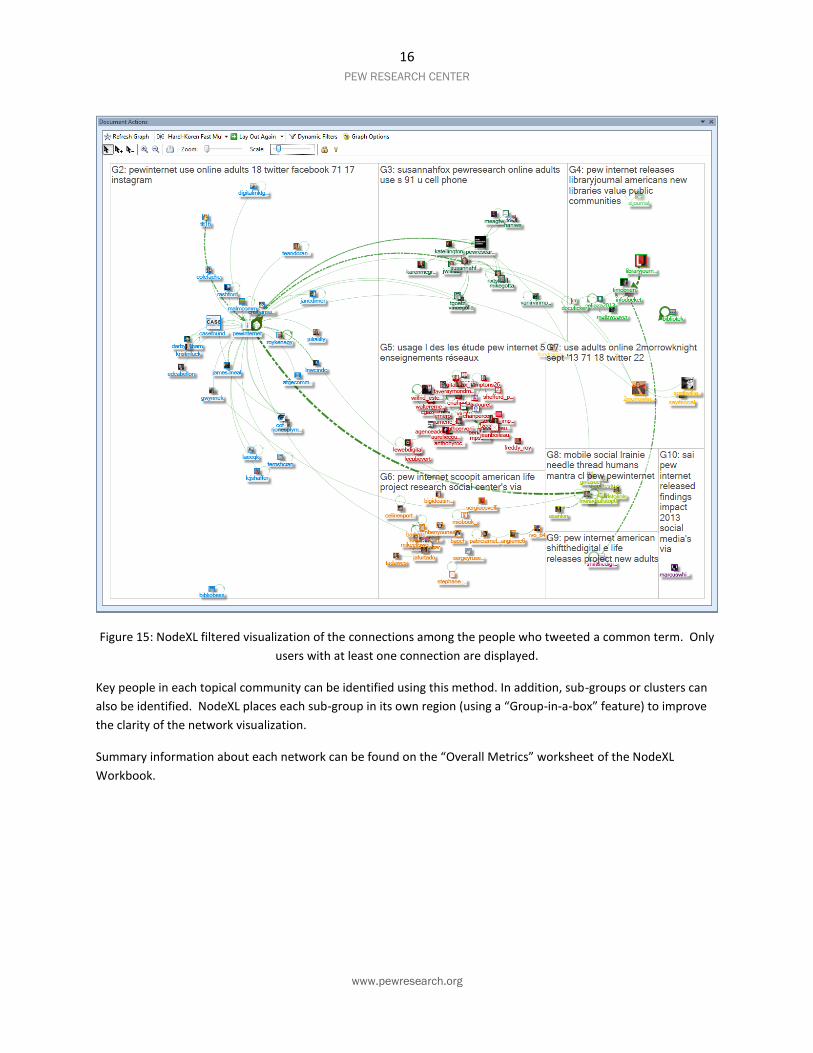
Figure 15: NodeXL filtered visualization of the connections among the people who tweeted a common term. Only
users with at least one connection are displayed.
Key people in each topical community can be identified using this method. In addition, sub-groups or clusters can
also be identified. NodeXL places each sub-group in its own region (using a “Group-in-a-box” feature) to improve
the clarity of the network visualization.
Summary information about each network can be found on the “Overall Metrics” worksheet of the NodeXL
Workbook.

17
PEW RESEARCH CENTER
www.pewresearch.org
Figure 16: NodeXL Overall Metrics worksheet contains information that describes the size and density of the
network
These measures allow users to contrast networks to capture the ways networks in general and social media
networks in particular compare to other networks and to themselves overtime.
https://www.nodexlgraphgallery.org/Pages/Graph.aspx?graphID=15414
18
PEW RESEARCH CENTER
www.pewresearch.org
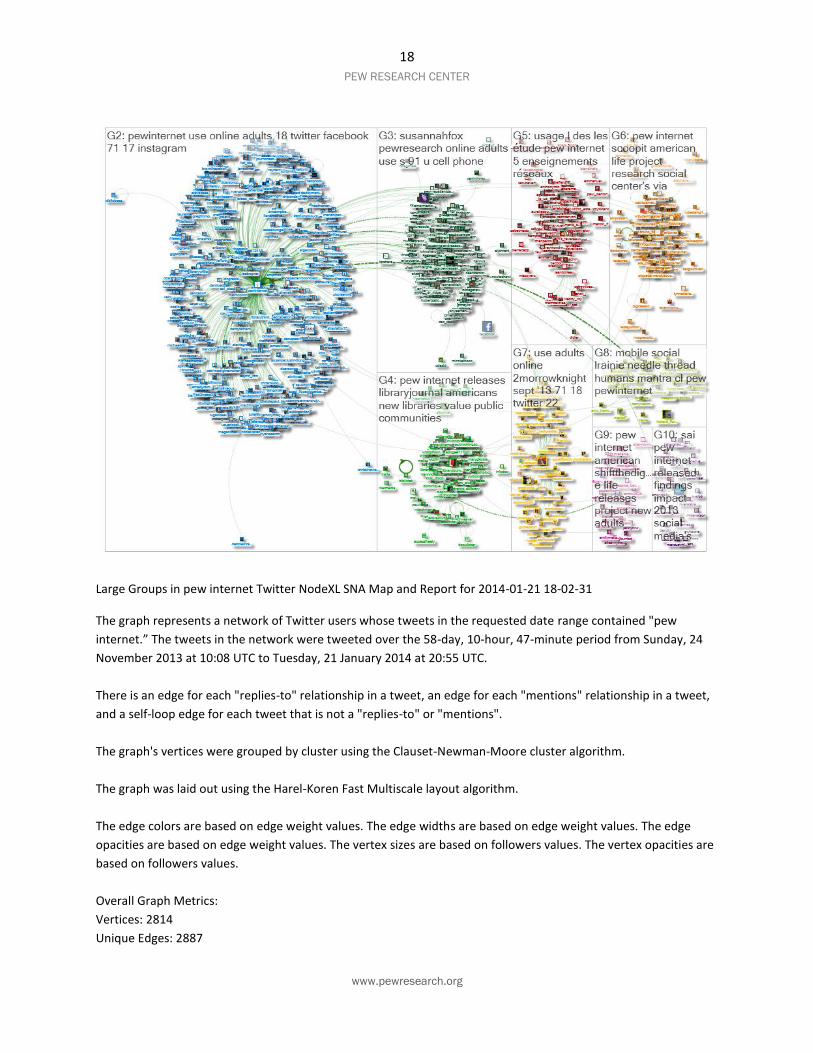
Large Groups in pew internet Twitter NodeXL SNA Map and Report for 2014-01-21 18-02-31
The graph represents a network of Twitter users whose tweets in the requested date range contained "pew
internet.” The tweets in the network were tweeted over the 58-day, 10-hour, 47-minute period from Sunday, 24
November 2013 at 10:08 UTC to Tuesday, 21 January 2014 at 20:55 UTC.
There is an edge for each "replies-to" relationship in a tweet, an edge for each "mentions" relationship in a tweet,
and a self-loop edge for each tweet that is not a "replies-to" or "mentions".
The graph's vertices were grouped by cluster using the Clauset-Newman-Moore cluster algorithm.
The graph was laid out using the Harel-Koren Fast Multiscale layout algorithm.
The edge colors are based on edge weight values. The edge widths are based on edge weight values. The edge
opacities are based on edge weight values. The vertex sizes are based on followers values. The vertex opacities are
based on followers values.
Overall Graph Metrics:
Vertices: 2814
Unique Edges: 2887
19
PEW RESEARCH CENTER
www.pewresearch.org
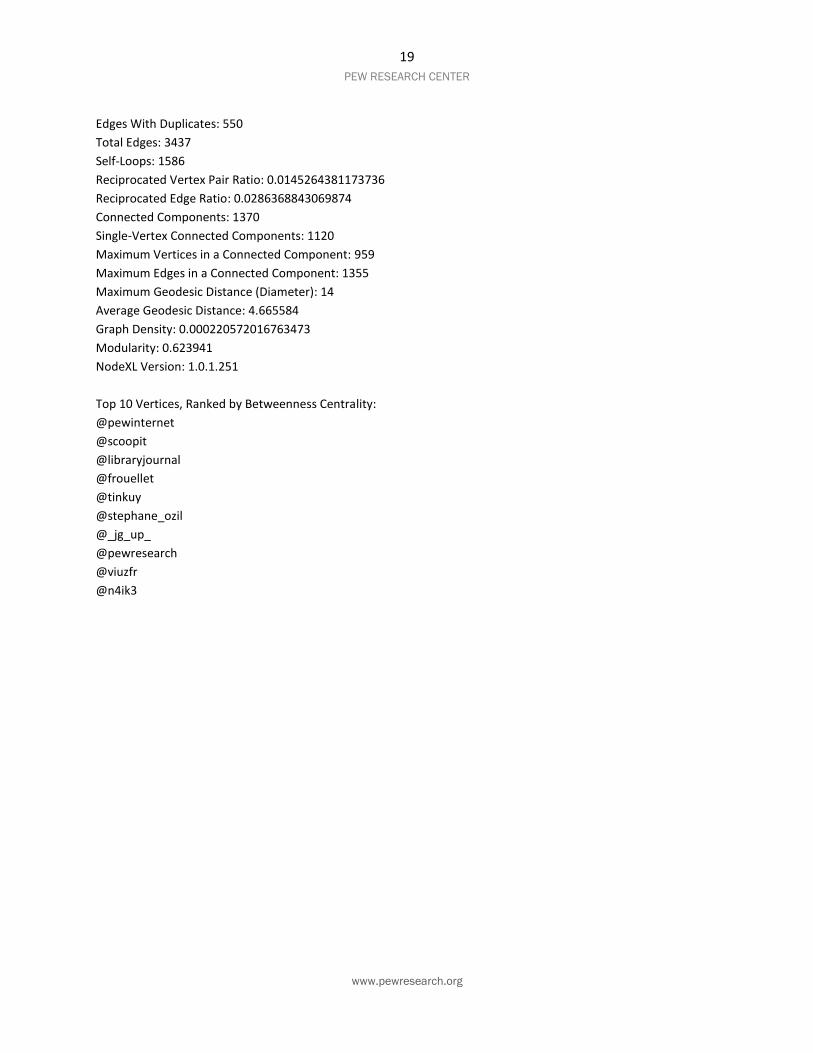
Edges With Duplicates: 550
Total Edges: 3437
Self-Loops: 1586
Reciprocated Vertex Pair Ratio: 0.0145264381173736
Reciprocated Edge Ratio: 0.0286368843069874
Connected Components: 1370
Single-Vertex Connected Components: 1120
Maximum Vertices in a Connected Component: 959
Maximum Edges in a Connected Component: 1355
Maximum Geodesic Distance (Diameter): 14
Average Geodesic Distance: 4.665584
Graph Density: 0.000220572016763473
Modularity: 0.623941
NodeXL Version: 1.0.1.251
Top 10 Vertices, Ranked by Betweenness Centrality:
@pewinternet
@scoopit
@libraryjournal
@frouellet
@tinkuy
@stephane_ozil
@_jg_up_
@pewresearch
@viuzfr
@n4ik3

20
PEW RESEARCH CENTER
www.pewresearch.org
21
PEW RESEARCH CENTER
www.pewresearch.org
Social Media Network Research Related Publications
Hansen, D., Smith, M., Shneiderman, B., EventGraphs: charting collections of conference connections. Hawaii
International Conference on System Sciences. Forty-Forth Annual Hawaii International Conference on System
Sciences (HICSS). January 4-7, 2011. Kauai, Hawaii.
http://www.cs.umd.edu/localphp/hcil/tech-reports-search.php?number=2010-13
EventGraphs are social media network diagrams constructed from content selected by its association with time-
bounded events, such as conferences. Many conferences now communicate a common "hashtag" or keyword to
identify messages related to the event. EventGraphs help make sense of the collections of connections that form
when people follow, reply or mention one another and a keyword. This paper defines EventGraphs, characterizes
different types, and shows how the social media network analysis add-in NodeXL supports their creation and
analysis. The paper also identifies the structural and conversational patterns to look for and highlight in
EventGraphs and provides design ideas for their improvement.
In the Journal of Social Structure: “Visualizing the Signatures of Social Roles in Online Discussion Groups” is
available from: http://www.cmu.edu/joss/content/articles/volume8/Welser/ It illustrates different patterns of
network structures associated with different kinds of roles and behaviors.
Social roles in online discussion forums can be described by patterned characteristics of communication between
network members which we conceive of as ‘structural signatures.' This paper uses visualization methods to reveal
these structural signatures and regression analysis to confirm the relationship between these signatures and their
associated roles in Usenet newsgroups. Our analysis focuses on distinguishing the signatures of one role from
others, the role of “answer people." Answer people are individuals whose dominant behavior is to respond to
questions posed by other users. We found that answer people predominantly contribute one or a few messages to
discussions initiated by others, are disproportionately tied to relative isolates, have few intense ties and have few
triangles in their local networks. OLS regression shows that these signatures are strongly correlated with role
behavior and, in combination, provide a strongly predictive model for identifying role behavior (R2=.72). To
conclude, we consider strategies for further improving the identification of role behavior in online discussion
settings and consider how the development of a taxonomy of author types could be extended to a taxonomy of
newsgroups in particular and discussion systems in general.
“Discussion catalysts in online political discussions: Content importers and conversation starters“ in the Journal of
Computer-Mediated Communication (JCMC) http://jcmc.indiana.edu/ at http://ping.fm/7NF5T
This study addresses 3 research questions in the context of online political discussions: What is the distribution of
successful topic starting practices, what characterizes the content of large thread-starting messages, and what is
22
PEW RESEARCH CENTER
www.pewresearch.org
the source of that content? A 6-month analysis of almost 40,000 authors in 20 political Usenet newsgroups
identified authors who received a disproportionate number of replies. We labeled these authors ‘‘discussion
catalysts.’’ Content analysis revealed that 95 percent of discussion catalysts’ messages contained content imported
from elsewhere on the web, about 2/3 from traditional news organizations. We conclude that the flow of
information from the content creators to the readers and writers continues to be mediated by a few individuals
who act as filters and amplifiers.
Analyzing (Social Media) Networks with NodeXL
Smith, M., Shneiderman, B., Milic-Frayling, N., Rodrigues, E.M., Barash, V., Dunne, C., Capone, T., Perer, A. &
Gleave, E. (2009),"Analyzing (Social Media) Networks with NodeXL", In C&T '09: Proceedings of the Fourth
International Conference on Communities and Technologies. Springer.
Abstract: In this paper we present NodeXL, an extendible toolkit for network data analysis and visualization,
implemented as an add-in to the Microsoft Excel 2007 spreadsheet software. We demonstrate NodeXL features
through analysis of a data sample drawn from an enterprise intranet social network, discussion, and wiki. Through
a sequence of steps we show how NodeXL leverages and extends the broadly used spreadsheet paradigm to
support common operations in network analysis. This ranges from data import to computation of network
statistics and refinement of network visualization through a selection of ready-to-use sorting, filtering, and
clustering functions.
Whither the Experts
Howard Welser, Eric Gleave, Marc Smith, Vladimir Barash, Jessica Meckes. “Whither the Experts? Social
affordances and the cultivation of experts in community Q&A systems”, in SIN '09: Proc. international symposium
on Social Intelligence and Networking. IEEE Computer Society Press.
Abstract: Community based Question and Answer systems have been promoted as web 2.0 solutions to the
problem of finding expert knowledge. This promise depends on systems’ capacity to attract and sustain experts
capable of offering high quality, factual answers. Content analysis of dedicated contributors’ messages in the Live
QnA system found: (1) few contributors who focused on providing technical answers (2) a preponderance of
attention paid to opinion and discussion, especially in non-technical threads. This paucity of experts raises an
important general question: how do the social affordances of a site alter the ecology of roles found there? Using
insights from recent research in online community, we generate a series of expectations about how social
affordances are likely to alter the role ecology of online systems.
First Steps to Netviz Nirvana
Bonsignore, E.M., Dunne, C., Rotman, D., Smith, M., Capone, T., Hansen, D.L. & Shneiderman, B. (2009), "First steps
to NetViz Nirvana: evaluating social network analysis with NodeXL", In SIN '09: Proc. international symposium on
Social Intelligence and Networking. IEEE Computer Society Press.
23
PEW RESEARCH CENTER
www.pewresearch.org
Abstract: Social Network Analysis (SNA) has evolved as a popular, standard method for modeling meaningful, often
hidden structural relationships in communities. Existing SNA tools often involve extensive pre-processing or
intensive programming skills that can challenge practitioners and students alike. NodeXL, an open-source template
for Microsoft Excel, integrates a library of common network metrics and graph layout algorithms within the
familiar spreadsheet format, offering a potentially low-barrier to-entry framework for teaching and learning SNA.
We present the preliminary findings of 2 user studies of 21 graduate students who engaged in SNA using NodeXL.
The majority of students, while information professionals, had little technical background or experience with SNA
techniques. Six of the participants had more technical backgrounds and were chosen specifically for their
experience with graph drawing and information visualization. Our primary objectives were (1) to evaluate NodeXL
as an SNA tool for a broad base of users and (2) to explore methods for teaching SNA. Our complementary dual
case-study format demonstrates the usability of NodeXL for a diverse set of users, and significantly, the power of a
tightly integrated metrics/visualization tool to spark insight and facilitate sensemaking for students of SNA.
Do You Know the Way to SNA?
Hansen, D., Rotman, D., Bonsignore, E., Milic-Frayling, N., Rodrigues, E., Smith, M., Shneiderman, B. (July 2009)
Do You Know the Way to SNA?: A Process Model for Analyzing and Visualizing Social Media Data
University of Maryland Tech Report: HCIL-2009-17
Abstract: Voluminous online activity data from users of social media can shed light on individual behavior, social
relationships, and community efficacy. However, tools and processes to analyze this data are just beginning to
evolve. We studied 15 graduate students who were taught to use NodeXL to analyze social media data sets. Based
on these observations, we present a process model of social network analysis (SNA) and visualization, then use it
to identify stages where intervention from peers, experts, and computational aids are most useful. We offer
implications for designers of SNA tools, educators, and community & organizational analysts.