Embed Size (px)
Citation preview

AQUATIC CONSERVATION: MARINE AND FRESHWATER ECOSYSTEMS
Aquatic Conserv: Mar. Freshw. Ecosyst. 18: 55–85 (2008)
Published online 2 April 2007 in Wiley InterScience(www.interscience.wiley.com) DOI: 10.1002/aqc.816
How wild is the ocean? Assessing the intensity ofanthropogenic marine activities in British Columbia, Canada
NATALIE BANa,* and JACKIE ALDERb
aUniversity of British Columbia, UBC Fisheries Centre/Project Seahorse, Vancouver, British Columbia, CanadabUniversity of British Columbia, UBC Fisheries Centre/Sea Around Us Project, Vancouver, British Columbia, Canada
ABSTRACT
1. The intensity of marine activities in the exclusive economic zone (EEZ) of British Columbia,Canada, was quantified.2. Humans use the ocean for a multitude of purposes, many of which have a direct impact on
marine life and habitat. Yet such uses are seldom assessed in an integrated fashion.3. Using a GIS approach, spatial information for 39 marine activities was mapped, including
commercial and recreational fishing areas, transportation and infrastructure uses, and terrestrialactivities along the coast of British Columbia.4. A relative scale was used to rank both the impact of marine activities and the extent of stressors
beyond the location of occurrence. Limited information on the latter led to the application of threeranges of buffer distances to the data (0–1 km, 0–5 km, and 0–25 km).5. The most conservative estimate (41 km buffers) indicates at least 83% of the continental shelf
and slope of British Columbia is currently being used by humans. The largest buffer assumptionshows 98% of the continental shelf and slope being affected by stressors from anthropogenicactivities.6. This analysis provides a baseline for assessing future changes in the state of British Columbia’s
marine environment, and could assist in identifying areas of conservation potential.Copyright # 2007 John Wiley & Sons, Ltd.
Received 14 March 2006; Accepted 20 September 2006
KEY WORDS: human impact; fisheries; stressors; marine protected areas; British Columbia; conservation
planning; marine conservation; coastal zone management
INTRODUCTION
Most human activities in the ocean have a direct and/or indirect impact on marine life and habitat(McIntyre, 1995; Jackson et al., 2001). The oceans are fished for economic benefit, subsistence and
*Correspondence to: Natalie Ban, University of British Columbia, UBC Fisheries Centre/Project Seahorse, 2202 Main Mall,2nd Floor, Vancouver, BC V6T 1Z4, Canada. E-mail: [email protected]
Copyright # 2007 John Wiley & Sons, Ltd.

recreation (Botsford et al., 1997; Costanza, 1999; Cooke and Cowx, 2006). Oceans serve as a majortransportation network, coastal areas continue to have among the highest population densities, and peopleenjoy the ocean for pleasure and relaxation. All these pressures on the oceans are having an impact (Vincentand Hall, 1996; Roberts and Hawkins, 1999; Verity et al., 2002; Solan et al., 2004; Kappel, 2005). We areincreasingly fishing down trophic levels (Pauly et al., 1998, 2002, 2005; Watson et al., 2004), predatoryfishes have declined significantly (Myers and Worm, 2003, 2005; Devine et al., 2006) and pollution isprevalent (McIntyre, 1995; Siboni et al., 2004).
The effect humans are having on the ocean has been well documented. For example, more than 70% offisheries are fully exploited or overexploited (FAO, 2004). Overfishing has occurred worldwide for manycenturies (Jackson et al., 2001), resulting in cascading effects on the pelagic food web (Scheffer et al., 2005)and other structural and functional changes (Hutchings, 2000; Jackson et al., 2001; Myers and Worm, 2003;Solan et al., 2004; Bascompte et al., 2005; Scheffer et al., 2005). Certain fishing techniques, such as bottomtrawling, are known to damage benthic structures (Thrush et al., 1998; Watling and Norse, 1998; Collieet al., 2000; Thrush and Dayton, 2002; Ardron, 2005; Kaiser et al., 2005). Recreational fishing may havesimilar effects as commercial fishing (Coleman et al., 2004; Cooke and Cowx, 2006). Finfish aquaculture hascontributed to habitat destruction, the introduction of species and diseases, and further depletion of wildfish stocks (Auditor General of Canada, 2000; Milewski, 2000; Naylor et al., 2000, 2001, 2003; Krkoseket al., 2005), while shellfish aquaculture can enhance algal growth rates, reduce food supply for otherherbivores, and bias community composition towards fast-growing species (Jamieson et al., 2001;Broekhuizen et al., 2002; Gibbs, 2004). Shipping, cruise ships and recreational boating affect marine faunathrough noise (Richardson and Malme, 1995; United States General Accounting Office, 2000; Moore andClarke, 2002; Foote et al., 2004; Commoy et al., 2005), pollution and the introduction of non-native speciesin ballast water (United States Environmental Protection Agency, 2002; Hampton et al., 2003), and altershorelines and habitats through erosion and the water column through sedimentation (Stevens andEkermo, 2003). Infrastructure, such as ferry docks, marinas, anchorages, boat launches, docks, piers andmoorings, contributes to pollution (Wendt et al., 1996; Turner et al., 1997; Backhurst and Cole, 2000b;Nightingale and Simenstad, 2001; Stevens and Ekermo, 2003), noise (Nightingale and Simenstad, 2001;Foote et al., 2004), habitat damage (Backhurst and Cole, 2000a; Milazzo et al., 2004; Stamski, 2005), andreduces light levels (Macfarlane et al., 2000; Sanger and Holland, 2002). Land-based activities alsoimpact nearby coastal and marine areas. For example, the biggest source of marine oil pollution isurban and industrial runoff (Government of British Columbia, 2006), and fauna in marine environmentsclose to urban centres have elevated heavy metals in their tissues (Bolton et al., 2004). Mines as far awayas 40 km from the coast result in elevated levels of heavy metals in the coastal environment (Hines et al.,2000), and acid mine drainage is toxic to marine flora and fauna (Grout and Levings, 2001; Levingset al., 2004).
The impacts caused by human activities can be divided into three categories: physical, chemical andbiological change. Physical change comprises direct alterations to habitats, and includes damage fromfishing gear, dredging, etc. (Watling and Norse, 1998; Nightingale and Simenstad, 2001). Noise fromshipping and boating is also considered a physical change. Increased noise has been shown to causemarine mammals to change their feeding, diving and swimming habits (Croll et al., 2001; Foote et al.,2004). Chemical change includes the effects of pollution, such as introduction of nutrients and toxicmaterials (United States General Accounting Office, 2000; Costanzo et al., 2001; Je et al., 2004). Biologicalchange is effected through fishing, potentially resulting in trophic cascades (Pauly et al., 1998; Jacksonet al., 2001), and also includes the introduction of disease and exotic species (Naylor et al., 2001, 2003;Gibbs, 2004).
A first step in managing marine resources effectively is to understand the influence humans are having onthe ocean, which activities are having an impact, where those activities are taking place, and how far thestressors from those activities extend. Yet very few comprehensive analyses of the extent and spatial
N. BAN AND J. ALDER56
Copyright # 2007 John Wiley & Sons, Ltd. Aquatic Conserv: Mar. Freshw. Ecosyst. 18: 55–85 (2008)
DOI: 10.1002/aqc

patterns of human activities in the ocean exist (but see Lumb et al., 2004). Previous studies have focused onidentifying the impacts of activities such as fishing (Collie et al., 2000; Jackson et al., 2001; Cooke andCowx, 2006), mining (Levings et al., 2004), shipping (Stevens and Ekermo, 2003; Hong et al., 2005), andaquaculture (Milewski, 2000; Krkosek et al., 2005), but have rarely examined the collective contribution ofmultiple activities (but see Lumb et al., 2004).
Human impact is commonly mapped on land (Hannah et al., 1994; Sanderson et al., 2002; Foley et al.,2005), in ways that may be instructive in marine environments. On land, roads are routinely used as a proxyfor human impact } areas distant from roads are considered intact } and advances in remote sensing andGIS facilitate such analyses (e.g. Nelson and Hellerstein, 1997; Lee et al., 2003; Government of BritishColumbia, 2006). However, in marine environments it is more difficult to identify areas affected by humansbecause of the ephemeral and episodic nature of many activities. Also, while many of the human impacts onland are clearly visible from space (e.g. logging, industrial development, urban centres), marine habitatimpacts occur below the water, and are therefore not detectable using current remote sensing technology.
This paper explores the impact of human activities in the ocean, using the exclusive economic zone (EEZ)of British Columbia (BC) as a case study. The human use of the marine environment is mapped in order toidentify patterns and intensity of use, providing an approximation of possible damage to marine life andhabitats.
METHODS
A geographic information systems (GIS) approach was used for data analysis (ESRI, 2004, ArcGIS Version9.0). The Albers Equal Area projection (NAD83) was used throughout the analysis, because it holdsconstant the areas on the maps.
Spatial data for marine activities from 1992 to 2005 were collated, for a total of 39 data layers of humanuses affecting the ocean. Data layers include commercial and recreational fishing areas, transportation andinfrastructure uses, aquaculture, and land-based activities in the coastal area (see Table 1 for a complete listof datasets used). Data were obtained from federal and provincial government agencies; much of theinfrastructure data were provided by the Province of British Columbia through the Terrain ResourceInformation Management (TRIM) data. Only very few spatial data were available for the period prior to1992, and thus historical uses were not considered in this analysis. Spatial data were not available for allhuman uses (see Table 2 for missing or unavailable data).
Given that marine activities do not affect the marine environment equally, a measure of the impact ofmarine activities at the location of occurrence was incorporated. Ranking impacts can be contentious, asconflicting evidence can lead to differing interpretations of relative impact. Therefore an existingclassification method was sought, and one which ranks 27 out of the 39 uses mapped in this study wasapplied (Jamieson and Levings, 2001). This scheme uses a qualitative ranking of the direct and indirectimpact of human activities for British Columbia (high impact ¼ 10; least impact ¼ 0), developed throughfocus groups of regional experts representing habitat managers and field biologists (Jamieson and Levings,2001). Only the ‘severity and duration of impact’ values were applied; the ‘extent of impact’ categoryincluded in Jamieson and Levings (2001) was superfluous as the geographic extent of activities wereincluded in this analysis through spatial data. The median value of 0.3 for weighting indirect impacts wasused, for a maximum possible impact value was 13. The impact value was calculated using the formula:
impact ¼ directþ ð0:3*indirectÞ
Table 1 contains an explanation of all the impact values used.For most marine activities, little was known about the geographic extent of the impact beyond the
location of the activity. A table was compiled referencing the measured impacts of activities (Table 3).
ASSESSING INTENSITY OF ANTHROPOGENIC ACTIVITIES 57
Copyright # 2007 John Wiley & Sons, Ltd. Aquatic Conserv: Mar. Freshw. Ecosyst. 18: 55–85 (2008)
DOI: 10.1002/aqc

Table1.Data
used,relativestressors
beyondthelocationofoccurrence,im
pact
factorandcalculation,andcategories
ofim
pact
Typeofdata
Sourceofdata
Stressor
beyond
locationof
occurrence
Severityanddurationof
impact
(0¼
least;
10¼
greatest)a
Impact¼
direct
þð0:3
bindirect)
How
theim
pact
valuewasderived
from
Jamiesonand
Levings(2001)
Category
of
impact
References
Direct
Indirect
Physical
change
Chem
ical
change
Biological
change
Baselineand
protected
areas
BC
coastline
Province
ofBC
N/A
Marine
ecoregions
Province
ofBC
N/A
Provincial
protected
area
designations
Province
ofBC
(ftp://ftp.gis.luco.
gov.bc.ca/pub/)
N/A
NationalParks
ParksCanada
N/A
Rockfish
conservation
areas
Fisheriesand
OceansCanada
(http://w
ww-
heb.pac.dfo-m
po.
gc.ca/m
aps/
them
esdata
e.htm
)
N/A
Marine
Protected
Areas
Fisheriesand
OceansCanada
(http://w
ww.pac.
dfo-m
po.gc.ca/
oceans/mpa/
Info
e.htm
)
N/A
Aquaculture
Finfish
aquaculture
Province
ofBC
(ftp://ftp.gis.luco.
gov.bc.ca/pub/
coastal/)
High
96
10.8
Severityand
duration
ofim
pact
habitatrating
||
|Auditor
Generalof
Canada,2000;
Milew
ski,
2000;
Nayloret
al.,2000;
Jamiesonand
Levings,2001;
Nayloret
al.,
2001;Naylor
etal.,2003;
Krkoseket
al.,2005
Shellfish
aquaculture
Province
ofBC
(ftp://ftp.gis.
luco.gov.bc.ca/
pub/coastal/)
Low
12
1.6
Severityand
duration
ofim
pact
habitatrating
||
Jamiesonet
al.,
2001;Jamieson
andLevings,
2001;
Broekhuizen
etal.,2002;
Gibbs,2004
N. BAN AND J. ALDER58
Copyright # 2007 John Wiley & Sons, Ltd. Aquatic Conserv: Mar. Freshw. Ecosyst. 18: 55–85 (2008)
DOI: 10.1002/aqc

Commercial
fisheries
Pauly
etal.,
1998;Thrush
etal.,1998;
Jacksonet
al.,
2001;Jamieson
andLevings,
2001
Bottom
trawling
Fisheriesand
OceansCanada
(DFO)1996to
2005groundfish
trawldata
(no.of
sets;nodata
ifless
than3distinct
vesselsfished
ina
grid)in
10km
by10km
grid
(None)
8(destructionof
substrate
structure
orstructural,
epibenthic
species)
4(sedim
ent
plume;
loss
ofhabitat
forother
species,bycatch)
9.2
Jamiesonand
Levings(2001),
averageof‘severity
andduration
ofim
pact
habitat’
and‘species’
ratings
||
Watlingand
Norse,
1998;
Collie
etal.,
2000;Thrush
and
Dayton,2002;
Ardron,2005;
Kaiser
etal.,
2005
Commercial
urchin
Province
ofBC
(ftp://ftp.gis.
luco.gov.bc.ca/
pub/coastal/)
(None)
4(somedestruction
ofstructural,
epibenthic
species)
3(loss
ofhabitat
forother
species,
bycatch)
4.9
Averageof
‘severityand
durationofim
pact
habitat’and‘species’
ratings
||
Commercial
shrimp
Province
ofBC
(ftp://ftp.gis.
luco.gov.bc.
ca/pub/
coastal/)
(None)
4(somedestruction
ofstructural,
epibenthic
species)
3(loss
ofhabitat
forother
species,
bycatch)
4.9
Averageof
‘severity
andduration
ofim
pact
habitat’and
‘species’ratings
||
Commercial
seacucumber
Province
ofBC
(ftp://ftp.gis.luco.
gov.bc.ca/pub/
coastal/)
(None)
4(somedestruction
ofstructural,
epibenthic
species)
3(loss
ofhabitat
forother
species,
bycatch)
4.9
Averageof
‘severityand
durationof
impact
habitat’and
‘species’
ratings
||
Commercial
scallop
Province
ofBC
(ftp://ftp.gis.luco.
gov.bc.ca/pub/
coastal/)
(None)
4(somedestruction
ofstructural,
epibenthic
species)
3(loss
ofhabitat
forother
species,
bycatch)
4.9
Averageof
‘severityand
durationofim
pact
habitat’and
‘species’ratings
||
Commercial
salm
ontroll
Province
ofBC
(ftp://ftp.gis.luco.
gov.bc.ca/pub/
coastal/)
(None)
4(somedestruction
ofstructural,
epibenthic
species)
3(loss
ofhabitat
forother
species,
bycatch)
4.9
Averageof
‘severityand
durationofim
pact
habitat’and
‘species’ratings
||
Commercial
salm
onnet
Province
ofBC
(ftp://ftp.gis.luco.
gov.bc.ca/pub/
coastal/)
(None)
4(somedestruction
ofstructural,
epibenthic
species)
3(loss
ofhabitat
forother
species,
bycatch)
4.9
Averageof
‘severityand
durationofim
pact
habitat’and
‘species’ratings
||
continued
over
ASSESSING INTENSITY OF ANTHROPOGENIC ACTIVITIES 59
Copyright # 2007 John Wiley & Sons, Ltd. Aquatic Conserv: Mar. Freshw. Ecosyst. 18: 55–85 (2008)
DOI: 10.1002/aqc

Commercial
groundfish
(other
than
bottom
trawling)
Province
ofBC
(ftp://ftp.gis.
luco.gov.bc.ca/
pub/coastal/)
(None)
4(somedestruction
ofstructural,
epibenthic
species)
3(loss
ofhabitat
forother
species,
bycatch)
4.9
Averageof
‘severityand
durationofim
pact
habitat’and‘species’
ratings
||
Commercial
squid
Province
ofBC
(ftp://ftp.gis.
luco.gov.bc.ca/
pub/coastal/)
(None)
4(somedestruction
ofstructural,
epibenthic
species)
3(loss
ofhabitat
forother
species,
bycatch)
4.9
Averageof
‘severityand
durationofim
pact
habitat’and
‘species’ratings
||
Commercial
prawn
Province
ofBC
(ftp://ftp.gis.
luco.gov.bc.
ca/pub/coastal/)
(None)
4(somedestruction
ofstructural,
epibenthic
species)
3(loss
ofhabitat
forother
species,
bycatch)
4.9
Averageof
‘severityand
durationofim
pact
habitat’and‘species’
ratings
||
Commercial
octopus
Province
ofBC
(ftp://ftp.gis.luco.
gov.bc.ca/pub/
coastal/)
(None)
4(somedestruction
ofstructural,
epibenthic
species)
3(loss
ofhabitat
forother
species,
bycatch)
4.9
Averageof
‘severityand
durationofim
pact
habitat’and‘species’
ratings
||
Commercial
herring
Province
ofBC
(ftp://ftp.gis.
luco.gov.bc.
ca/pub/coastal/)
(None)
4(somedestruction
ofstructural,
epibenthic
species)
3(loss
ofhabitat
forother
species,
bycatch)
4.9
Averageof
‘severityand
durationofim
pact
habitat’and‘species’
ratings
||
Commercial
herringroe
Province
ofBC
(ftp://ftp.gis.
luco.gov.bc.ca/
pub/coastal/)
(None)
4(somedestruction
ofstructural,
epibenthic
species)
3(loss
ofhabitat
forother
species,
bycatch)
4.9
Averageof
‘severityand
durationofim
pact
habitat’and‘species’
ratings
||
Commercial
gooseneck
barnacle
Province
ofBC
(ftp://ftp.gis.
luco.gov.bc.ca/
pub/coastal/)
(None)
4(somedestruction
ofstructural,
epibenthic
species)
3(loss
ofhabitat
forother
species,
bycatch)
4.9
Averageof
‘severityand
durationof
impact
habitat’
and‘species’
ratings
||
Commercial
crab
Province
ofBC
(ftp://ftp.gis.luco.
gov.bc.ca/pub/
coastal/)
(None)
4(somedestruction
ofstructural,
epibenthic
species)
3(loss
ofhabitat
forother
species,
bycatch)
4.9
Averageof
‘severityand
durationof
impact
habitat’
and‘species’
ratings
||
Table1.continued
Typeofdata
Sourceofdata
Stressor
beyond
locationof
occurrence
Severityanddurationof
impact
(0¼
least;
10¼
greatest)a
Impact¼
direct
þð0:3bindirect)
How
theim
pact
valuewasderived
from
Jamiesonand
Levings(2001)
Category
of
impact
References
Direct
Indirect
Physical
change
Chem
ical
change
Biological
change
N. BAN AND J. ALDER60
Copyright # 2007 John Wiley & Sons, Ltd. Aquatic Conserv: Mar. Freshw. Ecosyst. 18: 55–85 (2008)
DOI: 10.1002/aqc

Commercial
geoduck
Province
ofBC
(ftp://ftp.gis.luco.
gov.bc.ca/pub/
coastal/)
(None)
4(somedestruction
ofstructural,
epibenthic
species)
3(loss
ofhabitat
forother
species,
bycatch)
4.9
Averageof
‘severityand
durationof
impact
habitat’
and‘species’
ratings
||
Recreational
fisheriesb
Coleman
etal.,2004;
Cookeand
Cowx,2006
Recreational
squid
Province
ofBC
(ftp://ftp.gis.luco.
gov.bc.ca/pub/
coastal/)
(None)
32(bycatch)
3.6
Lessthan
commercialfishing
because
presumably
alower
volumeis
extracted
||
Recreational
scallop
Province
ofBC
(ftp://ftp.gis.luco.
gov.bc.ca/pub/
coastal/)
(None)
32(bycatch)
3.6
Lessthan
commercial
fishingbecause
presumably
a
lower
volume
isextracted
||
Recreational
prawn
Province
ofBC
(ftp://ftp.gis.luco.
gov.bc.ca/pub/
coastal/)
(None)
32(bycatch)
3.6
Lessthan
commercialfishing
because
presumably
alower
volume
isextracted
||
Recreational
groundfish
Province
ofBC
(ftp://ftp.gis.luco.
gov.bc.ca/pub/
coastal/)
(None)
32(bycatch)
3.6
Lessthan
commercialfishing
because
presumably
alower
volumeis
extracted
||
Recreational
crabfishing
areas
Province
ofBC
(ftp://ftp.gis.
luco.gov.bc.
ca/pub/coastal/)
(None)
32(bycatch)
3.6
Lessthan
commercial
fishingbecause
presumably
a
lower
volume
isextracted
||
Recreational
fish
(not
species-
specific)
Province
ofBC
(ftp://ftp.gis.
luco.gov.bc.
ca/pub/coastal/)
(None)
32(bycatch)
3.6
Lessthan
commercialfishing
because
presumably
alower
volumeis
extracted
||
continued
over
ASSESSING INTENSITY OF ANTHROPOGENIC ACTIVITIES 61
Copyright # 2007 John Wiley & Sons, Ltd. Aquatic Conserv: Mar. Freshw. Ecosyst. 18: 55–85 (2008)
DOI: 10.1002/aqc

Transportationand
infrastructure
Shippinglaneb
Coast
Guard
Medium
5(pollution,noise)
15.3
Higher
impact
thancommercial
fishingbecause
of
theconcentration
ofshipsusingthe
sameroute,but
causesless
habitat
destructionthan
bottom
trawling
orpermanent
structuressuch
as
ferrydocks
||
Moore
and
Clarke,
2002;
Hamptonet
al.,
2003
Cruiseship
routesb
Oilandgas
commission
website
Medium
5(noise,
discharge
ofeffl
uent)
25.6
Sameas
shippinglane,
buthigher
indirectim
pact
due
toblack
and
greywater
discharges
||
United
States
General
Accounting
Office,
2000;Commoy
etal.,2005
Anchorages
Province
ofBC
(ftp://ftp.gis.
luco.gov.bc.
ca/pub/coastal/)
Low
12(fishingandlitter)1.6
Severityand
durationof
impact
habitat
rating
||
Backhurstand
Cole,2000b;
Jamiesonand
Levings,2001;
Milazzoet
al.,
2004
Boatlaunches
bProvince
ofBC
(ftp://ftp.gis.luco.
gov.bc.ca/pub/
coastal/)
Medium-low
13(noise,
litter,
spills)
1.9
Considered
same
asanchorages,but
higher
indirect
impact
because
of
thepermanent
structures
||
Turner
etal.,
1997
Disposalsites
Province
ofBC
(ftp://ftp.gis.luco.
gov.bc.ca/pub/
coastal/)
High
10
4(possible
toxins,
leaching)
11.2
Severityand
durationof
impact
habitat
rating
|Jamiesonand
Levings,
2001;Savage,
2005
Moorageb
Province
ofBC
(ftp://ftp.gis.
luco.gov.bc.ca/
pub/coastal/)
Low
12(fishingand
litter)
1.6
Considered
same
asanchorages
||
Nightingale
and
Sim
enstad,
2001
Table1.continued
Typeofdata
Sourceofdata
Stressor
beyond
locationof
occurrence
Severityanddurationof
impact
(0¼
least;
10¼
greatest)a
Impact¼
direct
þð0:3
bindirect)
How
theim
pact
valuewasderived
from
Jamiesonand
Levings(2001)
Category
of
impact
References
Direct
Indirect
Physical
change
Chem
ical
change
Biological
change
N. BAN AND J. ALDER62
Copyright # 2007 John Wiley & Sons, Ltd. Aquatic Conserv: Mar. Freshw. Ecosyst. 18: 55–85 (2008)
DOI: 10.1002/aqc

Ferry
dock
bTRIM
}Province
ofBC
Medium
8(destructionof
habitat,alteration
ofcurrents)
4(litter,toxins)
9.2
Lesssevere
(�2points)than
‘loadingareasand
term
inals’asonly
people
are
loaded
||
Nightingale
andSim
enstad,
2001;Stevens
andEkermo,
2003
Marinab
TRIM
}Province
ofBC
Medium
8(destructionof
habitat)
4(litter,toxins)
9.2
Lesssevere
(�2points)than
‘loadingareas
andterm
inals’
asonly
people
are
loaded
||
Turner
etal.,
1997;Nightingale
andSim
enstad,
2001
Ferry
route
bTRIM
}Province
ofBC
Medium-low
5(noise)
15.3
Sameas
shippinglane
||
Stevensand
Ekermo,2003
Docksb
TRIM
}Province
ofBC
Low
13(litter,fishing)
1.9
Considered
same
asanchorages,but
higher
indirect
impact
because
of
thepermanent
structures
||
Wendtet
al.,
1996;Macfarlane
etal.,2000;
Nightingale
and
Sim
enstad,2001
Pierb
TRIM
}Province
ofBC
Low
13(litter,fishing,
noise)
1.9
Considered
same
asanchorages,but
higher
indirect
impact
because
of
thepermanent
structures
||
Macfarlaneet
al.,
2000;Nightingale
andSim
enstad,
2001
Terrestrialuses
Terrestrial
Mining
TRIM
}Province
ofBC
Medium-low
03(w
asteand
chem
ical
dispersion,
sedim
entplume)
0.9
Someindirect
impact
due
topollution,metals,
acidrock
drainage
|Hines
etal.,
2000;Jamieson
andLevings,2001;
Levingset
al.,
2004
Built-upareab
TRIM
}Province
ofBC
Medium-high
2(increased
sedim
entation
discharge,
disturbance
of
naturalvegetation)
2(disturbance
ofestuarine
functions,removal
ofdetritalsources)
2.6
Somedirectim
pact
dueto
seaside
structures,
indirect
impact
dueto
urban
runoff
||
Nightingale
and
Sim
enstad,2001;
Kennish,2002;
Boltonet
al.,
2004
Industry
bProvince
ofBC
(ftp://ftp.gis.luco.
gov.bc.ca/pub/
coastal/)
High
87(possible
toxins)
10.1
Basedonan
averageof
‘industrialoutfall’,
‘groinsand
breakwaters’,
‘logbooming’,and
‘dredging’
||
Colodey
and
Wells,1992;
Khan,1997;
Roberts
etal.,
1998;Bolton
etal.,2004
Lighthouse
bTRIM
}Province
ofBC
Low
01
0.3
Someindirect
impact
due
tostructure
andhumanpresence
|Stamski,2005
aBasedonim
pact
weightingschem
edevised
byJamiesonandLevings(2001).
bActivitiesnotweightedbyJamiesonandLevings(2001).
ASSESSING INTENSITY OF ANTHROPOGENIC ACTIVITIES 63
Copyright # 2007 John Wiley & Sons, Ltd. Aquatic Conserv: Mar. Freshw. Ecosyst. 18: 55–85 (2008)
DOI: 10.1002/aqc

Observed impacts vary by an order of magnitude in many cases, and therefore assumptions about theextent of the impact were applied to each data layer. These are termed stressors, as the impact on speciesand habitats is inferred. First, the assumption was that the stressors resulting from activities are localized,and a uniform 1-km buffer around point and line data was applied (Figure 1). Second, a medium extent ofstressors beyond the site of occurrence was assumed, with buffers out to a maximum of 5 km. Third, alarger extent of stressors was assumed, and buffers were assigned out to a maximum of 25 km. To apply thelast two assumptions, a qualitative ranking of high to low to rate the extent of stressors beyond the site ofoccurrence was devised based on a review of the literature (Table 3). Diminishing buffers were then assignedbased on the assumptions above, using the multiple buffer option with 1-km increments for the mediumbuffers, and 5 km increments for the large buffer assumption (Figure 2). Each marine use and its associatedbuffers was mapped on a raster (1 km2 grid), and then the impact of each activity was multiplied by itsrelative weighting (stressors) and the appropriate buffer distance (Figure 2). Where activities overlap in a
Table 2. Incomplete and missing data
Type of data Status of data Comments
Additional recreational fisheries Missing Limited spatial information on recreationalfishing areas is currently collected throughcreel surveys, and data on some targetedrecreational fisheries, such as salmon, ismissing from the spatial data files
Additional terrestrial: clear cuts,agriculture
Proprietary This kind of information could also beincorporated into a non-point-source pollutiondatabase
Commercial marine tourism: wildlifeviewing, sports fishing, diving
Missing Some recreational fishing areas are currentlyincluded, but sports fishing lodges are not.Other commercial tourism operations shouldalso be considered
Non-commercial marine tourism areas:pleasure boating
Missing
Invasive species Missing Problem areas for invasive species would helpidentify marine areas under stress
Non-point source pollution MissingAboriginal fisheries Missing/proprietaryShipping routes Missing Aside from the designated shipping lane in
Juan de Fuca Strait and Strait of Georgia, wewere unable to find data on routes used byshipping/tanker traffic
Climate change Missing Climate change, such as rising temperatures inthe ocean, has a ubiquitous impact. Yet theremay be areas that are seeing more changesthan average
Acidification Missing Acidification of the ocean is also a ubiquitousimpact. We do not know whether anyinformation exists for acidification in BritishColumbia
Historical impacts MissingNatural disturbance regimes MissingVulnerable and sensitive habitats MissingRisk of impact from activities MissingFuture developments and their potentialimpacts
Missing
N. BAN AND J. ALDER64
Copyright # 2007 John Wiley & Sons, Ltd. Aquatic Conserv: Mar. Freshw. Ecosyst. 18: 55–85 (2008)
DOI: 10.1002/aqc

Table3.Im
pact
beyondlocationofoccurrence
from
theliterature
Impact
beyondsite
Typeofdata
Typeofim
pact
Maxim
um
distance
of
observed
impact
Locationofstudy
References
High
Finfish
aquaculture
Transm
ittance
offurunculosis
24km
Puget
Sound
Quotedin
EVS
Environment
Consultants,2000,
Sea
lice
infectionsexceeded
ambient
levels
30km
British
Columbia
Krkoseket
al.,2005
Secondgenerationoflice
thatre-
infected
juvenilesalm
onexceeded
ambientlevels
75km
British
Columbia
Krkoseket
al.,2005
Escaped
Atlanticsalm
on
100sofkm
British
Columbia
Nayloret
al.,2001
Deadzonecreatedbyaccumulated
organic
matter
100to
500feet
British
Columbia
Quotedin
Nayloret
al.,
2003
Disposalsites
Sew
age-derived
nitrogen
tracedto
24km
from
outfall;sewageinfluence
most
pronouncedwithin
10km
10–24km
Baltic
Sea
Savage,
2005
Industry
Trace
metalcontaminants
found
�50km
distantfrom
Vancouver
harbour
�50km
British
Columbia
Boltonet
al.,2004
Structuralchanges
inbenthic
communitiesalongapresumed
pollutiongradient
�20km
British
Columbia
Jeet
al.,2004
Tracesofbark,fibre
andwoodchips
observed
12km
upcurrentfrom
apulp
andpaper
mill
12km
New
foundland
Khan,1997
Medium–high
Built-uparea
Structuralchanges
inbenthic
communitiesalongapresumed
pollutiongradient
�20km
British
Columbia
Jeet
al.,2004
Medium
Shippinglane
Responsesoffeedinghumpback
whales
tovessels
2–4km
British
Columbia
and
Alaska
RichardsonandMalm
e,1995
Illegaldumpingofoilywastes
80km
California
Hamptonet
al.,2003
Boatnoisecould
impaircommunication
betweenkillerwhalesover
arangeof
1–14km
1–14km
WashingtonandBritish
Columbia
Foote
etal.,2004
Cruiseship
routes
Volumeofgreywaterplumewith
detectable
levelsoftracerdye
6–45billionlitres
Florida
United
States
Environmental
ProtectionAgency,2002
Boatnoisecould
impaircommunication
betweenkillerwhalesover
arangeof
1–14km
1–14km
WashingtonandBritish
Columbia
Foote
etal.,2004
Marina
Dredgingformarinadevelopmentand
vesselnavigation,waterquality
issues
creatingconditionsfordinoflagellate
blooms
Atleast
extentofthe
marinaandvessel
channels
Washington
Nightingale
and
Sim
enstad,2001
Sweden
continued
over
ASSESSING INTENSITY OF ANTHROPOGENIC ACTIVITIES 65
Copyright # 2007 John Wiley & Sons, Ltd. Aquatic Conserv: Mar. Freshw. Ecosyst. 18: 55–85 (2008)
DOI: 10.1002/aqc
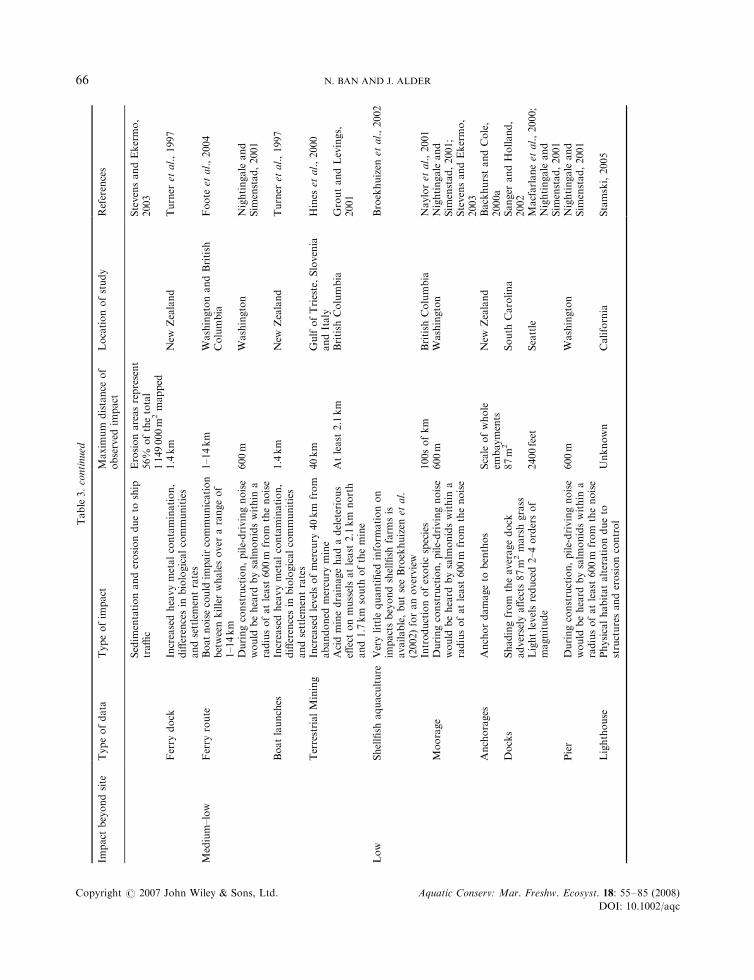
Table3.continued
Impact
beyondsite
Typeofdata
Typeofim
pact
Maxim
um
distance
of
observed
impact
Locationofstudy
References
Sedim
entationanderosiondueto
ship
traffic
Erosionareasrepresent
56%
ofthetotal
1149000m
2mapped
StevensandEkermo,
2003
Ferry
dock
Increasedheavymetalcontamination,
differencesin
biologicalcommunities
andsettlementrates
1.4km
New
Zealand
Turner
etal.,1997
Medium–low
Ferry
route
Boatnoisecould
impaircommunication
betweenkillerwhalesover
arangeof
1–14km
1–14km
WashingtonandBritish
Columbia
Foote
etal.,2004
Duringconstruction,pile-drivingnoise
would
beheard
bysalm
onidswithin
aradiusofatleast
600m
from
thenoise
600m
Washington
Nightingale
and
Sim
enstad,2001
Boatlaunches
Increasedheavymetalcontamination,
differencesin
biologicalcommunities
andsettlementrates
1.4km
New
Zealand
Turner
etal.,1997
TerrestrialMining
Increasedlevelsofmercury
40km
from
abandoned
mercury
mine
40km
GulfofTrieste,Slovenia
andItaly
Hines
etal.,2000
Acidminedrainagehadadeleterious
effectonmusselsatleast
2.1km
north
and1.7km
south
ofthemine
Atleast
2.1km
British
Columbia
GroutandLevings,
2001
Low
Shellfish
aquaculture
Verylittle
quantified
inform
ationon
impactsbeyondshellfish
farm
sis
available,butseeBroekhuizen
etal.
(2002)foranoverview
Broekhuizen
etal.,2002
Introductionofexoticspecies
100sofkm
British
Columbia
Nayloret
al.,2001
Moorage
Duringconstruction,pile-drivingnoise
would
beheard
bysalm
onidswithin
aradiusofatleast
600m
from
thenoise
600m
Washington
Nightingale
and
Sim
enstad,2001;
StevensandEkermo,
2003
Anchorages
Anchordamageto
benthos
Scale
ofwhole
embayments
New
Zealand
BackhurstandCole,
2000a
Docks
Shadingfrom
theaveragedock
adversely
affects
87m
2marshgrass
87m
2South
Carolina
Sanger
andHolland,
2002
Lightlevelsreduced2–4ordersof
magnitude
2400feet
Seattle
Macfarlaneet
al.,2000;
Nightingale
and
Sim
enstad,2001
Pier
Duringconstruction,pile-drivingnoise
would
beheard
bysalm
onidswithin
aradiusofatleast
600m
from
thenoise
600m
Washington
Nightingale
and
Sim
enstad,2001
Lighthouse
Physicalhabitatalterationdueto
structuresanderosioncontrol
Unknown
California
Stamski,2005
N. BAN AND J. ALDER66
Copyright # 2007 John Wiley & Sons, Ltd. Aquatic Conserv: Mar. Freshw. Ecosyst. 18: 55–85 (2008)
DOI: 10.1002/aqc

grid cell, the values were added. Because of the variability in the fishing polygons, buffers were not used forfishing areas. The bottom trawling data were at a coarse scale summarized in a 10 km by 10 km grid, suchthat buffering these data could exaggerate the impact of this activity. The polygon data for the otherfisheries were of unknown completeness and accuracy, so were also handled without buffers.
A visual report of the pattern of use can help identify the stressors of human activities in the ocean. Threecomposite maps overlaying all activities were created, one for each of the above assumptions: a small bufferwith 1 km around line and point data, a medium buffer with a maximum buffer distance of 5 km foractivities with a high rating for the extent of stressors beyond the location of occurrence, and a large bufferwith a maximum buffer distance of 25 km for activities with a high rating for the extent of stressors beyondthe location of occurrence.
Two metrics were applied to gauge the extent of stressors of different types of activities. First the stressorvalue of each occurrence of an activity in a raster cell was added, then averaged over all available rastercells. This gives an indication of the highest average stressors. Second, the total number of raster cells wherean activity occurs was tabulated. This provides a measure of the extent of activities. Both of these metricswere calculated for each of the three buffer assumptions.
The marine areas currently covered by protected area designations were calculated to gauge existingprotection. The following designations were included in the calculation: Oceans Act Marine ProtectedAreas, National Parks, Rockfish Conservation Areas, provincial Protected Areas, Parks, Marine Parks,and Ecological Reserves. The BC marine ecological classification system was used to divide the marine areainto the offshore and continental shelf and slope regions (Zacharias and Howes, 1998; Zacharias et al.,1998). The Inner Pacific Shelf, Outer Pacific Shelf and Georgia Basin ecoregions comprise the continentalshelf and slope. The Subarctic and Transition Pacific ecoregions comprise the offshore region.
Boat launches
Finfish farms
km
Stressor value00 - 22-13
km
km
km
km
km
0 105 0 105 0 105
0 105
0 105
0 1050 105
km
(Symbols exagerated)
(Symbols exagerated)
(a) (b) (c)
(d)
(a) (b) (c)
Figure 1. Schematic of the methodology used to generate the small buffer (1 km) data layers and analysis, highlighting two activities inone part of British Columbia. (Additional activities take place in this particular part of BC). (a) The activities are mapped. (b) 1 kmbuffers are added to mapped activities (see Table 1). (c) The maps are converted to a 1 km2 raster grid, assigning the stressor valueassociated with each activity (Table 1). (d) The stressor values for all layers are added. This figure is available in colour online at
www.interscience.wiley.com/journal/aqc
ASSESSING INTENSITY OF ANTHROPOGENIC ACTIVITIES 67
Copyright # 2007 John Wiley & Sons, Ltd. Aquatic Conserv: Mar. Freshw. Ecosyst. 18: 55–85 (2008)
DOI: 10.1002/aqc

Bo
at la
un
ches
Fin
fish
farm
s
010
5km
010
5km
(Sym
bo
ls e
xag
erat
ed)
(Sym
bo
ls e
xag
erat
ed)
010
5km
km
Str
esso
rva
lue 0 1.9
3.8
010
5km
01
km
Str
esso
rva
lue
10.8
21.6
32.4
43.2
54
010
5km
010
5km
km
IStr
esso
rva
lue
1-12
12-2
525
-36
36-4
747
-58
(a)
(a)
(b)
(b)
(c)
(c)
(d)
(d)
(e)
201
2
010
5
Figure
2.Schem
aticofthemethodologyusedto
generate
themedium
buffer
(upto
5km)data
layersandanalysis.(a)Theactivitiesare
mapped.(b)Buffersare
added
in1km
increm
ents
(upto
fivebuffers)
basedontheassigned
relativestressorbeyondthelocationofoccurrence
(asoutlined
inTable1).Activitieswithahighratingare
given
five1km
buffers,activitieswithamedium-highratingare
assigned
fourbuffers,etc.(c)Thestressorvalues
are
assigned
basedontheim
pact
valueassociatedwith
each
activity(Table1).Toassignthestressorvalue,theinnermostbuffer
multiplies
theim
pact
valuebythenumber
ofrings(n).Thenextbuffer
iscalculatedastheim
pact
valuetimes
thenumber
ofbuffersminusone,thenextbuffer
istheim
pactvaluetimes
thenumber
ofbuffersminustw
o,etc.Thiscreateddecreasingbuffer
values,withthe
innermostbuffer
havingthehigheststressorvalue.(d)Themapsare
convertedto
a1km
2raster
grid.(e)Allthelayersare
added.Thesamemethodologywasusedforthe
largebuffers(upto
25km),using5km
buffersinsteadofthe1km
buffersdescribed
above.
This
figure
isavailable
incolouronlineatwww.interscience.wiley.com/
journal/aqc
N. BAN AND J. ALDER68
Copyright # 2007 John Wiley & Sons, Ltd. Aquatic Conserv: Mar. Freshw. Ecosyst. 18: 55–85 (2008)
DOI: 10.1002/aqc

RESULTS
The continental shelf and slope of BC is being used extensively by humans (Table 4, Figures 3–8).Examining the map showing the number of overlapping activities with small buffers (1 km), 83% of thecontinental shelf and slope is affected by stressors from human activities (Figure 3). Under this bufferassumption, fishing activities appear most prominently (Figure 9). With buffers up to 5 km, the resultingmap does not appear very different (Figure 4), with 85% of the continental shelf and slope affected bystressors. Once buffers were extended to 25 km, however, the number of activities that overlapped increasedsubstantially in inshore coastal areas, 15% of the area used having more than nine overlapping activities(Figure 5). Under this assumption, 98% of the continental shelf and slope lay in areas with stressors fromhuman activities.
Accounting for the impact of activities by mapping predicted stressors, much of the continental shelf andslope region appears more affected than depicted by overlapping activities (Figures 6–8 for the small,medium, and large buffer assumptions). As with the small and medium buffer maps showing the number ofoverlapping activities (Figures 3 and 4), the small and medium buffer maps depicting stressors are similar toeach other (Figures 6 and 7). The large buffer map (Figure 8) highlights most coastal areas as having highrelative values of stressors.
The marine activity with the highest stressor value when averaged over all raster cells is commercialbottom trawling for both the small buffer assumption (Figure 9), and the medium buffer assumption(Figure 10). Assuming stressors extend up to 25 km beyond the sites of occurrence, however, indicated thatindustry exceeded bottom trawling as the activity with the highest average raster cell value (Figure 11). Theindustry data were used as categorized by the Province of British Columbia (Table 1), and includes loggingoperations (e.g. log booms, logging camps, log dumps), pulp and paper mills, industrial yards, oil tanks,conveyors, buildings, fish processing facilities and shipyards.
The category of marine activity in BC with the largest spatial extent was commercial fishing under boththe small and medium buffer assumptions given stressors (Figure 12) and the area used (Figure 13).Accounting for stressors under the large buffer assumption, the transportation and infrastructure categoryand terrestrial use category exceed the stressors resulting from commercial fishing (Figure 12). Recreationalfishing has the lowest stressor value under the medium and large buffer assumptions.
Very little of BC’s marine environment is currently protected (Table 5). BC’s EEZ has 1.47% of watersprotected, while the continental shelf and slope has a proportionally higher protection at 4.69%.
DISCUSSION
Intensity of use
The continental shelf and slope of British Columbia is used intensively by humans. Even under the mostconservative assumption about the extent of stressors resulting from human activities, a greater proportion
Table 4. Area affected by anthropogenic stressors
Buffer assumptions Area of EEZaffected byanthropogenicstressors (ha)
Percentage of EEZaffected byanthropogenicstressors
Area of continentalshelf and slope affectedby anthropogenicstressors (ha)
Percentage of continentalshelf and slope affectedby anthropogenicstressors
Small (0–1 km) buffer 12 596 412 27.78% 11 157 972 83.30%Medium (0–5 km) buffer 13 371 569 29.49% 11 431 612 85.34%Large (0–25 km) buffer 14 598 777 32.20% 13 094 191 97.75%
ASSESSING INTENSITY OF ANTHROPOGENIC ACTIVITIES 69
Copyright # 2007 John Wiley & Sons, Ltd. Aquatic Conserv: Mar. Freshw. Ecosyst. 18: 55–85 (2008)
DOI: 10.1002/aqc

of BC’s continental shelf and slope is affected than the adjacent coastal terrestrial area, where 45.9% of thecoast and mountains ecoprovince is considered intact (Government of Canada, Province of BritishColumbia, 1998). The data used in this analysis indicate that the deep ocean beyond the continental shelfand slope remains little used, yet globally an increase in deep-sea fishing has been observed (Roberts, 2002).With such extensive use of the continental shelf and slope, very little if any of BC’s marine environment isuntouched.
Bottom trawling has been documented repeatedly as a destructive form of fishing (Watling and Norse,1998; Collie et al., 2000; Fossa et al., 2002; Ardron, 2005). In this analysis, bottom trawling has the highestaverage stressor value. However, this may be influenced by how this particular data layer is summarized.
Figure 3. Number of overlapping activities, applying the small buffer (1 km buffer) assumption. The number of activities in each 1 km2
grid cell is shown. The area inshore of the solid line is the continental slope and shelf. This figure is available in colour online atwww.interscience.wiley.com/journal/aqc
N. BAN AND J. ALDER70
Copyright # 2007 John Wiley & Sons, Ltd. Aquatic Conserv: Mar. Freshw. Ecosyst. 18: 55–85 (2008)
DOI: 10.1002/aqc

Groundfish bottom trawling areas from 1996 to 2005 were obtained as documented in logbooks,summarized in 10 km by 10 km grid cells from the federal department Fisheries and Oceans Canada (DFO).Each such cell shows groundfish trawling activity when three or more distinct vessels trawled in that cell.Thus areas that do not show trawling may be trawled by one or two vessels, and it should not be inferredthat all ground within the trawled cells has been towed. More accurate bottom trawling data that do notexclude data would be very valuable.
Recreational fishing is probably much more extensive than available data show. Recreational fishing is apopular activity in BC. For example, in 2001 55% of the reported catch of chinook salmon was caught inthe tidal recreational fishery (FAO, 2001). A recent review of global recreational and commercial fisheries
Figure 4. Number of overlapping activities, applying the medium buffer (up to 5 km buffer) assumption. The number of activities ineach 1 km2 grid cell is shown. The area inshore of the solid line is the continental slope and shelf. This figure is available in colour
online at www.interscience.wiley.com/journal/aqc
ASSESSING INTENSITY OF ANTHROPOGENIC ACTIVITIES 71
Copyright # 2007 John Wiley & Sons, Ltd. Aquatic Conserv: Mar. Freshw. Ecosyst. 18: 55–85 (2008)
DOI: 10.1002/aqc

suggests that the two types of fisheries may have similar impacts (Cooke and Cowx, 2006). Yet governmentcreel surveys are not designed to collect spatial data on recreational fishing (Fisheries and Oceans Canada,2006). Incorporating questions about the spatial distribution of fishing into creel surveys would greatlyimprove the information on recreational fishing. It may therefore be dangerous to dismiss recreationalfishing as an insignificant source of impact based on our results.
Protection of the marine environment
Very little of the marine environment in BC is protected, even though marine protected areas have been asubject of Canadian government policy development since the 1960s (Government of Canada, Province ofBritish Columbia, 1998). Marine protected areas can eliminate or reduce the direct impact of human
Figure 5. Number of overlapping activities, applying the large buffer (up to 25 km buffer) assumption. The number of activities in each1 km2 grid cell is shown. The area inshore of the solid line is the continental slope and shelf. This figure is available in colour online at
www.interscience.wiley.com/journal/aqc
N. BAN AND J. ALDER72
Copyright # 2007 John Wiley & Sons, Ltd. Aquatic Conserv: Mar. Freshw. Ecosyst. 18: 55–85 (2008)
DOI: 10.1002/aqc

activities on the ocean. British Columbia has several protected area designations that have previously beenconsidered as marine protected areas (Zacharias and Howes, 1998). Fisheries and Oceans Canada candesignate Marine Protected Areas under the Oceans Act, where the level of protection varies. NationalParks, designated under the National Parks Act may include a marine component, although the level ofprotection varies. Parks Canada can designate National Marine Conservation Areas under the NationalMarine Conservation Areas Act, which are meant to be zoned to allow various levels of use and mustinclude a no-take component. Environment Canada can establish marine wildlife areas, aimed primarily atprotecting seabird foraging areas. Fisheries and Oceans Canada has been designating Rockfish
Figure 6. Stressors resulting from human activities, applying the small buffer assumption (1 km). The area inshore of the solid line isthe continental slope and shelf. This figure is available in colour online at www.interscience.wiley.com/journal/aqc
ASSESSING INTENSITY OF ANTHROPOGENIC ACTIVITIES 73
Copyright # 2007 John Wiley & Sons, Ltd. Aquatic Conserv: Mar. Freshw. Ecosyst. 18: 55–85 (2008)
DOI: 10.1002/aqc

Conservation Areas aimed to reduce the decline of inshore rockfish species. Activities unlikely to harmrockfish are permitted. Provincial Protected Areas, Marine Parks, and Ecological Reserves in the marineenvironment similarly vary in the level of protection.
The total area protected has changed little since a previous analysis in 1997 (Zacharias and Howes, 1998;Government of British Columbia, 2006). In total, all marine areas designated for conservation orprotection purposes combined cover 1.5% of British Columbia’s marine environment (Table 5). However,most of these areas were designated for terrestrial purposes, with boundaries extending into the marineenvironment without necessarily providing comprehensive marine protection (Jamieson and Levings,
Figure 7. Stressors resulting from human activities, applying the medium buffer assumption (up to 5 km). The area inshore of the solidline is the continental slope and shelf. This figure is available in colour online at www.interscience.wiley.com/journal/aqc
N. BAN AND J. ALDER74
Copyright # 2007 John Wiley & Sons, Ltd. Aquatic Conserv: Mar. Freshw. Ecosyst. 18: 55–85 (2008)
DOI: 10.1002/aqc

2001). Rockfish Conservation Areas currently cover 0.9% of British Columbia’s EEZ. These areas were setup to protect inshore rockfish under the inshore rockfish conservation strategy (Fisheries and OceansCanada, 2002), with the eventual goal of protecting about 20% of inshore rockfish habitat. One MarineProtected Area (Endeavour Hydrothermal Vents) covers 0.2% of BC’s marine area. No areas currentlyexist under the National Marine Conservation Area or Marine Wildlife Area designations. Given that avery large percentage of BC’s marine environment is already exposed to human activity, the need to providemore protection is urgent. The results from this analysis could be integrated as a cost layer into reserveselection tools (for such an approach in BC, see Ardron (2003)) to identify suitable conservation areas thatare predicted to be relatively less impacted.
Canada’s Oceans Strategy, led by Fisheries and Oceans Canada, is meant to provide an integratedapproach to ocean management, coordinate policies and programmes across governments, and generate a
Figure 8. Stressors resulting from human activities, applying the large buffer assumption (up to 25 km). The area inshore of the solidline is the continental slope and shelf. This figure is available in colour online at www.interscience.wiley.com/journal/aqc
ASSESSING INTENSITY OF ANTHROPOGENIC ACTIVITIES 75
Copyright # 2007 John Wiley & Sons, Ltd. Aquatic Conserv: Mar. Freshw. Ecosyst. 18: 55–85 (2008)
DOI: 10.1002/aqc

0
0.1
0.2
0.3
0.4
0.5
0.6
0.7
Comm
ercia
l pra
wn
Comm
ercia
l urc
hin
Recre
ation
al cr
ab
Comm
ercia
l her
ring
roe
Ferry
rout
es
Cruise
ship
rout
es
Comm
ercia
l cra
b
Comm
ercia
l shr
imp
Recre
ation
al gr
ound
fish
Recre
ation
al fis
h
Comm
ercia
l salm
on n
et
Comm
ercia
l gro
undf
ish (t
rawl ta
ken
out)
Comm
ercia
l salm
on tr
oll
Comm
ercia
l bot
tom
traw
l
Activities with an average cell value > 0.01
Ave
rag
e ce
ll va
lue
Figure 9. Stressors resulting from marine activities by average raster cell value, using the small buffer assumption (1 km). This figure isavailable in colour online at www.interscience.wiley.com/journal/aqc
0
0.1
0.2
0.3
0.4
0.5
0.6
0.7
Comm
ercia
l pra
wn
Comm
ercia
l urc
hin
Recre
ation
al cr
ab
Comm
ercia
l her
ring
roe
Shippin
g lan
e
Ferry
doc
k
Dispos
al
Comm
ercia
l cra
b
Comm
ercia
l shr
imp
Recre
ation
al gr
ound
fish
Ferry
rout
es
Recre
ation
al fis
h
Comm
ercia
l salm
on n
et
Comm
ercia
l gro
undf
ish (t
rawl ta
ken
out)
mar
ina
Cruise
ship
rout
es
Finfish
aqu
acult
ure
Indu
stry
Comm
ercia
l salm
on tr
oll
Comm
ercia
l bot
tom
trawl
Activities with an average cell value > 0.01
Ave
rag
e ce
ll va
lue
Figure 10. Stressors resulting from marine activities by average raster cell value, using the medium buffer assumption (up to 5 km).This figure is available in colour online at www.interscience.wiley.com/journal/aqc
N. BAN AND J. ALDER76
Copyright # 2007 John Wiley & Sons, Ltd. Aquatic Conserv: Mar. Freshw. Ecosyst. 18: 55–85 (2008)
DOI: 10.1002/aqc

shift towards an ecosystem approach (Government of Canada, 2002a). While the strategy has been in placesince 2002, progress in achieving it has been very slow (Jessen and Ban, 2003; Office of the Auditor Generalof Canada, 2005). In British Columbia, most aboriginal groups have not signed treaties, and all have a rightto fish for food, social and ceremonial purposes. Successful implementation will require meaningfulinvolvement of aboriginal people (Government of Canada, 2002b).
Data issues
The marine uses considered for this analysis were limited by data availability (Table 2). The resulting mapsshould therefore be considered a preliminary and conservative estimate of human use of the ocean in BC.Many human activities and influences were not included in the analysis because data were unavailable(Table 2). Therefore the emphasis in this analysis is on the general patterns of use, not the precise locationsof activities and influences. As such, this static assessment of anthropogenic stressors is not sufficient tocomprise a complete picture of anthropogenic stressors and their impacts.
The resolution and accuracy of the data that exist for BC vary. For extractive uses, areas delineated byDFO were used. These data were collected from 1992 to 2002 from a variety of sources and compilers,including interviews with fisheries officers and managers, commercial and recreational fishermen and otherrecords. While the metadata indicate that the accuracy of the information is good, they do not provideinformation about the completeness of the datasets. Using DFO’s logbook data for all fisheries would bepreferable, as it would provide up-to-date and complete coverage of fishing areas. Unfortunately densityinformation was not uniformly available for all data layers, and was therefore excluded from the analysis.
0
0.2
0.4
0.6
0.8
1
1.2
Moo
rage
Comm
ercia
l pra
wn
Comm
ercia
l urc
hin
Recre
ation
al cr
ab
Comm
ercia
l her
ring
roe
dock
sPier
Ancho
rage
Terre
strial
mini
ng
Comm
ercia
l cra
b
Comm
ercia
l shr
imp
Recre
ation
al gr
ound
fish
Boat la
unch
Recre
ation
al fis
h
Shippin
g lan
e
Comm
ercia
l salm
on n
et
Comm
ercia
l gro
undf
ish (t
rawl ta
ken
out)
Built a
rea
Ferry
rout
es
Cruise
ship
rout
es
Ferry
doc
k
Comm
ercia
l salm
on tr
oll
Dispos
al
mar
ina
aqua
cultu
re
Finfish
Comm
ercia
l bot
tom
traw
l
Indu
stry
Activities with an average cell value > 0.01
Ave
rag
e ce
ll va
lue
Figure 11. Stressors resulting from marine activities by average raster cell value, using the large buffer assumption (up to 25 km). Thisfigure is available in colour online at www.interscience.wiley.com/journal/aqc
ASSESSING INTENSITY OF ANTHROPOGENIC ACTIVITIES 77
Copyright # 2007 John Wiley & Sons, Ltd. Aquatic Conserv: Mar. Freshw. Ecosyst. 18: 55–85 (2008)
DOI: 10.1002/aqc

The buffers used for mapping stressors are based on a limited number of studies that report on thedistance beyond which activities are having a measurable impact (Table 3). Yet many of these studies werenot designed to measure the maximum detectable distance of impacts, and therefore the distances in Table 3are minimum estimates. For example, a study measuring the effects of acid mine drainage from a coppermine on blue mussels measured mussel survival 2.1 km north and 1.7 km south of the mine (Grout andLevings, 2001). Acid mine drainage was deleterious to blue mussels at least to this distance, but it isunknown how far beyond these limits the impact may have been felt. Similarly, activities can have multipletypes of impacts. For example, finfish aquaculture has effects on the substrate immediately below the seapen, serve as a vector for sea lice infestations, contribute to the introduction of exotic species throughescapes, and are dependent on fishing to produce their feed (Milewski, 2000; Dalton, 2004; Krkosek et al.,2005). The geographic extent of each of these stressors will probably vary.
Ecological considerations
Little is known about the response of multi-trophic marine communities to multiple anthropogenicstressors (Petchey et al., 2004). Because of the limited understanding of such interactions, in this analysisthe simplifying assumption is that activities have an additive effect. In reality, stressors can be synergistic, orcumulative, when the combined effect is larger than the additive effect of each stressor would predict (Foltet al., 1999; Vinebrooke et al., 2004). Stressors can also be antagonistic, when the impact is less thanexpected (Folt et al., 1999; Vinebrooke et al., 2004). How individuals or species react to multiple stressorsdepends on the ability of individuals or species to tolerate each stressor, termed co-tolerance (Vinebrookeet al., 2004). When positive co-tolerance is observed, ecosystem functioning will be more likely to withstandan additional stressor. Negative co-tolerance would probably result in an increased decline or loss of species
0
0.2
0.4
0.6
0.8
1
1.2
1.4
1.6
1.8
Commercial Recreational Transportationandfishing fishing
infrastructure
Terrestrial uses Aquaculture
Su
m o
f av
erag
e ce
ll va
lues
small (0-1 km) buffers
medium (0-5 km) buffers
large (0-25 km) buffers
Figure 12. Stressors resulting from marine activities by category.
N. BAN AND J. ALDER78
Copyright # 2007 John Wiley & Sons, Ltd. Aquatic Conserv: Mar. Freshw. Ecosyst. 18: 55–85 (2008)
DOI: 10.1002/aqc

with additional stressors (Vinebrooke et al., 2004). Examples of both responses have been observed inaquatic environments (Folt et al., 1999; Lotze and Milewski, 2004; Vinebrooke et al., 2004; Scheffer et al.,2005). In addition, a debate exists in the ecology literature about whether more diverse ecosystems are morestable (the diversity–stability debate) (Grime, 1997; Huston, 1997; McGrady-Steed et al., 1997; Naeem andLi, 1997; Doak et al., 1998; Tilman et al., 1998; Schlapfer and Schmid, 1999; Tilman, 1999, 2000; Chapinet al., 2000; Ghilarov, 2000; McCann, 2000; Loreau and Hector, 2001; Loreau et al., 2001; Naeem, 2002).One hypothesis suggests that the stability of ecological communities is affected by the interaction strengthsbetween predators and their prey (de Ruiter and Neutel, 1995; Bascompte et al., 2005), and therefore thestructure of a community will affect its response to stressors.
The frequency and magnitude of natural disturbances will influence the response of individuals, speciesand functional groups to anthropogenic stressors (Hughes and Connell, 1999; Nystrom and Folke, 2001).Similarly, the history of natural and anthropogenic disturbances in any particular area will affect theresponse of individual, species and functional groups to additional natural or anthropogenic stressors(Lotze and Milewski, 2004). Thus environments also vary in their sensitivity to particular stressors givenboth the habitat structure and past impacts (Zacharias and Gregr, 2005). For example, a muddy substratesubject to frequent natural disturbance events such as storms that perturb the sediment will be less sensitiveto trawling than an area that comprises deep sea corals. Such less physically stable habitats are generallyinhabited by more opportunistic species that are better able to recover from trawling until a thresholdbeyond which the system enters a permanently altered state (Collie et al., 2000). Because of the lack ofspatial data on natural disturbance regimes and historical human use, a limitation of this analysis is thatonly recent anthropogenic stressors were mapped.
0
2,000,000
4,000,000
6,000,000
8,000,000
10,000,000
12,000,000
Commercial Recreational Transportationandfisheriesfisheries
infrastructure
Terrestrialuses
Aquaculture
Are
a (h
a) small (0-1 km) buffer
medium (0-5 km) buffer
large (0-25 km) buffer
Figure 13. Area impacted by categories of marine activities.
ASSESSING INTENSITY OF ANTHROPOGENIC ACTIVITIES 79
Copyright # 2007 John Wiley & Sons, Ltd. Aquatic Conserv: Mar. Freshw. Ecosyst. 18: 55–85 (2008)
DOI: 10.1002/aqc

Future direction
Given the confounding effects of positive and negative co-tolerance, natural disturbances, and pastanthropogenic impacts, it is unknown whether or how the maps of intensity of use and anthropogenicstressors translate into ecological impacts in the ocean. Additional mapping that incorporates models of thevulnerability and sensitivity of habitats to different types of stressors (sensu Zacharias and Gregr, 2005)would contribute to understanding the impacts such stressors may have on the marine environment.Including the risk of impact from activities, and the potential contribution of planned and potentialdevelopments (e.g. port expansions, oil and gas development, inshore tanker traffic) would further enhancethe assessment. Plans for undertaking such additional mapping work are under way. A future step inverifying the analysis would be to ground-truth the results and determine whether a correlation betweenimpacts and the areas mapped as having a high level of stressors exists.
CONCLUSION
The purpose of this paper was to depict the intensity of use, and evaluate the sum of stressors resulting fromhuman activities in British Columbia, Canada. Results show that the continental shelf and slope of BritishColumbia is extensively and in places intensively ‘used’ by humans, yet very little protection is offered to themarine environment. The analysis provides a preliminary and conservative look at the patterns andintensity of use and resulting stressors given the limited spatial data currently available. The resulting maps
Table 5. Marine protection in British Columbia
Protection provided Hectares PercentageofEEZ
Percentage ofcontinentalshelf
Marine ProtectedAreas
Variable 93 812 0.21% 0.00%
RockfishConservationAreas
Recreational fishing activities allowed arehand-picking or diving for invertebrates,crab by trap, prawn by trap, smelt bygillnet. Commercial fishing activitiesallowed are invertebrates by hand-pickingor dive, crab by trap, prawn by trap,scallops by trawl, salmon by seine or gillnet,herring by gillnet, seine and spawn-on-kelp,sardine by gillnet, seine, and trap, smelt bygillnet, euphausiid (krill) by mid-watertrawl, opal squid by seine, and groundfishby mid-water trawl (Fisheries and OceansCanada, 2005)
393 152 0.87% 2.93%
ProvincialProtectedAreas, ProvincialParks, MarineParks, NationalParks, EcologicalReserves
None to variable 237 635 0.52% 1.77%
Totala 666 078 1.47% 4.69%
aSome areas have multiple designations, and therefore the columns do not add up to form the total.
N. BAN AND J. ALDER80
Copyright # 2007 John Wiley & Sons, Ltd. Aquatic Conserv: Mar. Freshw. Ecosyst. 18: 55–85 (2008)
DOI: 10.1002/aqc

can be used as a baseline of human activities for comparison with future analyses. The results may alsoassist in the development of integrated management plans by providing a spatial representation of thelocation of activities.
As this study has shown, even when mapping only current stressors for which spatial data exist, most ofthe marine environment is affected by stressors resulting from human activities. Given the extent of use ofthe ocean in BC and the paucity of protected areas, it is paramount that additional protection is offered tostop degradation and assist recovery while additional research is carried out on the impact and location ofhuman activities. With the limited number areas that are either fully protected or not currently exploited, arelated issue is the lack of reference areas to which impacted areas can be compared. Without a baseline tocompare to degraded systems, compounded with the ‘shifting baselines syndrome’ (Pauly, 1995), it becomesvery difficult to gauge the impact of human activities. The establishment of areas where direct impacts areeliminated can provide a basis for comparison to impacted areas. Yet anthropogenic activities can have animpact many kilometres beyond the location of occurrence, and thus even fully protected areas willprobably continue to receive some stressors from outside of the boundaries.
ACKNOWLEDGEMENTS
The Province of British Columbia’s State of the Coastal and Marine Environment Report instigated the work for thispaper. We thank two reviewers, John Roff and Norm Sloan, and the editor of Aquatic Conservation: Marine andFreshwater Ecosystems, John Baxter, for their helpful comments. We would like to extend particular gratitude toAmanda Vincent for her detailed comments on earlier versions of the manuscript. Drafts of this paper have benefitedfrom the feedback of many people: colleagues at Project Seahorse, Jeff Ardron, Stephen Ban, Brad Barr, Doug Bifford,Sylvie Guenette, Sabine Jessen, Kaaren Lewis, James Quayle and Jodi Stark. We would also like to thank all those whogenerously provided data. Funding for the primary author is provided by: The Canon National Parks Science ScholarsProgram, Natural Science and Engineering Research Council of Canada (NSERC), NSERC industrial postgraduatescholarship in combination with the Canadian Parks and Wilderness Society } British Columbia Chapter, OceanManagement Research Network Integrated Management graduate student seed grant, and Mountain EquipmentCooperative studentship. Jackie Alder is supported by the Sea Around Us Project.
REFERENCES
Ardron J. 2003. BC Coast Information Team marine ecosystem spatial analysis. Version 1.2. In An Ecosystem Analysisfor Haida Gwaii, Central Coast, North Coast British Columbia. DRAFT, 22 September 2003, Rumsey C, Ardron J,Ciruna K, Curtis T, Doyle F, Ferdana Z, Hamilton T, Heinemyer K, Iachetti P, Jeo R, Kaiser G, Narver D,Noss RF, Sizemore D, Tautz A, Tingey R, Vance-Borland K (eds). 1–44.
Ardron J. 2005. Protecting British Columbia’s corals and sponges from bottom trawling: a report by Living OceansSociety. Living Oceans Society, Soitula, BC; 1–21.
Auditor General of Canada. 2000. Fisheries and oceans: the effects of salmon farming in British Columbia on themanagement of wild salmon stocks. Report of the Auditor General of Canada.
Backhurst MK, Cole RG. 2000a. Biological impacts of boating at Kawau Island, north-eastern New Zealand. Journalof Environmental Management 60: 239–251.
Backhurst MK, Cole RG. 2000b. Subtidal benthic marine litter at Kawau Island, north-eastern New Zealand. Journalof Environmental Management 60: 227–237.
Bascompte J, Melian CJ, Sala E. 2005. Interaction strength combinations and the overfishing of a marine food web.Proceedings of the National Academy of Sciences 102: 5443–5447.
Bolton JL, Stehr CM, Boyd DT, Burrows DG, Tkalin AV, Lishavskaya TS. 2004. Organic and trace metalcontaminants in sediments and English sole tissues from Vancouver Harbour, Canada. Marine EnvironmentalResearch 57: 19–36.
Botsford LW, Castilla JC, Peterson CH. 1997. The management of fisheries and marine ecosystems. Science 277:509–515.
ASSESSING INTENSITY OF ANTHROPOGENIC ACTIVITIES 81
Copyright # 2007 John Wiley & Sons, Ltd. Aquatic Conserv: Mar. Freshw. Ecosyst. 18: 55–85 (2008)
DOI: 10.1002/aqc

Broekhuizen N, Zeldis J, Sephens SA, Oldman JW, Ross AH, Ren J, James MR. 2002. Factors related to thesustainability of shellfish aquaculture operations on the Firth of Thames: a preliminary analysis. National Institute ofWater and Atmospheric Research Ltd, Hamilton, New Zealand; 1–112.
Chapin FS, Zavaleta ES, Eviner VT, Naylor RL, Vitousek PM, Reynolds HL, Hooper DU, Lavorel S, Sala OE,Hobbie SE, Mack MC, Diaz S. 2000. Consequences of changing biodiversity. Nature 405: 234–242.
Coleman FC, Figueira WF, Ueland JS, Crowder LB. 2004. The impact of United States recreational fisheries on marinefish populations. Science 305: 1958–1960.
Collie JS, Hall SJ, Kaiser MJ, Poiner IR. 2000. A quantitative analysis of fishing impacts on shelf-sea benthos. Journalof Animal Ecology 69: 785–798.
Colodey AG, Wells PG. 1992. Effects of pulp and paper mill effluents on estuarine and marine ecosystems in Canada:a review. Journal of Aquatic Ecosystem Stress and Recovery (Formerly Journal of Aquatic Ecosystem Health) 1:201–226.
Commoy J, Polytika CA, Nadel R, Bulkley JW. 2005. The environmental impact of cruise ships. In World Water andEnvironmental Resources Congress, Walton R (ed.). Anchorage, AK.
Cooke SJ, Cowx IG. 2006. Contrasting recreational and commercial fishing: searching for common issuesto promote unified conservation of fisheries resources and aquatic environments. Biological Conservation 128:93–108.
Costanza R. 1999. The ecological, economic, and social importance of the oceans. Ecological Economics 31:199–213.
Costanzo SD, O’Donohue MJ, Dennison WC, Loneragan NR, Thomas M. 2001. A new approach for detecting andmapping sewage impacts. Marine Pollution Bulletin 42: 149–156.
Croll DA, Clark CW, Calambokidis J, Ellison WT, Tershy BR. 2001. Effect of anthropogenic low-frequency noise onthe foraging ecology of Balaenoptera whales. Animal Conservation 4: 13–27.
Dalton R. 2004. Fishing for trouble. Nature 431: 502–504.de Ruiter PC, Neutel A-M. 1995. Energetics, patterns of interaction strengths, and stability in real ecosystems. Science269: 1257–1260.
Devine JA, Baker KD, Haedrich RL. 2006. Deep-sea fishes qualify as endangered. Nature 439: 29.Doak DF, Bigger D, Harding EK, Mariver MA, O’Malley RE, Thomson D. 1998. The statistical inevitability ofstability–diversity relationships in community ecology. American Naturalist 151: 264–276.
ESRI. 2004. ArcGIS Version 9.0. ESRI Inc.EVS Environment Consultants. 2000. An evaluation of knowledge and gaps related to impacts of freshwater andmarine aquaculture on the aquatic environment: a review of selected literature. EVS Environment Consultants, NorthVancouver.
FAO. 2001. Fishery Country Profile: Canada. http://www.fao.org/fi/fcp/en/CAN/profile.htmFAO. 2004. The state of the world fisheries and aquaculture 2004. Food and Agriculture Organization of the UnitedNations, Rome.
Fisheries and Oceans Canada. 2002. Towards an inshore rockfish conservation plan: a structure for continuedconsultation. Fisheries and Oceans Canada, Vancouver; 1–36.
Fisheries and Oceans Canada. 2005. Permitted fishing within Rockfish Conservation Areas. http://www.pac.dfo-mpo.gc.ca/recfish/Restricted_Areas/Rockfish_Maps_2004/permitted_fishing_e.htm
Fisheries and Oceans Canada. 2006. Georgia Strait Creel Survey } frequently asked questions. http://www.pac.dfo-mpo.gc.ca/sci/sa/Recreational/GSCS/GSCSFAQ e.htm
Foley JA, DeFried R, Asner GP, Barford C, Bonan G, Carpenter SR, Chapin FS, Coe MT, Daily GC, Gibbs HK,Helkowski JH, Holloway T, Howard EA, Kucharik CJ, Monfreda C, Patz JA, Prentice IC, Ramankutty N,Snyder PK. 2005. Global consequences of land use. Science 309: 570–574.
Folt CL, Chen CY, Moore MV, Burnaford J. 1999. Synergism and antagonism among multiple stressors. Limnologyand Oceanography 44: 864–877.
Foote AD, Osborne RW, Hoelzel AR. 2004. Whale-call response to masking boat noise. Nature 428: 910.Fossa JH, Mortensen PB, Furevik DM. 2002. The deep-water coral Lophelia pertusa in Norwegian waters: distributionand fishery impacts. Hydrobiologia 471: 1–12.
Ghilarov AM. 2000. Ecosystem functioning and intrinsic value of biodiversity. OIKOS 90: 408–412.Gibbs MT. 2004. Interactions between bivalve shellfish farms and fishery resources. Aquaculture 240: 267–296.Government of British Columbia. 2006. Alive and inseparable } British Columbia’s coastal environment: 2006.Government of British Columbia, Victoria, British Columbia; 1–322.
Government of Canada. 2002a. Canada’s Oceans Strategy. Fisheries and Oceans Canada, Oceans Directorate, Ottawa,Ontario; 1–32.
N. BAN AND J. ALDER82
Copyright # 2007 John Wiley & Sons, Ltd. Aquatic Conserv: Mar. Freshw. Ecosyst. 18: 55–85 (2008)
DOI: 10.1002/aqc

Government of Canada. 2002b. Canada’s Oceans Strategy and aboriginal peoples. Fisheries and Oceans Canada,Oceans Directorate, Ottawa, Ontario.
Government of Canada, Province of British Columbia. 1998. Marine protected areas: a strategy for Canada’s Pacificcoast } Discussion paper. Fisheries and Oceans Canada and Province of British Columbia: 1–22.
Grime JP. 1997. Biodiversity and ecosystem function: the debate deepens. Science 277: 1260–1261.Grout JA, Levings CD. 2001. Effects of acid mine drainage from an abandoned copper mine, Britannia Mines, HoweSound, British Columbia, Canada, on transplanted blue mussels (Mytilus edulis). Marine Environmental Research 51:265–288.
Hampton S, Kelly PR, Carter HR. 2003. Tank vessel operations, seabirds, and chronic oil pollution in California.Marine Ornithology 31: 29–34.
Hannah L, Lohse D, Hutchinson C, Carr JL, Lankerani A. 1994. A preliminary inventory of human disturbance ofworld ecosystems. Ambio 23: 246–250.
Hines ME, Horvat M, Faganeli J, Bonzongo J-CJ, Barkay T, Major EB, Scott KJ, Bailey EA, Warwick JJ, Lyons WB.2000. Mercury biogeochemistry in the Idrija River, Slovenia, from above the Mine into the Gulf of Trieste.Environmental Research 83: 129–139.
Hong C-B, Doi Y, Matsuda H. 2005. Numerical study on breaking phenomena of ships’ waves in narrow and shallowwaterways. Journal of Marine Science and Technology 10: 11–21.
Hughes TP, Connell JH. 1999. Multiple stressors on coral reefs: a long-term perspective. Limnology and Oceanography444: 932–940.
Huston MA. 1997. Hidden treatments in ecological experiments: re-evaluating the ecosystem function of biodiversity.Oecologia 110: 449–460.
Hutchings JA. 2000. Collapse and recovery of marine fishes. Nature 406: 882–885.Jackson JBC, Kirby MX, Berger WH, Bjorndal KA, Botsford LW, Bourque BJ, Bradbury RH, Cooke R,Erlandson J, Estes JA, Hughes TP, Kidwell S, Lange CB, Lenihan HS, Pandolfi JM, Peterson CH, Steneck RS,Tegner MJ, Warner RR. 2001. Historical overfishing and the recent collapse of coastal ecosystems. Science 293:629–637.
Jamieson GS, Levings CO. 2001. Marine protected areas in Canada } implications for both conservation and fisheriesmanagement. Canadian Journal of Fisheries and Aquatic Sciences 58: 138–157.
Jamieson GS, Chew L, Gillespie G, Robinson A, Bendell-Young L, Heath W, Bravender B, Tompkins A, Nishimura D,Doucette P. 2001. Phase 0 review of the environmental impacts of intertidal shellfish aquaculture in Baynes Sound.Canadian Science Advisory Secretariat; Ottawa, Ontario 1–104.
Je J-G, Belan T, Levings C, Koo BJ. 2004. Changes in benthic communities along a presumed pollution gradient inVancouver Harbour. Marine Environmental Research 57: 121–135.
Jessen S, Ban N. 2003. Establishing marine protected areas in British Columbia: an NGO perspective. In AquaticProtected Areas: What Works Best and How Do We Know?, Beumer JP, Grant A, Smith DC (eds). Australian Societyfor Fish Biology: Cairns, Australia; 377–387.
Kaiser MJ, Hinz H, Callaway RM, Nall A, Biles CL. 2005. Resource degradation: a subtle effect of bottom fishing.Marine Biology 146: 401–408.
Kappel CV. 2005. Losing pieces of the puzzle: threats to marine, estuarine, and diadromous species. Frontiers inEcology and the Environment 3: 275–282.
Kennish MJ. 2002. Environmental threats and environmental future of estuaries. Environmental Conservation 29:78–107.
Khan RA. 1997. Effect of sediment from two sulphite-bleaching paper mills on winter flounder (Pleuronectesamericanus) following chronic exposure. Bulletin of Environmental Contamination and Toxicology 69: 139–145.
Krkosek M, Lewis MA, Volpe JP. 2005. Transmission dynamics of parasitic sea lice from farm to wild salmon.Proceedings of the Royal Society B 272: 689–696.
Lee P, Aksenov D, Laestadius L, Nogueron R, Smith W. 2003. Canada’s Large Intact Forest Landscapes. Global ForestWatch Canada: Edmonton, Alberta.
Levings CD, Barry KL, Grout JA, Piercey GE, Marsden AD, Coombs AP, Mossop B. 2004. Effects of acid minedrainage on the estuarine food web, Britannia Beach, Howe Sound, British Columbia, Canada. Hydrobiologia 525:185–202.
Loreau M, Hector A. 2001. Partitioning selection and complementarity in biodiversity experiments. Nature 412: 72–76.Loreau M, Naeem S, Inchausti P, Bengtsson J, Grime JP, Hector A, Hooper DU, Huston MA, Raffaelli D, Schmid B,Tilman D, Wardle DA. 2001. Biodiversity and ecosystem functioning: current knowledge and future challenges.Science 294: 804–808.
Lotze HK, Milewski I. 2004. Two centuries of multiple human impacts and successive changes in a North Atlantic foodweb. Ecological Applications 14: 1428–1447.
ASSESSING INTENSITY OF ANTHROPOGENIC ACTIVITIES 83
Copyright # 2007 John Wiley & Sons, Ltd. Aquatic Conserv: Mar. Freshw. Ecosyst. 18: 55–85 (2008)
DOI: 10.1002/aqc
Lumb CM, Webster M, Golding N, Atkins SM, Vincent MA. 2004. The Irish Sea Pilot: report on collation andmapping of data. Joint Nature Conservation Committee, Peterborough; 1–88.
Macfarlane SL, Early J, Henson T, Balog T, Mcclennen A. 2000. A resource-based methodology to assess dock andpier impacts on Pleasant Bay, Massachusetts. Journal of Shellfish Research 19: 455–464.
McCann KS. 2000. The diversity–stability debate. Nature 405: 228–233.McGrady-Steed J, Harris PM, Morin PJ. 1997. Biodiversity regulates ecosystem predictability. Nature 390:162–165.
McIntyre AD. 1995. Human impact on the oceans: the 1990s and beyond. Marine Pollution Bulletin 31: 147–151.Milazzo M, Badalamenti F, Ceccherelli G, Chemello R. 2004. Boat anchoring on Posidonia oceanica beds in a marineprotected area (Italy, western Mediterranean): effect of anchor types in different anchoring stages. Journal ofExperimental Marine Biology and Ecology 299: 51–62.
Milewski I. 2000. Impacts of salmon aquaculture on the coastal environment: a review. Conservation Council of NewBrunswick, Fredericton, New Brunswick.
Moore S, Clarke JT. 2002. Potential impact of offshore human activities on grey whales (Eschrichtius robustus). Journalof Cetacean Research and Management 4: 19–25.
Myers RA, Worm B. 2003. Rapid worldwide depletion of predatory fish communities. Nature 423: 280–283.Myers RA, Worm B. 2005. Extinction, survival or recovery of large predatory fishes. Philosophical Transactions of theRoyal Society B 360: 13–20.
Naeem S. 2002. Biodiversity: biodiversity equals instability? Nature 416: 23–24.Naeem S, Li S. 1997. Biodiversity enhances ecosystem reliability. Nature 390: 507–509.Naylor RL, Goldburg RJ, Primavera JH, Kautsky N, Beveridge MCM, Clay J, Folke C, Lubchenco J, Mooney HA,Troell M. 2000. Effect of aquaculture on world fish supplies. Nature 405: 1017–1024.
Naylor RL, Williams SL, Strong DR. 2001. Aquaculture } a gateway for exotic species. Science 294: 1655–1656.Naylor RL, Eagle J, Smith WL. 2003. Salmon aquaculture in the Pacific Northwest: a global industry with localimpacts. Environment 45: 18–39.
Nelson GC, Hellerstein D. 1997. Do roads cause deforestation? Using satellite images in econometric analysis of landuse. American Journal of Agricultural Economics 79: 80–88.
Nightingale B, Simenstad CA. 2001. Overwater structures: marine issues. Washington State Transportation Center,Seattle, WA; 1–181.
Nystrom M, Folke C. 2001. Spatial resilience of coral reefs. Ecosystems 4: 406–417.Office of the Auditor General of Canada. 2005. Report of the commissioner of the environment and sustainabledevelopment to the House of Commons: Chapter 1 Fisheries and Oceans Canada } Canada’s oceans managementstrategy. Office of the Auditor General of Canada, Ottawa, Ontario.
Pauly D. 1995. Anecdotes and the shifting baseline syndrome of fisheries. Trends in Ecology and Evolution 10: 430.Pauly D, Christensen V, Dalsgaard J, Froese R, Torres F. 1998. Fishing down marine food webs. Science 279: 860–863.Pauly D, Christensen V, Guenette S, Pitcher TJ, Sumaila UR, Walters CJ, Watson R, Zeller D. 2002. Towardssustainability in world fisheries. Nature 418: 689–695.
Pauly D, Watson R, Alder J. 2005. Global trends in world fisheries: impacts on marine ecosystems and food security.Philosophical Transactions of the Royal Society B 360: 5–12.
Petchey OL, Downing AL, Mittelbach GG, Persson L, Steiner CF, Warren PH, Woodward G. 2004. Species loss andthe structure and functioning of multitrophic aquatic systems. OIKOS 104: 467–478. DOI:10.1111/j.0030-1299.2004.13257.x.
Richardson WJ, Malme B. 1995. Zones of noise influence. In Marine Mammals and Noise, Richardson WJ, Greene CR,Malme CI, Thomson DH (eds). Academic Press: San Diego, CA.
Roberts CM. 2002. Deep impact: the rising toll of fishing in the deep sea. Trends in Ecology and Evolution 17:242–245.
Roberts CM, Hawkins JP. 1999. Extinction risk in the sea. Trends in Ecology and Evolution 14: 241–246.Roberts DE, Smith A, Ajani P, Davis AR. 1998. Rapid changes in encrusting marine assemblages exposed toanthropogenic point-source pollution: a ‘beyond BACI’ approach. Marine Ecology Progress Series 163: 312–324.
Sanderson EW, Jaiteh M, Levy MA, Redford KH, Wannebo AV, Woolmer G. 2002. The human footprint and the lastof the wild. BioScience 52: 891–904.
Sanger DM, Holland AF. 2002. Evaluation of the impacts of dock structures on South Carolina estuarineenvironments. South Carolina Department of Natural Resources, Charleston, SC; 1–89.
Savage C. 2005. Tracing the influence of sewage nitrogen in a coastal ecosystem using stable nitrogen isotopes. Ambio34: 145–150.
Scheffer M, Carpenter S, Young BD. 2005. Cascading effects of overfishing marine systems. Trends in Ecology andEvolution 20: 579–581.
N. BAN AND J. ALDER84
Copyright # 2007 John Wiley & Sons, Ltd. Aquatic Conserv: Mar. Freshw. Ecosyst. 18: 55–85 (2008)
DOI: 10.1002/aqc

Schlapfer F, Schmid B. 1999. Ecosystem effects of biodiversity: a classification of hypotheses and exploration ofempirical results. Ecological Applications 9: 893–912.
Siboni N, Fine M, Bresler V, Loya Y. 2004. Coastal coal pollution increases Cd concentrations in the predatorygastropod Hexaplex trunculus and is detrimental to its health. Marine Pollution Bulletin 49: 111–118.
Solan M, Cardinale BJ, Downing AL, Engelhardt KAM, Ruesink JL, Srivastava DS. 2004. Extinction and ecosystemfunction in the marine benthos. Science 306: 1177–1180.
Stamski R. 2005. The impacts of coastal protection structures in California’s Monterey Bay National MarineSanctuary. Monterey Bay National Marine Sanctuary, NOAA, Monterey, CA; 1–26.
Stevens RL, Ekermo S. 2003. Sedimentation and erosion in connection with ship traffic, Goteborg Harbour, Sweden.Environmental Geology 43: 466–475.
Thrush SF, Dayton PK. 2002. Disturbance to marine benthic habitats by trawling and dredging: implications formarine biodiversity. Annual Review of Ecological Systems 33: 449–473.
Thrush SF, Hewitt JE, Cummings VJ, Dayton PK, Cryer M, Turner SJ, Funnell GA, Budd RG, Milburn CJ,Wilkinson MR. 1998. Disturbance of the marine benthic habitat by commercial fishing: impacts at the scale of thefishery. Ecological Applications 8: 866–879.
Tilman D. 1999. The ecological consequences of changes in biodiversity: a search for general principles. Ecology 80:1455–1474.
Tilman D. 2000. Causes, consequences and ethics of biodiversity. Nature 405: 208–211.Tilman D, Lehman CL, Bristow CE. 1998. Diversity–stability relationships: statistical inevitability or ecologicalconsequence? American Naturalist 151: 277–282.
Turner SJ, Thrush SF, Cummings VJ, Hewitt JE, Wilkinson MR, Williamson RB, Lee DJ. 1997. Changes inepifaunal assemblages in response to marina operations and boating activities. Marine Environmental Research 43:181–199.
United States Environmental Protection Agency. 2002. Cruise ship plume tracking survey report. United StatesEnvironmental Protection Agency; 1–50.
United States General Accounting Office. 2000. Marine pollution: progress made to reduce marine pollution by cruiseships, but important issues remain. United States General Accounting office, Washington, DC; 1–75.
Verity PG, Smetacek V, Smayda TJ. 2002. Status, trends and the future of the marine pelagic ecosystem. EnvironmentalConservation 29: 207–237.
Vincent ACJ, Hall H. 1996. The threatened status of marine fishes. Trends in Ecology and Evolution 11: 360–361.Vinebrooke RD, Cottingham KL, Norberg J, Scheffer M, Dodson SI, Maberly SC, Sommer U. 2004. Impacts ofmultiple stressors on biodiversity and ecosystem functioning: the role of species co-tolerance. OIKOS 104: 451–457.DOI:10.1111/j.0030-1299.2004.13255.x.
Watling L, Norse EA. 1998. Disturbance of the seabed by mobile fishing gear: a comparison to forest clearcutting.Conservation Biology 12: 1180–1197.
Watson R, Kitchingman A, Gelchu A, Pauly D. 2004. Mapping global fisheries: sharpening our focus. Fish andFisheries 5: 168–177.
Wendt PH, Van Dolah RF, Bobo MY, Mathews TD, Levisen MV. 1996. Wood preservative leachates from docks in anestuarine environment. Archives of Environmental Contamination and Toxicology 31: 24–37.
Zacharias MA, Howes JE. 1998. An analysis of marine protected areas in British Columbia, Canada, using a marineecological classification. Natural Areas Journal 18: 4–13.
Zacharias MA, Gregr EJ. 2005. Sensitivity and vulnerability in marine environments: an approach to identifyingvulnerable marine areas. Conservation Biology 19: 86–97.
Zacharias MA, Howes DE, Harper JR, Wainwright P. 1998. The British Columbia Marine Ecosystem Classification:rationale, development, and verification. Coastal Management 26: 105–124.
ASSESSING INTENSITY OF ANTHROPOGENIC ACTIVITIES 85
Copyright # 2007 John Wiley & Sons, Ltd. Aquatic Conserv: Mar. Freshw. Ecosyst. 18: 55–85 (2008)
DOI: 10.1002/aqc