Embed Size (px)
Citation preview

1
How will current health spending in Kuwait meet the demands of a changing epidemiological and demographic landscape? A study exploring ways to improve the efficiency of health spending in Kuwait.
PhD thesis
Abdullah Meshal Mubarak Abdullah A Alsabah (14036792)
UCL Institute for Global Health
2020
LONDON’S GLOBAL UNIVERSITY

2
Acknowledgements
I would like to thank my supervisors Prof. Jolene Skordis and Dr. Hassan
Haghparast-Bidgoli for their extraordinary support and help on my academic work.
Special thanks to Prof. Kholoud Porter for her invaluable moral support during the
most stressful time of my PhD journey. I owe profound gratitude to the team at
the Kuwait National Center for Health Information (NCHI) for their technical
support, especially Mr. Mustafa Alsalameen and his team for their great job of
data collection, and Dr. Ali Sadek for his help in the statistical analysis in chapter
5. Special thanks to Eugene Antipov for his assistance with the statistical analysis
of chapter 3.
I acknowledge the financial support of the Ministry of Defence in The State of
Kuwait. This work would have been impossible without their funding. Special
thanks to my colleagues at the Medical Services Authority. You supported me
greatly and were always willing to help.
I am extremely grateful to my parents for their love, caring and sacrifices for
educating and preparing me for my future. Moreover, to my caring, loving, and
supportive wife, Taiba; my deepest gratitude. Your encouragement when the
times got rough are much appreciated and duly noted. It was a great comfort and
relief to know that you were willing to provide management of our household
activities while I completed my work. My heartful thanks. I am very much thankful
to my sons, Sa’ad, Meshal and Hamad, for their love and understanding. I also
express my thanks to my brothers and sister for their valuable support.

3
Declaration
I, Abdullah Alsabah, confirm that the work in this thesis is my own. The work
contained is original, and where information has been derived from other sources,
I confirm that this has been indicated in the thesis. Also, this thesis has never
been submitted for any other degree.

4
Abstract
The increasing burden of disease in Kuwait is likely to raise demand for health funding. As current health spending is financed almost exclusively from oil revenues, the state’s ability to meet growing demand will be dependent on either growing oil revenues at the same rate, reducing spending in other sectors, rationing health service provision or improving the efficiency of health spending. As current evidence suggests that oil revenues may be declining, improvements in efficiency are likely to be sought and some prioritisation may be needed.
The overall aim of this PhD dissertation is to identify potential areas for efficiency improvement in the Kuwaiti healthcare system. Specifically, the dissertation aims to meet the following objectives:
· To review the literature on efficiency in healthcare to understand; the accepted definitions of efficiency in health care and how to measure it, the common causes of inefficiencies in healthcare and the strategies that have been used to improve healthcare efficiency.
· To assess the efficiency of secondary and tertiary public hospitals in Kuwait and to identify factors affecting their efficiency.
· To explore the perceptions of hospital managers regarding resource allocation within hospitals and within the Kuwaiti health system as a whole.
· To evaluate the preferences of health service providers and the general public regarding healthcare priority setting and resource allocation
The dissertation adopted a triangulation of quantitative and qualitative methods including literature review (Chapter 2), data envelopment analysis-DEA (Chapter 3), semi-structured interviews (Chapter 4) and analysis of a representative national survey (Chapter 5), to answer the above-mentioned objectives.
The findings of these analyses are;
· Chapter 3. Most public hospitals in Kuwait were neither technically nor scale efficient from 2010 to 2014. Potential external
5
and internal factors, that affected the efficiency of hospitals in Kuwait were identified.
· Chapter 4. The process of priority setting could be improved by accepting and implementing evidence-based, systematic processes of resource allocation, and by continuous monitoring and evaluation of the impact of health policies.
· Chapter 5. The similarities and differences in the preferences between the public and health service providers suggest that the general public may not accept common allocative efficiency improvements in public health spending, unless the challenges in this sector and the gains from reallocation are clearly understood.
These findings suggest that there is room to improve the technical and allocative efficiency of health spending in Kuwait. Decision-makers in the country should work on policy reforms to improve the efficiency and financial sustainability of the health system.

6
Impact statement
To my knowledge, this is the first thesis that attempts to evaluate the
efficiency of the Kuwait healthcare system in the light of current and future
population and economic challenges. By using different research methods, the
empirical studies included in this thesis have filled a critical gap in the literature
but would also provide areas for future academic research in the field of health
economics and health policy.
The findings of this research indicate that there is a room to improve the
technical and allocative efficiency of health spending in Kuwait, and ultimately
urges national decision makers to evaluate alternative options for priority setting
that would improve the efficiency and thus the potential sustainability of the health
system. As Kuwait shares many common features with neighboring countries, the
results of this research can be generalised to the region as a whole.
My research has captured the interest of an advisory team from the London
School of Economics and Political Science, who were commissioned by the
Kuwait Foundation for the Advancement of Sciences to assist the Supreme
Counsel for Development and Planning in Kuwait to produce a health system
review for Kuwait. The findings of this report will be used to formulate a national
health reform that would help improve the sustainability of the system.
I was also invited to participate in a discussion panel for research that
attempts to evaluate the burden of diabetes in Kuwait. Additionally, my research
encouraged the leadership in the Ministry of Health in the country to invite me to
be part of the team working on the National Health Scheme, and the leadership
in the Ministry of Defence to invite me to be part of the team in charge of improving
the medical services of the Armed Forces Hospital.

7
I have presented the findings of my thesis at numerous national and
international conferences. The findings from chapter 3 of this thesis were
presented at a joint seminar between the medical services from the Kuwaiti and
American Armies in August 2018, and at the Kuwait Health Exhibition and
Conference in April 2018. In the Middle East region, I was invited to present the
findings from two empirical studies (chapters 3 and 4) at the Gulf Cooperation
Council (GCC) PharmacoEconomic Forum in Dubai in 2017. Internationally, I
presented a study (chapter 3) at the 4th European Health Economics Association
PhD Student-Supervisor and Early Career Researcher Conference that was held
in Lausanne, Switzerland in September 2017. Due to the rarity of research activity
in this field in the region, and because of my professional relationship with several
international experts in the field of health economics and health policy, I intend to
increase my research activity in these fields, encourage others to join this
research area and contribute to health system reform in Kuwait and the wider
region.

8
Table of contents
Acknowledgements .............................................................................................. 2
Declaration ........................................................................................................... 3
Abstract ................................................................................................................ 4
Impact statement ................................................................................................. 6
Table of contents ................................................................................................. 8
Table of tables ................................................................................................... 12
Table of figures .................................................................................................. 14
Table of equations ............................................................................................. 15
Chapter 1 Introduction .................................................................................. 16
1.1 Kuwait’s healthcare system ................................................................. 16
1.2 Kuwait’s health .................................................................................... 21
1.3 Risk factors .......................................................................................... 25
1.4 Future challenges ................................................................................ 26
Chapter 2 Reviewing the literature on health systems efficiency .................. 32
2.1 Literature review methodology ............................................................ 32
2.2 What is efficiency in healthcare systems? ........................................... 33
2.3 What causes inefficiencies in healthcare systems? ............................ 33
2.3.1 Human resources ......................................................................... 35
2.3.2 Health technologies and pharmaceuticals ................................... 35
2.3.3 Hospitals ...................................................................................... 36
2.3.4 Inefficient administration .............................................................. 36
2.3.5 Leakage of health resources ........................................................ 36
2.3.6 Healthcare structure ..................................................................... 37

9
2.4 What interventions have been implemented to improve efficiency in other
contexts? ........................................................................................................ 37
2.5 The case of Kuwait .............................................................................. 39
2.6 Conclusion ........................................................................................... 40
Chapter 3 Measuring the efficiency of public hospitals in Kuwait ................. 41
3.1 Introduction .......................................................................................... 41
3.2 Methods ............................................................................................... 42
3.2.1 Study setting ................................................................................ 42
3.2.2 Efficiency concepts ...................................................................... 43
3.2.3 DEA model ................................................................................... 43
3.2.4 Two-stage DEA analysis .............................................................. 45
3.2.5 Data and variables ....................................................................... 46
3.2.6 Semi-structured interviews ........................................................... 47
3.3 Results ................................................................................................ 47
3.3.1 Descriptive results ........................................................................ 47
3.3.2 First stage DEA: efficiency results ............................................... 47
3.3.3 Second stage DEA: Results of Tobit regression analysis ............ 53
3.3.4 Qualitative interviews ................................................................... 54
3.4 Discussion ........................................................................................... 56
3.5 Limitations ........................................................................................... 59
3.6 Conclusion ........................................................................................... 60
Chapter 4 Priority setting in health care provision in Kuwait: perceptions of
hospital managers ............................................................................................. 61
4.1 Introduction .......................................................................................... 61
4.2 Methods ............................................................................................... 64

10
4.2.1 Study participants and data collection .......................................... 64
4.2.2 Data analysis ................................................................................ 65
4.2.3 Ethical approval ............................................................................ 65
4.3 Results ................................................................................................ 65
4.3.1 Current processes of setting priorities .......................................... 66
4.3.2 Strengths and weaknesses of the current process of priority setting
69
4.3.3 Strategies to improve the current process ................................... 73
4.3.4 The policy of sending patients abroad for treatment .................... 76
4.3.5 Policy of health insurance for retirees .......................................... 79
4.4 Discussion ........................................................................................... 82
4.5 Limitations ........................................................................................... 87
4.6 Conclusion ........................................................................................... 87
Chapter 5 Comparing the preferences of health service providers and
members of the public for setting healthcare priorities ...................................... 89
5.1 Introduction .......................................................................................... 89
5.2 Methodology ........................................................................................ 90
5.2.1 Available tools to evaluate preferences ....................................... 90
5.2.2 Study population and sampling .................................................... 92
5.2.3 Data collection .............................................................................. 95
5.2.4 Data management and analysis ................................................... 98
5.2.5 Ethical approval ............................................................................ 99
5.3 Results .............................................................................................. 100
5.4 Discussion ......................................................................................... 112
5.5 Limitations ......................................................................................... 119

11
5.6 Conclusion ......................................................................................... 119
Chapter 6 Conclusion ................................................................................. 120
References ...................................................................................................... 125
Appendices ...................................................................................................... 137
12
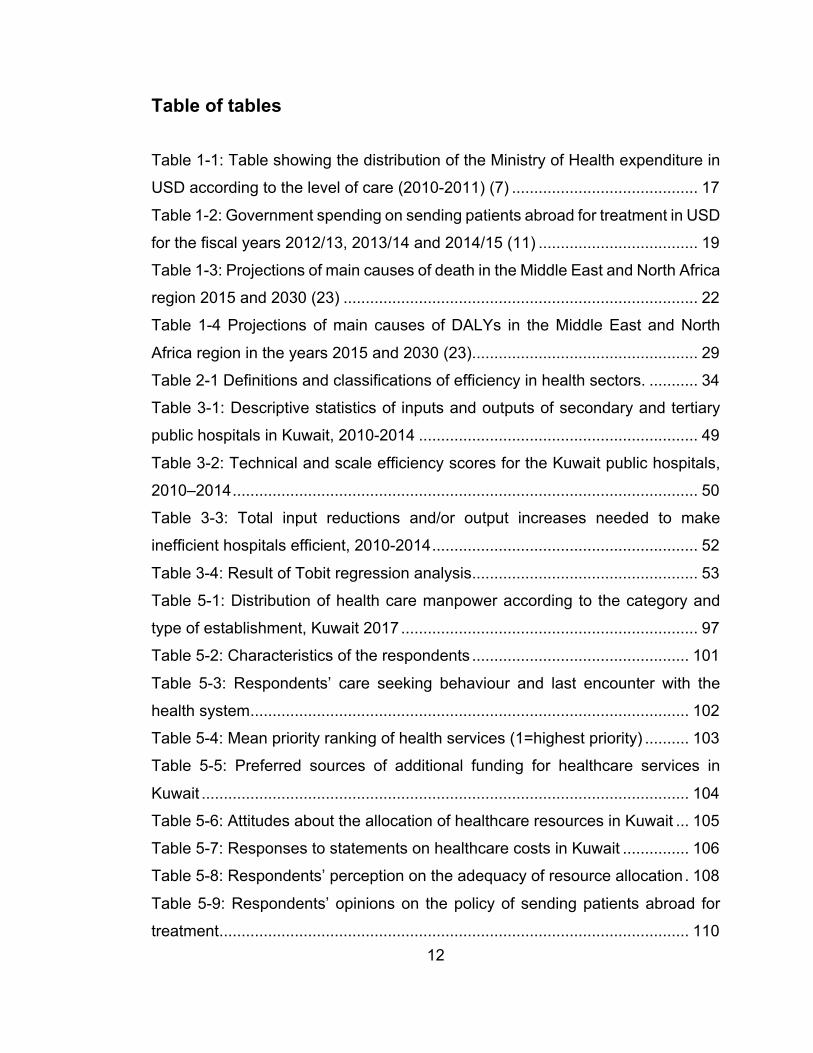
Table of tables
Table 1-1: Table showing the distribution of the Ministry of Health expenditure in
USD according to the level of care (2010-2011) (7) .......................................... 17Table 1-2: Government spending on sending patients abroad for treatment in USD
for the fiscal years 2012/13, 2013/14 and 2014/15 (11) .................................... 19Table 1-3: Projections of main causes of death in the Middle East and North Africa
region 2015 and 2030 (23) ................................................................................ 22Table 1-4 Projections of main causes of DALYs in the Middle East and North
Africa region in the years 2015 and 2030 (23) ................................................... 29Table 2-1 Definitions and classifications of efficiency in health sectors. ........... 34Table 3-1: Descriptive statistics of inputs and outputs of secondary and tertiary
public hospitals in Kuwait, 2010-2014 ............................................................... 49Table 3-2: Technical and scale efficiency scores for the Kuwait public hospitals,
2010–2014 ......................................................................................................... 50Table 3-3: Total input reductions and/or output increases needed to make
inefficient hospitals efficient, 2010-2014 ............................................................ 52Table 3-4: Result of Tobit regression analysis ................................................... 53Table 5-1: Distribution of health care manpower according to the category and
type of establishment, Kuwait 2017 ................................................................... 97Table 5-2: Characteristics of the respondents ................................................. 101Table 5-3: Respondents’ care seeking behaviour and last encounter with the
health system ................................................................................................... 102Table 5-4: Mean priority ranking of health services (1=highest priority) .......... 103Table 5-5: Preferred sources of additional funding for healthcare services in
Kuwait .............................................................................................................. 104Table 5-6: Attitudes about the allocation of healthcare resources in Kuwait ... 105Table 5-7: Responses to statements on healthcare costs in Kuwait ............... 106Table 5-8: Respondents’ perception on the adequacy of resource allocation . 108Table 5-9: Respondents’ opinions on the policy of sending patients abroad for
treatment .......................................................................................................... 110

13
Table 5-10: Respondents’ opinions on the policy of private health insurance for
retirees (Afya) .................................................................................................. 111
14
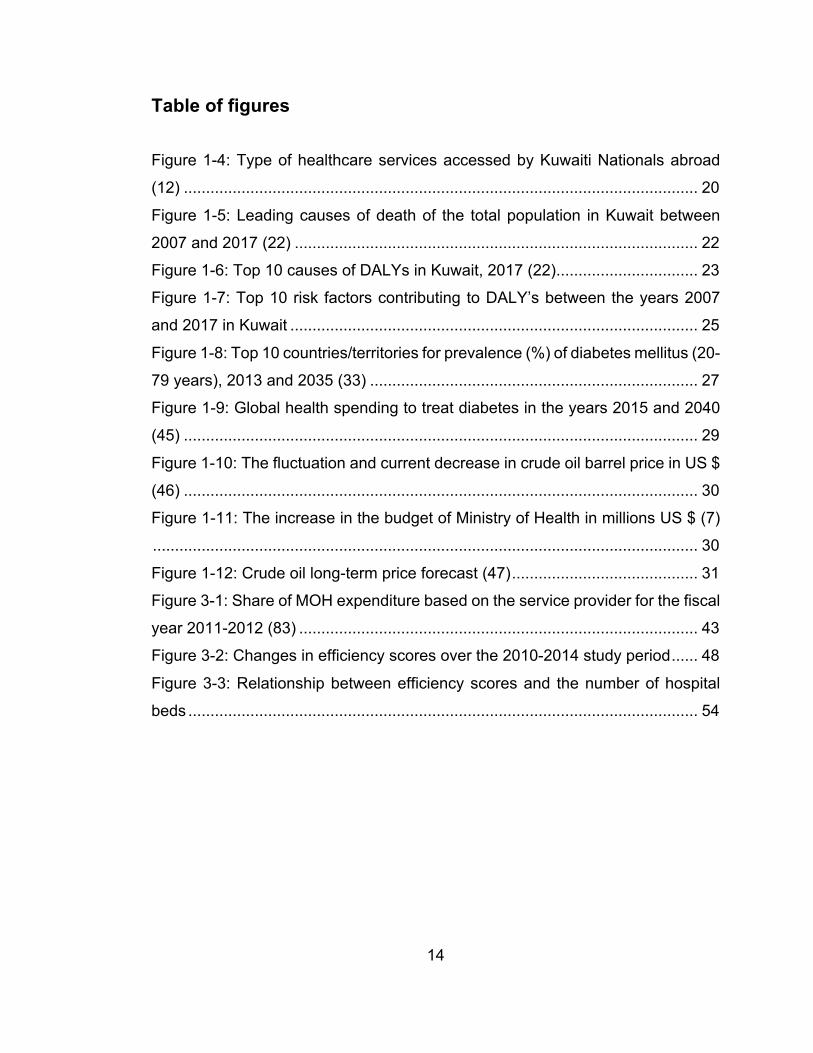
Table of figures
Figure 1-4: Type of healthcare services accessed by Kuwaiti Nationals abroad
(12) .................................................................................................................... 20Figure 1-5: Leading causes of death of the total population in Kuwait between
2007 and 2017 (22) ........................................................................................... 22Figure 1-6: Top 10 causes of DALYs in Kuwait, 2017 (22) ................................ 23Figure 1-7: Top 10 risk factors contributing to DALY’s between the years 2007
and 2017 in Kuwait ............................................................................................ 25Figure 1-8: Top 10 countries/territories for prevalence (%) of diabetes mellitus (20-
79 years), 2013 and 2035 (33) .......................................................................... 27Figure 1-9: Global health spending to treat diabetes in the years 2015 and 2040
(45) .................................................................................................................... 29Figure 1-10: The fluctuation and current decrease in crude oil barrel price in US $
(46) .................................................................................................................... 30Figure 1-11: The increase in the budget of Ministry of Health in millions US $ (7)
........................................................................................................................... 30Figure 1-12: Crude oil long-term price forecast (47) .......................................... 31Figure 3-1: Share of MOH expenditure based on the service provider for the fiscal
year 2011-2012 (83) .......................................................................................... 43Figure 3-2: Changes in efficiency scores over the 2010-2014 study period ...... 48Figure 3-3: Relationship between efficiency scores and the number of hospital
beds ................................................................................................................... 54

15
Table of equations

16
Chapter 1 Introduction
1.1 Kuwait’s healthcare system
The stated aim of the current health system in the country is to improve the health
of the people and maintain their well-being by developing access to high-quality
health programmes and preventive services (1). The Kuwaiti healthcare
infrastructure is considered to be among the most modern in the region and
despite a growing private sector, most health services are provided by the public
sector (2). Domestic general government health expenditure was 4.6% of GDP,
and 8.9% of total government expenditure in 2017 (3). Per capita health
expenditure was $1,336.2 for the same year (3). 87.4% of total health expenditure
was from the public sector, while out-of-pocket health expenditure accounted for
12.6% of total health expenditure (3). In terms of the healthcare workforce, the
number per 1000 population has increased for physicians from 2.17 to 2.5, for
nurses from 5.65 to 6.7, for dentists from 0.54 to 0.7, and for pharmacists from
0.62 to 0.7 between the years 2012 and 2017 (4).
The national health system is divided into six autonomous, decentralized
administrative units, or health areas: Capital, Hawali, Ahmadi, Jahra, Farwania
and Al Sabah (2). Each of these health areas is served with a number of primary
healthcare centres and one secondary general hospital (2). Specialized centres
located in Al-Sabah health area provide tertiary services. Table 1-1 shows
spending at different levels of the Kuwaiti healthcare delivery system. As opposed
to preventative services, the table shows that curative services in three levels of
care consume 86.88% of total the Ministry of Health (MoH) budget.
In 2014, ninety two primary healthcare centres provide the first level of care in all
six health regions (5). This number has increased since then because of the
establishment of new residential areas. Primary services include general
practitioner consultation, maternal and child healthcare, and dental services, in
addition to simple laboratory and imaging services (5, 6)

17
Table 1-1: Table showing the distribution of the Ministry of Health expenditure in USD according to the level of care (2010-2011) (7)
Expenses Value (in USD)
Percentage from total expenditure
Total curative services expenses 2,727 million 86.88% Total primary healthcare services expenses
473 million 15.07%
Total secondary healthcare services expenses
1,208 million 38.52%
Total tertiary healthcare services expenses
1,044 million 33.30%
Secondary healthcare services are provided through six general hospitals, each
with outpatient, inpatient, and emergency departments (1). The services provided
in these hospitals include internal medicine, general surgery, pediatrics,
orthopedics, traumatology, ear nose and throat (ENT), ophthalmology, psychiatry,
dermatology, physical medicine and dental services. Obstetrics and gynecology
services are only provided in three of the six hospitals (1).
Tertiary healthcare services are provided by 19 national specialized hospitals and
centres located in the Al Sabah health area. These services include maternal,
psychiatric, chest diseases, orthopedic, physical medicine and rehabilitation,
infectious diseases, oncology, allergic diseases, neurosurgery, pediatrics
surgery, renal, burns and plastic surgery, and ophthalmology services (1). All
these hospitals and centres have outpatient and inpatient departments. Other
specialized centres only provide outpatient services, including the medical
genetics center, the centre of Islamic medicine, the dermatology centre, and the
speech and hearing centre (1).
The public healthcare in Kuwait is mainly financed through oil revenue (8). In order
to deliver government-funded healthcare services, the MoH provides the Ministry
of Finance (MoF) with an estimate of the required budget on annual basis (8). The
decision whether the required budget was feasible is the responsibility of the MoF

18
and the Budget Committee in the Parliament (8). The basket of healthcare
services provided by the government are not subject to health technology
assessment (8), and the country’s purchasing function was described to be an
‘open-ended package’ by the WHO (9). The public sector has two different
budgets. The first is central, and is utilised for paying salaries for providers, and
tenders for instruments and consumables (8). The second budget gets distributed
to health regions, and is estimated by relying on the previous year’s fiscal plan
(8). Financial transfers from the MoH do not reflect the risk profile of the patients
the provider is treating because a structured plan for each separate healthcare
provider does not exist (8).
Most health services are provided in the country, but in some cases where
treatment is complicated or is not available locally, the government sends Kuwaiti
nationals overseas for treatment. This policy has been practiced since the public
health service was first established in the 1960s when not all health services were
available in the country. Currently however, the public health sector includes
adequate clinics and hospitals staffed by skilled professionals that provide safe
and effective services (5). When sending patients overseas, the government also
pays patients and their companions living allowances and flight tickets. The latest
law stated that a patient gets paid 75 KD per day (around $249), 50 KD per day
(around $166) for the first chaperone, and only flight tickets for the second
chaperone (10).
The cost of sending patients for overseas treatment comes at a substantial
expense for the Ministry of Health, and these costs have been increasing. Other
governmental authorities, such as the Ministry of Defence, the Ministry of Interior
and the Kuwait Petroleum Company, also send patients abroad for treatment.
Table 1-2 shows government spending on sending patients abroad for treatment
in three consecutive fiscal years.

19
Table 1-2: Government spending on sending patients abroad for treatment in USD for the fiscal years 2012/13, 2013/14 and 2014/15 (11)
Fiscal Year Entities
2012/13 2013/14 2014/15
Ministry of Health 379.7 million 393.8 million 1,088.0 million Ministry of Defence 132.3 million 148.0 million 263.9 million Ministry of Interior 65.6 million 65.6 million 98.5 million Royal Court 71.2 million 45.3 million 69.9 million Total 649.2 million 652.8 million 1,520.2 million
Nearly 2,300 patients are being sent overseas for different reasons annually, but
the general justification is to receive treatment that is not available in Kuwait.
Some doctors in Kuwait have complained that this is inefficient and have
advocated for building capacity in Kuwait. On the other hand, the original idea was
to increase efficiency by avoiding the costs of complex and expensive
infrastructure that would only serve a few patients. The most common
destinations for treatment include the UK (30.6%), USA (23.5%), Germany
(21.2%) and France (7.8%) (8). Figure 1-1 illustrates the various types of medical
services sought by Kuwaiti patients abroad.

20
Figure 1-1: Type of healthcare services accessed by Kuwaiti Nationals abroad (12)1
Health authorities in the country also tried to improve the overall quality of services
by increasing the involvement of the private sector in health provision (13). Of the
first steps that these authorities took was the procurement of private health
insurance on behalf of retirees. This policy is also exclusive to Kuwaiti citizens
and was issued by the parliament in 2014, the contract was signed between the
Ministry of Health and the insurance company that won the bid in July 2016, and
the provision of services for beneficiaries started in October 2016 (14). The
contract value was around $ 272.7 million for the first year, with a cost of around
$ 2,549 per person (14). Initially, the Ministry of Health expected the number of
beneficiaries to be 107,000 but the actual number that utilised this service was
114,952 (14). The service network comprises of 120 local health practices and
more than 800 doctors, providing inpatient services, chronic and specialised
outpatient services, dental services, obstetric services and others.
The country’s economic situation led the government of Kuwait to issue a six-point
economic reform policy document in March 2016 that included ‘boosting the public
sector’s efficiency’ and ‘launching administrative and institutional reforms by
1 The remaining 25% of services consists of different ‘other’ treatments.
1% 1%2% 3% 3% 3% 4%
6% 6% 7% 7%8%
23%
Dent
istry
Peds
. Car
dio
Ear,
nose
, thr
oat
Derm
atol
ogy
Neur
olog
y
Gast
roin
test
inal
Card
iova
scul
ar
Inte
rnal
med
icine
Opth
amol
ogy
Onco
logy
Gyne
colo
gy
Pedi
atric
ian
Orth
oped
ics

21
means of upgrading the efficiency of general and financial administration’ (15).
The economic situation also had a direct impact on the national health sector
where a Ministerial Decree (No. 233/2015) was issued which set out a mandate
to develop a new ‘National Strategy for Health and Health Care’ (16). Moreover,
the government recently issued a law to increase expatriate healthcare fees (Law
293 for year 2017) (8). On another note, the cost of sending patients abroad for
treatment became a source of concern for the government, given the pressure it
places on the Ministry of Health budget (nearly 15% of the MoH’s budget is spent
on overseas treatment) (16). As a result, several initiatives to limit overseas
treatment were implemented. Other initiatives included increased research and
development in Kuwait, improvement of local healthcare facilities and decreasing
daily allowances for patients and their companions (8).
1.2 Kuwait’s health
Due to socioeconomic development and the introduction of preventive
interventions such as universal immunization, the prevalence of
infectious/communicable diseases in Kuwait is low (2). The Ministry of Health
states that there have been no reported diphtheria cases since 2010, and that the
country has been free of poliomyelitis since 1990 (2). In 2017, the reported
number of all forms of tuberculosis was 986 cases (17). In 2017, 540 people were
living with HIV (18). On the other hand, significant changes in lifestyle and the
concurrent increases in sedentary living in Kuwait, have brought about several
new challenges to the healthcare system (19). In 2016, non-communicable
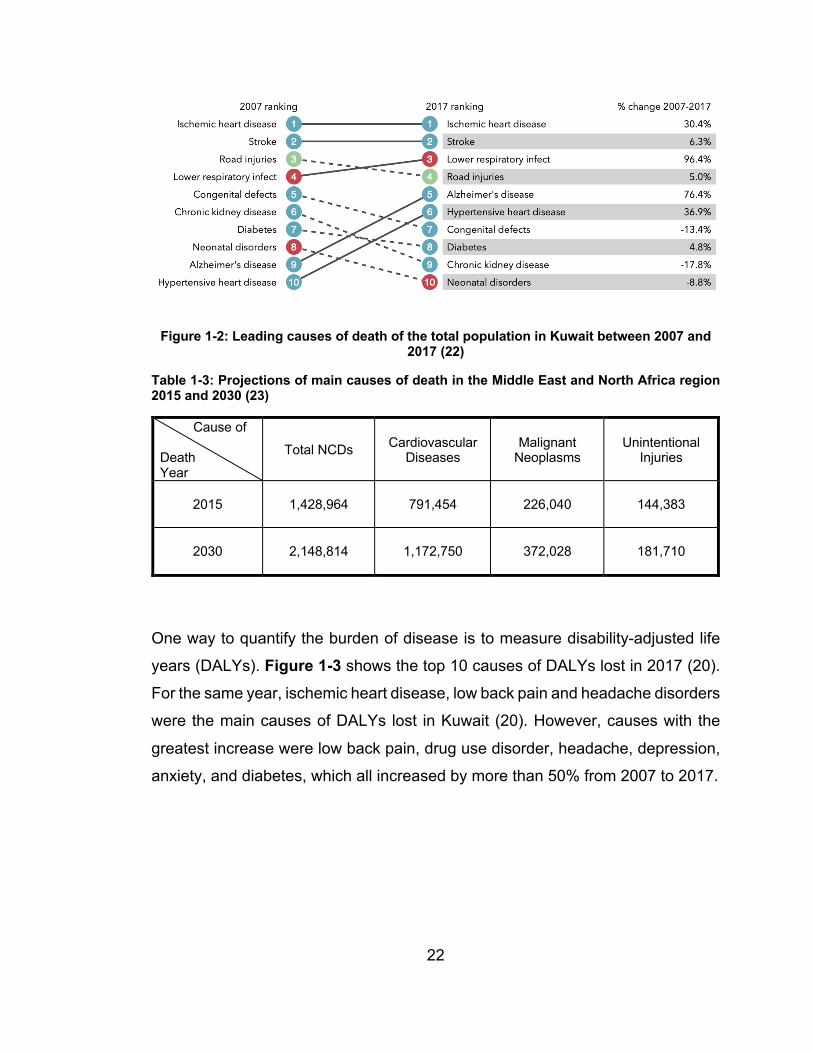
diseases (NCDs) accounted for 72.4% of total deaths in the country (3). Figure
1-2 shows the leading causes of death in Kuwait between 2007 and 2017, where
ischaemic heart disease, stroke and lower respiratory tract infections were the
main causes of death in 2017 (20). In 2013, the country’s per capita expenditure
on NCDs was $132, and the treatment of NCDs accounted for 9% of total health
expenditure for the same year (21). The WHO expects that the number of deaths
due to NCDs is going to increase in the region over the next few years (Table
1-3).
22
Figure 1-2: Leading causes of death of the total population in Kuwait between 2007 and 2017 (22)
Table 1-3: Projections of main causes of death in the Middle East and North Africa region 2015 and 2030 (23)
Cause of Death Year
Total NCDs Cardiovascular Diseases
Malignant Neoplasms
Unintentional Injuries
2015
1,428,964 791,454 226,040 144,383
2030
2,148,814 1,172,750 372,028 181,710
One way to quantify the burden of disease is to measure disability-adjusted life
years (DALYs). Figure 1-3 shows the top 10 causes of DALYs lost in 2017 (20).
For the same year, ischemic heart disease, low back pain and headache disorders
were the main causes of DALYs lost in Kuwait (20). However, causes with the
greatest increase were low back pain, drug use disorder, headache, depression,
anxiety, and diabetes, which all increased by more than 50% from 2007 to 2017.

23
Figure 1-3: Top 10 causes of DALYs in Kuwait, 2017 (22)
Mental health is another emerging challenge to the healthcare system (2). The
main mental disorders that constitute a burden on the health system are major
drug abuse, depression and anxiety (Figure 1-3), and these conditions are more
prominent among Non-Kuwaitis (2). There might be some reporting bias regarding
the previous finding because of the social stigma associated with mental health
(24, 25). Nevertheless, the high number of mental health publications by Kuwaiti
researchers may suggest an increase in the importance of this field in the current
healthcare system (26). Additionally, the Ministry of Health has documented that
a focus on mental health is one of its main objectives and that there are initiatives
to integrate it into primary and secondary healthcare (1, 2). Moreover, the WHO
(2014) has documented that the Ministry has an initiative of introducing mental
health programmes in school (2). On the other hand, the same WHO report
highlighted a concern about the use of illicit drugs and addiction since it is one of
the main burdens of disease on the system (2).
Injuries and deaths related to road traffic accidents constitute a major burden on
the current healthcare system (2).
Diabetes mellitus is another challenge that faces the healthcare system in Kuwait
(1, 2), and is closely associated with cardiovascular disease (27, 28). Kuwait is

24
among the ten countries with the world’s highest diabetes rates (29). In 2017, the
national prevalence of diabetes for individuals aging 20 to 79 was 15.1% (30). An
analysis of Kuwait Health Survey data (2013) has shown that 12.6% of females
had diabetes compared to 9.4% of men, while 13.4% of Kuwaiti nationals were
diabetic compared to 6.7% of expatriates (8). The analysis also found that
individuals with less education were more likely to have diabetes (33.33% of those
with no education have diabetes compared to 4.10% of those who had graduate
or post-graduate education) (8).
Since the prevalence of diabetes increases with age (8), Abdella et al. (31) argued
that since most people in Kuwait were below 20 years of age, projections of
diabetes prevalence rates might reach epidemic values. Additionally, as an
emphasis on the burden of this disease on the Kuwaiti healthcare system, Al-
Adsani and Abdulla (2011) have documented that 40.6% of hospitalized patients
were known to be diabetic, and that diabetics were hospitalized two to three times
more than patients with no history of diabetes (32). In 2013, it was estimated that
the cost of diabetes care in the Middle East and North Africa region was $13.6
billion, and that Kuwait has spent $1,886 on the care of each person with diabetes
(33). Recognising this as unsustainable and getting worse, the Kuwait National
Program for Healthy Living, five-year plan, focused on reducing both obesity and
diabetes (34). Metabolic syndrome is also closely related to cardiovascular
diseases, and is very prominent in Kuwait. It was found, like other countries in the
region, that the prevalence of this disease is 10-15% higher than most developed
countries(35, 36). To reduce the prevalence of diabetes, the Dasman Diabetes
Institute (DDI) was established. DDI is a not-for-profit organisation, funded by both
the public and private sectors to undertake research to inform policies that would
reduce the prevalence of diabetes (8). To accomplish this objective, DDI engages
in a variety of activities such as scientific research, awareness and preventative
campaigns, healthcare education and provision (8).

25
1.3 Risk factors
For a better understanding of the burden of disease, the risk factors of these
diseases have been identified. Figure 1-4 illustrates the top 10 risk factors
contributing to DALY’s between the years 2007 and 2017 in Kuwait. In general,
high body-mass index, dietary risks and tobacco use have been identified as the
leading risk factors for DALYs in 2017.
Figure 1-4: Top 10 risk factors contributing to DALY’s between the years 2007 and 2017 in Kuwait
Obesity rates are higher in Kuwait than in other countries (2, 37, 38). Unlike other
developed countries, women in Kuwait experienced higher rates of obesity, where
the rate of being overweight or obese was 84.3% for women and 74.5% for men
in Kuwait (39). For individuals below the age of 20 years, the rate of being
overweight or obese was 45.5% for girls and 24.6% for boys (39). Diabetes
mellitus is closely associated with obesity. It was found that 15.77% of men and
women who were obese had diabetes while 5.28% who were of normal weight
were diabetics (8). Due to the high rates of obesity in the country, a national
programme focusing on the prevention and management of weight-related issues
was developed (34).
Other identified risk factors that contributed to the high prevalence of diabetes
were an inactive lifestyle and the proliferation of fast food associated with the

26
intake of high-fat and high-energy foods (40, 41). An analysis of the Kuwait World
Health Survey data has shown that 12.27% of individuals who were insufficiently
active had diabetes compared to 8.53% of those who were sufficiently active (8).
High temperatures, limited parks and sporting facilities, and sedentary work and
school environments have contributed to the rise of such risk factors (34, 42).
Another identified risk factor contributing to DALYs in Kuwait was tobacco
smoking (20). Five years ago, around 20% of the population were smokers (1,
43), but the prevalence of smoking has increased in recent years (20).
1.4 Future challenges
Current health services in Kuwait are expected to face several challenges in the
future. With Kuwait's heavy dependence on oil revenues, the economic slowdown
caused by the COVID-19 pandemic, coinciding with low oil prices, has
exacerbated Kuwait's fiscal problems, and resulted in the government seeking to
pass a debt law that makes deficit spending easier. Such a plan assumes that the
economic difficulties are primarily based on the pandemic temporarily depressing
demand for oil. However, the prospect of oil revenues continually increasing in a
world that is coming to recognise the environmental costs of fossil fuels is not
guaranteed. Kuwait faces the possibility that it cannot continue to pay for what it
wants with loans that assume a bright future for oil. The burden of non-
communicable diseases is going to increase in the Middle East and globally,
particularly cardiovascular diseases, diabetes mellitus and mental disorders. The
Kuwaiti population over 60 years of age is expected to be 25% of the total
population by 2050 (34), and as such the prevalence of NCDs will significantly
increase. For instance, obesity in the country is expected to reach exceedingly
high levels by 2030 (29). Similarly, the prevalence of diabetes is expected to
increase in the country as well (Figure 1-5).
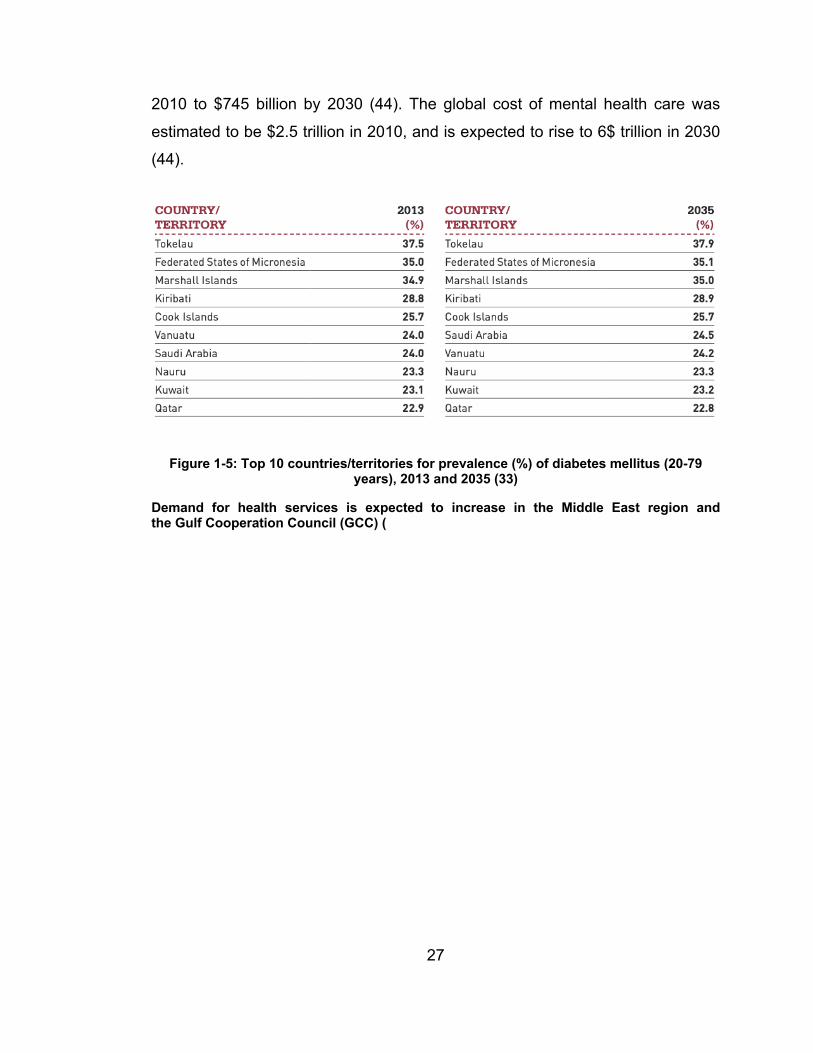
It was estimated that from 2010 to 2030, there would be a 22% increase of in the
global cost of care of cardiovascular diseases (from $863 billion to $863 billion)
(44). Global spending on diabetes is projected to increase from $500 billion in
27
2010 to $745 billion by 2030 (44). The global cost of mental health care was
estimated to be $2.5 trillion in 2010, and is expected to rise to 6$ trillion in 2030
(44).
Figure 1-5: Top 10 countries/territories for prevalence (%) of diabetes mellitus (20-79 years), 2013 and 2035 (33)
Demand for health services is expected to increase in the Middle East region and the Gulf Cooperation Council (GCC) (

28
Table 1-4). It was documented that the cost of common NCDs for GCC countries
is expected to increase from $36 billion in 2013 to $68 billion in 2022 if
governments fail to implement measures to curb the prevalence of NCDs (21). As
mentioned above, the prevalence of diabetes, as well as global health spending
to treat it, is expected to increase Figure 1-6. The International Diabetes
Federation predicts that the health expenditure due to diabetes for individuals
aged 20-79 years in the Middle East and Northern Africa region is going to
increase from $13.6 billion in 2013 to $24.7 billion in 2035 (33).

29
Table 1-4 Projections of main causes of DALYs in the Middle East and North Africa region in the years 2015 and 2030 (23)
Causes of DALY
Years
Total NCDs
Malignant Neoplasms Diabetes
Neuro-psychiatric conditions
Cardio-vascular diseases
Unintentional injuries
2015 41.07 3.34 1.25 10.99 9.18 9.8 2030 51.24 4.7 1.68 12.4 12.32 10.52
Figure 1-6: Global health spending to treat diabetes in the years 2015 and 2040 (45)
Despite the efforts of the government and social societies to raise public
awareness and education, the health burden continues to increase, which then
increases demand for health funding. As current health spending is financed
almost exclusively from oil revenues, the state’s ability to meet growing demand
will depend on either growing oil revenues at the same rate, reducing spending in
other sectors, rationing health service provision or improving the efficiency of
health spending. Current evidence suggests that oil revenues may be declining
(Figure 1-7), while the funds needed to provide health services are increasing
(Figure 1-8). Furthermore, the forecast for oil prices in the coming years does not
suggest that revenues will meet the increase in demand for health services

30
(Figure 1-9). Therefore, improvements in efficiency are likely to be sought and
some prioritisation may be needed.
Figure 1-7: The fluctuation and current decrease in crude oil barrel price in US $ (46)
Figure 1-8: The increase in the budget of Ministry of Health in millions US $ (7)

31
Figure 1-9: Crude oil long-term price forecast (47)
The overall aim of this thesis is to explore how current health spending in Kuwait
will meet the demands of a changing epidemiological and demographic
landscape. Particularly, it is to explore ways to improve the efficiency of health
spending in Kuwait in order to maximise the gains from current and future
spending, and minimise any gap between healthcare needs and service provision.
Therefore, this PhD will focus on evaluating both technical and allocative
efficiency in the current healthcare system in Kuwait, and provide
recommendations to rationally improve the efficiency of healthcare spending to
meet the future health challenges.

32
Chapter 2 Reviewing the literature on health systems efficiency
The World Health Organisation documented that health systems could do more
harm than good if they were poorly structured, badly led, inefficiently organized
and inadequately funded (48). Inefficiency means that higher health outcomes
could be achieved without spending more resources (49, 50), or that the same
level of outcome could be reached by spending less (51). It was also argued that
inefficiencies in the health sector are largely associated with high spending, rather
than poor outcomes (52).
The comprehensive literature review in this chapter aims to understand reasons
for healthcare system inefficiencies, and the main strategies used to improve the
efficiency of a health care system. It also aims to identify available research on
the efficiency of the Kuwaiti healthcare system.
2.1 Literature review methodology
To answer these questions, a literature review was carried out using the following
electronic database search; PUBMED, Web of Science, and EconLit. Google
Scholar was also used to find supporting reports. The search only included journal
articles and reports that were written in English, and were published in the year
1990 until the time of the review, which was on the 25th of May 2019. The
keywords used for this review were “efficiency”, “technical efficiency”, “allocative
efficiency”, “inefficiency”, “high spending”, and “performance” in combination with
“health”, “health system”, and “health sector”. Articles published in other academic
areas (e.g. biochemistry, environmental sciences, toxicology… etc), and articles
without authors were excluded from this literature review.
A total of 298 articles were found in PubMed, 10,220 articles in Web of Science,
2,081 in EconLit, and 29 articles/reports in Google Scholar and from reference
lists of other articles. In total, 12,628 articles were included in this first automated
step. The strategy used for the literature review is explained in appendix 1. From

33
the total number of articles found, each study was assessed again to be sure that
it addressed at least one of the following criteria:
• Explained different areas of inefficiency within a health system.
• Described main strategies for improving efficiency of a health care
system.
The titles and abstracts of all articles/reports found in the initial search were
screened to make sure that the document contained information relevant to the
proposed question. Following this second detailed screening, a total of 185
references were included in the review.
2.2 What is efficiency in healthcare systems?
Reinhardt (53) stated that generally, “to be efficient means not to be wasteful”.
Chisholm and Evans (54) explain that efficiency is “getting the most out of
something”, and also “using least inputs for a given level of output”. Table 2-1
shows the different definitions and divisions of efficiency in the health sector.
2.3 What causes inefficiencies in healthcare systems?
As with efficiency, inefficiency is divided into technical and allocative inefficiency.
The literature suggests that technical inefficiency is commonly caused by sub-
optimal or unnecessary utilization of a certain outcome, excessive hospitalization
for instance, as well as the unreasonably high cost of an intervention, heavy
reliance on certain brand-name medications for example (55). Other examples of
causes of technical inefficiency include overstaffing and the widespread waste of
resources because of poor purchasing and distribution systems (56, 57). On the
other hand, the sub-optimal mix of interventions and services currently offered
often leads to allocative inefficiency (54, 57). Also considered as an allocative
inefficiency, is the over-provision of less cost-effective interventions (56).

34
Table 2-1 Definitions and classifications of efficiency in health sectors.
General definitions “Providing such a mix of effective services at least resource cost, and on such a scale, that the benefit from having more resources is no larger than their cost” (55)
“Efficiency is concerned with the relationship between resource inputs (costs, in the form of labour, capital, or equipment) and either intermediate outputs (numbers treated, waiting time, etc.) or final health outcomes (lives saved, life years gained, quality adjusted life years (QALYs))” (49).
Efficiency divided according to level
1. macro-efficiency is a measure that shows if the total healthcare expenditures are too large or too small in relation to the benefits of healthcare (58).
2. micro-efficiency is a measure that evaluates if the service inputs being utilized are the right mix that maximize the health of the population (58).
a. production efficiency shows the relationship between inputs and outputs, and requires that services be provided at the least cost (49).
b. consumption efficiency determines whether or not the correct quantities as well as the correct mix of healthcare services are being produced and consumed (58).
Efficiency classified according to objective
1. technical efficiency: • For a given service, technical efficincy aims at maintaining the same level of quality at a lower cost or higher
quality at the same cost (59). • Conditioned on the level of inputs, technical efficiency is the relationship between observed and optimal values
of outputs (60). 2. Allocative efficiency: • Directing health funds to interventions that will optimize health gains (61). • “Organizing the optimal mix of services” (59).

35
To better understand these potential causes, inefficiency has been divided to the following
sub-sections; human resources, health technologies and pharmaceuticals, hospitals,
inefficient administration, leakage of health resources, and healthcare structure.
2.3.1 Human resources
In terms of human resources, inefficiencies can take place at any stage of the working
lifespan including inappropriate planning, ineffective training, and inadequate supervision
(54). An unqualified or unmotivated workforce leads to reduced productivity, which will
negatively affect health system goals including the provision of responsive services and
the accomplishment of health improvements in the population (54, 61).
The dominance of the medical profession in health decision-making in most health
systems is believed to be a factor of system inefficiencies, which was believed to result in
non-cost-effective allocation of resources (56, 62). Health systems are also considered
inefficient because they are described as imperfect markets, which is due partly to the
asymmetrical distribution of information in favor of the healthcare professional (62).
Another general characteristic of almost all health systems is limited supply of, and high
demand for services that would eventually lead to long waiting times (63).
2.3.2 Health technologies and pharmaceuticals
Another possible reason for inefficiency is the overuse of health technologies and
pharmaceuticals. This may, in part, result from the way that information is asymmetrically
distributed between patients and health professionals, in addition to the high incentives
for providers associated with the excessive use of such investigations and treatments (54,
62). Such supplier-induced demand is believed to increase provider’s income by the
overproduction of health services (64).
Inefficiencies have also been caused by the acceptance of some technological
procedures without appropriate evaluation (65). Also, excessive prescription of the wrong
drugs, in the wrong dosages, along with poor patient compliance were believed to
contribute to an inefficient health system (56).

36
Another reason for inefficiency in the health sector was the overdependence on branded
drugs as opposed to generic drugs, although it was proven that generics are cheaper and
had similar efficacy (54).
2.3.3 Hospitals
Hospitals, which consume more than half of the total health budget in many countries,
have different resource inputs such as buildings, health and administrative personnel,
drugs, and equipment (54, 65). Additional inefficiencies may take place in a hospital, such
as an excessive or unnecessary use of outpatient investigations or procedures (54, 64).
Another example of inefficiencies found in hospitals is the under-utilisation of services
(e.g. low utilisation of beds) (54).
Another factor that can lead to inefficiencies on a hospital-level is the hospital size.
Hospitals may show diseconomies of scale when they depart from their optimal level of
efficiency by deciding to enlarge their size (54). On the other hand, small hospitals may
also be inefficient if they have high costs because their infrastructural and administrative
costs are shared across too small caseload (54).
2.3.4 Inefficient administration
It is only logical to believe that inefficient administration leads to an inefficient health
system. In some instances, a system becomes inefficient because a large share of
financial resources is not really utilised to produce health, as the administration of the
healthcare system is so expensive (64, 66-68). An inefficient health system might be a
result of the domination of medically trained staff in the system administration (56).
2.3.5 Leakage of health resources
Leakage of health system resources, mostly in the form of fraud and corruption, was found
to be one of the reasons causing inefficiencies in a health system (54). Different forms of
corruption in the system have been identified, including: stealing from health budgets;
corruption in payment systems; corruption in the supply chain of pharmaceuticals; and
corruption of charging patients for services that are meant to be free (69). A common

37
practice that could explain such actions is when the public sector subsidizes unofficial
private practice by allowing public providers to illegally use public facilities to provide
special care to private patients (48).
2.3.6 Healthcare structure
Certain concerns about the cost and quality of care have been caused by the
fragmentation of the healthcare system across sub-sectors and weak linkages among
different healthcare divisions (70). Also, regional health inequalities may lead to an
inefficient health system. General and central hospitals usually consume the majority of
healthcare funding, which leaves district hospitals with a smaller share (56, 71). Such
practices may lead to inefficiency in health systems because it is believed that they
provide inadequate coverage of the most cost-effective measures, such as immunization
and child care, to those greatest in need, namely the rural poor, which would ultimately
affect their health status (56).
2.4 What interventions have been implemented to improve efficiency in other contexts?
More significant improvements could be achieved by health systems around the world
(48), facilitated by making health-system efficiency a priority. The need to improve the
efficiency of health services provision, manage limited public budgets, reduce disparities
in access and outcomes and simplify associated administrative and political processes
are the main drivers for many health system reforms (72).
The countries that are most concerned about improving the efficiency of their health
systems were the ones with higher levels of healthcare spending (73). The main challenge
facing most high-income countries is the pressure to improve health outcomes while
containing cost, or improving value for money (66, 72, 74, 75). So, without risking public
finances, it was argued that attaining better efficiency in healthcare would be vital to meet
quickly growing healthcare demand (66). Containing costs and better allocation of
resources could be promoted by measuring the efficiency of health services provided (72).

38
Countries attempting to improve the efficiency of their health systems have implemented
several interventions. Nevertheless, it is important to quote Joumard et al. (66) that “a
‘one-size-fits-all’ approach to reform is not advisable, at least for some policy instruments:
recommendations are clearly system dependent”. Kumar et al. (76) have argued that “the
real problem with healthcare is not a lack of money, technology, information or even
people, but the lack of an integrated system connecting these resources, that deliver a
more cost-effective care”. Additionally, for a health system reform to improve its overall
goals, it should take into account the factors that fall outside the reach of health systems,
and significantly affect its efficiency (75). It may take several years for health sector
reforms and institutional changes to have their full effect (77).
Researchers have proposed that to improve the performance of health systems, it is
necessary to come up with a unified and operational framework that identifies the
components of the health system and how these components interact (77, 78). On the
other hand, from a policy point of view, attempting to control the rising cost of healthcare
was a top priority for most countries, to an extent where cost containment became as
important as ‘access to medical care’ for public policy (63).
Technical efficiency could be increased by introducing internal markets (65, 79). Switching
from budget-based allocation to an output-based allocation could result in potential cost
savings or potential output increases of about 9.7% (79). On the other hand, in terms of
improving allocative efficiency, some researchers have proposed evaluating the cost-
effectiveness of alternative interventions (74), such as transferring funds from curative
services to preventive services, which they argued would eventually decrease the need
for curative services in the future (76, 80). For instance, it was proposed that encouraging
people to adopt a healthy lifestyle would ultimately lead to a decrease in healthcare
spending (52). Efficiency was also believed to be improved by implementing
decentralization, where local managers would be in charge of resource consequences of
their actions, and by giving them some autonomy and ability to improve their performance
(56, 72). Providing more cost-effective interventions to more people and fewer low cost-
effective interventions would lead to better efficiency of a health system (56). Significant

39
budgetary saving could be generated by introducing performance-based payments
instead of capacity-based payments, by decreasing the hospital length of stay for example
(52). Furthermore, creating financial incentives for good performers could lead to an
improvement in the quality of healthcare, and eventually to the efficiency of the system
(48, 74, 76, 81).
There were several reforms to control healthcare budget introduced in the literature.
Putting budget constraints by imposing caps on health spending, using regulations of
prices paid by third-party payers and of the health workforce and equipment, and setting
priorities were among the strategies recommended to control healthcare spending (66).
Some researchers have argued that demand for healthcare spending could be contained,
and significant budgetary savings could be generated, by introducing out-of-pocket
payment in healthcare, but this resulted in unintended inequity effects (52). Alternatively,
to decrease the many consultations, or to contain spending in the in-patient sector, gate-
keeping could be introduced (66).
There was emphasis on improving the supply and use of medications when attempting to
improve the efficiency of a health system (56). Demand for pharmaceuticals could be
restrained by increasing the share paid by consumers, and by introducing competition
amongst producers, but this also had a negative unintended effect on equity (52).
Additionally, encouraging the prescription of generic substitutes would reduce spending
on medication (52).
2.5 The case of Kuwait
Limited research has been done in the field of healthcare efficiency in Kuwait. With the
exception of the paper ‘Assessing the cost of inefficiencies: The case of the public health
care system in Kuwait’ by Burney et al. (58) in 1999, no other research was found that
attempted to shed the light on the issue of health system efficiency in the country. The
study found that there were relative inefficiencies in the production of health services in
the country at that time, specifically in the excessive supply of beds and nurses (58).

40
In a Kuwait Health System Review report presented by Mossialos et al. (8), other areas
of inefficiency in the health system were highlighted. Of these areas was the lack of long-
term strategic plicies, which was due to the frequent changes of the Ministers of Health,
and that key decision makers in the health sector rarely have experience in health policy,
health management, health economics and/or public health (8). They also believed that
the public sector was not efficient because the government was the sole regulator, as well
as primary funder and service provider (8). Additionally, sophisticated, hence more
efficient, methods of financing healthcare are not utilised in the country (8).
2.6 Conclusion
In this review, different definitions of health system efficiency and various causes of
inefficiencies in health systems were discussed. Additionally, common interventions that
were implemented by several governments to improve the efficiency of their system were
highlighted. In spite of the limited research, evidence has shown that there are areas of
inefficiency in the Kuwaiti healthcare system. As discussed in chapter one, with the current
changes in the situation of the country comes the necessity to economically evaluate the
efficiency of the current healthcare system, highlighting the areas of inefficiency and ways
to improve them.

41
Chapter 3 Measuring the efficiency of public hospitals in Kuwait2
3.1 Introduction
In 1962, the Constitution of the State of Kuwait was implemented, which included Articles
11 and 15 ensuring health provision (82). In accordance with the above-mentioned
articles, a ‘Health for All’ policy was adopted by the government to provide access to
comprehensive and high-level quality health services for all (83).
A drop in oil revenues coincident with a faltering economy due to the COVID-19 pandemic,
and a rapid increase in health expenditure in the country, due to increased demand for
services, have created a challenging situation (8). The increase in healthcare demand has
been attributed to multiple factors, including an increase in the total population in the
country from about 1.6 million in 1995 to 4.1 million in 2017, as well as an increase in the
total life expectancy at birth from 72.7 to 74.8 for the same years (84). Additionally, the
increase in demand for advanced services is believed to be the result of growing health
awareness (83). In response to these challenges, the government of Kuwait issued a six-
point economic reform policy document in March 2016 that included ‘boosting the public
sector’s efficiency’ and ‘launching administrative and institutional reforms by means of
upgrading the efficiency of general and financial administration’ (15).
Providing sustainable healthcare financing is a challenge for many countries facing
increasing demand for healthcare services and cost inflation of these services (85). Since
hospitals consume a large portion of the health care budget, as mentioned in chapter 2,
with diverse resource inputs, the focus of health decision-makers is often drawn to the
efficiency of these facilities to rationally distribute human and capital resources (54, 65,
85). Many researchers have evaluated the technical efficiency of hospitals in Europe (86-
91), North America (92, 93), Asia (85, 94-99), and Africa (100-106). In Kuwait, as
previously mentioned in chapter 2, only one article was found that attempted to measure
2 This chapter was published in The Global Journal of Health Science: Alsabah, Haghparast-Bidgoli and Skordis (2020), Measuring the efficiency of public hospitals in Kuwait: A two-stage data envelopment analysis and a qualitative survey study, Global Journal of Health Science. 2020; 12 (3).

42
the efficiency of public health care and the cost associated with its inefficiencies. That
article was published in 1999 (58).
This study aims to measure the technical and scale efficiencies of secondary and tertiary
public hospitals in Kuwait for the period 2010 to 2014, using a data envelopment analysis
(DEA) approach. This study also aims to identify the factors affecting the efficiency of
hospitals and is intended to provide decision-makers in the Kuwaiti health sector with
useful information to develop strategies for improving public hospital efficiency.
In Kuwait, the share of total health expenditure from gross domestic product (GDP) has
increased from 2.5% in 2000 to 3.9% in 2016 and public health expenditure as a
percentage of total government expenditure increased from 5.2% in 2000 to 6.2% in 2016
(84). But a substantial change was apparent in the increase in the per capita health
expenditure, which increased from $462.6 per capita in 2000 to $1,068.3 per capita in
2016. In the fiscal year 2011-2012, total health expenditure was around 1.8 billion Kuwaiti
Dinars (KD) (around USD$5.9 billion). In that period, government expenditure on health
made up 82% of the total health expenditure, while out-of-pocket was 16% of the total
health expenditure in the country (83). More recently, public health expenditure made up
83.9% of total health expenditure in 2016, making the State the biggest healthcare
provider in the country (84).
3.2 Methods
3.2.1 Study setting
Health services provided by the Ministry of Health (MoH) are divided into three main
levels: primary, secondary and tertiary care. In addition to these, the MoH also provides
other services such as dental health, occupational medicine, preventative medicine,
treatment abroad and services during the Hajj season (83). Figure 3-1 describes MoH
spending.

43
Figure 3-1: Share of MOH expenditure based on the service provider for the fiscal year 2011-2012 (83)
More than 60% of MoH resources are consumed by secondary and tertiary healthcare
providers (Figure 3-1). Secondary healthcare providers consist of six general hospitals
with outpatient, inpatient and emergency departments. Each of these hospitals provides
medical services to the people living in the governorate that these facilities serve.
3.2.2 Efficiency concepts
Farrell (107) explains that a hospital is technically efficient if it was producing a certain
level of outputs with the least inputs, or if it was producing the maximum level of outputs
with a certain level of inputs, and this efficiency concept is the base of the current study.
Mangusson (88) argued that evaluating the technical efficiency of hospitals allows the
comparison of their real use of inputs and outputs rather than costs and ‘profits’. Hospitals’
outputs must be clearly identified in order to measure their efficiency. Potential outputs
can be number of outpatient visits, number of surgical interventions, number of patient-
days, bed turnover and bed occupancy, among others (108).
3.2.3 DEA model
DEA is the most frequently used technique for measuring the efficiency of a health system
as a whole, or of smaller units within a health system such as hospitals (109-111). It is a
non-parametric approach that uses a linear programming technique for analysing the

44
relative efficiencies of individual Decision-Making Units (DMUs) with respect to multiple
inputs and outputs (109, 112-116).
DEA has several benefits, including its capacity to measure technical efficiency (117). It
is also characterised by its ability to deal with multiple outputs and multiple inputs easily
(110, 118-122), even if they were heterogeneous (85). Additionally, it has the advantage
of the simplicity underlying this approach in terms of not having prior or complicated
standard assumptions as is the case with statistical regression analysis (85, 118, 119). It
can, furthermore, provide useful information for developing strategies to eliminate areas
of inefficiency (121).
DEA does also have disadvantages. It cannot take into account socioeconomic and
environmental factors when measuring technical efficiency of DMUs (50, 123), and can
only analyse the efficiency of homogeneous units (121). Additionally, it is desirable to have
a large sample when applying this method because it is sensitive to sample size (105,
123). The inability to differentiate true inefficiency from random variation is another
disadvantage of DEA (121, 122, 124). This approach is also sensitive to high-performing
outliers, so the efficiency frontier may change if such outliers were not detected (125).
Using the model developed by Charnes, Cooper, and Rhodes (called the CCR-model)
(126), multiple output and input variables are incorporated to measure technical efficiency
of a DMU in relation to other DMUs (102). The calculated relative hospital efficiency scores
fall between 0, completely inefficient, and 1, being completely efficient. There are two
programming models to calculate technical efficiency, under the assumption of constant
returns to scale (CRS in model 1) and variable returns to scale (VRS in model 2) (102).
The model used in this study is an input-oriented model, which was developed by Banker
et al. (127), where an inefficient unit is made efficient through the proportional reduction
of its inputs while its output proportions are held constant. It is possible, by using this
model, to assess whether a hospital is producing on an optimal scale, which is known as
scale efficiency (94, 102). This model allows for the division of total technical efficiency

45
(CRS) to pure technical efficiency (VRS) and scale efficiency (94). According to Coelli
(128), the scale efficiency score is equal to the CRS technical efficiency (TE) score divided
by the VRS technical efficiency (TE) score. The degree to which a hospital is producing
at an optimal scale is, on the other hand, known as scale efficiency (94). Technical
efficiency that is not attributable to departures from optimal scale and is related to
operation is known as pure technical efficiency or managerial efficiency (94). It is believed
that hospital managers have more control in altering the level of inputs rather than outputs,
and this is one of the justifications for choosing the input-oriented model (94, 129).
Equation
where (102)
Yrj is the amount of output r produced by hospital j, x i j is the amount of input i used by hospital j, ur is the weight given to output r, (r = 1,…, t and t is the number of outputs)
v i is the weight given to input i, (i = 1,…, m and m is the number of inputs)
n is the number of hospitals,
j0 is the hospital under assessment.
3.2.4 Two-stage DEA analysis
In order to identify the potential factors affecting the technical efficiency of the hospitals,
a second stage was added to this study. In this second stage, a regression analysis was
performed, in which hospital efficiency scores from the first stage were used as dependent
variables and a number of institutional factors were used as independent variables.
Independent variables were selected on the basis of the literature review, the context of

46
study and availability of data. The efficiency scores calculated in the first stage were
regressed against these variables using Tobit regression analysis. This analysis model,
known as censor regression, is widely used in two-stage DEA since the scores have only
a positive probability of attaining one of the two corner values (between 0 and 1), and is
believed to be sufficient in regressing efficiency scores against exogenous variables
(130).
Both stages of DEA analyses were conducted using Stata version 14 (StataCorp, College
Station, Texas 77845 USA) by Eugene Antipov.
3.2.5 Data and variables
The data for this study was obtained from the ‘Health, Kuwait’ annual report published by
the MoH’s Department of Statistics. The analysis will include data from 2010 to 2014
relating to a total of fifteen hospitals; six general hospitals at the secondary level and nine
specialized hospitals at the tertiary level. The Center for Palliative Care and the Urology
Center were not included in the analysis due to a lack of data for the study period.
Additionally, some specialized centers were excluded from the sample because they only
provided outpatient services and were therefore not comparable DMUs.
Based on the use of similar variables in other studies (96, 98, 100, 106, 110, 131) and the
availability of local data, four input- and two output-variables were selected for the first
stage DEA. Input variables included the number of beds (which is usually used as a proxy
for capital inputs in hospital efficiency studies (87, 131)) and three human resources inputs
including total number of doctors, nurses, and non-medical workers. Output variables
were total outpatient visits and total number of discharges (a proxy for admissions).
Hospital size (i.e. total number of beds), bed occupancy rate, average length of stay and
hospital type (general or specialised) were the independent variables used in the second
stage of the analysis. These institutional variables were chosen based on the data
availability and the evidence from the previous studies (85, 87, 95, 98, 132).

47
3.2.6 Semi-structured interviews
To better understand potential factors affecting hospital efficiency in Kuwait, qualitative
semi-structured interviews were conducted between mid-April to mid-July 2017, with 14
hospital managers from the public, private and military sectors (more details on the
interviews will be presented in chapter 4). Participants received information sheets that
explained the objectives of the study, and provided written informed consent to participate.
They were asked open-ended questions about the meaning of hospital efficiency; factors
they believe would affect hospital efficiency; and the steps they would take to improve the
efficiency of their hospitals. The data were analysed using thematic analysis to identify
overall themes and patterns.
3.3 Results
3.3.1 Descriptive results
Table 3-1 provides a summary statistics of input and output variables of secondary and
tertiary level hospitals in Kuwait for the years 2010 to 2014. On average, number of beds,
doctors, nurses, non-medical workers, outpatient clinics visits, and number of discharges
for the whole period of the study and for all hospitals were 444, 307, 853, 603, 182,057,
and 14,534 respectively.
3.3.2 First stage DEA: efficiency results
Table 3-2 presents the DEA results. Three hospitals (20%), which were all tertiary level
hospitals, were constantly technical and scale efficient for the whole period. The mean
technical efficiency score was 86% over the study period, and it improved by 2% since
2010. The mean pure technical efficiency score was around 80%, which improved from
75% in 2010 to 81% in 2014. Figure 3-2 shows the changes of efficiency scores during
the period 2010-2014.

48
Figure 3-2: Changes in efficiency scores over the 2010-2014 study period
In 2010, 2011, 2012, 2013 and 2014, out of the 15 hospitals, approximately six (40%),
seven (47%), seven (47%), eight (53%) and eight (53%) hospitals respectively had a
technical efficiency score of 1 (fully efficient). The average pure or managerial technical
efficiency (VRS) scores were 84%, 86%, 87%, 87% and 86% respectively during the five
years under consideration. This finding implies that if the hospitals were operating
efficiently, they could have produced 16%, 14%, 13%, 13% and 14% more output using
their current levels of input, or could produce their current levels of output with 16%, 14%,
13%, 13% and 14% reductions in their existing inputs.
The mean scale efficiency score was 92%, which improved from 88% in 2010 to 94% in
2014. Based on the analysis of scale efficiency, it can be illustrated that in period of 2010-
1014: four (27%), six (40%), five (33%), eight (53%) and six (40%) hospitals displayed
constant returns to scale, which means that they were operating at their most productive
scale sizes. The average scale efficiency score in the sample was 86% in 2010, 92% in
2011, 90% in 2012, 95% in 2013 and 94% in 2014.

49
Table 3-1: Descriptive statistics of inputs and outputs of secondary and tertiary public hospitals in Kuwait, 2010-2014
Beds Doctors Nurses Non-medical workers
Outpatient visits
Number of discharges
2010 Median 416 196 656 484 168944 12144 Mean 423 268 800 579 152992 14361 STDEV 257 205 511 295 99026 12715
2011 Median 418 205 718 501 165387 12118 Mean 447 281 834 590 162185 14444 STDEV 271 219 522 299 105728 12664
2012 Median 409 219 715 505 160287 12087 Mean 448 297 845 603 166341 14405 STDEV 270 236 538 310 115437 12946
2013 Median 408 231 729 509 181270 12267 Mean 450 330 852 620 215564 14735 STDEV 277 274 551 317 158991 13399
2014 Median 418 263 765 503 164904 12073 Mean 453 359 933 622 213202 14727 STDEV 281 289 605 326 163647 13243
Average Median 414 223 717 500 168158 12138 Mean 444 307 853 603 182057 14534 STDEV 271 245 545 309 128566 12993

50
Table 3-2: Technical and scale efficiency scores for the Kuwait public hospitals, 2010–2014
Hospital name 2010 2011 2012 2013 2014
CRS VRS Scale CRS VRS Scale CRS VRS Scale CRS VRS Scale CRS VRS Scale
Sabah 0.795 0.832 0.956 0.813 0.845 0.962 0.755 0.788 0.959 0.783 0.795 0.985 0.781 0.860 0.908 Amiri 0.767 0.832 0.922 0.901 0.926 0.973 0.898 0.903 0.994 0.873 0.894 0.977 0.829 0.871 0.952
Mubarak Alkabeer 0.754 0.832 0.906 0.864 0.892 0.968 0.841 0.909 0.925 0.810 0.850 0.953 0.772 0.804 0.961 Farwaniya 0.994 1.000 0.994 1.000 1.000 1.000 1.000 1.000 1.000 1.000 1.000 1.000 1.000 1.000 1.000 Adan 0.912 0.960 0.950 1.000 1.000 1.000 1.000 1.000 1.000 1.000 1.000 1.000 1.000 1.000 1.000 Jahra 1.000 1.000 1.000 1.000 1.000 1.000 0.991 1.000 0.991 1.000 1.000 1.000 0.929 1.000 0.929 Al-Razi 0.657 0.677 0.970 0.628 0.683 0.920 0.654 0.727 0.900 0.543 0.543 1.000 0.543 0.555 0.979 Physical Medicine and Rehabilitation
0.321 0.696 0.461 0.269 0.686 0.392 0.364 0.854 0.427 1.000 1.000 1.000 1.000 1.000 1.000 Maternity 1.000 1.000 1.000 1.000 1.000 1.000 1.000 1.000 1.000 1.000 1.000 1.000 1.000 1.000 1.000 Chest Diseases 0.615 0.726 0.847 0.635 0.705 0.900 0.583 0.664 0.878 0.581 0.628 0.926 0.668 0.674 0.992 Infectious Diseases 0.659 1.000 0.659 0.994 1.000 0.994 0.683 1.000 0.683 0.864 1.000 0.864 0.626 1.000 0.626 Psychological Medicine 0.411 0.552 0.745 0.518 0.598 0.866 0.541 0.669 0.808 0.532 0.630 0.845 0.601 0.625 0.961 Ibn Sina 1.000 1.000 1.000 1.000 1.000 1.000 1.000 1.000 1.000 1.000 1.000 1.000 1.000 1.000 1.000 Kuwait Cancer Control Center 0.367 0.504 0.728 0.415 0.498 0.833 0.443 0.501 0.884 0.482 0.640 0.754 0.430 0.524 0.820 Kuwait Allergy Center 1.000 1.000 1.000 1.000 1.000 1.000 1.000 1.000 1.000 1.000 1.000 1.000 1.000 1.000 1.000 Mean 0.750 0.841 0.876 0.802 0.856 0.920 0.784 0.868 0.897 0.831 0.865 0.953 0.812 0.861 0.942 Median 0.767 0.832 0.950 0.901 0.926 0.973 0.841 0.909 0.959 0.873 1.000 1.000 0.829 1.000 0.979 Standard deviation 0.24 0.17 0.16 0.25 0.17 0.16 0.23 0.16 0.16 0.2 0.17 0.08 0.2 0.18 0.1 Coefficient of variation, % 32.2 20.7 18.3 30.9 20.4 16.9 28.8 18.7 17.7 24.1 20 7.89 24.3 21 10.7
Note: CRS=constant returns to scale technical efficiency (overall technical efficiency); VRS=variable returns to scale technical efficiency (pure technical
efficiency); Scale=scale efficiency
51
Hospitals in Kuwait are already operating at a high and increasing level of
efficiency but the opportunity for further efficiency gains exists in this context.
Table 3-3 illustrates the total amount of input reductions and/or output increases
needed to make less efficient hospitals fully efficient for the years 2010-2014. In
2010, the less efficient hospitals combined had 765 (19.1%) more doctors than
needed to be efficient, which was the largest percentage among all variables in
the study. For the same year, hospitals could be more technically efficient if they
were able to decrease their input levels by 7.9% fewer beds, 9.2% fewer nurses
and 5.3% fewer non-medical workers, while holding their level of outputs constant.
Alternatively, an increase of 12.5% in outpatient visits and 0.3% in discharges -
while keeping inputs constant - would improve efficiency for the same year. In
2014 on the other hand, a reduction of 8.9% in the number of beds, 9.7% in the
number of doctors, 8.2% in the number of nurses and 7.1% in the number of non-
medical staff would be required to reach full technically efficiency - while keeping
the level of outputs constant. Alternatively, for the same year, the level of output
increase required to make hospitals efficient would be 6.2% in outpatient visits,
while utilizing the same level of inputs.
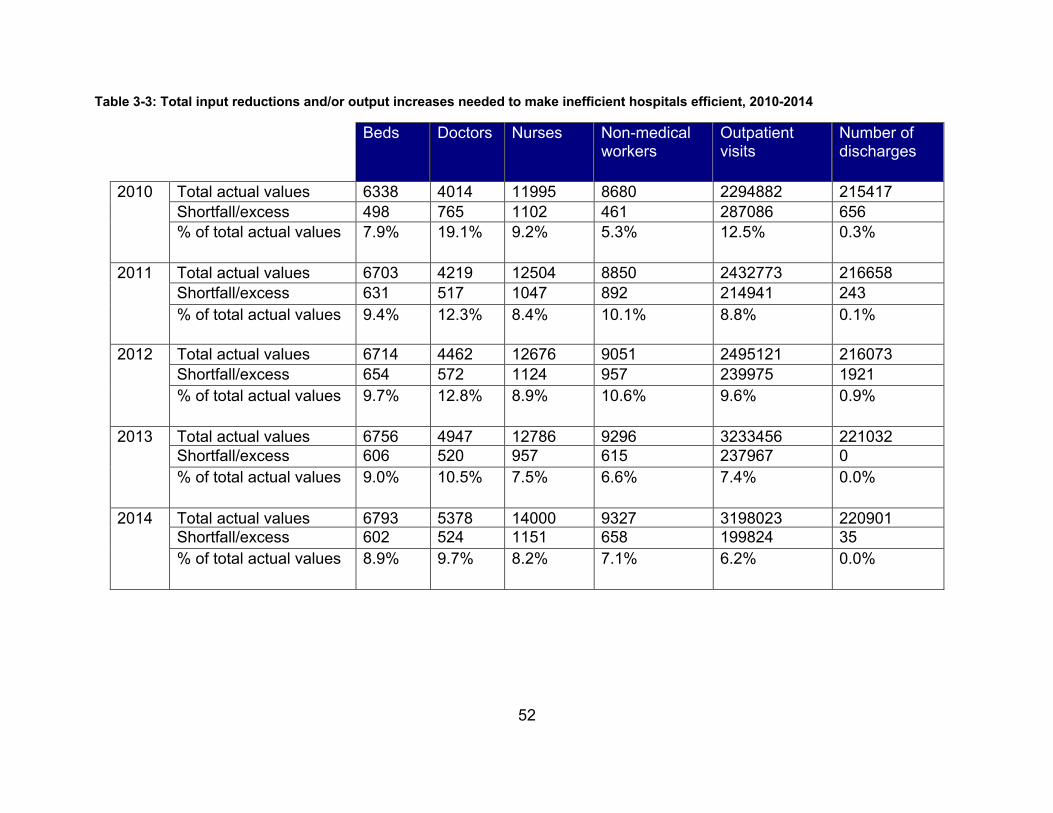
52
Table 3-3: Total input reductions and/or output increases needed to make inefficient hospitals efficient, 2010-2014
Beds Doctors Nurses Non-medical workers
Outpatient visits
Number of discharges
2010 Total actual values 6338 4014 11995 8680 2294882 215417 Shortfall/excess 498 765 1102 461 287086 656 % of total actual values 7.9% 19.1% 9.2% 5.3% 12.5% 0.3%
2011 Total actual values 6703 4219 12504 8850 2432773 216658 Shortfall/excess 631 517 1047 892 214941 243 % of total actual values 9.4% 12.3% 8.4% 10.1% 8.8% 0.1%
2012 Total actual values 6714 4462 12676 9051 2495121 216073 Shortfall/excess 654 572 1124 957 239975 1921 % of total actual values 9.7% 12.8% 8.9% 10.6% 9.6% 0.9%
2013 Total actual values 6756 4947 12786 9296 3233456 221032 Shortfall/excess 606 520 957 615 237967 0 % of total actual values 9.0% 10.5% 7.5% 6.6% 7.4% 0.0%
2014 Total actual values 6793 5378 14000 9327 3198023 220901 Shortfall/excess 602 524 1151 658 199824 35 % of total actual values 8.9% 9.7% 8.2% 7.1% 6.2% 0.0%

53
3.3.3 Second stage DEA: Results of Tobit regression analysis
At the second stage of the DEA, technical efficiency scores estimated at the first stage
were regressed against a group of hospital-level variables, including type of hospital
(general or specialized), number of beds, bed occupancy rate and average length of stay,
in order to determine the factors affected the technical efficiency of the hospitals. Table
3-4 shows the results of the regression analysis. The results show that the average length
of stay is a significant determinant of hospital technical efficiency; indicating that the higher
the average length of stay, the lower overall (CRS) technical efficiency (p<0.05) and lower
scale efficiency (p<0.001). A higher number of beds was also found to be associated with
higher scale efficiency (p<0.05).
Table 3-4: Result of Tobit regression analysis
(1) (2) (3) CRS TE VRS TE Scale
Tertiary -0.0654 -0.126 0.0638 (0.0989) (0.0927) (0.0543) Number of beds 0.000212 0.000152 0.000207**
(0.000180) (0.000172) (0.0000970) Bed occupancy rate, %
-0.00161 -0.00768** 0.00168
(0.00258) (0.00291) (0.00141) Average length of stay, days
-0.00480** -0.000727 -0.00509***
(0.00208) (0.00196) (0.00114) Constant 0.971*** 1.421*** 0.807*** (0.174) (0.193) (0.0949) N 75 75 75 Pseudo R2 0.221 0.227 0.474 χ2 16.23 15.21 27.23 p-value 0.003 0.004 0.000
Moreover, we explored the relationship between efficiency scores and hospital size, in
terms of the number of beds (Figure 3-3). The results show that larger hospitals (with
more than 400 beds) are generally more technically and scale efficient.
Standard errors in parentheses * p < 0.1, ** p < 0.05, *** p < 0.01

54
Figure 3-3: Relationship between efficiency scores and the number of hospital beds
3.3.4 Qualitative interviews
To better understand the potential factors affecting efficiency of the hospital in the context
of Kuwait, qualitative semi-structured interviews were conducted with 14 hospital
managers from public, private and military sectors. More details on the inclusion of
participants is found in chapter 4, and a detailed description of the participants’
characteristics is presented in Appendix 2.
Participants expressed their perception of factors affecting the efficiency of their hospitals
as well as factors that would help in improving hospital efficiency. The factors reported by
participants can be grouped into two broad categories: External and internal factors.
External factors include the presence of a national strategic health plan, legislative
changes, bureaucracy in the system and autonomy of hospitals/hospitals’ managers,
provider payment mechanisms (mainly salary), and communications between hospitals.
Internal factors include bed capacity, qualifications and training of human resources,
procurement and utilisation of equipment, the use of health information system (HIS), and
the accountability of staff and users.

55
3.3.4.1 External factors
Participants perceived several external factors that effect hospital efficiency. Among
these, most participants mentioned that the presence and dissemination of a national
strategic plan with clear vision and objectives would improve the efficiency of hospitals.
Participants from public hospitals in particular were frustrated by the limited level of control
over resource allocation, as most decisions were centralised at the level of the Ministry of
Health. Several public hospital participants mentioned that legislative changes are
required to improve their efficiency. Many participants have expressed the need to change
these regulations to give them greater ability to hire and fire according to needs, and to
be able to motivate their outstanding employees with incentives. The length of the
bureaucratic cycle is believed to lower the efficiency of public hospitals. In the case of
private hospitals, they have explained that it took them a long time to get health
professionals a work permit, if they were expatriates, because the process at the ministry
is so slow. Some participants thought that moving away from the current fixed-salary
system to a pay-for-performance system would lead to an increase in the level of
efficiency, which again, would call for legislative action.
3.3.4.2 Internal factors
Participants believed that the efficiency of hospitals could be affected by internal factors
as well. Most participants have expressed that the availability of timely and accurate data
would have a positive effect on efficiency. Also, there was a general belief that the bed
capacity is directly related to efficiency (the higher the number of beds would lead to higher
efficiency). They have also emphasised on the importance of human resources. For
instance, a general finding was that there is shortage in professional manpower, such as
physicians, and that this shortage is exacerbated by bureaucratic red-tape and delays in
getting visas. Additionally, the development of managerial and leadership skills of health
administrators was believed to be highly influential to the efficiency of a hospital. Some
participants emphasised a need for improvement for non-professional employees. In
terms of equipment, it was explained that the availability of funds to purchase them would

56
affect the efficiency. Additionally, some participants described that monitoring the
utilisation of equipment as well as the ability to introduce new services would also affect
efficiency. There was a general belief that having more autonomy and more control over
the hospital budget would have a positive effect on hospital efficiency. Some participants
explained that there might be a conflict between the vision of administrative staff, which is
usually focused on increasing efficiency, and the vision of clinical staff, which is usually
focused on improving quality. Both visions are important, especially in times of increasing
costs and falling revenues, but the main goal of the healthcare sector is to improve the
nation's health. Yet neither vision seems to be improving. Other participants demonstrated
that quality and service improvement tools, such as accreditation, would increase the
efficiency of hospitals. Technology was one of the most important factors that were
mentioned by several participants. Of the technological systems that were described was
the health information system, which is believed to improve efficiency by decreasing the
number of clerks and receptionists, and provide timely and precise information. Another
technological system that was mentioned by participants was the electronic inventory
system, such as the smart cabinet, which is believed to improve the awareness of usage,
expiry dates, and times for refills of disposables. It was mentioned by few participants,
especially in the public sector, that increasing the accountability of the users and providers
would decrease the waste of resources by decreasing the abuse of the system. One
participant believed that measuring the satisfaction of employees and of patients would
have a positive effect on hospital efficiency.
3.4 Discussion
The literature suggests that a common cause of technical inefficiency is the sub-optimal
or unnecessary use of certain resources such as excessive hospitalisation (54). Other
causes of technical inefficiency include overstaffing and weak purchasing or distribution
systems (56, 57). Another example of inefficiencies found in hospitals is the under-
utilisation of services (e.g. low utilisation of beds), which may be observed when hospitals

57
show diseconomies of scale when they depart from their optimal level of efficiency by
deciding to enlarge (54).
The 80% of inefficient hospitals in Kuwait is high compared to the efficiency of general
hospitals in other places. In Southern Iran, 53% of hospitals were technically inefficient
(94). Mahate et al (99) found that one third of hospitals in the United Arab Emirates were
technically efficient. Studies conducted in two settings in Sub-Saharan Africa showed that
74% of hospitals in Kenya (102), and 40% of hospitals in Zambia were technically efficient
(105).
The results from this study are comparable with earlier work (58) which assessed the cost
of inefficiencies in the public healthcare system in Kuwait. It was concluded that there
were relative inefficiencies in the production of health services in the country in 1999.
There was an oversupply of beds and nurses that caused an excess of 18% in total health
expenditure in Kuwait.
As explained in other studies, in order to decrease the inefficiencies in hospitals, there
should be a close evaluation of the excess in medical and non-medical manpower (85).
The results of this study showed that a hospital’s size has an effect on its efficiency, which
was supported by other studies (98, 105, 131). It was found that the larger hospitals were
potentially more technically and scale efficient. This is in line with the findings of studies
conducted in the South of Iran (94) and in Thailand (133).
The results of the Tobit regression revealed that the average length of stay was
significantly associated with overall technical efficiency of the hospitals. Previous studies
(95, 134) have found similar results where there was a negative association between the
average length of stay and technical efficiency. There was no statistically significant
association between technical efficiency with other institutional factors such as bed
occupancy rate and level of specialisation (secondary or tertiary level hospitals). This was

58
not the case in previous studies. For example, Lee et al. (132) found that hospitals that
were more specialised, were also more efficient. Moreover, Kounetas and
Papathanassopoulos (87) described that the hospital type (Regional, Prefectural, or
University) affected the technical efficiency of hospitals in Greece.
External factors that affect hospital efficiency have been studied elsewhere. Similar to this
study, Dalmau-Atarrodona and Puig-Junoy (135) showed that healthcare regulations as
well as the presence of competitors would affect hospital efficiency scores. Alternatively,
Tiemann and Schreyögg (136) argued that resources were used more efficiently after
converting hospitals to a private for-profit status in Germany, for example. Hu et al. (97)
have concluded that there was a negative relationship between government subsidy and
hospital’s efficiency when they evaluated the effect of a health insurance reform in China.
Another study from Norway has shown that the introduction of activity-based financing
has improved the technical efficiency of hospitals (137). Most participants described
increasing their autonomy would increase the efficiency of their hospitals, which was
supported by studies from other settings (96). The use of health information systems, on
the other hand, was believed to increase the efficiency of a hospital by several
participants. This was supported by a study in Thailand, which showed that there was a
positive relationship between the use of IT and the efficiency of public hospitals (133).
Additionally, the use of technology was found to decrease scale inefficiencies in Greek
hospitals (87).
This study has provided evidence that could be useful to managers and policymakers in
formulating reforms to improve the efficiency of public hospitals. The government of
Kuwait aims to improve the efficiency of public services in the country, including health
services, due to the current economic situation. The technical efficiency as well as factors
influencing the efficiency could help health policymakers to make informed decisions to
improve the technical efficiency of the main health-producing units in the country. Most
hospitals were found to be technically inefficient suggesting that there is room for

59
improvement in this domain. Additionally, any health reform that aims to improve the
performance of local health services should take into consideration the factors that were
found to influence the technical efficiency of hospitals. Similar studies have emphasised
on the importance of studying other dimensions of performance, such as quality and equity
in addition to efficiency, in order to have a comprehensive picture of the performance of
hospitals (96, 135).
3.5 Limitations
It is important to note that to improve future research in this field, the limitations that faced
this study should be taken into consideration. Firstly, there were some limitations related
to the method that was used in the second stage of this study. Simar and Wilson (138)
criticised the naïve censored tobit regression in the second stage of DEA for two main
reasons. First, they explain the naïve two -stage approach by accentuating the absence
of a clear theory of the underlying data generating process. Second, they argue that
problems related to invalid inference due to serial correlation will arise because the
conventional censored two-stage applications treat efficiency scores as if they were
independent observations (138). One way to have avoided this limitation would have been
to apply a double bootstrap truncated model, but this was not done because this model is
considered technically involved and was not available for Stata users at the time of the
analysis. Another way was to complement the DEA application with a qualitative study,
which was done in this case. The second limitation was inability of the study to determine
to what extent the inefficiency might be caused by quality of care variations due to the
lack of data about variables reflecting severity of diseases and quality of care provided in
hospitals. Just as other researchers recommended, in order to improve quality of future
studies measuring hospital efficiency, more efforts need to be made in developing
appropriate indicators reflecting quality of care in hospitals (94). The variables available
for study, such as discharge rates, can only provide a proxy for quality of care and are
likely inadequate to measure health outcome improvements. Thirdly, when applying DEA,
it is desirable to have a large sample size. The sample size for the current study is 15

60
hospitals, which is the total number of public hospitals that provided inpatient and
outpatient services in Kuwait during 2010-2014. Fourthly, the data used in this study is
outdated but it was used because of uniformity reasons. Alsabah hospital, which is a
secondary level hospital, was divided to two administratively independent hospitals,
Alsabah (secondary) hospital and Zain (tertiary) ENT hospital in 2015. This division
resulted in a disparity in the variables that were used in the two stages on the analysis.
Additionally, the allergy center, which was one of the efficient hospitals throughout the
study period, stopped providing inpatient services starting in the year 2015. So for this
hospital, one of the variables that were used in the analysis would be lost. Fifthly, it is
desirable to have a homogeneous sample when applying DEA. However, in the current
study, six hospitals provided general services whereas nine hospitals provided mainly
specialized services in addition to some general services.
3.6 Conclusion
This study has quantified the technical and scale efficiency of 15 public hospitals in
Kuwait, and identified the input reductions and/or output increases needed to make
inefficient hospitals efficient. The results show that most public hospitals are not operating
at technically efficient levels, indicating room to improve the performance of these
hospitals. Such improvements in the efficiency of these hospitals could be achieved by
decreasing inputs (i.e. doctors, nurses and/or beds) or increasing outputs (outpatient visits
or number of admission ns). This study also provided an insight into the factors affecting
the efficiency of hospitals.
Health policymakers in Kuwait can extract useful information from this study to develop
concrete strategies to improve hospital efficiency. Replicating the analyses performed in
this study on a routine basis for public healthcare facilities would help in identifying ways
of best practice, but this would not be easy to achieve unless timely and accurate data is
available.

61
Chapter 4 Priority setting in health care provision in Kuwait: perceptions of hospital managers3
4.1 Introduction
The health system in Kuwait is facing a continuous increase in health expenditures, made
more difficult by the recent and significant budget deficits, which are expected to continue
due to lower oil prices (13). This had a direct effect on healthcare because public health
expenditure made up around 86% of total health expenditure in the country (84). To
provide long-term fiscal sustainability, the authorities have identified some streamlining
options that would reduce spending inefficiencies, improve procurement processes, and
facilitate reprioritisation of spending (13, 139).
It has been documented that priority setting, also known as resource allocation (140),
exists in all healthcare systems where choices need to be made on allocating resources
between competing services (141-146). It is an essential multi-disciplinary task that
involves ethics (transparency and fairness), economics (efficient use of scarce resources
to maximise health gains), political science, epidemiology and other disciplines (143, 145,
147-151). This process is believed to be a challenge that faces both publicly funded (142,
146) and privately funded health systems (152). The process of priority setting is said to
be continuous, complex and challenging to all decision-makers at all levels of a health
system, and becomes even more complicated because of the limited interaction and
communication between these decision-makers regarding resource allocation (140).
Evidence from other high-income countries have shown that decisions related to resource
allocation in the health sector were usually based on historical patterns (151, 153-155),
where resources were allocated depending mainly on the previous year’s expenditure with
some political and/or demographic modifications (156). Such patterns were shown to
3 This chapter was published in The Global Journal of Health Science: Alsabah, Haghparast-Bidgoli and Skordis (2020), Hospital managers’ perceptions regarding setting healthcare priorities in Kuwait, Global Journal of Health Science. 2020; 12 (10).

62
unlikely maximise the utilisation of health resources (157), hence the efficiency, and
decision-makers from several health systems from across the world expressed their
dissatisfaction with such processes, emphasising on the need to set priorities in a more
evidence based approach (153, 154, 156). Nevertheless, several studies have found that
health decision-makers usually struggle to access and utilise available evidence (151,
158). Studies have explained that decision-makers in leadership roles usually lack
direction and data and are oblivious of existing priority setting instruments, while
managers at hospital levels usually struggle to maintain the quality of services at low
costs, especially with the frequent budget limitations and the continuous growing demand
(140, 144, 153, 159).
With the current economic situation in Kuwait, it is crucial to evaluate the process of priority
setting and resource allocation in order to identify its areas of weaknesses and strengths.
By doing that, it would be possible to formulate ways to improve such processes for better
utilisation of health resources to improve efficiency. It is argued that these goals could be
achieved by studying what successful resource allocation means to the relevant
stakeholders, and attempting to understand their attitudes and perceptions in reaching
effective resource allocation could improve the priority-setting process within healthcare
organisations (140). Perceptions of decision-makers in the Kuwaiti health system of the
process of resource allocation have not been previously studied, and hence, composes a
valuable source of information.
Health authorities in the country took some initiatives to cope with the increasing demand.
One of these initiatives was to invest in establishing 20 large-scale local healthcare
projects worth $ 12 billion with approximately 11,200 additional beds (13). It is believed
that the current healthcare spending in Kuwait is not efficient for the following reasons: (a)
the government would fund services without performing Health Technology Assessment
(HTA); (b) the government does not use sophisticated methods of funding but pay

63
providers through block contracts; (c) expenditure is not transparent because full costing
is not used; and (d) budgets for providers are not based on need (8).
Sending Kuwaiti nationals to receive treatment in overseas facilities is another potential
for inefficiency that has been increasing in recent years, despite suspicions raised in
recent years that the policy is politically motivated, and comes at the expense of real
patients in need (160). The procurement of private health insurance on behalf of retirees
is another policy that has yet to be evaluated. A thorough evaluation of both these policies
is overdue.
To improve the process of priority setting and resource allocation in the current health
system, a qualitative explorative study of hospital managers in Kuwait was conducted.
Although hospital managers, particularly those in the private sector, do not always control
the purse strings, they witness patient needs and inefficiencies firsthand, and their
knowledge must be transfered to the people who make policy and allocation decisions.
The objectives of this survey were: 1) to identify the current organisational practices with
respect to priority setting and resource allocation; 2) to determine the strengths and
weaknesses of the current process of priority setting; 3) to highlight strategies to improve
the current process of priority setting and resource allocation; 4) to assess the potential
effect of the policies of sending patients abroad for treatment and private health insurance
for retirees on healthcare system efficiency. All of these objectives apply to the entire
healthcare system, at a centralized national level. Although hospital managers may not
understand the full economic and political realities at the national level, it is equally true
that decision-makers may not understand the problems that hospital managers face at the
local level. If decision-makers are to make informed decisions, they must understand what
hospital managers already know.

64
4.2 Methods
4.2.1 Study participants and data collection
The interviews were conducted with the same group of managers in chapter 3. These
managers are considered to be the communication link between front line professionals
(i.e. physicians and nurses) and decision-makers (i.e. undersecretary and assistant
undersecretaries in the public health sector, and board members in the private health
sector).
Initially, an information sheet was sent to all potential participants inviting them to take
part and explaining the aim of the study. Participants who accepted to take part in the
study have scheduled an interview date, and provided a written consent at the start of the
interview. An interview guide was developed (please see appendix 5), which mostly
included themes from previous studies (150, 153, 154, 156). It was then supplemented
with some additional questions in order to study the impact of some policies related to the
process of resource allocation on the healthcare sector in Kuwait. An initial mock interview
was carried out with a researcher in the public health field, and feedback was drawn from
this interview. After this mock interview, the interview guide was refined for the following
interviews. Additionally, as data analysis continued and the research focus became
clearer, the content of the interview guide evolved even more. The interview guide
included 16 open-ended questions that covered five major sections, which were asked to
each respondent. These sections were related to the nature of decision-making in the
hospitals, the current process of setting priorities and allocating resources in hospitals,
the assessment of the current process, the allocation of resources for sending patients
abroad for treatment, and the opinions on the policy of private health insurance for
retirees.
After obtaining the permission of the participants, the interviews were audiotaped and
written notes were taken during the interviews. Verbatim transcription of each audiotaped
interview was done. The interviews were conducted in English by the first researcher and

65
ranged from 30 minutes to 70 minutes. They took place between mid-April to mid-July
2017 and thus describe the priority setting process prior to this period.
Twenty health managers from the public and private sectors in Kuwait were approached
to take part in an interview. Six declined and 14 participated. Personal data of hospital
managers were collected such as their nationality, their role in their organisation and
length of service, involvement in priority setting and/or resource allocation, and whether
they had any educational qualification in management.
4.2.2 Data analysis
The interview transcripts were analysed manually using thematic analysis. Each line of
the transcripts was coded. The codes were refined several times for consistency during
the analysis process. The data were then categorised into meaningful concepts related to
the process of priority setting in the Kuwaiti healthcare system. By using constant
comparison, major themes (e.g. ‘resource management’) and sub-themes (e.g.
‘centralised resource allocation’) were developed, and all data were analytically
categorised and compared until no new categories were identified. To support the
described concepts, key quotes from participants were used.
4.2.3 Ethical approval
The study received ethics approval from UCL Research Ethics Committee (9633/001)
(appendix 3) and the Standing Committee for Coordination of Medical Research in the
Kuwaiti Ministry of Health (Meeting number 5/2016) (appendix 4). Written informed
consent was obtained from each participant before starting the interviews. The data was
treated with confidentiality and was only accessible by the researcher.
4.3 Results
In total, the views of nine hospital directors, four Chief Executive Officers (CEOs), and one
Chief Financial Officers (CFO) from hospitals are presented in this study. Among the 14

66
participants, 2 (14.3%) were female health managers. Ten had Kuwaiti nationality, and
eight of the participants managed public hospitals. Nine health managers had a
postgraduate qualification in health management, and nine had management experience
of 10 years or more. Appendix 2 illustrates the characteristics of the participants in this
study.
The process of priority setting and resource allocation in the public sector hospitals was
found to have differences when compared to the private sector. One of the main
differences was the structure of executive management. Due to that, the persons involved
in the process of priority setting also varied between the two groups. The main findings
from the interviews are presented below.
4.3.1 Current processes of setting priorities
All participants have explained that their organisations had strategic plans that were
approved by hospital boards, after undergoing a complex process. Most priorities are
derived from these strategic plans. Most participants believed that the current process
within their organisations was democratic and fair since it involved both medical and
administrative staffs, who are believed to have knowledge and experience. Priorities are
set according to their importance, and resources allocated according to the needs of
clinical departments.
Health managers mentioned that they have used some useful methods and data sources
to assist them in the process of priority setting and resource allocation. Of these data
sources were their internal statistics from previous years and the annual health report
published by the Ministry of Health. Additionally, national demographic reports, needs
assessment of indigenous community, as well as international reports (i.e. WHO) were
mostly used in the process. Feedback in the form of suggestions or complaints from staff,
patients and their families were used in putting priorities in order of importance. Some
managers explained that they used evidence from clinical research and protocols in
67
setting their priorities. Several participants mentioned SWOT (strengths, weaknesses,
opportunities, and threats) analysis as a method that is used to identify priorities in both
public and private hospitals. Some public hospital directors claimed the use of risk
management reports and the Kuwait Cancer Registry in the process of priority setting.
Other managers from the private sector stated that they performed market analyses to
identify emerging trends in healthcare in order to guide them in setting the priorities of
their organization. One manager explained:
We have statistics department in the hospital, which falls under the medical records department. They provide us with some information that we try to rely on when determining our needs, like manpower for example. We also use the annual report that is published by the Ministry of Health... It gives you information about bed turnover, bed capacities, number of beds per population… etc. we also have Kuwait Cancer Registry, which is unique to our country. This office provides us with an annual report that is distributed to the whole country, and gives us the statistics of cancer in Kuwait. We use information from all these sources to identify our needs, shortages, and priorities in terms of manpower and equipment. (Public hospital manager 6)
Most respondents from both sectors stated that they rely on the annual (operational) plan
and the increase in patient volumes in making decisions to allocate resources across their
organisations. This process of allocating resources was believed not to be clear in the
public sector. The hospital board, accreditation committee and other committees in the
hospital participate in the process of allocating resources in public hospitals. Managers
from this sector stated that clinical services are always considered as priority when
compared to other services when allocating resources in their hospitals. It was found that
the decision of heads of clinical departments dictated this process.
The process of allocating resources across a hospital in the private sector had some
differences when compared to the public sector. This process was dependent on the
feasibility of the project in hand, the availability of resources, and the type of resources
needed. Some participants stated that, by relying on their knowledge and experience, they
try to forecast the market needs and then try to meet these needs. Resources are usually

68
targeted to certain specialties that are believed to be competitive in their field, or towards
services that are believed to be prerequisites to more advanced services. One respondent
mentioned that they were using what is called a service line management approach4
where they focus on three or four service lines (i.e. orthopedics and spine surgeries), have
a champion in each of these lines, and provide these champions with their own autonomy
in managing the service lines they are in charge of (i.e. have their own budget). Another
respondent explained that they allocated their resources according to different seasons
of the year. He stated:
We monitor the seasonal fluctuations and divide resources accordingly. For example, in Kuwait during Ramadhan, we have low foot traffic during daytime. That’s why I decrease my manpower in the morning shift, and increase it in the night shift, and because they are fasting, they are happy with this arrangement. So we do it because of internal medical reasons, seasonal fluctuations, and festival seasons. (Private hospital manager 4)
In the public sector, most hospital managers stated that directives from higher authorities
in the Ministry of Health (i.e. in the form of ministerial decrees) and recommendations from
the accreditation report influence the current process of priority setting. They explained
that the allocation of resources was even more complicated than the process of priority
setting. They have stated that despite the flexibility of distributing resources within the
hospital, the process was mostly centralised and they had limited authority over the budget
allocated for their hospitals. It was described that they had a great degree of control over
the procurement process and that most purchasing requests for equipment were usually
accepted. On the other hand, they expressed that the allocation of human resources had
a different process.
4 “Service-line management involves identifying the different business units, or ‘service lines’, of an NHS foundation trust and understanding how they contribute to the trust’s performance as a whole, allowing clinicians and managers to deliver improvements in quality and productivity at the specialty level. Service-line management aims to ensure more effective use of resources to fund better patient care”. (GOV.UK, 2014)

69
Alternatively, increasing the organisation’s profits and service’s efficiency were the main
drivers of the process of priority setting in the private sector. Despite that, most health
managers from the private sector emphasised on their efforts in balancing the quality and
efficiency of the services their organisations provide. They also explained that introducing
hospital information systems and other technologies are amongst their priorities to
improve efficiency.
4.3.2 Strengths and weaknesses of the current process of priority setting
4.3.2.1 Strengths:
Participants had mixed opinions when they were asked if the current process of priority
setting was working well or not, and they have identified several strengths as well as
weaknesses in the current process.
Of the strengths that were mentioned by most managers was that the process was simple,
systematic, comprehensive and democratic (all stakeholders are involved). They also
added that team members who were in charge of this process had knowledge and
experience, good communication, and support from their superiors. Additionally, they
believed that another strength is that priorities are usually extracted from the
organisation’s strategic plan. Another common perception as a strength of the current
process was that it had good outcomes and is accredited for good practice. One
participant explained:
We have our experience, which is a major strength. We have our colleagues that are very well educated, experienced, and updated in their fields. We have continuous communications with them. These are all strengths that help us identify our priorities. (Public hospital manager 3)
There were some differences in opinions between respondents from public and private
sectors regarding the strength of the process of priority setting used in their respective
organisations. In the public sector for instance, it was believed that having a big budget

70
and the absence of competition between public hospitals over resources was an area of
strength. One respondent stated that he enjoyed a degree of flexibility in the distribution
of resources internally, and that he believed this was a point of strength in the current
resource allocation process. Another participant explained that not having any complaints
from the staff regarding the current process is a sign of compliance and hence a sign of
strength.
In the private sector, on the other hand, it was believed that the process they use is
comparatively more dynamic, agile, and flexible, in that it had the ability to cope with
sudden internal and/or external changes. Additionally, this was thought to allow for
continuous monitoring and refinement. Some managers explained that their organisations
provided training courses for priority setting, and that was a point of strength in their
opinion. A manager stated:
We are very agile. We change courses quite easily. Healthcare is an extremely dynamic industry, with many complex players. We have to always be ready to adjust operations when things change. (Private hospital manager 1)
4.3.2.2 Weaknesses:
Participating managers also highlighted a number of weaknesses in the current process
of priority setting and resource allocation. Most respondents critisised the lack of timely
and accurate data that is important for setting priorities, and without accurate data, they
felt that decisions were reliant on guesswork. This has resulted in a lack of a long-term
vision, and therefore, decisions in allocating resources were reactionary in nature. There
was a general belief that the lack of research activity has resulted in making ‘non-scientific’
decisions or relying on ‘intuition’ to reach a decision. They have added that they do not
trust public announcements from high officials in the health sector since they witnessed
discrepancy between public announcements and actual practices of the Ministry of Health.
The following is an explanation of one of the managers:

71
There is a lot of intuition rather than numbers, because as we said, there is a lack of accurate and timely data… You use some components of proper data, but you are still missing other types of data that are required to make proper decisions… So, because of the lack of a lot of variables, the decisions are made based on a mixture of some data and some feelings, which are based on experiences and knowledge of the market. (Private hospital manager 1)
Another point that was raised by managers was the shortage of professional manpower
in the region, which was emphasised by participants from the private sector since there
were more limitations on this sector in the recruitment process of expatriate professionals.
The lack of administrative skills of both medical and administrative leadership was
identified as weakness of the current process as well. Some respondents added that
providing administrative training is both difficult and time consuming. One hospital
manager explained:
We have some constraints that are mainly related to recruitments. When we want to expand, it is not easy to recruit qualified staff. There is limited supply of professionals in the local market, so we go abroad, and this raises the problem of selecting the people. Additionally, the process takes a long time. (Private hospital manager 2)
Respondents from the public sector identified some weaknesses in the process used in
their sector. One of these weaknesses was that the process of setting priorities is not
entirely in the control of hospital managers, which sometimes created conflicting priorities
between the hospital management and the Ministry of Health. Managers also stated that
the process was slow, centralised, and involved a lot of bureaucracy. This is believed to
be due to the rigid structure of the public healthcare sector, the lack of autonomy for
hospital managers, and that decision-makers at high levels in the ministry are
overwhelmed. Most participants emphasised that they did not have any control over the
hospital’s budget and did not know the financial resources the hospital is entitled to. They
also added that they had no control over recruitment or re-allocation of administrative
employees, which resulted in assigning employees in jobs that were not in line with their
academic qualifications. Additionally, they believed that frequent rotation of managers

72
between hospitals created shortcomings in the process of priority setting because there
wasn’t enough time to execute the plans. There was a prominent perception that the
promotional scheme for administrative staff was unclear, and that there was lack of some
important administrative departments (i.e. human resources) in public hospitals. The lack
of such departments has created some problems for hospital managers such as a vague
picture on administrative training requirements for staff. Participants also mentioned that
the absence of health information system and other technologies is considered a
weakness of the current process of priority setting. One manager explained:
One of our major problems is that we don’t directly control our budget. We are allocated some resources, and as I have hinted earlier, we can request additional funds for bigger projects, if that was approved by the higher chain of command. We do suffer from certain problems in the allocation process. There is slowness in responding to our needs and requests. There is a lot of bureaucracy and paperwork that delay, at times, our projects. (Public hospital manager 1)
It was mentioned that some requirements of clinical departments as well as some patients’
demands were unrealistic, and are sometimes not in line with the general plan of the
hospital. The majority of respondents explained that the incentives of physicians and the
administration were not in line, where clinical departments focus on increasing the quality
of services while administrations focus on increasing efficiency. Due to the perceived
superiority of clinical department in decision-making, incentives to overspend were
created because efficiency is not rewarded. Additionally, respondents complained of the
lack of performing business cases before purchasing medical equipment. One respondent
explained:
We do rely on information and requests from different departments, and as you understand, those departments are in competition for resources. So at times, the demands are unrealistic… at times, the demands don’t meet the general plan of the organisation… they view something as very important to their department while it is not a priority for the whole organisation. (Public hospital manager 1)

73
Several respondents explained that there was a general sense of entitlement amongst
Kuwaiti Nationals, and that the government focused continually on meeting public
demand. One perceived weakness of the current procedure was the lack of public
awareness to the importance of some services which resulted in a continuous demand for
the availability of less important services. Another example mentioned was the general
belief that hiring good doctors would be sufficient to improve the quality of the system.
This was what a participant said:
Despite all the efforts that are being put into the service, patients are still not satisfied. Patients have a sense of entitlement that the service should be delivered to them at the time of need, with the highest quality, without waiting nor any responsibility on their side. Don’t get me wrong. Patient satisfaction is very important, and patients are the center of the service that we are providing. (Public hospital manager 2)
4.3.3 Strategies to improve the current process
Hospital managers have identified several ways to improve the current process of priority
setting. The availability of a clear and well-communicated national health strategic plan
was mentioned by most of the participants as an important step on the way of
improvement. Most respondents also advised to carry out legislative changes in the Laws
of Civil Services that would improve the process of recruiting and managing national or
expatriate professionals. These changes were also believed to help in the availability of
professional talents. Respondents also requested other changes in the system that would
focus on increasing the efficiency of the service and decreasing bureaucracy.
Decentralising the system by giving managers more autonomy (i.e. more control over
services contracts such as catering and maintenance) and control over their hospital’s
budget was of the proposed recommendations for improvement. Other recommendations
were to increase the flexibility in resources re-allocation. Some participants also
mentioned that they needed more political support and less interference in order to
improve the process of priority setting. One respondent suggested that allowing public

74
hospitals to compete for the available resources would improve the process of priority
setting. A hospital manager explained:
Hospital directors should have more authority over the budget. We also need to change the legislations regarding employment… change the laws of the Bureau of Civil Service. I am forced to employ people for public relations without having the correct requirements, for example. The Ministry of Health interferes with our contracts as well, such as catering, security and maintenance. The services are poor. (Public hospital manager 2)
The majority also emphasised on the importance of having accurate and timely data in
order to overcome some of the weaknesses of the current process. The use of health
information systems was believed to assist in improving the quality and utilisation of data.
By doing what was previously mentioned, decision-makers would be able to make more
informed decisions and less reactionary (crisis) decisions, which would ultimately improve
the process of resource allocation. Some managers explained that joining an accreditation
programme would improve the current process of priority setting in that it would provide
approved metrics to measure the performance of the hospital. One of our respondents
stated:
One thing is that, at different levels, we need to get to a point where we make informed decisions. A lot of our decisions are not informed… at times they are reactionary… at times they are based on non-factual feedback… based on biased perceptions. First of all, we have to be good at gathering information… to have approved metrics to measure the outcomes and the quality of the service. Once we achieve that, and we have the correct healthcare quality indicators, then we can move based on them. At our organisation, we are trying to improve the service by introducing accreditation to the system, because we view it as a tool to help us streamline work at our organisation. Also, it will help us set priorities within the organisation. (Public hospital manager 1)
Several proposals emphasised on the importance of involving medical staff, administrative
staff as well as patients in order to improve the process of priority setting. Some
participants stated that in order to put priorities in the right order of importance, patients’

75
needs should be assessed. It was mentioned that the current process would not improve
without developing a sense of belonging for the working staff. Also, it was believed that
the process would only improve if there were initiatives to improve the skills of all clinical
staff, not only doctors. This would assist in providing a more multidisciplinary medical
service. In terms of administration, it was advised to have a unified and systematic process
of priority setting for all public hospitals. Additionally, providing hospital managers with a
clear job description would be beneficial in improving the process. Having the appropriate
academic qualifications prior to employment and providing better training were believed
to improve the skills of administrative staff. A manager emphasised:
You have to have an active team with the right dynamics. All other problems could be solved if you have the right team. You have to develop the sense of belonging in your employees. This is the main foundation. (Public hospital manager 8)
Some respondents proposed some recommendations to improve the current process that
involved the relation between organisations. Of these recommendations was to increase
public/private partnership and the avoidance of duplication of services between the two
sectors. Other managers thought that improving the communication between public
hospitals and partnering with other institutions (i.e. NGOs) would improve the availability
of resources. One manager explained this:
We know that we don’t have all the talent and knowledge. So, we try to solve this problem by partnering with key institutions. I think partnerships are key with every possible institution. (Private hospital manager 5)
Most managers believed that the use of economic principles and/or evidence from
economic evaluation could improve the process of priority setting. The necessity for using
such principles arose from the increasing demand for health services, which lead to the
conclusion that the current financing system is not sustainable. Respondents emphasised
that the use of such tools would increase the efficiency of the system by better utilisation
of limited resources. This would be achieved by increasing the awareness of clinical staff

76
to the importance of using health technology assessment (HTA) for medical equipment
before requesting them, which would ultimately lead to better utilisation of such
equipment. They added that the use of such principles would provide evidence for more
informed strategic planning, allow to benchmark the performance of different health
organisations, and to decrease waste of resources. This would ultimately improve the
overall performance of hospitals. One manager argued:
The optimum condition for me is to apply cost effectiveness analysis. We should forecast the patient load on this required device, and how this device would improve our efficiency. I can’t invest 0.5 million KD on a machine that would benefit only three patients a year. Such economic evaluation would really improve our efficiency. (Public hospital manager 2)
4.3.4 The policy of sending patients abroad for treatment
One of the side interests of this study was to learn the health managers’ opinions of the
policy of sending patients abroad and the effect of this policy on the process of resource
allocation in the country. Few advantages were mentioned. One respondent stated that
the policy had good merits, at least when it was first implemented. On the other extreme,
another respondent believed that this policy had no advantage at all. Participants
highlighted some advantages such as accessibility to latest treatments as well as
treatments for rare cases that are not available in Kuwait, since patients were usually sent
to centers of excellence. The satisfaction of the public was another advantage of this
policy, because it met the immediate needs of patients, promoted patient choice, and
offered a degree of privacy and confidentiality. Some managers thought that this policy
helped in decreasing the load on the local public health system. This was the response of
one of the managers:
It provides health services in centers of excellence for cases that could not be treated locally, like rehab services for example. We are still falling behind in these services. Another strength is that it decreases the load on our hospitals, regardless of the cost. (Public hospital manager 4)

77
Most respondents believed that the disadvantages of this policy outweigh its advantages,
and some went beyond to explain that this policy is actually hurting the system. They
described it as a ‘bad investment’ and an inefficient policy. These resources not only
included treatment expenses, but comprised flight tickets and living allowances for
patients and companions, days absent from work for companions, costs of running health
attaché offices in foreign countries, and overtime payments for local doctors who attend
committees for sending patients abroad. Some managers shared a belief that the recent
budget cuts, which prevented the improvement of some local health sectors, were caused
by overspending on sending patients abroad. Managers from private hospitals claimed
that this policy affected their sector mainly. One manager expresses his opinion as follows:
Treating patients abroad comes at a very high expense to the national budget. Healthcare is costly whether it was on a local level, and it is definitely more costly when you look at the patients that are treated in Europe or the US. So, there is a substantial amount of money that gets spent outside the cycle of the healthcare system in Kuwait… Also, add to that days lost from work for companions, which usually get full paid leaves as they accompany their ill relatives. So, there, definitely, is a waste of resources at different levels and different areas associated with treating patients abroad. (Public hospital manager 1)
There were other identified disadvantages that affected the care of patients, such as the
higher risk on patients because of flying in some cases. Another example was the problem
of patients’ follow up especially if they had a surgical procedure abroad. This is believed
to have a negative effect on patients’ care since the follow up procedure is usually
disrupted. Not being able to be treated in the company of family and friends was another
example. The majority of managers from both sectors emphasised that the policy was
misused and was politically driven. They added that most specialties are available in the
country and that most decisions to send patients abroad lacked real medical indications,
and that it was used for tourism purposes. One respondent added that such practice
created a sense of inequality because not all patients get sent abroad. One manager
emphasised:

78
No two people can disagree that this policy is currently used as a political ticket. No one can deny that the mass majority of this budget is political. (Private hospital manager 1)
Most importantly, majority of participants explained that the heavy reliance on this policy
created public embarrassment to the local health system as being incompetent, which
resulted in a decrease of public trust in the system. Another message that was perceived
by local healthcare professionals is that the leadership does not have confidence in their
talent, which negatively affected their morale. Also, by sending most difficult cases
abroad, local talent are not being challenged and hence not being allowed to thrive and
develop. Some respondents claimed that the government is not serious in solving this
problem. A manager explained:
It is very negative because the policy of sending patients abroad for treatment sends a clear message that the health services here in Kuwait are failing, and that they are not at the required level. So, if you need better medical care, you have to go abroad. This is the message that is being sent. (Public hospital manager 7)
Participants recommended several solutions to overcome the disadvantages of this policy.
Some managers believed that the opening of new hospitals that are under construction
should result in a decrease in the number of patients being sent abroad for treatment. The
majority emphasised that this is a problem and the government should solve it. As an
initial step, most respondents believed that the policy should be revised and its cost
effectiveness to be evaluated. Investing funds that were used for this policy in the local
health system was a recommendation suggested by most respondents. Such investment
could involve guidance from international partners to improve local health services by
inviting international visiting doctors in the specialties of need and/or participating in
formulating a national strategic health plan. Managers from the private sector advised that
referring patients to their hospitals would be a better way of utilising health funds. The
following was one participant’s opinion:

79
I believe that establishing new hospitals and inviting international professionals to provide their services locally would solve most of the problems that are related to sending patients abroad for treatment. (Public hospital manager 4)
4.3.5 Policy of health insurance for retirees
Most respondents from both sectors stated that the objectives of the policy were not clear.
Some of them suggested that providing better accessibility to health services, decreasing
waiting times, decreasing load on the public sector, increasing patient choice, and
minimising cost were amongst the possible objectives of the policy. The majority believed
that this policy is the first step towards implementing a national health insurance in the
country. When asked about the policy’s objective, a manger answered:
I’m not sure. The objective should have been to minimise cost on the national budget. (Public hospital manager 2)
There was clear discrepancy in the opinion of managers from the public and private
sectors. Few of managers from the public sector believed it was a good policy, while most
managers from the private sector thought that it was a good policy. The increased patient
load after implementing the policy is believed to influence the opinion of managers from
the private sector. A supporter of this policy stated:
I think this was an excellent move. It has expanded the accessibility for the retirees to the private healthcare… The amount that was invested has improved the health of retirees, stimulated the private sector to grow, and ignited the health insurance culture in the country. (Private hospital manager 2)
Managers from the private sector identified most of the advantages of this policy. Of the
important advantages was the trust of the government in the private sector. They also
claimed that the policy is feasible since treating patients in the private sector was more
efficient than treating them in the public sector. As a result, some participants believed
that this policy would help in cost containment since it decreases the waste of financial

80
resources. The increase in profit of the private sector after implementing the policy was
believed to decrease the risk of investing in the private sector. This would ultimately
provide an incentive for growth of the private sector in the form of improving the quality
and customer services, and the willingness to expand into more specialised services. This
would also lead to improve the public trust in local healthcare. Improved accessibility to
health services by decreasing waiting times was another advantage of this policy, which
helped in providing timely care for those who were in need. The decrease in the load on
the public sector and the shift in health provision towards the private sector are believed
to give doctors more time to treat their patients, and ultimately better utilisation of health
resources. This policy was also believed to increase patient choice, and hence patient
satisfaction. Some respondents believed that this policy provides an incentive for the
growth of the health insurance market. One respondent explained:
… the government has taken a long-term strategic decision by sending a clear message to the private sector in Kuwait that we trust you, and because of that, we are handing over our most precious segment of our community, the retirees, to you… we are betting on your abilities… we want you to grow. (Private hospital manager 3)
Several disadvantages of this policy were identified, which were mainly highlighted by
managers from public hospitals. Of these disadvantages was that the policy was politically
driven. This has lead to the perception that the policy is not based on a technical
foundation and lacked vision since it was implemented before carrying out a full
assessment of its effects. Some participants complained that their opinion on the policy
was not taken into consideration. They continue to explain that they only knew about the
details of the policy from the media, and that they were not involved at any stage in
developing it. Another disadvantage was the duplication of care, where beneficiaries
would utilise services covered by this policy from the private sector and then receive
services from the public sector for the same complaint. The lack of censorship is believed
to be the reason for such practices. This led to their conclusion that this policy is actually
more costly, would cause more strain on the health budget, and do not solve the current

81
problem of the health system. Some added that this policy, just like the policy of sending
patients abroad for treatment, would lead to decrease trust in the public health sector.
They believed that this policy would lead to migration of professionals to the private sector,
which may lead to failure of the government in running the newly established hospitals.
Most respondents mentioned that the treatment package provided by this policy is not
ideal. One example mentioned was coronary artery catheterization, which was not
included in the first year of the policy. Not including this treatment in the package also
raised some ethical issues since the patient would be receiving radiation twice, once for
diagnosing his/her case in the private hospital, then when having the procedure in the
public hospital. Managers from the public sector added that they provide better quality
service in their hospitals but patients usually have more tolerance towards the private
hospitals, which could be due to their hospitality services. Some participants argued that
this policy would bring by the disadvantages of private health insurance. One participant
mentioned that this policy enforces inequality between sub-groups (only retirees benefit
from this policy) and sectors (only private hospitals get paid for their services from the
insurance company). A manager complained:
I’m not sure about the main reason behind it. Nobody has been involved in it. Most administrative directors in the Ministry of Health knew about the policy just like the layman… they read it in the newspapers and the media rather than being involved in the process. (Public hospital manager 7)
Managers mentioned some recommendations in order to improve the policy of private
health insurance for retirees. The majority agreed that the current health financing system
is not sustainable, and that social health insurance is the solution. They added that the
current policy needed revision, more regulation and monitoring, in order to overcome its
misuse (i.e. duplication of care). The policy is believed to contain some costs after such
revision. Some respondents suggested expanding the benefit package to include the ‘real
needs’ of beneficiaries. Other respondents recommended increasing the number of
beneficiaries to include more subgroups, both nationals and expatriates. One manager

82
from the public sector explained that public hospitals should be included in the policy to
overcome the misuse in the current policy, as well as to help improve the quality of the
services provided by public hospitals. Despite the variety of comments, it is clear that the
programme needs to be revised.
4.4 Discussion
Despite the importance of priority setting in healthcare and the expansion of this research
field (161), limited work has been done to study these processes in the Middle East,
especially in Kuwait. Our study evaluated the current health care priority setting process
in Kuwait, its strengths and weaknesses, strategies that could improve the process, as
well as two national health policies that we believe have a great impact on the utilisation
of health resources in the county, namely the policy of sending patients abroad for
treatment and the policy of private health insurance for retirees.
Regarding the process of priority setting, several similarities to systems in some high-
income countries were identified. Of these similarities was that studies in other countries
identified the lack of relevant data, the presence of several players with different agendas
(i.e. political influence), and the limited use of organised processes for decision-making
as obstacles facing priority setting in health systems (153, 154, 161, 162). An
understanding could be concluded from the findings of the current study that there isn’t a
clear process of priority setting in the Kuwaiti health system. This was a common finding
with other decision-makers from other studies (146, 153). Majority of managers from the
public sector stated the resources in their hospitals were allocated by relying mainly on
previous years’ budgets (historical approach), which was similar to priority setting
processes in organisations from other high-income countries (HIC) (153, 154, 156).
In this study, it was found that priority setting process in the public sector was not based
on evidence, which was another barrier to the improvement of such processes in other
contexts (163). This could be related to another barrier identified in the current system,

83
which was the limited availability of data that was also found to be existent in other settings
(151, 154). Eichler et al. (142) reported that the awareness of the importance of performing
resource allocation in a systematic rather than intuitive manner is increasing.
Mitton and Prout (154) have found that the reactive nature of decision-making (crisis) in
health systems, political influence and budgetary constraints were weaknesses found in
the health system of Western Australia. These findings were similar to the ones from our
study. One weakness of the current system was that the process of decision-making was
centralised that lead to a feeling of disempowerment among managers of public hospitals.
This was similar to findings from studies from other high-income countries (156). The
current study also found that because efficiency was not rewarded in the current public
system, there was encouragement to overspend, which is in line with findings from the
studies from other settings (156). Other studies identified lack of a formal process of
priority setting (156), or the unawareness of decision-makers of appropriate tools that
would assist in this process (153), as weaknesses. Respondents from public hospitals did
not clearly mention the former, but it could be concluded from their answers that the
current process is no different than what was mentioned in the literature.
To the contrary, there were some differences in our findings, when compared to other
studies, regarding the process of priority setting. While other studies have shown that
more physicians’ role was desirable in the process (156), some participants in our study
explained that one of the weaknesses in the current process was that heads of clinical
departments, who were mostly physicians, had unrealistic expectations and had an
incentive to overspend because they mainly focus on improving the quality of the service.
This could be the result of the lack of economic evidence in decision-making of physician
leaders that was highlighted in our findings, which was also identified in other health
systems elsewhere (156). One recommendation from our respondents was the need to
provide management training for physicians in order to improve the process of priority
setting, which was also supported by evidence from researchers elsewhere (156).

84
Alternatively, Ham (146) argues that effective priority setting should include the use of
clinical guidelines.
Respondents had several recommendations for improving the process of priority setting
in the Kuwaiti health system. There was an emphasis on the importance of the availability
of a transparent national health strategy as a first step to improve the process of priority
setting. Several other studies have emphasised on the importance of developing a more
transparent priority setting process (145, 147, 153, 156). Teng et al. (156) added that the
process should be accountable to internal and external stakeholders, should be aligned
with organisational context, and account for politics. Furthermore, the findings from our
study were compatible with other studies in the need for evidence-based information to
improve the process of resource allocation (150, 153, 156). Tomson et al. (164) found
that, in Lao, better priorities were set to meet real health needs when data from research
was communicated to and then utilised by health policymakers. Similarly, Mitton et al.
(165) claimed that the allocation of resources became evidence-based, transparent and
defensible rather than being politically-driven, by establishing collaboration channels
between researchers and health decision-makers in British Columbia.
Similar to the case of our study, findings from the literature document that the use of
economic evidence in health policy making was limited (166), but its use in HIC is
increasing in recent years (141). Nevertheless, Jan (166) argues that more effective
health policies could be formulated as a result of a comprehensive and accurate policy
process that takes into account the incentives of health economic analyses. There is some
evidence that recent health policy and planning practices usually include an economic
evaluation component in order to be more rational (142, 167). Hutubessy et al. (167) claim
that relative costs and health gains of different health interventions could be compared by
using economic tools such as cost-effectiveness analysis in order to allocate scarce
resources efficiently. Eddama and Coast (141) reported that there are several economic

85
evaluation tools are used in the process of allocating health resources such as cost-
effectiveness analysis, cost-utility analysis and cost-benefit analysis.
On the other hand, although most respondents supported the use of economic evaluation
to improve the process of resource allocation, such tools should be used with caution.
Williams and Bryan (168) explained that in order to make more informed choice of the
suitable approaches of economic analysis and presentation of results, the analyst is
required to have an understanding of the nature of the policy environment into which the
analysis is being performed. They add that if the impact of such economic evaluation is to
be maximised, there should be a focus on communicating the improvements in such
processes to health decision-makers, and on the capacity of these policymakers to follow
the recommendations from the analyses (168). They also add that economic evaluation
may have difficulty overcoming issues such as system rigidities, conflict of values and
competing objectives since they usually require larger changes to the macro-political and
institutional environment of healthcare policy making (168). Eddama and Coast (141)
explain that health system inefficiencies could be reduced by applying economic analysis
and focusing on long-term goals, but this could be difficult to perform because of cultural
and institutional challenges.
The improvement of the current process of priority setting was facing several barriers in
the current context. Most of the findings in this study were similar to what Mitton and
Donaldson (155) indicated. They found that lack of vision, discontinuity of staff, lack of
resources and inadequate training are common barriers to improvements of priority setting
processes in health organisations, while effective leadership, commitment to vision and
right individual knowledge, skills and attitudes are common facilitators of improvements
(155). Gibson et al. (144) indicate that running workshops in strategy development for
decision-makers would assist in the process of priority setting in healthcare.

86
Like Kuwait, other Gulf Cooperation Council (GCC) countries have similar health policies
such as sending patients abroad for treatment and private health insurance for their
people. Limited studies and/or reports were published to highlight the impact of such
policies on health outcomes of these populations. Koornneef et al. (169) studied some of
the effects of recent health system reforms in the UAE. They reported that sending
patients abroad for medical care amounted to almost a quarter of the UAE’s total
healthcare expenditure in 2010 (169). In 2013, Health Authority Abu Dhabi sent over 1400
patients, while Dubai Health Authority sponsored more than 2700 patients to be treated
abroad in 2014 (169). Similar to our findings, the authors surprised about the substantial
funds were spent on sending large numbers of patients to be treated abroad, in spite of
the excellence of the UAE health system (169). They also added that it would be wasteful
to routinely send patients abroad for treatment, if the government’s ambition to have a
world class health system was fully achieved (169).
On a different note, Koornneef et al. (169) stated that after the implementation of
mandatory health insurance for nationals and expatriates in Abu Dhabi in 2006, there was
an increase in costs and insurance claims, which is believed to signal the need for further
policy modifications to ensure long-term financial sustainability. They also argued that
such increases in costs could be a result of over-use, waste and fraud, and recommended
further reforms (169), which was similar to some participants’ opinions in this study.
Innvaer et al. (170) argued that to increase the use of evidence by healthcare
policymakers, researchers needed to establish good two-way communication with
policymakers; deliver brief policy recommendations; ensure that their work is seen as
timely, applicable and of high quality; contain effectiveness information; debate that their
findings are relevant to current policy and community needs. Nevertheless, While the
provision of guidance and potential alternatives is the role of researchers, health decision-
makers remain responsible for accepting and implementing evidence-based, systematic
processes of resource allocation (146, 153). Mitton and Donaldson (155) argued that it

87
would be beneficial to recognize specific barriers and plan to overcome them before
implementing change in the resource allocation process, as different contexts will require
different strategies. So, as other researchers concluded, there are no simple resolutions
to the dilemma of resource allocation (146).
4.5 Limitations
This study has several limitations. Generalisation is the first limitation of this study, where
this research reveals perceptions of hospital managers from a number of public and
private hospitals in Kuwait, and hence may not represent the opinions of hospital
managers from other contexts. Also, the views of hospital managers could not be
generalised to other stakeholders in the health system. Decision-makers from the Ministry
of Health were invited, but did not participate in this study because they were
overwhelmed with political issues, and a number of them were leaving their jobs.
The second limitation is related to the subjective nature of open-ended questions, which
includes two types of information bias, and this is common in similar qualitative studies
(153). When analysing the data, a possible bias would be that the coder would report the
findings from a certain angle. On the other hand, participants not providing truthful
answers could result in another type of information bias, but this is unlikely the case since
none of them would have any benefit by not providing the proper information (153).
4.6 Conclusion
To the best of my knowledge this study is the first to examine the views of hospital
managers on the processes of priority setting and resource allocation in the Kuwaiti health
system. This study explores the perspective of hospital managers regarding the priority
setting process in the Kuwaiti health system, and explores ways of improving the process.
The provision of more accurate and detailed information on the strengths and weaknesses
of the current process would help facilitate the improvements. It can be concluded that
introducing a national health strategy as well as a transparent priority setting process by
88
ensuring that up-to-date and accurate data are available, and that the clinical and
administrative staff at hospitals are trained in the necessary management skills, are the
measures required to bring about a more effective priority setting and allocation of
resources. Additionally, it is recommended that researchers communicate evidence to
policymakers to help them make more informed decisions regarding resource allocation.
As in studies conducted in other countries, our findings are expected to support the need
for evidence from economic evaluation and also to encourage discussions on the
comparative importance of such evidence. Hence, continuous monitoring and evaluation
of the economic impact of health policies, such as sending patients abroad for treatment
and private health insurance for retirees, will be required in order to improve overall health
outcomes.

89
Chapter 5 Comparing the preferences of health service providers and members of the public for setting healthcare priorities
5.1 Introduction
The convergence of falling revenues, and increasing costs means that the Kuwaiti
government may need to engage in an explicit priority setting process to improve the
efficiency of the system. For example, the policies of sending patients overseas, and the
provisioning of private health insurance for retirees may be unsustainable as currently
implemented. Making choices to allocate resources between competing services is known
as priority setting (141-143, 145, 146). It is a process that includes different disciplines
such as ethics, economics, politics and epidemiology (143, 145, 147-151). Therefore, and
at all levels of a health system, the process of priority setting is believed to be continuous,
complex and challenging (140). Traditionally, policymakers and hospital managers
perform the process of priority setting and resource allocation within a health system (140,
148, 153, 159).
Despite the argument that there is no single clear process for setting priorities in a health
system (153), there have been several attempts to identify frameworks that might improve
or expedite the priority setting (140, 144). There are increasing demands to increase
public involvement in health and healthcare decision-making (171, 172). It has been
further argued that public preferences in setting healthcare priorities need to be reflected
in the decision-making process for it to be legitimate and acceptable (172, 173). Several
studies have evaluated various methods of involving the general public in setting
healthcare priorities (174-179). Such initiatives have been performed in high- (173, 180-
185), middle- and low- income countries (186).
Despite some progress, how to involve members of the public in setting healthcare
priorities and allocating health resources remains challenging for decision-makers in a
range of health systems (175, 187). It is also important to identify who should be
90
accountable for making decisions regarding resource allocation in public healthcare since
there is arguably a gap between public expectations and healthcare resources (183).
Additionally, there are concerns about establishing a ‘dictatorship of the uninformed’ by
those more cautious of the idea of involving the public in setting healthcare priorities (185).
This study aims to elicit the perception of the general public and health service providers
in Kuwait on setting health priorities and key health policies in the country. Such priorities
include how important both groups believe some health services are, preferred sources
for health funding, their attitudes towards the current allocation of health resources,
perceptions of current healthcare costs, and the adequacy of currently available
resources. It also aims to assess the perceptions of both groups regarding two key health
policies in the country, namely sending patients abroad for certain types of care and
providing private health insurance for retirees. It is believed that this study will provide
decision-makers in the Kuwaiti health sector with useful information to develop more
informed priority setting strategies.
5.2 Methodology
5.2.1 Available tools to evaluate preferences
Preferences could be evaluated using a number of different research methods, including
Discrete Choice Experiment (DCE), and Multiple Criteria Decision Analysis (MCDA), and
surveys. This section will explain briefly the different methods above mentioned, and why
surveys was the method of choice for this study.
DCE is a widely used quantitative technique to assess the preferences of health workers
(188). It is believed to be a useful tool for decision makers in investigating different policy
options (188). DCE has several stages; identification of attributes and assignments of
levels, deciding what choices to present to individuals, development and administration of
the survey, data input, analysis and interpretation (188). It is important that each stage is
carried out well since DCE involves responses to hypothetical choices, otherwise the

91
researcher may end up with numbers that lack validity (188). It is key to identify the target
population before conducting the DCE because this will inform the subsequent formulation
of the choices (188). Literature reviews and qualitative research, such as in-depth
interviews and focus groups involving stakeholders, are included in this step of the DCE
(188). It is therefore advised to seek the support of an experienced researcher in the fields
of qualitative methods, experimental design and econometric analysis (188). For the
results to be taken into account at the policy level, inclusion of the concerns of decision
makers is advisable (188). Carrying out this method of research is considered quite
expensive and time consuming (average 8-12 months) (188).
MCDA is a general field of study that involves decision analysis processes involving two
or more options (189), which is used used to support decision makers in choosing the
most preferable variant from many possible choices, taking into account a multitude of
criteria characterising acceptability of individual decision alternatives (190). When all
options are are permissible and the problem is to choose the best one subjectively, The
criteria can grade the quality of the variants (190). Watrobski et al. (190) argue that the
improper application of MDCA decreases the quality of recommendations, since different
methods produce inconsistent results. This is believed to be due to: (a) different
techniques use weights differently in their calculations; (b) algorithms vary in their
approach to selecting the “best” solution; (c) many algorithms attempt to scale the
objectives, which affects the weights already chosen; (d) some algorithms introduce
additional parameters affecting the final recommendations (190). The selection of the
MCDA method suitable for solving a specific decision problem is an important part of the
decision-making process (190).
Surveys, that can be qualitative or quantitative, are methods oftenly used in social and
psychological research since they describe and explore human behaviour (191).
Quantitative surveys have been used historically to obtain information describing
characteristics of a large sample of individuals relatively quickly (191). Like other research

92
methods, surveys has the potential for different sources of error, but various strategies
exist to reduce that potential error (191).
Due to my experience in the survey method, and the availability of expertise when needed,
and of limited time and resources, the survey research method was used in this study.
5.2.2 Study population and sampling
This study includes a sample of health service providers and the general public in Kuwait.
The sample representing the general public was randomly selected to participate in the
survey. The sample included residents of Kuwait (both Kuwaitis and non-Kuwaitis), aged
21 and older, currently living in Kuwait. This sample excluded individuals who were non-
Arabic or non-English speakers, were temporary visitors to the country, or did not give
consent to participate in the study.
To calculate the survey sample size, a prevalence of a certain opinion of 50.0% was
assumed, along with a 95% confidence interval (CI) (Z=1.96), a 5% acceptable margin of
error, a simple sampling design effect coefficient of 1 and two groups of comparison
according to nationality (Kuwaitis and non-Kuwaitis). Calculations resulted in a sample
size of 768.3 individuals, which was further increased by 50% (1537) to account for
contingencies such as non-response and recording errors.
The following formula was used for sample size calculation:

93
Equation
! = ($)!. '(1 − ')+!
where
Z = Level of Confidence Measure. It describes the level of uncertainty in the sample prevalence as an estimate of the population prevalence. Recommended value: 1.96 (for 95% confidence level).
P = Baseline levels of the indicators. The estimated prevalence of a certain opinion within the target population. Values closest to 50% are the most conservative. Recommended value: 0.5 if no previous data on population.
e = margin of errors. The expected half-width of the confidence interval. The smaller the margin of error, the larger the sample size needed. Recommended value: 0.05.
Expected Response Rate = The anticipated response rate. Recommended value for opinion research: 0.5 as an estimate if no previous data on population for general public not for the care providers.
A simple random sampling procedure was carried out to randomly select participants from
the target population in public areas and places of work. Although stratified, systematic
and even cluster sampling are ideal for nation-wide surveys, however, due to logistics and
limited time, the simple random sampling technique was the most suitable for this opinion
research. The limitations of this approach include the exclusion of certain sectors of the
population such as people who were at home or other facilities such as universities,
military camps, prisons, farms, industrial and construction areas. However, the results are
still useful as the selected venues for the interviews as shopping malls, grocery stores,
mosques, coffee shops and amusement parks are visited by different sectors of the
population. During February 2018, six days of each week were selected at random as
follows: The 3-days data collection for general public in malls and grocery stores starting
at 6:00 pm for 6 hours per day. Another 3-day-period for both working places of the
general public sample starting at 1:30 pm for two hours per day and for service providers,
starting at 7:30 am for 4 hours per day and there was one day off per week, again selected
at random. In each episode of data collection, 3 data collectors were available in one place

94
with an assistant, who helped in generating a 3-digit-random number using a simple
pocket calculator (Casio). At the above-mentioned starting point, the first random number
was generated and this referred to the first selected person who was coming out of a
certain exit of the mall. This person was stopped by the first data collector who introduced
himself and explained the objective of the study and if consented to participate, the
interview started. During the same time the assistant generated the next random number
to select the next respondent for the second data collector and so on for about 6
hours/day. The same was done for the working places of the general public sample;
however the assistant generated a two-digit-random number.
Regarding the sample of service providers, a comprehensive list of the target population
was prepared from the departments of Health Manpower and Medical Licensing, MoH.
From this list, a simple random sample was selected to participate in the survey. This
sample included different health service providers (physicians, dentists, nurses,
pharmacists, and technicians), and excluded those who were on leave during the time of
data collection and those who did not give consent. A simple random sampling procedure
was carried out to randomly select participants from among the target population of health
service providers who were registered in the Health Manpower Directorate, MoH, the
Kuwait Medical Association (KMA) database, and the Directorate of Medical Licensing.
The sample included individuals who were working in either public or private healthcare
facilities from all six governorates of Kuwait. Table 5-1 shows the distribution of healthcare
manpower according to the category and type of establishment all over the country
according to the last quarter of 2017.
The planned sample of the study was 1537 participants for general public and 769 for
health service providers.

95
5.2.3 Data collection
Data was collected from individuals using a structured questionnaire that included
questions from similar previous studies (171, 177, 179, 180, 183, 184, 192), as well as
questions that developed through interviews with hospital managers as part of a
qualitative study conducted by the authors (chapter 4). The questions were formulated to
be easily comprehensible for health service providers and laypeople alike. Content validity
was performed by asking a number of leaders in the health sector and some members of
general public. These respondents explained the questions were relevant and the
questionnaire as well-constructed. The questionnaire was translated from English to
Arabic, since it was the main spoken language in the country, and then back translated to
English. Participants had the option of completing a questionnaire either in Arabic or
English depending on their preference.
The first part of the questionnaire included questions about the sociodemographic
characteristics of respondents, while the second part intended to illustrate the care
seeking behaviour of respondents. Participants were then asked to rank 12 services and
treatments according to their importance in the third part of the questionnaire. The
services were adapted from previous studies and aimed to check participants’ preferences
for the allocation of resources towards younger versus older patients. It also evaluates
whether respondents prefer more expensive health services with more immediate effects
rather than prevention and or health promotion services where the benefits may be
delayed. Respondents were then asked about their preferred sources of additional funding
for health services in the fourth part of the questionnaire. Next, the attitudes of
respondents with respect to resource allocation in healthcare were evaluated in the fifth
part, while their perceptions regarding healthcare costs was covered in the sixth part, and
their perceptions on the adequacy of healthcare resources were also assessed in the
seventh part of the questionnaire. The eighth and ninth sections of the questionnaire
asked participants about their perceptions regarding some ‘hot topics’ in the health policy

96
arena in Kuwait, namely the policy of overseas treatment and private health insurance for
retirees, and the amount of resources allocated for such schemes.
A team of six data collectors attended a three-day training workshop on the objectives of
the study, the content of the questionnaire, expected questions from participants, the
content and purpose of the information sheet shared with respondents and the informed
consent form. The primary researcher led the workshop from 28th to 30th of January 2018.
The data collectors had experience in the field data collection from previous surveys
performed in the country by the Ministry of Health and other international organisations.
Data collectors were asked to explain the objective of the survey and to obtain a written
informed consent from participants before starting the survey.
After training, data collectors performed a pilot study that included 30 purposively selected
individuals from the general public and service providers. This phase aimed to check if
the questions were easy to understand and to evaluate the data collection skills of the
team. The questionnaire was modified by changing and/or removing some questions that
were hard to understand. Respondents spent 15-20 minutes completing the questionnaire
during the pilot. Questionnaires were available in English and Arabic, depending on the
preferred language of the respondent.

97
Table 5-1: Distribution of health care manpower according to the category and type of establishment, Kuwait 2017
Category Governmental Private Oil Total
K NK Total K NK Total K NK Total K NK Total
Doctor 3251 5223 8474 255 2062 2317 55 182 237 3561 7467 11028
Dentist 1320 559 1879 130 829 959 9 20 29 1459 1408 2867
Nurse 1097 21606 22703 42 6751 6793 29 600 629 1168 28957 30125
Pharmacist 643 821 1464 331 1252 1583 51 49 100 1025 2122 3147
Others 5523 4306 9829 480 3013 3493 139 99 238 6142 7418 13560
K: Kuwaiti national, NK: Non-Kuwaiti nationals, Others: technicians of labs, radiology, and pharmacy.
98
The study took place in all six governorates of Kuwait for the general public and
health service providers. As for the general public, public areas in the center of
governorates with easy accessibility were chosen for data collection.
Respondents were approached in shopping malls, grocery stores, governmental
working places, private companies, and the Public Authority for Social Security5.
Permissions was acquired to interview respondents at the previously mentioned
locations. In each of the locations, participants were recruited from their desks as
well as building reception areas. A designated area was chosen for participants
to fill out questionnaires in each of the locations. As for service providers, the
interviews were conducted in clinics and hospitals to have a representative
sample of selected respondents.
The data collection took place in the month of February 2018. Questionnaires
were self-administered. Each questionnaire was given a unique code and was
checked for completion.
5.2.4 Data management and analysis
Data collected were doubled entered. First, the data was entered by one data
operator from Kuwait National Center for Health Information (NCHI). Then, the
primary researcher entered the collected data using Microsoft Excel®. Double-
checking was performed where any inconsistencies were corrected after
confirmation from the hard copies. Each questionnaire had a unique code. Data
analysis was performed using SPSS version 24, using appropriate methods for
5 This location was chosen because it is usually visited by retirees who are chief targets of this study since they are beneficiaries of one of the healthcare policies intended to be evaluated (private health insurance for retirees).

99
the sample design of the survey. Entered data were checked for accuracy then
for normality, using Kolmogorov-Smirnov & Shapiro-Wilk tests.
The following statistical tests were used:
1. Independent samples Mann-Whitney’s U-test (or Z-test) was used as a
nonparametric test of significance for comparison between two sample
medians. In this study, it is used for ordinal variables such as age groups,
education, monthly income, ranking of health services, and Likert scale
questions. For negatively worded items the median was calculated in
reverse direction, however for tabular presentation these were left as the
respondent answered.
2. The χ2-test (or Yate’s corrected Chi-square) was used as a non-
parametric test of significance for comparison between the distributions of
two qualitative variables.
A 5% level is chosen as a level of significance in all statistical significance tests
used.
Few participants chose to have ‘no response’ for some general characteristics
that did not exceed 5% of the corresponding sample. In the presentation, they
were kept as such because of their minority and because no association with other
questionnaire items was identified.
5.2.5 Ethical approval
Ethical approval for the study was obtained from University College London
(9633/001) (appendix 3) and the Standing Committee for Coordination of Medical
Research, MoH, Kuwait (Meeting number 5/2016) (appendix 4). An information
sheet was given to each participant explaining the objectives of the study and

100
informed consent was obtained from each participant before proceeding with the
survey. The data was treated with confidentiality and was only accessible by the
researcher.
5.3 Results
The results showed response rate of 78.8% for the general public (n=1211) and
75.2% for health service providers (n=578). Table 5-2 shows that 51% of general
public were females, around 37% were between the ages of 21-30 years of age,
and the majority (78%) were Kuwaiti nationals. This was not representative of the
national population where females aging 20 years and above make up 34% of the
total population, around 26% of the total population were between the ages of 21-
30 years of age, and around 22% of the total population were Kuwaitis. On the
other hand, around 62% of the service providers were females, the majority fell in
the age group of 31-40 years, and were predominantly Non-Kuwaitis (63%). The
sample of service providers was relatively more representative since females
made up around 62% of service providers in the country, and around 86% of
service providers in the country were Non-Kuwaitis.

101
Table 5-2: Characteristics of the respondents
Characteristic General public [n (%)]
Health service providers [n (%)]
Gender Male Female
595 (49.1) 616 (50.9)
222 (38.4) 356 (61.6)
Age (years) 21-30 31-40 41-50 51-60 >60 No response
445 (36.8) 420 (34.7) 216 (17.8) 90 (7.4) 30 (2.5) 10 (0.8)
109 (18.9) 297 (51.4) 128 (22.2) 32 (5.5) 10 (1.7) 2 (0.3)
Marital status Single Married Divorced or widowed No response
388 (32.0) 747 (61.7) 61 (5.1) 15 (1.2)
106 (18.3) 454 (78.6) 12 (2.1) 6 (1.0)
Nationality Kuwaiti Non-Kuwaiti No response
941 (77.7) 256 (21.1) 14 (1.2)
210 (36.3) 366 (63.3) 2 (0.4)
Employment status Student Employed Unemployed Retired No response
28 (2.3) 1044 (86.2) 87 (7.2) 41 (3.4) 11 (0.9)
5 (0.8) 565 (97.8) 6 (1.0) 0 (0.0) 2 (0.4)
Monthly Household income (KD) <1,000 1,000-2,000 2,001-3,000 3,001-4,000 4,001-5,000 >5,000 No response
412 (43.0) 410 (33.9) 163 (13.5) 71 (5.9) 44 (3.6) 59 (4.8) 52 (4.3)
279 (48.3) 117 (20.2) 64 (11.1) 31 (5.4) 25 (4.3) 54 (9.3) 8 (1.4)
Highest degree Not completed high school High school Diploma Bachelors degree Postgraduate degree No response
63 (5.2) 118 (9.7) 357 (29.5) 575 (47.5) 86 (7.1) 12 (1.0)
0 (0.0) 4 (0.7) 127 (22.0) 268 (46.3) 175 (30.3) 4 (0.7)
Governorate of residence Capital Farwaniya Ahmadi Jahra Hawalli Mubarak Al Kabeer No response
367 (30.3) 91 (7.5) 158 (13.1) 343 (28.3) 109 (9.0) 133 (11.0) 10 (0.8)
83 (14.4) 15 (2.6) 233 (40.3) 119 (20.6) 66 (11.4) 46 (8.0) 16 (2.7)

102
In both groups, the majority had used a public healthcare facility for their last care-
seeking visit. Table 5-3 shows that 63% of the general public and 30% of service
providers visited a healthcare facility in the last month. Regarding the method of
payment, 34% of the general public used public health services (free of charge)
and 21% paid out-of-pocket payment, while 43% of service providers used public
services and approximately 29% paid out-of-pocket payment.
Table 5-3: Respondents’ care seeking behaviour and last encounter with the health system
Question General public [n (%)]
Health service providers [n (%)]
The last time a healthcare facility was visited Less than a month One to six months Six months to a year One to three years More than three years No response
765 (63.2) 288 (23.8) 98 (8.1) 30 (2.5) 25 (2.0) 5 (0.4)
171 (29.6) 135 (23.4) 137 (23.7) 58 (10.0) 66 (11.4) 11 (1.9)
Type of healthcare facility last visited Public healthcare facility Private healthcare facility Healthcare facility overseas No response
887 (73.3) 299 (24.7) 16 (1.3) 9 (0.7)
426 (73.7) 126 (21.7) 13 (2.3) 13 (2.3)
Method of payment for healthcare Private health insurance Out-of-pocket Use public health services Use a combination of methods No response
229 (18.9) 254 (21.0) 417 (34.4) 299 (24.7) 12 (1.0)
29 (5.0) 165 (28.6) 247 (42.7) 120 (20.8) 17 (2.9)
The results showed that most of the variables were not normally distributed. In
response to ranking the importance of priorities, Error! Reference source not found. shows a comparison of the responses between the general public and
service providers of the mean priority rankings for 12 services and treatments
adapted from other studies (171, 184). The table shows that both groups favor

103
treating children, with “treatment for children with life-threatening illnesses” as the
highest priority of both groups, and the treatment of premature babies as relatively
high. However, service providers placed preventative measures higher than the
general public, with “preventive screening services and immunization” as their
second priority. This trend was confirmed by seeing the greatest difference
between the two groups in the importance of health promotion and educational
services. Service providers placed greater importance on caring for the elderly
than the general public, which is reflected in a higher ranking for home-nursing
services (most often utilized by the elderly), and a higher ranking for treatment of
people aged 75 and over with life-threatening illness.
Table 5-4: Mean priority ranking of health services (1=highest priority)
Health services General public Service providers Mean Rank Mean Rank
Treatments for children with life threatening illnesses (i.e. leukemia)
2.13 1 2.17 1
Special care and pain relief for people who are dying (i.e. untreatable cancer)
3.19 2 4.66 4
Preventive screening services and immunization
5.19 4 3.43 2
Surgery, such as knee replacement, to help people carry out everyday tasks
5.44 5 5.25 7
Nursing and community services at home 7.56 12 6.38 9 Psychiatric services for people with mental Illness
6.28 8 5.44 8
High technology surgery, organ transplants and procedures which treat life threatening conditions
4.33 3 4.64 3
Health promotion/education services to help people lead healthy lives
6.63 10 4.91 5
Intensive care for premature babies with only a slight chance of survival
5.67 6 5.09 6
Long stay hospital care for elderly people 7.16 11 7.55 12 Treatment for infertility 6.47 9 6.84 11 Treatment for people aged 75 and over with life threatening illness
6.01 7 6.67 10

104
Respondents were asked ‘in your opinion, what other sources do you prefer for
additional funding for healthcare services in the country?’. The results of this
question are shown in Table 5-5. This question revealed greater agreement
between the two groups, with the only two answers statistically different: higher
tax on cigarettes (even though both groups placed this as their top choice), and a
wide disagreement over sending patients abroad for treatment.
Table 5-5: Preferred sources of additional funding for healthcare services in Kuwait
Sources of additional funding for health care service General public [n (%)]
Service providers [n (%)]
Higher tax on cigarettes* 711 (58.7) 420 (72.7) Tax on pollution (i.e. cars and factories) 459 (37.9) 216 (37.4) Decrease the budget allocated for sending patients abroad for treatment*
230 (19.0) 257 (44.5)
Decrease the budget of other Ministries such as the Ministry of Defense
211 (17.4) 85 (14.7)
Implementation of income tax 69 (5.7) 46 (8.0) Implementation of national health insurance 494 (40.8) 212 (36.7) Implementation of user charges for public healthcare services
125 (10.3) 59 (10.2)
Other 137 (11.3) 48 (8.3) *The difference between the percentage of the general public and service providers selecting this option is statistically significant (p<0.05)
The study also focused on the attitudes of respondents with respect to resource
allocation in healthcare. Error! Reference source not found. illustrates the
attitudes of the general public and service provider groups towards some resource
allocation questions that were adapted from a previous study (177). 26.5% of the
general public thought that public healthcare resources were sufficient to satisfy
all healthcare needs, while around 40% of service providers agreed to this
question. Similarly, 42.6% of service providers believed that public healthcare
resources are sufficient to always offer patients best possible care, while only 25%
of the general public thought so. The general public gave less consideration to
the cost of health services when compared to service providers. 84.3% of the
general public expressed that public healthcare should always offer best possible

105
care irrespective of the cost, while only 64.5% of service providers agreed with
this statement. Health service providers were more convinced that the general
public should be offered more opportunities to influence the allocation of
healthcare resources. Around 75% of service providers believed that the general
public should be offered more opportunities to influence healthcare resource
allocation, while only 56% of the general public agreed to this question. Regarding
the respondents’ attitudes towards decision-makers in the Ministry of Health, only
13% of the general public and 32% of service providers thought that decision-
makers were handling prioritisation in a good manner. Additionally, 80.3% of the
general public and 57.1% of service providers believed that more explicit
prioritisation should be made.
Table 5-6: Attitudes about the allocation of healthcare resources in Kuwait
Question General public [n ‘yes’ (%)]
Service providers [n ‘yes’ (%)
Do you think that public healthcare resources are sufficient to satisfy all healthcare need?*
321 (26.5) 230 (39.8)
Do you think that public healthcare resources are sufficient to always offer patients best possible care?*
301 (24.9) 246 (42.6)
Should public healthcare always offer best possible care, irrespective of costs?*
1021 (84.3) 373 (64.5)
Should simpler treatments or healthcare services be paid by the patients themselves (i.e. dental scaling)?
383 (31.6) 187 (32.4)
Should we invest more public resources in public Healthcare?
975 (80.5) 476 (82.4)
Should the general public be offered more opportunities to influence healthcare resource allocation?*
678 (56.0) 432 (74.7)
Do you think that decision makers in the Ministry of Health handle prioritisations in a good manner?*
157 (13.0) 185 (32.0)
Should decision makers in the Ministry of Health make more explicit prioritisations?*
972 (80.3) 330 (57.1)
*The difference between the percentage of the general public and service that responded with ‘yes’ to the questions is statistically significant (p<0.05)
In order to understand participants’ perceptions regarding healthcare costs, they
were asked to give their opinion on some statements that were adapted from a
previous study (179). Error! Reference source not found. shows the responses

106
of the general public and health service providers towards some statements
related to healthcare costs. Around 78% of the general public and 86% of service
providers chose to use a less effective but cheaper treatment if two types of
treatments existed for a certain disease. More than half of service providers
disagreed that money is spent on unnecessary things in healthcare, while only
40% of the general public disagreed to the same statement.
Table 5-7: Responses to statements on healthcare costs in Kuwait
Question General public [n (%)]
Service providers [n (%)]
If a disease has an effective treatment, the patient should be treated regardless of the expense
Agree 75 (6.2) 81 (6.7) 1055 (87.1)
44 (7.6) 41 (7.1) 493 (85.3)
No opinion Disagree
If two types of treatment exists, the cheaper one should be chosen, even if it is less effective*
Agree 947 (78.2) 103 (8.5) 161 (13.3)
499 (86.3) 40 (6.9) 39 (6.8)
No opinion Disagree
Money is spent on unnecessary things in healthcare*
Agree 394 (32.5) 335 (27.7) 482 (39.8)
138 (23.9) 118 (20.4) 322 (55.7)
No opinion Disagree
*The difference between the percentage of the general public group and service providers’ group responses is statistically significant (p<0.05)
Respondents’ perceptions of the adequacy of healthcare resources were also
evaluated. Error! Reference source not found. illustrates the views of the
respondents. The level of resources allocated for psychiatric services were
perceived to be too little by 41.8% of general public respondents and 26% of
service providers. More than half of respondents from both groups thought that
dental services received enough resources. Regarding services for elderly care,
around 37% of general public respondents believed that they were allocated too
few resources, while around 36% of service providers thought that these services
received enough resources. Similarly, with hospital care services, more than half
of the general public stated that the resources allocated were too few, while
around half of service providers believed that the resources received by this
service were adequate. Half of service providers thought that primary healthcare
services receive enough resources, but 37.5% of respondents from the general

107
public believed that this service received less than adequate resources. Also,
almost 36% of service providers expressed that end-of-life care received enough
resources, while around 39% of the general public respondents stated that these
services received too few resources. Drug addiction/rehabilitation services were
allocated too few resources in the eyes of 35% of respondents from the general
public, while 27% of respondents from service providers thought that these
services received adequate resources. Similarly, 40% of the general public stated
that health administration was receiving too few resources, while around 36% of
service providers stated that it was allocated adequate resources. Almost half of
service providers thought that child care services were allocated enough
resources, but 37.2% of the general public believed that these services received
too few resources.

108
Table 5-8: Respondents’ perception on the adequacy of resource allocation
Health service General public [n (%)]
Service providers [n (%)]
Psychiatric care* Too little 506 (41.8) 176 (14.5) 24 (2.0)
150 (26.0) 150 (26.0) 6 (1.0)
Enough Too much
Health education and prevention Too little 531 (43.9) 424 (35.0) 44 (3.6)
256 (44.3) 211 (36.5) 13 (2.3)
Enough Too much
Dental services* Too little 367 (30.3) 616 (50.9) 75 (6.2)
108 (18.7) 306 (52.9) 42 (7.3)
Enough Too much
Elderly care* Too little 444 (36.7) 440 (36.3) 67 (5.5)
168 (29.1) 206 (35.6) 58 (10.0)
Enough Too much
Hospital care* Too little 608 (50.2) 403 (33.3) 49 (4.1)
179 (31.0) 281 (48.6) 45 (7.8)
Enough Too much
Primary healthcare* Too little 454 (37.5) 452 (37.3) 38 (3.1)
162 (28.0) 289 (50.0) 35 (6.1)
Enough Too much
End-of-life care* Too little 473 (39.1) 243 (20.1) 49 (4.1)
150 (26.0) 205 (35.5) 29 (5.0)
Enough Too much
Drug addiction/rehabilitation care* Too little 428 (35.3) 208 (17.2) 51 (4.2)
151 (26.1) 158 (27.3) 8 (1.4)
Enough Too much
Healthcare information Too little 510 (42.1) 324 (26.8) 41 (3.4)
261 (45.2) 194 (33.6) 19 (3.3)
Enough Too much
Healthcare administration* Too little 489 (40.4) 309 (25.5) 47 (3.9)
176 (30.5) 205 (35.5) 47 (8.1)
Enough Too much
Child care* Too little 451 (37.2) 432 (35.7) 61 (5.0)
150 (26.0) 283 (49.0) 24 (4.2)
Enough Too much
*The difference between the percentage of the general public group and service providers’ group responses is statistically significant (p<0.05)
The perception of the general public and health service providers regarding some
‘hot topics’ in the health policy arena in the country and the amount of resources
allocated for such schemes were important to this study. Two of these policies
were the policy of sending patients abroad for treatment and the policy of private
109
health insurance for retirees (Afya). The following section included the responses
of Kuwaiti participants only, since these policies are exclusive to Kuwaiti nationals.
Our results have shown that 82.9% of respondents from the general public stated
that they knew of the policy of sending patients abroad for treatment. Among those
who knew of the policy, 64.2% claimed that they or one of their relatives benefited
from this service. As for service providers, 64.6% of participants indicated that
they knew of the policy of sending patients abroad for treatment, and 66.7% of
these respondents stated that they or one of their relatives benefited from this
policy.
summarises these findings.
The results have shown some differences in the attitudes of both groups towards
the policy of sending patients abroad for treatment that were statistically
significant. More than half of the respondents from both groups believed that the
policy was costly/expensive, was misused, and is politically driven. Members of
the general public agreed more to these statements than the service providers.
More than half of the general public believed that beneficiaries of this policy were
sent abroad without real medical indication whereas 42% of service providers
agreed to this statement. Around 38% of service providers and 32% of the general
public respondents expressed their acceptance that most specialised treatments
are available in the country. When asked if this policy was a constitutional right
for citizens, around 44% of the general public agreed to this statement, while
around 30% of service providers agreed to it. When asked if this policy had
advantages, more than half of service providers could not agree nor disagree,
while around 65% of the general public stated that this policy did have several
advantages. More than half of the participants from both groups agreed that this
policy has decreased the trust in the local healthcare system.

110
Table 5-9: Respondents’ opinions on the policy of sending patients abroad for treatment
Question Responses General public [n (%)]
Service providers [n (%)]
The policy of sending patients abroad is costly/expensive*
SA and A 555 (59.0%) 334 (35.5%) 52 (5.5%)
111 (52.9%) 95 (45.2%) 4 (2.0%)
N D and SD
The policy of sending patients abroad is misused*
SA and A 586 (62.3%) 293 (31.1%) 62 (6.6%)
122 (58.1%) 82 (39%) 6 (2.9%)
N D and SD
The policy of sending patients abroad is politically driven*
SA and A 528 (56.1%) 388 (41.2%) 25 (2.7%)
106 (50.5%) 100 (47.5%) 4 (2.0%)
N D and SD
Most cases sent abroad for treatment without real medical indication*
SA and A 475 (50.5%) 369 (39.2%) 97 (10.3%)
89 (42.4%) 104 (49.5%) 17 (8.1%)
N D and SD
Most specialised treatments are available locally*
SA and A 303 (32.2%) 454 (48.2%) 184 (19.6%)
80 (38.1%) 102 (48.5%) 28 (13.4%)
N D and SD
It is a constitutional right to have the option of being sent abroad for treatment*
SA and A 413 (43.9%) 460 (48.9%) 68 (7.2%)
64 (30.4%) 106 (50.5%) 40 (19.1%)
N D and SD
Sending patients abroad for treatment has several advantages*
SA and A 616 (65.5%) 301 (32.0%) 24 (2.5%)
90 (42.9%) 106 (50.5%) 14 (6.6%)
N D and SD
Sending patients abroad for treatment has decreased the trust in the local health system*
SA and A 475 (50.4%) 378 (40.3%) 88 (9.3%)
109 (51.9%) 93 (44.2%) 8 (3.9%)
N D and SD
Patients prefer to be treated in their home country around their families
SA and A 478 (50.8%) 375 (39.9%) 88 (9.3%)
65 (31.0%) 112 (53.3%) 33 (15.7%)
N D and SD
SA and A=strongly agree and agree, N=neither agree nor disagree, D and SD= disagree and strongly disagree *The difference between the percentage of the general public group and service providers’ group responses is statistically significant (p<0.05) Regarding the policy of private health insurance for retirees (Afya), the results
show that 77.8% participants from the general public stated that they knew of the
policy. For that same group, 74.4% of the respondents that knew of the policy
expressed that they or any of their relatives benefited from this scheme. As for
service providers, 58.7% participants indicated that they knew of the policy of
private health insurance for retirees (Afya), and 73.0% of them stated that they or

111
any of their relatives benefited from this policy. Error! Reference source not found. shows the responses of the general public and service providers to some
statements, which were also mentioned by hospital managers in a previous
qualitative study (Chapter 4), about the policy of purchasing private health
insurance on behalf of retirees (Afya).
Table 5-10: Respondents’ opinions on the policy of private health insurance for retirees (Afya)
Question Responses General public [n (%)]
Service providers [n (%)]
The health insurance for retirees policy is a good policy*
SA and A 601 (63.9%) 296 (31.4%) 44 (4.7%)
71 (33.9%) 116 (55.2%) 23 (10.9%)
N D and SD
The health insurance for retirees policy has clear objectives*
SA and A 479 (50.9%) 380 (40.4%) 82 (8.7%)
57 (27.1%) 107 (51%) 46 (21.9%)
N D and SD
The health insurance for retirees policy decreased load on public health services *
SA and A 531 (56.4%) 366 (38.9%) 44 (4.7%)
93 (44.3%) 101 (48.1%) 16 (7.6%)
N D and SD
The health insurance for retirees policy promoted patient choice*
SA and A 608 (64.6%) 314 (33.4%) 19 (2.0%)
93 (44.3%) 109 (51.9%) 8 (3.8%)
N D and SD
The health insurance for retirees policy is misused
SA and A 122 (13.0%) 540 (57.4%) 279 (29.6%)
22 (10.5%) 120 (57.1%) 68 (32.4%)
N D and SD
The health insurance for retirees policy is a step towards privatising healthcare *
SA and A 42 (4.5%) 451 (47.9%) 448 (47.6%)
11 (5.3%) 124 (59.0%) 75 (35.7%)
N D and SD
The health insurance for retirees policy promotes inequality*
SA and A 266 (28.3%) 458 (48.6%) 217 (23.1%)
35 (16.6%) 132 (62.9%) 43 (20.5%)
N D and SD
The beneficiaries of the health insurance for retirees policy should be increased*
SA and A 509 (54.1%) 373 (39.6%) 59 (6.3%)
57 (27.2%) 120 (57.1%) 33 (15.7%)
N D and SD
The treatment package of the health insurance for retirees policy should be increased*
SA and A 563 (59.8%) 355 (37.7%) 23 (2.5%)
58 (27.7%) 121 (57.6%) 31 (14.7%)
N D and SD
SA and A=strongly agree and agree, N=neither agree nor disagree, D and SD= disagree and strongly disagree *The difference between the percentage of the general public group and service providers’ group responses is statistically significant (p<0.05)

112
Similar to the respondents’ attitudes towards the policy of sending patients
overseas for treatment, their attitudes towards the policy of private health
insurance for retirees also had some significant differences. Almost 64% of
members of the general public stated that the policy of private health insurance
for retirees was a good policy, while only around 34% of service providers agreed
to this statement. More than half of the respondents from the general public
believed that the policy had clear objectives and that it decreased the load on
public health services. On the other hand, only 27% of service providers thought
that the policy had clear objectives, and 44% of them expressed that the policy
has decreased the load on public health services. While the majority of members
from the general public thought that Afya promoted patient choice for its
beneficiaries, only 44% of service providers shared the same understanding.
Around 48% of respondents from the general public and 36% of service providers
did not think that the policy was a step towards privatising healthcare. Another
difference in attitudes towards this policy was that 28% of the general public
thought that it promoted inequality, while 17% of service providers shared the
same opinion. Also, more than half of the members from the general public
expressed their preference to increase the number of beneficiaries as well as the
treatment package of the policy, while only around 27% of service providers
agreed to this statement.
5.4 Discussion
This study seeks to identify differences in perceptions about healthcare priorities
between the general public, and health service providers in Kuwait so that policy-
makers have a better understanding of how their programmes might be improved.
The study concludes that the public places far less value on health education and
preventative healthcare than the professionals. Predictably, when it comes to our
own health, or the health of our loved ones, people want the best possible
healthcare, regardless of cost. However, at the national level, there are necessary

113
trade-offs that are apparent in this study when healthcare professionals recognize
both the limitations of medicine, and the benefits of prevention. The survey reveals
widespread dissatisfaction with resource allocation in Kuwait.
Studies evaluating the preferences of members of the general public and health
service providers have been performed in several low-, middle- and high-income
countries (171, 173, 176, 180, 186). In a study in Australia, Wiseman found that
the preferences of health professionals and members of the general public were
similar (192). Lees et al. (180) alternatively found some differences between the
preferences of the public and clinicians regarding health resource allocation.
When respondents were asked to rank some health services, public and providers
did not have substantial differences in their choices. The responses of both groups
showed a preference for treating the young rather than the old, which was similar
to findings from other studies (171, 184). The general public preferred the more
expensive health services that had immediate effects rather than health promotion
and health services for the elderly. Also, both groups ranked “high technology
surgery, organ transplants and procedures which treat life-threatening conditions”
as their third preference. This may indicate the willingness to pay for high tech
lifesaving treatments, which was also similar to other studies (184). In other
studies, it was found that the most influential factor in the process of setting
priorities was the severity of disease (173).
When asked about their preferred source of additional funding for health services
in the country, most participants from both groups believed that increasing tax on
cigarettes was the option of choice. More members from the service providers
group though (72.7%) preferred this option when compared to 58.7% of the
general public group. In a study that took place in the UK, Lees et al. (180) have
found that 79% of clinicians chose to have higher tax on cigarettes and alcohol to

114
provide extra money for the NHS. In our study, only 5.7% of the general public
and 8% of service providers preferred the implementation of income tax as a
source of additional funding for health services in the country. This low number
could be explained by the current situation in the country, which lacks any income
tax policy. When compared to the work of Lees et al. (180), they have found the
37% of general public and 55% of clinicians chose to have higher income tax to
increase funding for the NHS in their study. Alternatively, 41% of the general
public and 37% of service providers preferred the implementation of national
health insurance as a source of additional funding for health services in the
country in this study. Of less important options, efficient management of public
health services; reduction in the number of high government officials; and
decreasing budgets allocated for hospitality and gifts in the governmental sector
were of other suggestions proposed by respondents as sources of additional
funding for health services. Some of these suggestions were similar to what Lees
et al. found in their study (180).
With regards to healthcare resources, 26.5% of the general public and 39.8% of
service providers thought that public healthcare resources were sufficient to
satisfy all healthcare needs, and 24.9% of the general public and 42.6% of service
providers believed that public healthcare resources are sufficient to always offer
patients best possible care. Almost 10% of participants had the same response
to both questions in a study performed in Sweden (177). The majority of both
groups in our study believed that public healthcare should always offer best
possible care, irrespective of costs. This finding was similar to the findings of
Rosen in Sweden (177).
The age of participants could influence their decisions regarding the allocation of
health resources. In a study performed by Werntoft et al. (179) that included
individuals who were 65 years of age or above living in southern Sweden, 44% of

115
respondents agreed that patients should pay for their treatment if they have
caused their disease themselves. Alternatively, around 69% of the general public
and 54% of service providers agreed to the same statement in our study. Another
variation was that 32% of older people in Sweden believed that rich people should
pay for their treatment (179), whereas the majority of both groups of our study
agreed to this statement. More than 85% of respondents from both groups in our
study disagreed to the statement “if a disease has an effective treatment, the
patient should be treated regardless of the expense”, while 7% of older people in
Sweden disagreed to the same statement (179). 41% of Swedish elderly believed
that money was spent on unnecessary things in healthcare (179), whereas around
33% of the general public and 24% of service providers in our study shared the
same perception. It was also identified that the age of respondents could influence
their perception regarding the adequacy of healthcare resources. Werntoft et al.
(179) described that 46% and 49% of respondents from southern Sweden stated
that they believed that dental services and elderly care respectively have received
too little resources. When compared to our study, the majority of both groups of
respondents stated that dental services in the country received enough resources.
Also from our results, around 37% of the general public and 29% of service
providers believed that elderly care received too little resources. Additionally, the
results of the study of Werntoft et al. (179) showed that there was a demand to
increase the resources allocated for healthcare.
The differences in perception regarding the policy of sending patients abroad for
treatment and private health insurance for retirees was very obvious between the
two groups included in this study. A possible explanation for this finding might be
that one group is better informed than the other group. Otherwise, this could be
explained by the composition of the two groups, since Kuwaiti nationals compose
the general public group predominantly, whereas Non-Kuwaitis make up the
majority of the service providers group.

116
Previous studies have found various attitudes towards the participation of the
public in setting healthcare priorities. Bowling (171) explained that most people in
Great Britain wanted to participate in the planning of health services. In another
research performed in the UK on the other hand, Litva et al. (193) found
differences in the willingness of members of the public to be involved in making
healthcare decisions. Some studies mentioned that the involvement of the public
in healthcare rationing is dependent on the nature of the participation process,
and may vary substantially from consultative procedures to delegated citizen
power and control (192). It was argued that public involvement in the process of
setting healthcare priorities is vital as it assists in legitimising the process and
subsequent outcomes (177, 192). However, some researchers have emphasised
on the importance of adopting innovative and meaningful methods of
incorporating public views in healthcare decision-making (180). In order to be able
to achieve that, some studies have explained that the public needed to be
provided with sufficient information for them to make healthcare decisions (193).
It was argued that involving the public in healthcare rationing could gradually help
in educating people, and create a better platform for resource allocation in the
future (177). Rosen (177) debates that starting a dialogue with the public does not
implicate the introduction of new claims, but rather that support for essential but
sometimes unpopular decisions.
Several approaches have been proposed to involve the public in setting
healthcare priorities and allocating resources. Rosen (177) explains that
information, surveys, and public meetings are of various means that could be used
in establishing a public dialogue as a first step for involving the public in healthcare
rationing. One of the approaches of involving the public in healthcare decision-
making was the quality-adjusted life year (QALY)-maximisation model, which was
evaluated by Bryan et al. (187). Another approach of engaging the public in
healthcare priority setting is Choosing Healthplans All Together (CHAT). Goold et

117
al. (176) explain that this exercise had several advantages including the ease of
use, informativeness, and enjoyment. They continue to describe that the
respondents in their study found the information realistic and comprehensive,
thought the group decision-making process just, and were willing to abide by
decisions made by the group (176). They conclude that CHAT has a potential to
be used as a tool to encourage group discussions, produce collective choices,
and include the preferences and values of service users into allocation decisions
(176). Discrete choice experiment (DCE) was another approach for involving the
public in healthcare prioritisation (178). Watson et al. (178) explain that DCE
allows for the inclusion of the public views in an accessible, transparent, and
streamlined decision-making process, which is theoretically valid and practical.
On the other hand, Abelson et al. (174) argue that more effective, informed and
meaningful public participation could be achieved by using deliberative methods.
Mossialos and King (182) explain that procedures such as focus groups, citizens’
juries, and the intensive discussion approach are both informing and deliberative,
but require experience in order to be used in public consultation exercises on
setting healthcare priorities.
There are several challenges facing public participation in setting healthcare
priorities. It was also mentioned that evaluating the effect of public participation
on policy decision-making remains difficult (175). Litva et al. (193) have found that
members of the public understood that their involvement might not lead to change
decisions. They add that most of the public had little will to share in the
responsibility for healthcare decision-making (193). Rosen (177) explains that one
of the criticisms toward the introduction of public participation in healthcare
rationing was that participants do not usually base their decision on firm evidence
and brotherly feelings. In another study where different responses between
doctors, administrators and members of the public were identified, Rosen and
Karlberg (183) argue that such differences in healthcare rationing could be

118
explained by the greater experience and knowledge of doctors and administrators
about the costs and benefits of different interventions. They further explain that
members of the public might lean towards having an ideal situation, while the
practical insight on the unavoidable finiteness of healthcare resources resulted in
the more restrictive attitudes of doctors and managers (183). It was argued that
public involvement in setting healthcare priorities should ideally be based not only
on a better public understanding of economic certainties, but also on deeper
feeling of responsibility (177, 183).
Studies have found that members of the general public reported that personal
experiences and knowledge of the layperson, patients and their families should
be a complement to the expertise of healthcare professionals when making
healthcare decisions (192, 193). Wiseman argues that the people who were less
educated or have little knowledge of or experience with healthcare services could
find it challenging to answer questions in a practical setting (192). She then
concluded that it is challenging to formulate priority-setting questions that replicate
the complexity of real-life decision-making, while being easily intelligible to both
health professionals as well as members of the general public (192). Although
some studies have shown that members of the public could choose equal
opportunity, fair resource allocation, and equality (173), it was mentioned in other
studies that one of the main problems of involving the public in healthcare
rationing was that the priorities chosen by the public may not represent the most
cost-effective allocation of resources, and may not necessarily offer the most
equitable solutions of equal treatment for equal need (171, 180). It was mentioned
by some studies that the public tend to focus on curative services and disregard
the more ordinary services, such as mental health (180, 181).

119
5.5 Limitations
As mentioned in other studies, participants might have felt some restriction in the
range and type of their responses because of the use of closed-ended questions
(181, 192, 194). Also, similar to criticism other studies have received about this
method, the ranking of health services question may be considered superficial in
relation to the difficulty of the process of setting healthcare priorities, which
requires consideration of the cost and effectiveness of treatment and care
programmes rather than relying exclusively on values that may include
preconceptions (171). Moreover, the findings of this study allow to obtain
conclusions only related to the situation in Kuwait.
5.6 Conclusion
Both the general public and health service providers preferred treating the young
rather than the old, while the general public preferred the more expensive health
services that had immediate effects rather than health promotion and health
services for the elderly. Such differences suggest a need for public education
about the value of preventative medicine, and the trade-offs involved when
dividing a finite resource to where it can help the most people.
Public involvement can legitimise healthcare policy decisions, but it is important
to adopt innovative and meaningful methods of incorporating public views in
healthcare decision-making. Therefore, the public needs to be provided with
sufficient information for them to make healthcare decisions.

120
Chapter 6 Conclusion
Using the relevant empirical studies, this thesis aims to explore ways to improve
the efficiency of health spending in Kuwait. Due to the rising rates of non-
communicable diseases (NCDs), advances in technology and falling oil prices,
the sustainability of government funding within the healthcare sector is being
challenged. A literature review was performed, revealing a gap in the evidence of
evaluating the efficiency of the health system in Kuwait. With regards to this
evidence gap, an empirical analysis was conducted in each chapter. These
analyses evaluated the efficiency of hospitals, the largest providers within the
country’s health sector, and explored the process of priority setting in healthcare
provision, which would help decision-makers to improve the sustainability of the
health system in the country.
The analyses in this thesis evaluated both technical and allocative efficiency of
the health system in the country. Using a two-staged data envelopment analysis
and qualitative study, the technical efficiency of public hospitals in Kuwait was
measured and some determinants of hospital efficiency were investigated. Then
the priority setting and resource allocation process in the health system from the
perspective of hospital managers was evaluated. It also attempted to elicit the
preferences of health service providers and members of the general public
regarding healthcare priorities. To the best of our knowledge, all these case
studies are first attempts in the context of Kuwait.
To summarize, chapter 3 showed that only three public hospitals (20%) were
constantly technically and scale efficient during the period from 2010 to 2014. It
also showed that the average length of stay is a significant determinant of the
hospitals’ technical efficiency; indicating that the higher the average length of stay,
the lower overall technical efficiency and lower scale efficiency. The findings also

121
showed that the larger hospitals (i.e. hospitals with more than 400 beds) were
potentially more technically and scale efficient. Hospital managers believed that
a group of external factors (such as implementing legislative changes and
decreasing bureaucracy or increasing autonomy) and internal factors (such as
increasing bed capacity, improving qualifications, and training) can improve the
efficiency of public hospitals. Chapter 4 reported that hospital managers think that
healthcare priority-setting is not evidence-based due to the lack of accurate and
timely data and poor communication. It was also found that the process to contract
highly skilled expatriate physicians is bureaucratic and long, which handicaps
Kuwait in competition with other countries in the region to attract these
professionals. The analysis also showed that a lack of autonomy and poor
administrative skills for managers working in the public health sector. Most
respondents from both public and private sectors believed that the disadvantages
of the policy of sending patients abroad for treatment outweigh its advantages.
The managers from both sectors had different perceptions regarding the private
health insurance for retirees’ policy. Chapter 5 outlined both similarities and
differences between health service providers and members of the general public
with regards to aspects of resource allocation in healthcare. The general public
preferred the more expensive health services that had immediate effects rather
than health promotion and health services for the elderly. 26.5% of the general
public thought that public healthcare resources were sufficient to satisfy all
healthcare needs compared to 40% of service providers. The most popular option
for additional healthcare funding for both groups was higher tax on cigarettes,
while the least popular option for both groups was the implementation of income
tax. This is not surprising, since most people in Kuwait don’t smoke, but all would
be subject to income tax. To the contrary, around 41% of the general public and
37% of health service providers preferred the implementation of national health
insurance as a source of additional funding for healthcare services. 44.5% of
service providers preferred to decrease the budget allocated for sending patients

122
abroad as a source of additional funding, while only 19% of the general public
group chose the same option. More than half of the respondents from both groups
believed that the policy of sending patients abroad was costly/expensive, was
misused, and is politically driven. Almost 64% of members of the general public
group stated that the policy of private health insurance for retirees was a good
policy, while only around 34% of participants from the service providers group
agreed to this statement.
By referring to the research question that was raised in the introduction of this
thesis, and by relying on the results of each analytical chapter, a list of
recommendations for decision-makers and researchers could be raised.
From the findings of chapter 3, clinicians and hospital managers should decrease
the average length of stay, as much as possible, to increase the efficiency of
public hospitals. Also, public hospital managers should receive training in
healthcare policy, management and/or economics. Such skills would enable them
to better manage both human resources and budgets. Therefore, implementing a
provider payment reform would be necessary to give more flexibility to hospital
managers in allocating the budget within their hospitals and hence improve
efficiency. Additionally, an incentive system for clinicians that improve the
efficiency of their departments should be developed. Installing an integrated
health information system, and providing sufficient training to clinical and
administrative staff, could improve all the processes that were mentioned
previously.
From chapter 4, the presence of an evidence-based National Health Strategy for
the country, with clear objectives that are well communicated to all stakeholders,
is an important step to improve the process of priority setting in the health system.
Once it is published, decision-makers must then comply with such a strategy.The

123
strategy should not change whenever there is a change of leadership in the
Ministry of Health, nor with political interference. The change in the Laws of Civil
Service to meet the demands of the current working environment, and to facilitate
the recruitment process of skilled professionals, is another recommendation
drawn from this chapter. Another recommendation was to decrease the
bureaucracy in the public health sector by decentralising decision-making, and
giving more responsibility for regional directors. Also, the use of economic
principles and/or evidence from economic evaluation studies would improve the
process of priority-setting within the health system. This is especially important
when evaluating the economic impact of certain policies, such as the private
health insurance for retirees, on the system. Given the overcapacity of secondary
and tertiary care facilities that are under construction, increased efforts to reduce
the number of people seeking these forms of care abroad is recommended.
Based on the findings in chapter 5, it is vital to increase the awareness of the
general public, through innovative and meaningful methods, on the long-term
effect of interventions such as health promotion and health prevention on the
general health status of the population as well as the sustainability of the health
system. This is considered to be of great value because involving the public in
setting healthcare priorities is believed to assist in legitimising the process.
Therefore, the public needs to be provided with sufficient information, such as the
economical impact of expensive interventions and policies (for example, patients
seeking care abroad and private health insurance for retirees in the context of
Kuwait), for them to contribute effectively in the decision-making process.
As has been discussed throughout this work, there is room to improve the
technical and allocative efficiency of health spending in Kuwait. This thesis urges
decision-makers in the country to work on policy reforms to improve the financial
sustainability of the health system. Of the recommendations that could be

124
provided is that key decision makers in the health sector should have experience
and education in health policy, health management, health economics, and/or
public health. They should also be given the time, resources and support to
implement their strategies. In terms of organisation, there should be a separation
in the roles of health regulation, financing and provision. The current structure,
where all these roles are retained by the MoH, creates conflict of interest.
Additionally, full costing of health services as well as more sophisticated methods
of financing should be utilised.
Further research using more sophisticated method is highly recommended. But
for these activities to have an effect, there should be regular collection of accurate
data, and the outcomes of these efforts should be considered of value by policy
makers.

125
References
1. Health Mo. World Health Survey in Kuwait: Main Report 2013. Kuwait: Ministry of Health; 2013. 2. Organization WH. Country Cooperation Strategy for WHO and Kuwait 2012–2016. 2014. 3. The World Bank Group. 2014 [cited 23 November 2014]. 4. Division) MoHHaVS. Annual Health Report 2017. 2018. 5. WHO. Country Cooperation Strategy for WHO and Kuwait 2012–2016. 2014. 6. MOH. World Health Survey in Kuwait: Main Report 2013. Kuwait: Ministry of Health; 2013. 7. MOH. Fiscal Report. In: Finance Do, editor. Kuwait: MOH; 2018. 8. Mossialos E, Cheatley J, Reka H, Alsabah A, Patel N. Kuwait Health System Review. London: London School of Economics and Political Sciences (LSE Health); 2018. 9. WHO. Development of a New National Health Sector Strategy for the State of Kuwait. 2017. 10. Agency KN. Cabinet revamps overseas treatment regulations, expertise law2014 19/12/2014. 11. Finance Mo. Parliamentary Question by MP Rakan Alnisf. Kuwait2015. 12. Administration IT. State of Kuwait: Overview of the healthcare sector. Kuwait: International Trade Administration (Department of Commerce); 2013. 13. IMSH. Market Overview 2016: Kuwait. United States: IMH Health and Kuwait Life Sciences Company; 2016. 14. MOH. Private health insurance for retirees. In: Department of Finance M, editor. Kuwait: MOH; 2017. 15. KUNA. Finance Minister presents six-point economic reform document to cabinet. The Times. 2016. 16. WHO. Development of a New National Health Sector Strategy for Kuwait (2018-2022). 2017. 17. WHO Regional Office for the Eastern Mediterranean. 2014 [cited 23 November 2014]. 18. Number of people (all ages) living with HIV: Estimates by country [Internet]. Global Health Observatory data repository. 2018 [cited 22 May 2019]. Available from: http://apps.who.int/gho/data/node.main.620?lang=en. 19. Mokdad A, Jaber S, Abdel Aziz M, AlBuhairan F, AlGhaithi A, AlHamad N, et al. The state of health in the Arab world, 1990–2010: an analysis of the burden of diseases, injuries, and risk factors. The Lancet. 2014;383:309-20. 20. Evaluation IfHMa. GBD Profile: Kuwait. Report. Seattle, USA: University of Washington; 2010 2010.

126
21. Strategy&. The 68$ billion challenge: Quantifying and tackling the burden of chronic diseases in the GCC. 2013. 22. Evaluation IfHMa. Kuwait: Country Profile Seattle, USA: University of Washington; 2019 [Available from: http://www.healthdata.org/kuwait. 23. GBD 2004 summary tables [Internet]. Health statistics and informatics Department, World Health Organization. 2008 [cited December 2015]. 24. Almazeedi H, Alsuwaidan M. ‘‘Integrating Kuwait’s Mental Health System to end stigma: a call to action’’. Journal of Mental Health. 2014;23(1):1-3. 25. Scull N, Khullar N, Al-Awadhi N, Erheim R. A Qualitative Study of the Perceptions of Mental Health Care in Kuwait. International Perspectives in Psychology: Research, Practice, Consultation. 2014;3(4):284-99. 26. Jaalouk D, Okasha A, Salamoun M, Karam E. Mental health research in the Arab world. Social Psychiatry and Psychiatric Epidemiology. 2012;47(11):1727-31. 27. AlArouj M, Bennakhi A, Alnesef Y, Sharifi M, Elkum N. Diabetes and associated cardiovascular risk factors in the State of Kuwait: the first national survey. International Journal of Clinical Practice. 2013;67(1):89-96. 28. Saad H, Sawan S, Rashed W, Zubaid M. Influence of Diabetes on the Outcome of Acute Coronary Syndrome in Kuwait. Medical Principles and Practice. 2010;19:113-7. 29. Kilpi F, Webber L, Musaigner A, Aitsi-Selmi A, Marsh T, Rtveladze K, et al. Alarming predictions for obesity and non-communicable diseases in the Middle East. Public Health Nutrition. 2013;17(5):1078-86. 30. Federation ID. IDF Diabetes Atlas. 2017. 31. Abdella N, Al Arouj M, Al Nakhi A, Al Assoussi A, Moussa M. Non-insulin-dependent diabetes in Kuwait: prevalence rates and associated risk factors. Diabetes Research and Clinical Practice. 1998;42:187-96. 32. Al-Adsani A, Abdulla K. Reasons for hospitalizations in adults with diabetes in Kuwait. International Journal of Diabetes Mellitus [Internet]. 2011. 33. IDF. IDF Diabetes Atlas. International Diabetes Federation; 2013. 34. Behbehani K. Kuwait National Programme for Healthy Living: First 5-Year Plan (2013–2017). Medical Principles and Practice. 2014;23(suppl 1):32-42. 35. Al Rashdan I, Al Nesef Y. Prevalence of Overweight, Obesity, and Metabolic Syndrome Among Adult Kuwaitis: Results From Community-based National Survey. Angiology. 2010;61(1):42-8. 36. Mabry R, Reeves M, Eakin E, Owen N. Gender differences in prevalence of the metabolic syndrome in Gulf Cooperation Council Countries: a systematic review. Diabetic Medicine. 2010;27:593-7. 37. Badr H, Shah N, Shah M. Obesity Among Kuwaitis Aged 50 Years or Older: Prevalence, Correlates, and Comorbidities. The Gerontologist. 2012;53(4):555-66.

127
38. Ramadan J, Vuori I, Lankenau B, Schmid T, Pratt M. Developing a national physical activity plan: the Kuwait example. Global Health Promotion. 2010;17(2):52-7. 39. Ng M, Fleming T, Robinson M, Thomson B, Graetz N, Margono C, et al. Global, regional, and national prevalence of overweight and obesity in children and adults during 1980–2013: a systematic analysis for the Global Burden of Disease Study 2013. The Lancet. 2014;384:766-81. 40. Al-Kandari Y. Prevalence of obesity in Kuwait and its relation to sociocultural variables. Obesity Reviews. 2006;7:147-54. 41. Zaghloul S, Al-Hooti S, Al-Hamad N, Al-Zenki S, Alomirah H, Alayan I, et al. Evidence for nutrition transition in Kuwait: over-consumption of macronutrients and obesity. Public Health Nutrition. 2012;16(4):596-607. 42. Klautzer L, Becker J, Mattke S. The curse of wealth–Middle Eastern countries need to address the rapidly rising burden of diabetes. International journal of health policy and management. 2014;2(3):109. 43. Organization WH. Noncommunicable Diseases (NCD) Country Profiles. WHO; 2014. 44. WEF. The Global Economic Burden of Non-communicable Diseases. Geneve, Switzerland: World Economic Forum; 2011. 45. IDF. IDF Diabetes Atlas. International Diabetes Federation; 2015. 46. Macrotrends. Crude Oil Prices: Macrotrends; 2020 [Available from: https://www.macrotrends.net/1369/crude-oil-price-history-chart. 47. Economics T. Crude Oil Forecast: Trading Economics; 2020 [Available from: https://tradingeconomics.com/commodity/crude-oil. 48. WHO. The World health report: 2000: Health systems: improving performance. 2000. 49. Palmer S, Torgerson DJ. Definitions of efficiency. Bmj. 1999;318(7191):1136. 50. Smith PC, Street A. Measuring the efficiency of public services: the limits of analysis. Journal of the Royal Statistical Society: Series A (Statistics in Society). 2005;168(2):401-17. 51. Afonso A, St Aubyn M. Relative efficiency of health provision: A DEA approach with non-discretionary inputs. ISEG-UTL Economics Working Paper. 2006(33). 52. Jafarov E, Gunnarsson V. Government spending on health care and education in Croatia: efficiency and reform options. IMF Working Papers. 2008:1-34. 53. Reinhardt UE. Reflections on the meaning of efficiency: can efficiency be separated from equity? Yale law & policy review. 1992:302-15. 54. Chisholm D, Evans DB. Improving health system efficiency as a means of moving towards universal coverage. World health report. 2010. 55. Culyer AJ. The morality of efficiency in health care—some uncomfortable implications. Health economics. 1992;1(1):7-18.

128
56. Mills A. Improving the efficiency of public sector health services in developing countries: bureaucratic versus market approaches. 1995. 57. Tandon A, Lauer JA, Evans DB, Murray CJ. Health system efficiency: concepts. Health systems performance assessment: Debates, methods and empiricism Geneva: World Health Organization. 2003:683-92. 58. Burney NA, Mohammad OE, Al-Ramadhan MA. Assessing the cost of inefficiencies: The case of the public health care system in Kuwait. International Social Science Review. 1999;74(1/2):20. 59. Bevan G, Helderman J-K, Wilsford D. Changing choices in health care: implications for equity, efficiency and cost. Health economics, policy, and law. 2010;5(3):251-67. 60. Gerdtham U-G, Rehnberg C, Tambour M. The impact of internal markets on health care efficiency: evidence from health care reforms in Sweden. Applied Economics. 1999;31(8):935-45. 61. Kruk ME, Freedman LP. Assessing health system performance in developing countries: a review of the literature. Health policy (Amsterdam, Netherlands). 2008;85(3):263-76. 62. Light DW. Equity and efficiency in health care. Social science & medicine (1982). 1992;35(4):465-9. 63. Cutler DM. Equality, efficiency, and market fundamentals: the dynamics of international medical-care reform. Journal of economic literature. 2002:881-906. 64. Kotzian P. Value for money: health system efficiency and preferences for health care. Canadian Journal of Political Science. 2009;42(03):729-48. 65. Oxley H, MacFarlan M. Health care reform controlling spending and increasing efficiency. 1994. 66. Joumard I, André C, Nicq C. Health care systems: efficiency and institutions. 2010. 67. Kwon S. Healthcare financing reform and the new single payer system in the Republic of Korea: Social solidarity or efficiency? International Social Security Review. 2003;56(1):75-94. 68. Menzel PT. Equality, autonomy, and efficiency: what health care system should we have? The Journal of medicine and philosophy. 1992;17(1):32-57. 69. International T. Global Corruption Report 2006. London, UK; 2006. 70. Häkkinen U, Joumard I. Cross-Country Analysis of Efficiency in OECD Health Care Sectors. 2007. 71. Liu Y, Rao K, Wu J, Gakidou E. China's health system performance. Lancet. 2008;372(9653):1914-23. 72. Suraratdecha C, Okunade AA. Measuring operational efficiency in a health care system: a case study from Thailand. Health policy (Amsterdam, Netherlands). 2006;77(1):2-23. 73. Hofmarcher MM, Oxley H, Rusticelli E. Improved health system performance through better care coordination. 2007.

129
74. Segal L, Richardson J. Economic framework for allocative efficiency in the health sector. Australian economic review. 1994;27(2):89-98. 75. Vagero D. Equity and efficiency in health reform. A European view. Social science & medicine (1982). 1994;39(9):1203-10. 76. Kumar S, Ghildayal NS, Shah RN. Examining quality and efficiency of the U.S. healthcare system. International journal of health care quality assurance. 2011;24(5):366-88. 77. Murray CJ, Frenk J. A WHO framework for health system performance assessment: Evidence and Information for Policy, World Health Organization; 1999. 78. Handler A, Issel M, Turnock B. A conceptual framework to measure performance of the public health system. American journal of public health. 2001;91(8):1235-9. 79. Gerdtham UG, Lothgren M, Tambour M, Rehnberg C. Internal markets and health care efficiency: a multiple-output stochastic frontier analysis. Health economics. 1999;8(2):151-64. 80. Flessa S. Where efficiency saves lives: a linear programme for the optimal allocation of health care resources in developing countries. Health care management science. 2000;3(3):249-67. 81. Smith PC. Measuring health system performance. The European journal of health economics : HEPAC : health economics in prevention and care. 2002;3(3):145-8. 82. Sabah AASA. Kuwait's Constitution. Kuwait: Amir of the State of Kuwait; 1962. 83. MOH. National health accounts: Health expenditure of most important sectors in the State of Kuwait 2011/2012. Kuwait: MOH; 2016. 84. The World Bank Group. 2019 [cited 17 May 2019]. Available from: http://databank.worldbank.org/data/home.aspx. 85. Osmani AR. Technical Efficiency of District Hospitals in Afghanistan: A Data Envelopment Analysis Approach: Chulalongkorn University; 2012. 86. Hollingsworth B, Parkin D. The efficiency of Scottish acute hospitals: An application of data envelopment analysis. Mathematical Medicine and Biology. 1995;12(3-4):161-73. 87. Kounetas K, Papathanassopoulos F. How efficient are Greek hospitals? A case study using a double bootstrap DEA approach. The European Journal of Health Economics. 2013;14(6):979-94. 88. Magnussen J. Efficiency measurement and the operationalization of hospital production. Health services research. 1996;31(1):21. 89. Siciliani L. Estimating Technical Efficiency in the Hospital Sector with Panel Data. Applied health economics and health policy. 2006;5(2):99-116. 90. Staat M. Efficiency of hospitals in Germany: a DEA-bootstrap approach. Applied Economics. 2006;38(19):2255-63.

130
91. Xenos P, Nektarios M, Constantopoulos A, Yfantopoulos J. Two-stage hospital efficiency analysis including qualitative evidence: A Greek case. Journal of Hospital Administration. 2016;5(3):p1. 92. Brown III HS, Pagán JA. Managed care and the scale efficiency of US hospitals. International Journal of Health Care Finance and Economics. 2006;6(4):278-89. 93. Harrison JP, Coppola MN, Wakefield M. Efficiency of federal hospitals in the United States. Journal of Medical Systems. 2004;28(5):411-22. 94. Ahmadkiadaliri A, Zarei A, Haghparast-Bidgoli H. Measuring efficiency of general hospitals in the south of Iran. World Applied Sciences Journal. 2011;13(6):1310-6. 95. Cheng Z-H, Tao H-B, Cai M, Lin H-F, Lin X-J, Shu Q, et al. Using a two-stage data envelopment analysis to estimate the efficiency of county hospitals in China: a panel data study. The Lancet. 2015;386:S64. 96. Guven-Uslu P, Linh TP. Effects of changes in public policy on efficiency and productivity of general hospitals in Vietnam. ESRC Centre for Competition Policy Working Paper. 2008(08-30). 97. Hu H-H, Qi Q, Yang C-H. Analysis of hospital technical efficiency in China: Effect of health insurance reform. China Economic Review. 2012;23(4):865-77. 98. Lee W-F, Wang Y-H. Technical Efficiency of District Hospitals in Taiwan: Semi-parametric Regression in Second-Stage DEA. 2004. 99. Mahate A, Hamidi S, Akinci F. Measuring the Effect of Size on Technical Efficiency of the United Arab Emirates Hospitals. Global journal of health science. 2016;9(3):58438. 100. Akazili J, Adjuik M, Jehu-Appiah C, Zere E. Using data envelopment analysis to measure the extent of technical efficiency of public health centres in Ghana. BMC international health and human rights. 2008;8(1):1. 101. Jehu-Appiah C, Sekidde S, Adjuik M, Akazili J, Almeida SD, Nyonator F, et al. Ownership and technical efficiency of hospitals: evidence from Ghana using data envelopment analysis. Cost Effectiveness and Resource Allocation. 2014;12(1):1. 102. Kirigia JM, Emrouznejad A, Sambo LG. Measurement of technical efficiency of public hospitals in Kenya: using data envelopment analysis. Journal of Medical Systems. 2002;26(1):39-45. 103. Kirigia JM, Emrouznejad A, Sambo LG, Munguti N, Liambila W. Using data envelopment analysis to measure the technical efficiency of public health centers in Kenya. Journal of Medical Systems. 2004;28(2):155-66. 104. Kirigia JM, Mensah OA, Mwikisa C, Asbu EZ, Emrouznejad A, Makoudode P, et al. Technical efficiency of zone hospitals in Benin. The African health monitor. 2010(12). 105. Masiye F. Investigating health system performance: An application of data envelopment analysis to Zambian hospitals. BMC Health Services Research. 2007;7(58).

131
106. Zere E, Mbeeli T, Shangula K, Mandlhate C, Mutirua K, Tjivambi B, et al. Technical efficiency of district hospitals: evidence from Namibia using data envelopment analysis. Cost Effectiveness and resource allocation. 2006;4(1):1. 107. Farrell MJ. The measurement of productive efficiency. Journal of the Royal Statistical Society Series A (General). 1957;120(3):253-90. 108. Moshiri H, Aljunid S, Amin R. Hospital efficiency: concept, measurement techniques and review of hospital efficiency studies. Malaysian Journal of Public Health Medicine, 10 (2). 2010:35-43. 109. Gok MS, Sezen B. Analyzing the ambiguous relationship between efficiency, quality and patient satisfaction in healthcare services: The case of public hospitals in Turkey. Health Policy. 2013;111(3). 110. O’Neill L, Rauner M, Heidenberger K, Kraus M. A cross-national comparison and taxonomy of DEA-based hospital efficiency studies. Socio-Economic Planning Sciences. 2008;42(3):158-89. 111. Pelone F, Kringos DS, Romaniello A, Archibugi M, Salsiri C, Ricciardi W. Primary Care Efficiency Measurement Using Data Envelopment Analysis: A Systematic Review. Journal of Medical Systems. 2014. 112. García-Lacalle J, Martín E. Efficiency improvements of public hospitals under a capitation payment scheme. Health Economics, Policy and Law. 2013;8(3). 113. Hernandez AR, San Sebastian M. Assessing the technical efficiency of health posts in rural Guatemala: a data envelopment analysis. Global Health Action. 2014. 114. Hollingsworth B, Parkin D. Efficiency and productivity change in the English National Health Service: can data envelopment analysis provide a robust and useful measure? Journal of Health Services Research & Policy. 2003;8(4):230-6. 115. Oikonomou N, Tountas Y, Mariolis A, Souliotis K, Athanasakis K, Kyriopoulos J. Measuring the efficiency of the Greek rural primary health care using a restricted DEA model; the case of southern and western Greece. Health care management science. 2015. 116. Roh C-Y, Jae Moon M, Jung K. Efficiency Disparities among Community Hospitals in Tennessee: Do Size, Location, Ownership, and Network Matter? Journal of Health Care for the Poor and Underserved. 2013;24(4):1816-33. 117. Jacobs R. Alternative Methods to Examine Hospital Efficiency: Data Envelopment Analysis and Stochastic Frontier Analysis. Health Care Management Science. 2001;4(2):103-15. 118. Alexander CA, Busch G, Stringer K. Implementing and interpreting a data envelopment analysis model to assess the efficiency of health systems in developing countries. IMA Journal of Management Mathematics. 2003;14(1):49-63. 119. Hollingsworth B, Dawson PJ, Maniadakis N. Efficiency measurement of health care: a review of non-parametric methods and applications. Health care management science. 1999;2(3):161-72.

132
120. Li H, Dong S. Measuring and Benchmarking Technical Efficiency of Public Hospitals in Tianjin, China: A Bootstrap–Data Envelopment Analysis Approach. INQUIRY: The Journal of Health Care Organization, Provision, and Financing. 2015. 121. Rosko MD. Cost efficiency of US hospitals: a stochastic frontier approach. Health Economics. 2001;10(6):539–51. 122. Wranik D. Healthcare policy tools as determinants of health-system efficiency: evidence from the OECD. Health Economics, Policy and Law. 2012;7(2):197 - 226. 123. Hadad S, Hadad Y, Simon-Tuval T. Determinants of healthcare system’s efficiency in OECD countries. The European Journal of Health Economics. 2013;14(2):253-65. 124. Hollingsworth B, Wildman J. The efficiency of health production: re-estimating the WHO panel data using parametric and nonparametric approaches to provide additional information: Centre for Health Program Evaluation; 2002. 125. Allin S, Grignon M, Wang L. The determinants of efficiency in the Canadian health care system. Health Economics, Policy and Law. 2015;11(1). 126. Charnes A, Cooper WW, Rhodes E. Measuring the efficiency of decision making units. European journal of operational research. 1978;2(6):429-44. 127. Banker RD, Charnes A, Cooper WW. Some models for estimating technical and scale inefficiencies in data envelopment analysis. Management science. 1984;30(9):1078-92. 128. Coelli T. A guide to DEAP version 2.1: a data envelopment analysis (computer) program. Centre for Efficiency and Productivity Analysis, University of New England, Australia. 1996. 129. Ketabi S. Efficiency measurement of cardiac care units of Isfahan hospitals in Iran. Journal of medical systems. 2011;35(2):143-50. 130. Hoff A. Second stage DEA: Comparison of approaches for modelling the DEA score. European Journal of Operational Research. 2007;181(1):425-35. 131. Worthington AC. Frontier Efficiency Measurement in Health Care: A Review of Empirical Techniques and Selected Applications. Medical Care Research and Review. 2004;61(2):135-70. 132. Lee K-s, Chun K-h, Lee J-s. Reforming the hospital service structure to improve efficiency: urban hospital specialization. Health policy. 2008;87(1):41-9. 133. Watcharasriroj B, Tang JC. The effects of size and information technology on hospital efficiency. The Journal of High Technology Management Research. 2004;15(1):1-16. 134. Herr A. Cost and technical efficiency of German hospitals: does ownership matter? Health Economics. 2008;17(9):1057-71. 135. Dalmau-Atarrodona E, Puig-Junoy J. Market structure and hospital efficiency: evaluating potential effects of deregulation in a National Health Service. Review of Industrial Organization. 1998;13(4):447-66.

133
136. Tiemann O, Schreyögg J. Changes in hospital efficiency after privatization. Health care management science. 2012;15(4):310-26. 137. Biørn E, Hagen TP, Iversen T, Magnussen J. The effect of activity-based financing on hospital efficiency: a panel data analysis of DEA efficiency scores 1992–2000. Health care management science. 2003;6(4):271-83. 138. Simar L, Wilson PW. Two-stage DEA: caveat emptor. Journal of Productivity Analysis. 2011;36(2):205. 139. 2017 Article IV Consultation with Kuwait – IMF Concluding Statement [Internet]. 2017 [cited November 16, 2017]. Available from: http://www.imf.org/en/News/Articles/2017/11/15/ms111517-2017-article-iv-consultation-with-kuwait-imf-concluding-statement. 140. Sibbald SL, Singer PA, Upshur R, Martin DK. Priority setting: what constitutes success? A conceptual framework for successful priority setting. BMC health services research. 2009;9(1):43. 141. Eddama O, Coast J. A systematic review of the use of economic evaluation in local decision-making. Health policy. 2008;86(2):129-41. 142. Eichler H-G, Kong SX, Gerth WC, Mavros P, Jönsson B. Use of cost-effectiveness analysis in health-care resource allocation decision-making: how are cost-effectiveness thresholds expected to emerge? Value in health. 2004;7(5):518-28. 143. Gibson J, Mitton C, Martin D, Donaldson C, Singer P. Ethics and economics: does programme budgeting and marginal analysis contribute to fair priority setting? Journal of Health Services Research & Policy. 2006;11(1):32-7. 144. Gibson JL, Martin DK, Singer PA. Setting priorities in health care organizations: criteria, processes, and parameters of success. BMC Health Services Research. 2004;4(1):25. 145. Guindo LA, Wagner M, Baltussen R, Rindress D, van Til J, Kind P, et al. From efficacy to equity: Literature review of decision criteria for resource allocation and healthcare decisionmaking. Cost Effectiveness and Resource Allocation. 2012;10(1):9. 146. Ham C. Priority setting in health care: learning from international experience. Health policy. 1997;42(1):49-66. 147. Clark S, Weale A. Social values in health priority setting: a conceptual framework. Journal of Health Organization and Management. 2012;26(3):293-316. 148. Gibson JL, Martin DK, Singer PA. Evidence, economics and ethics: resource allocation in health services organizations. Healthc Q. 2005;8(2):50-9. 149. Husain S, Kadir M, Fatmi Z. Resource allocation within the National AIDS Control Program of Pakistan: a qualitative assessment of decision maker's opinions. BMC Health Services Research. 2007;7(11). 150. Otim ME, Kelaher M, Anderson IP, Doran CM. Priority setting in Indigenous health: assessing priority setting process and criteria that should guide the health

134
system to improve Indigenous Australian health. International journal for equity in health. 2014;13(45). 151. Smith N, Mitton C, Bryan S, Davidson A, Urquhart B, Gibson JL, et al. Decision maker perceptions of resource allocation processes in Canadian health care organizations: a national survey. BMC Health Services Research. 2013;13(247). 152. Martin D, Singer P. A strategy to improve priority setting in health care institutions. Health Care Analysis. 2003;11(1):59-68. 153. Mitton C, Donaldson C. Setting priorities in Canadian regional health authorities: a survey of key decision makers. Health Policy. 2002;60(1):39–58. 154. Mitton C, Prout S. Setting priorities in the south west of Western Australia: where are we now? Australian Health Review. 2004;28(3):301-10. 155. Mitton CR, Donaldson C. Setting priorities and allocating resources in health regions: lessons from a project evaluating program budgeting and marginal analysis (PBMA). Health Policy. 2003;64(3):335-48. 156. Teng F, Mitton C, MacKenzie J. Priority setting in the provincial health services authority: survey of key decision makers. BMC health services research. 2007;7(1):84. 157. Birch S, Chambers S. To each according to need: a community-based approach to allocating health care resources. CMAJ: Canadian Medical Association Journal. 1993;149(5):607. 158. Bryan S, Williams I, McIver S. Seeing the NICE side of cost‐effectiveness analysis: a qualitative investigation of the use of CEA in NICE technology appraisals. Health economics. 2007;16(2):179-93. 159. Reeleder D, Martin DK, Keresztes C, Singer PA. What do hospital decision-makers in Ontario, Canada, have to say about the fairness of priority setting in their institutions? BMC Health Services Research. 2005;5(1):8. 160. Jouhar H. Cost of Overseas Treatment. Kuwait Times. 2017. 161. Youngkong S, Kapiriri L, Baltussen R. Setting priorities for health interventions in developing countries: a review of empirical studies. Tropical Medicine & International Health. 2009;14(8):930-9. 162. Kapiriri L, Martin DK. A strategy to improve priority setting in developing countries. Health Care Analysis. 2007;15(3):159-67. 163. Mitton C, Patten S. Evidence-based priority-setting: what do the decision-makers think? Journal of health services research & policy. 2004;9(3):146-52. 164. Tomson G, Paphassarang C, Jonsson K, Houamboun K, Akkhavong K, Wahlstrom R. Decision-makers and the usefulness of research evidence in policy implementation—a case study from Lao PDR. Social science & medicine. 2005;61(6):1291–9. 165. Mitton C, Mackenzie J, Cranston L, Teng F. Priority setting in the Provincial Health Services Authority: case study for the 2005/06 planning cycle. Healthcare Policy. 2006;2(1):91.

135
166. Jan S. A perspective on the analysis of credible commitment and myopia in health sector decision making. Health Policy. 2003;63(3):269-78. 167. Hutubessy R, Chisholm D, Edejer TT-T. Generalized cost-effectiveness analysis for national-level priority-setting in the health sector. Cost effectiveness and resource allocation. 2003;1(1):8. 168. Williams I, Bryan S. Understanding the limited impact of economic evaluation in health care resource allocation: a conceptual framework. Health policy. 2007;80(1):135-43. 169. Koornneef E, Blair I, Robben P. Progress and outcomes of health systems reform in the United Arab Emirates: a systematic review. BMC health services research. 2017;17(1):672. 170. Innvær S, Vist G, Trommald M, Oxman A. Health policy-makers' perceptions of their use of evidence: a systematic review. Journal of health services research & policy. 2002;7(4):239-44. 171. Bowling A. Health care rationing: the public's debate. Bmj. 1996;312(7032):670-4. 172. Schwappach DL. Resource allocation, social values and the QALY: a review of the debate and empirical evidence. Health Expectations. 2002;5(3):210-22. 173. Lim MK, Bae EY, Choi S-E, Lee EK, Lee T-J. Eliciting public preference for health-care resource allocation in South Korea. Value in Health. 2012;15(1):S91-S4. 174. Abelson J, Forest P-G, Eyles J, Smith P, Martin E, Gauvin F-P. Deliberations about deliberative methods: issues in the design and evaluation of public participation processes. Social science & medicine. 2003;57(2):239-51. 175. Abelson J, Eyles J, McLeod CB, Collins P, McMullan C, Forest P-G. Does deliberation make a difference? Results from a citizens panel study of health goals priority setting. Health Policy. 2003;66(1):95-106. 176. Goold SD, Biddle AK, Klipp G, Hall CN, Danis M. Choosing Healthplans All Together: a deliberative exercise for allocating limited health care resources. Journal of health politics, policy and law. 2005;30(4):563-602. 177. Rosén P. Public dialogue on healthcare prioritisation. Health policy. 2006;79(1):107-16. 178. Watson V, Carnon A, Ryan M, Cox D. Involving the public in priority setting: a case study using discrete choice experiments. Journal of Public Health. 2011:fdr102. 179. Werntoft E, Hallberg IR, Edberg AK. Prioritization and resource allocation in health care. The views of older people receiving continuous public care and service. Health expectations. 2007;10(2):117-28. 180. Lees A, Scott N, Scott SN, MacDonald S, Campbell C. Deciding how NHS money is spent: a survey of general public and medical views. Health Expectations. 2002;5(1):47-54.

136
181. Matschinger H, Angermeyer MC. The public’s preferences concerning the allocation of financial resources to health care: results from a representative population survey in Germany. European Psychiatry. 2004;19(8):478-82. 182. Mossialos E, King D. Citizens and rationing: analysis of a European survey. health Policy. 1999;49:75-135. 183. Rosén P, Karlberg I. Opinions of Swedish citizens, health‐care politicians, administrators and doctors on rationing and health‐ care financing. Health Expectations. 2002;5(2):148-55. 184. Shickle D. Public preferences for health care: prioritisation in the United Kingdom. Bioethics. 1997;11(3‐4):277-90. 185. Wiseman V, Mooney G, Berry G, Tang K-C. Involving the general public in priority setting: experiences from Australia. Social science & medicine. 2003;56(5):1001-12. 186. Kapiriri L, Norheim OF. Criteria for priority-setting in health care in Uganda: exploration of stakeholders' values. Bulletin of the world Health Organization. 2004;82(3):172-9. 187. Bryan S, Roberts T, Heginbotham C, McCallum A. QALY‐maximisation and public preferences: results from a general population survey. Health economics. 2002;11(8):679-93. 188. WHO. How to conduct a discrete choice experiment for health workforce recruitment and retention in remote and rural areas: a user guide with case studies. Geneva, Switzerland: WHO; 2012. 189. Pietersen K. Multiple Criteria Decision Analysis (MCDA): A Tool to Support Sustainable Management of Groundwater Resources in South Africa. Water S A. 2006;32(2). 190. Watróbski J, Jankowski J, Ziemba P, Karczmarczyk A, Zioło M. Generalised framework for multi-criteria method selection. Omega. 2019;86. 191. Ponto J. Understanding and Evaluating Survey Research. Journal of the Advanced Practitioner in Oncology. 2015;6(2). 192. Wiseman V. Comparing the preferences of health professionals and members of the public for setting healthcare priorities. Applied health economics and health policy. 2005;4(2):129-37. 193. Litva A, Coast J, Donovan J, Eyles J, Shepherd M, Tacchi J, et al. ‘The public is too subjective’: public involvement at different levels of health-care decision making. Social Science & Medicine. 2002;54(12):1825-37. 194. Foddy W. Constructing questions for interviews and questionnaires: theory and practice in social research. Melbourne: Cambridge University Press; 1994.

137
Appendices

138
Appendix 1: Efficiency literature search strategy
PubMed Strategy:
((health[Title/Abstract] OR health system[Title/Abstract]) OR health
sector[Title/Abstract]) AND ((((efficiency[Title/Abstract] OR technical
efficiency[Title/Abstract]) OR allocative efficiency[Title/Abstract]) OR
inefficiency[Title/Abstract]) OR high spending[Title/Abstract]) AND ("loattrfull
text"[sb] AND ("1990/01/01"[PDAT] : "3000/12/31"[PDAT]) AND "humans"[MeSH
Terms] AND English[lang] AND systematic[sb])
298
Date: 25 May 2019
Web of Science Strategy:
#2 AND #1
Refined by: WEB OF SCIENCE CATEGORIES: ( HEALTH CARE SCIENCES
SERVICES OR HEALTH POLICY SERVICES OR SOCIAL SCIENCES
BIOMEDICAL OR NURSING OR ECONOMICS ) AND DOCUMENT TYPES: ( ARTICLE )
Timespan: 1990-2019. Indexes: SCI-EXPANDED, SSCI, A&HCI, CPCI-S,
CPCI-SSH, BKCI-S, BKCI-SSH, ESCI, CCR-EXPANDED, IC.
10,220
Date: 25 May 2019

139
EconLit Strategy:
efficiency OR technical efficiency OR allocative efficiency OR inefficiency OR high
spending OR performance And health OR health system OR health sector
Limiters - Linked Full Text; Published Date: 19900101-20161231; Publication
Type: Journal Article
Search modes - Boolean/Phrase
2,081
Date: 25 May 2019

140
Appendix 2: Qualitative study sample characteristics
Sample Characteristics n(%) Gender
• Females 2 (14.3%) • Males 12 (85.7%)
Age (in years) • <40 1 (7.1%) • 40-49 7 (50%) • 50-59 5 (35.7%) • 60≤ 1 (7.1%)
Nationality • Kuwaiti 10 (71.4%) • Non-Kuwaiti 4 (28.6%)
Hospital type • Public (secondary) 3 (21.4%) • Public (tertiary) 4 (28.6%) • Private 6 (42.9%) • Military 1 (7.1%)
Professional background • Medical 9 (64.3%) • Dentistry 1 (7.1%) • Administrative • Other
3 (21.4%) 1 (7.1%)
Role • Hospital director 9 (64.3%) • CEO 4 (28.6%) • CFO 1 (7.1%)
Higher degree in hospital management • Yes 9 (64.3%) • No 5 (35.7%)
Total experience (in years) • <15 1 (7.1%) • 15-19 4 (28.6%) • 20-24 6 (42.9%) • 25-29 2 (14.3%) • 30≤ 1 (7.1%)
Years in managerial role • <5 3 (21.4%) • 5-9 7 (14.3%) • 10-14 5 (35.7%) • 15≤ 4 (28.6%)

141
Appendix 3: UCL ethical approval
Academic Services, 1-19 Torrington Place (9th Floor), University College London Tel: +44 (0)20 3108 8216 Email: [email protected] http://ethics.grad.ucl.ac.uk/
UCL RESEARCH ETHICS COMMITTEE ACADEMIC SERVICES 28th March 2017 Dr Jolene Skordis-Worrall UCL Institute for Global Health Dear Dr Skordis-Worrall Notification of Ethical Approval Re: Ethics Application 9633/001: How will current health spending in Kuwait meet the demands of a changing epidemiological and demographic landscape? Exploring ways to improve the efficiency of health spending I am pleased to confirm in my capacity as Chair of the UCL Research Ethics Committee that I have ethically approved your study until 30th May 2018 Approval is subject to the following conditions: Notification of Amendments to the Research You must seek Chair’s approval for proposed amendments (to include extensions to the duration of the project) to the research for which this approval has been given. Ethical approval is specific to this project and must not be treated as applicable to research of a similar nature. Each research project is reviewed separately and if there are significant changes to the research protocol you should seek confirmation of continued ethical approval by completing the ‘Amendment Approval Request Form’: http://ethics.grad.ucl.ac.uk/responsibilities.php Adverse Event Reporting – Serious and Non-Serious It is your responsibility to report to the Committee any unanticipated problems or adverse events involving risks to participants or others. The Ethics Committee should be notified of all serious adverse events via the Ethics Committee Administrator ([email protected]) immediately the incident occurs. Where the adverse incident is unexpected and serious, the Chair or Vice-Chair will decide whether the study should be terminated pending the opinion of an independent expert. For non-serious adverse events the Chair or Vice-Chair of the Ethics Committee should again be notified via the Ethics Committee Administrator within ten days of the incident occurring and provide a full written report that should include any amendments to the participant information sheet and study protocol. The Chair or Vice-Chair will confirm that the incident is non-serious and report to the Committee at the next meeting. The final view of the Committee will be communicated to you. Final Report At the end of the data collection element of your research we ask that you submit a very brief report (1-2 paragraphs will suffice) which includes in particular issues relating to the ethical implications of the research i.e. issues obtaining consent, participants withdrawing from the research, confidentiality, protection of participants from physical and mental harm etc.

142
Yours sincerely
Dr Lynn Ang Interim Chair, UCL Research Ethics Committee Cc: Hassan Haghparast-Bidgoli & Abdullah Meshal Alsabah

143
Appendix 4: Ministry of Health ethics approval

144
Appendix 5: Interview guide
The nature of decision-making in the hospitals.
1. Briefly explain your role in your organisation.
Current process of setting priorities and resource allocation in hospitals.
2. Can you describe the process of how priorities are set? 3. What sources of information are used in determining short-term and long-term priorities
(e.g. burden of disease, economic evidence, accreditation report… etc.)? 4. Once priorities are defined, how are decisions made to divide up the resources across the
health sector?
Assessment of the current priority setting process.
5. In your opinion, do the processes of setting priorities and allocating resources work well? 6. What are the specific strengths of the current approach? 7. What are the shortcomings and problems of the current approach? 8. How could the current process of setting priorities be improved? 9. Do you think the use of economic principles and/or evidence from economic evaluation
could improve the process of priority setting?
Resource allocation for sending patients abroad for treatment.
10. How do you think resources are allocated for sending patients abroad for treatment? 11. What effect do you think sending patients abroad for treatment has on health resources
in the country? 12. What are the specific strengths of the policy of sending patients abroad for treatment? 13. What are the disadvantages of sending patients abroad for treatment on the health
system?
Participant’s opinions about the newly implemented health insurance for retirees and its effect on resource allocation.
14. What is your opinion of the newly implemented health insurance for retirees’ policy?

145
15. What do you think the main objective of the policy is? 16. What effects do you think it will have on health resources in the country?

146
Appendix 6: Questionnaire
In the next section, we are going to ask you about some personal information, and your experience of the use of healthcare services in Kuwait.
1. Gender: ☐ Male ☐ Female 2. Age (in
years) ☐ 20-30 ☐ 31-40 ☐ 41-50 ☐ 51-60 ☐ >60
3. Marital status
☐ Single ☐ Married ☐ Divorced ☐ Widowed
4. Nationality ☐ Kuwaiti ☐ Non-Kuwaiti 5. Current Occupation ☐ Working ☐ Student
☐ Unemployed ☐ Retired 6. Combined household
monthly income (in Kuwaiti Dinars)
☐ <1,000 ☐ 1,000-2,000 ☐ 2,001-3,000 ☐ 3,001-4,000 ☐ 4,001-5,000 ☐ >5,000
7. Highest educational qualification
☐ High school degree ☐ Diploma ☐ Bachelors degree ☐ Postgraduate degree ☐ Other (lower than high school degree)
8. Governorate of residence
☐ Capital ☐ Jahra ☐ Farwaniya ☐ Hawalli ☐ Ahmadi ☐ Mubarak Al-Kabeer
9. Do you suffer from longstanding illness or disability?
☐ Yes ☐ No
10. Are you a carer for someone with chronic illness or disability?
☐ Yes ☐ No
11. When was the last time you have visited a healthcare facility?
☐ Less than a month ☐ One to six months
☐ Six months to one year ☐ One to three years
☐ More than three years 12. What healthcare facility did you last
visit? ☐ Public healthcare facility ☐ Private healthcare facility ☐ Overseas healthcare facility
13. How do you usually pay for health services?
☐ Private health insurance ☐ Out-of-pocket ☐ Use public health services

147
In the next section, we will be asking you about your opinion regarding some processes of priority setting and resource allocation in the public healthcare sector in Kuwait
14. In your opinion, rank the following health services according to their importance, 1 being most important and 12 being least important
☐ Treatments for children with life threatening illnesses ☐ Special care and pain relief for people who are dying ☐ Preventive screening services and immunization ☐ Surgery, such as knee replacement, to help people carry out everyday tasks ☐ Nursing and community services at home ☐ Psychiatric services for people with mental illness ☐ High technology surgery, organ transplants and procedures which treat life threatening conditions ☐ Health promotion/education services to help people lead healthy lives ☐ Intensive care for premature babies with only a slight chance of survival ☐ Long stay hospital care for elderly people ☐ Treatment for infertility ☐ Treatment for people aged 75 and over with life threatening illness
15. In your opinion, what other sources do you prefer for additional funding for healthcare services in the country? (More than one alternative could be chosen)
☐ Higher tax on cigarettes ☐ Tax on pollution (e.g. cars and factories) ☐ Stop sending patients abroad ☐ Complementary Private insurance ☐ Decrease the defence budget ☐ Implementation of income tax ☐ Implementation of national health insurance ☐ Implementation of charges for healthcare services ☐ Other
Yes No Don’t know 16. Do you think that public healthcare resources are
sufficient to satisfy all healthcare need? ☐ ☐ ☐
17. Do you think that public healthcare resources are sufficient to always offer patients best possible care?
☐ ☐ ☐
18. Should public healthcare always offer best possible care, irrespective of costs?
☐ ☐ ☐
19. Should simpler treatments or healthcare services be paid by the patients themselves (i.e. dental scaling)?
☐ ☐ ☐
20. Should we invest more public resources in public healthcare?
☐ ☐ ☐
21. Should the general public participate in discussions on healthcare resource allocation?
☐ ☐ ☐

148
22. Should the general public be offered more opportunities to influence healthcare resource allocation?
☐ ☐ ☐
23. Do you think that decision makers in the Ministry of Health handle prioritisations in a good manner?
☐ ☐ ☐
24. Should decision makers in the Ministry of Health make more explicit prioritisations?
☐ ☐ ☐
Agree No opinion Disagree 25. If a disease has an effective treatment, the patient
should be treated regardless of the expense ☐ ☐ ☐
26. If two types of treatment exists, the cheaper one should be chosen, even if it is less effective
☐ ☐ ☐
27. Money is spent on unnecessary things in healthcare
☐ ☐ ☐
28. In your opinion, do the following services receive adequate resources? Too little Enough Too much Don’t know Psychiatric care ☐ ☐ ☐ ☐ Health education ☐ ☐ ☐ ☐ Dental services ☐ ☐ ☐ ☐ Elderly care ☐ ☐ ☐ ☐ Hospital care ☐ ☐ ☐ ☐ Primary healthcare ☐ ☐ ☐ ☐ End-of-life care ☐ ☐ ☐ ☐ Drug addiction/rehabilitation care ☐ ☐ ☐ ☐ Healthcare information ☐ ☐ ☐ ☐ Healthcare administration ☐ ☐ ☐ ☐ Child care ☐ ☐ ☐ ☐ In the next section, we are going to ask you about your opinion of the policy of sending patients abroad for treatment. 29. Do you know of the policy of sending patients abroad for treatment? ☐ Yes ☐ No
30. Have you or any of your relatives been sent to receive treatment abroad? ☐ Yes ☐ No
Please state your opinion regarding the following statements
Strongly agree
Agree Neither agree or disagree
Disagree Strongly disagree
No opinion
31. The policy of sending patients ☐ ☐ ☐ ☐ ☐ ☐

149
abroad is costly on the health budget
32. The policy of sending patients abroad is misused
☐ ☐ ☐ ☐ ☐ ☐
33. The policy of sending patients abroad is politically driven
☐ ☐ ☐ ☐ ☐ ☐
34. Most cases sent abroad for treatment without real medical indication
☐ ☐ ☐ ☐ ☐ ☐
35. Most specialised treatments are available locally
☐ ☐ ☐ ☐ ☐ ☐
36. It is a constitutional right to have the option of being sent abroad for treatment
☐ ☐ ☐ ☐ ☐ ☐
37. Sending patients abroad for treatment has several advantages
☐ ☐ ☐ ☐ ☐ ☐
38. Sending patients abroad for treatment has decreased the trust in the local health system
☐ ☐ ☐ ☐ ☐ ☐
39. Patients prefer to be treated in their home country around their families
☐ ☐ ☐ ☐ ☐ ☐
In the next section, we are going to ask you about your opinion of the policy of private health insurance for retirees (Afya) 40. Do you know of the policy of private of health insurance for retirees (Afya)? ☐ Yes ☐ No 41. Is you or any of your relatives a beneficiary of this policy? ☐ Yes ☐ No

150
Please state your opinion regarding the following statements
Strongly agree
Agree Neither agree or disagree
Disagree Strongly disagree
No opinion
42. The health insurance for retirees policy has clear objectives
☐ ☐ ☐ ☐ ☐ ☐
43. The health insurance for retirees policy is a good policy
☐ ☐ ☐ ☐ ☐ ☐
44. The health insurance for retirees policy decreased load on public health services
☐ ☐ ☐ ☐ ☐ ☐
45. The health insurance for retirees policy promoted patient choice
☐ ☐ ☐ ☐ ☐ ☐
46. The health insurance for retirees policy is misused
☐ ☐ ☐ ☐ ☐ ☐
47. The health insurance for retirees policy is a step towards privatising healthcare
☐ ☐ ☐ ☐ ☐ ☐
48. The health insurance for retirees policy promotes inequality
☐ ☐ ☐ ☐ ☐ ☐
49. The beneficiaries of the health insurance for retirees policy should be increased
☐ ☐ ☐ ☐ ☐ ☐
50. The treatment package of the health insurance for retirees policy should be increased
☐ ☐ ☐ ☐ ☐ ☐