Embed Size (px)
Citation preview
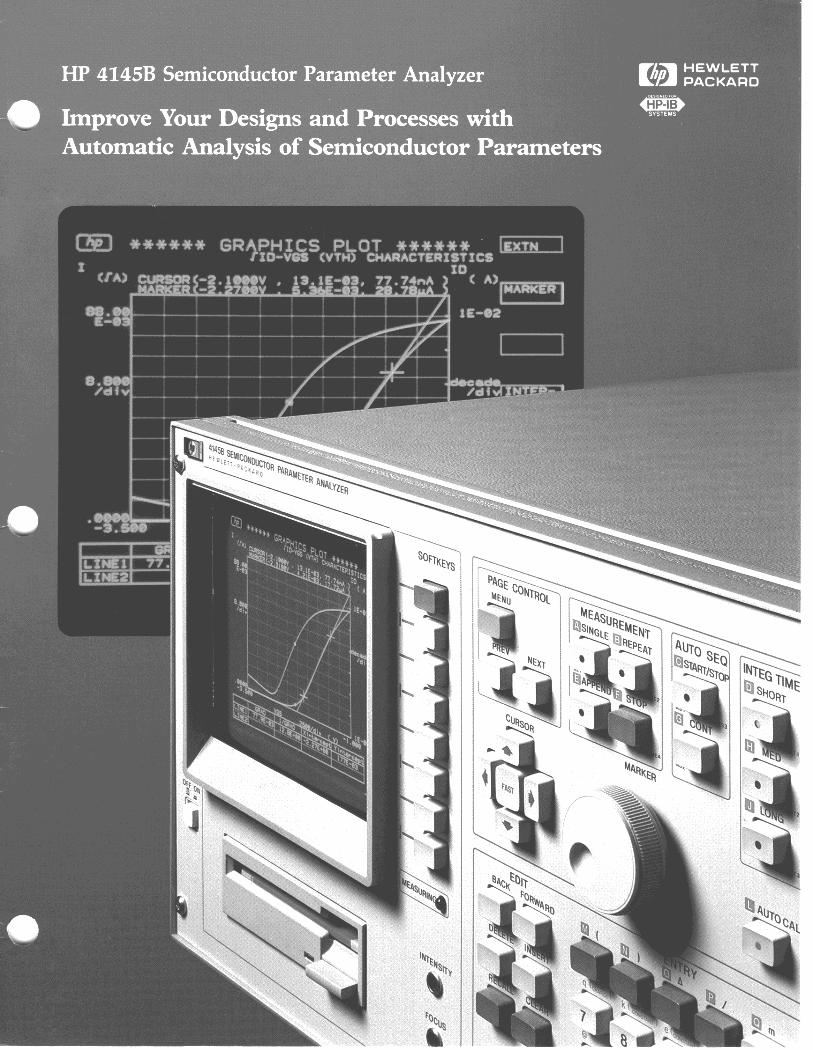
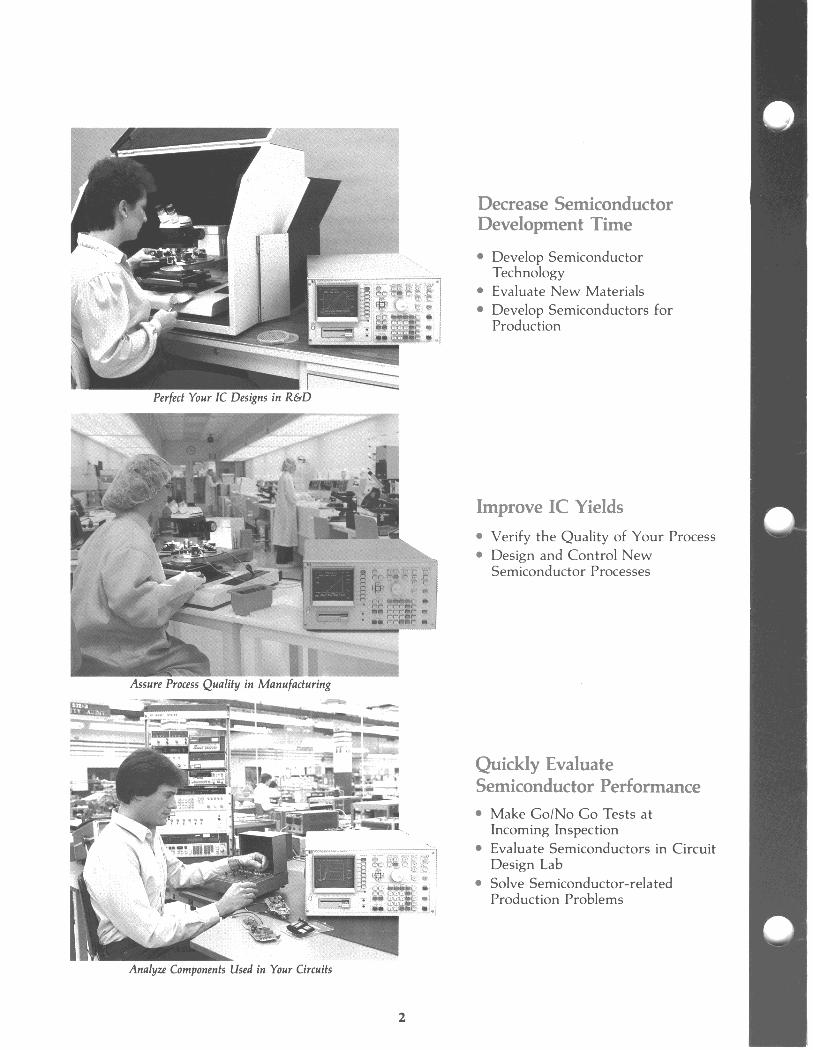
Improvi! Your Device Quality The HP 4145B performs fast, accurate analysis of semiconductor devices to increase your productivity and improve your device quality. You can stimulate and measure voltage and current sensitive devices easily with the four Source Monitor Units (SMUs). And to help you analyze data, the HP 4145B computes dc parameters like h,, and gm for you.
The HP 4145B’s versatile SMU-based architecture saves you valuable time and eliminates measurement instabilities caused by changing DUT connnections. Each SMU can alternately act as a voltage source/ current monitor or current source/voltage monitor. You can characterize a four-terminal device com- pletely without changing device connections - simply change the SMU’s current/voltage operating mode.
Shorten Your Design and Analysis Times The HP 4145B automates tedious data gathering during device characterization. When design changes are made, you can evaluate them quickly and efficiently, minimizing project delays and cost overruns.
At the touch of a button, the HP 4145B can position cursors and lines on the display, giving you direct readout of dc parameters like Early voltage and threshold voltage. You can position a marker anywhere on the curve and read out coordinates directly. Or zero in fast with “auto scale”, “zoom” and “move window“ commands.
Increase Productivity on the Bench or in a System You can produce results from the start with the HP 4145B. Use the powerful front panel keys for control and analysis in stand-alone bench-top applications. Or use the HP 4145B’s Auto Sequence Programming to control measurements, data storage, and plotting functions without using a computer. And, since the HP 4145B is completely programmable, you can easily incorporate it into an automatic test system to increase your test throughput.
HP 4145B Key Performance Features
Source Monitor Unit (SMU) The HP 4145B provides you with four SMUs. Each SMU can be used as a voltage source/current monitor or as a current source/voltage monitor.
SMU Range: V: 33 mVdc to 1!1100.00 Vdc I: +1 pAdc to klOO.0 mAdc
(3~50 fA resolution in current monitor mode)
Accuracy: V: +0.15% to -1-(0.15% + 40 mV) I: 50.4% to+1.8%
Measurement Speed Make up to 150 measurements per second.
Voltage Monitor (VM) Two voltage monitors are built into the HP 4145B in addition to the SMUs.
Measuring Ranges: +~O.OOO Vdc and +2.0000 Vdc
Accuracy: rtO..S% (2OV range) and 20.2% (2V range)
Resolution: +1 mV (2OV range) and +lOO p V (2V range)
Voltage Source (VS) Two voltage sources are available in addition to the SMUs.
Output Range: +2O.OOO Vdc Accuracy: fOS%
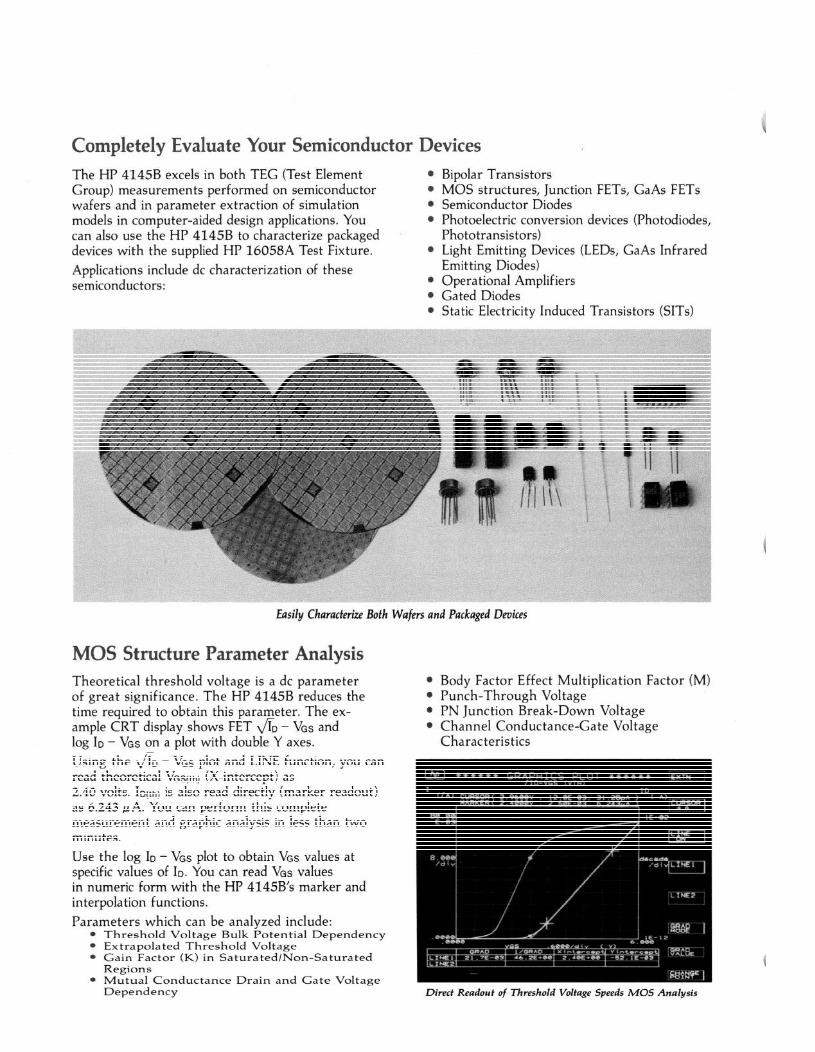
Completely Evaluate Your Semiconductor Devices The HP 4145B excels in both TEG (Test Element Group) measurements performed on semiconductor wafers and in parameter extraction of simulation models in computer-aided design applications. You can also use the HP 4145B to characterize packaged devices with the supplied HP 16058A Test Fixture. Applications include dc characterization of these semiconductors:
l Bipolar Transistors l MOS structures, Junction FETs, GaAs FETs l Semiconductor Diodes l Photoelectric conversion devices (Photodiodes,
Phototransistors) l Light Emitting Devices (LEDs, GaAs Infrared
Emitting Diodes) l Operational Amplifiers l Gated Diodes 0 Static Electricity Induced Transistors (SITS)
Easily Characterize Both Wafers and Packaged Devices
MOS Structure Parameter Analysis Theoretical threshold voltage is a dc parameter of great significance. The HP 4145B reduces the time required to obtain this parameter. The ex- ample CRT display shows FET & - VGS and log ID - VGS on a plot with double Y axes. Using the do - Vos plot and LINE function, you can read theoretical VGS(th) (X-intercept) as 2.40 volts. ID&h) is also read directly (marker readout) as 6.243 PA. You can perform this complete measurement and graphic analysis in less than two minutes. Use the log ID - Vos plot to obtain Vos values at specific values of ID. You can read Vos values in numeric form with the HP 4145B’s marker and interpolation functions. Parameters which can be analyzed include:
l Threshold Voltage Bulk Potential Dependency 0 Extrapolated Threshold Voltage l Gain Factor (K) in Saturated/Non-Saturated
Regions l Mutual Conductance Drain and Gate Voltage
Dependency
l Body Factor Effect Multiplication Factor (M) l Punch-Through Voltage l PN Junction Break-Down Voltage l Channel Conductance-Gate Voltage
Characteristics
Direct Readout of Threshold Voltage Speeds MOS Analysis
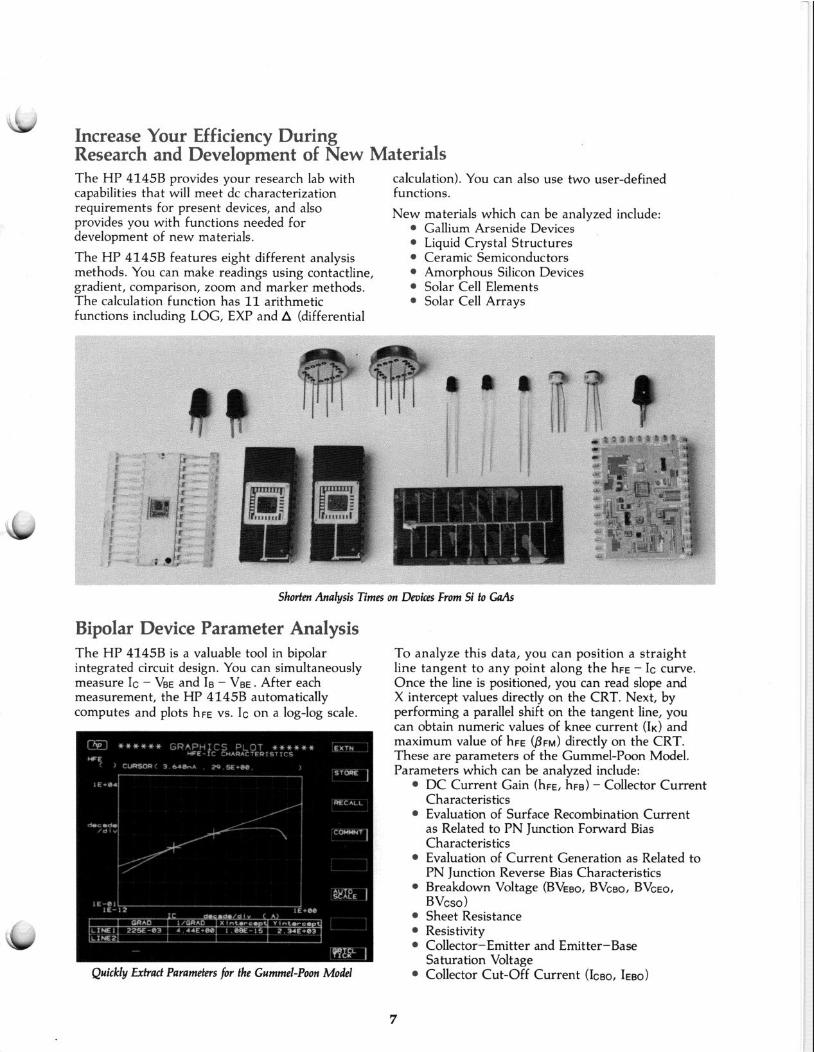
Increase Your Efficiency During Research and Development of New Materials The HP 41458 provides your research lab with capabilities that will meet dc characterization requirements for present devices, and also provides you with functions needed for development of new materials.
The HP 4145B features eight different analysis methods. You can make readings using contactline, gradient, comparison, zoom and marker methods. The calculation function has 11 arithmetic functions including LOG, EXP and A (differential
calculation). You can also use two user-defined functions.
New materials which can be analyzed include: l Gallium Arsenide Devices l Liquid Crystal Structures l Ceramic Semiconductors l Amorphous Silicon Devices l Solar Cell Elements l Solar Cell Arrays
Bipolar Device Parameter Analysis The HP 4145B is a valuable tool in bipolar integrated circuit design. You can simultaneously measure Ic - VBE and Ie - VBE . After each measurement, the HP 4145B automatically COmpUteS and plots hfE vs. Ic on a log-log scale.
To analyze this data, you can position a straight line tangent to any point along the hFE - Ic curve. Once the line is positioned, you .can read slope and X intercept values directly on the CRT. Next, by performing a parallel shift on the tangent line, you can obtain numeric values of knee current (1~) and maximum value of hFe @FM) directly on the CRT. These are parameters of the Gummel-Poon Model. Parameters which can be analyzed include:
l DC Current Gain (hfs, hfa) - COlleCtOr CUrrent
Characteristics l Evaluation of Surface Recombination Current
as Related to PN Junction Forward Bias Characteristics
l Evaluation of Current Generation as Related to PN Junction Reverse Bias Characteristics
* Breakdown Voltage (BVEBO, BVCBO, BVCEO, BVcso )
l Sheet Resistance l Resistivity l Collector-Emitter and Emitter-Base
Saturation Voltage Quickly Extract Parameters for the Gummel-Poon Model l Collector Cut-Orf Current (1~~0, 1~130)
7
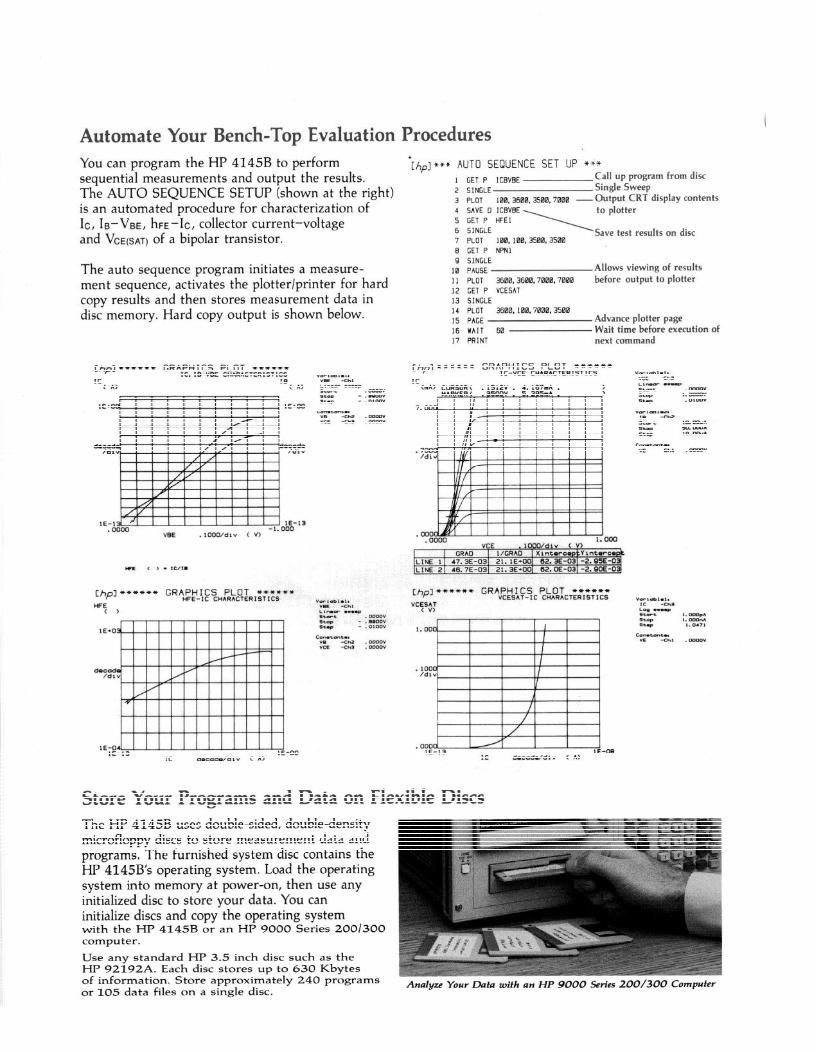
Automate Your Bench-Top Evaluation Procedures You can program the HP 4145B to perform sequential measurements and output the results.
+[,+]**+ AUTO SEQUENCE SET UP **++ 1 GET P ICBVBE Call up program from disc
The AUTO SEQUENCE SETUP (shown at the right) 2 SINGLE Single Sweep
is an automated procedure for characterization of 3 PLOT 100.3600.3500.7000 -Output CRT display contents
Ic, Is-VBE, hFe-Ic, COlleCtOr CUrriM-VOkage
and VCE(SAT) of a bipolar transistor. 3 g::: bEF \;~“;;~;:,“I,, o” disc 7 PLOT 100, 100.3500.3500 8 GET P NPNl
The auto sequence program initiates a measure- ment sequence, activates the plotter/printer for hard copy results and then stores measurement data in disc memory. Hard copy output is shown below.
9 SINGLE 10 PAUSE 11 PLOT 3600.3600.7000,7000 12 GET P VCESAT 13 SINGLE 14 PLOT 3600. 100,7000.3500 15 PAGE 16 WAIT 60 17 PAINT
Allows viewing of results before output to plotter
Advance plotter page Wait time before execution of next command
GRAPHICS PLOT I***+* +, **it.*** GRAPHICS PLOT ****** ME-It CHARACTERlST*CS ‘fab’d., “CESAT-IC CHARACTERrSTtCS
I.,- .-Up “,w” ‘cy$.t
I)____ lDDY ““Y I I I II I 1
Store Your Programs and Data on Flexible Discs The HP 4145B uses double-sided, double-density microfloppy discs to store measurement data and programs. The furnished system disc contains the HP 4145B’s operating system. Load the operating system into memory at power-on, then use any initialized disc to store your data. You can initialize discs and copy the operating system with the HP 4145B or an HP 9000 Series 200/300 computer.
Use any standard HP 3.5 inch disc such as the HP 9219214. Each disc stores up to 630 Kbytes of information. Store approximately 240 programs or 105 data files on a single disc.
Analyze Your Data with an HP 9000 Series 200/300 Computer
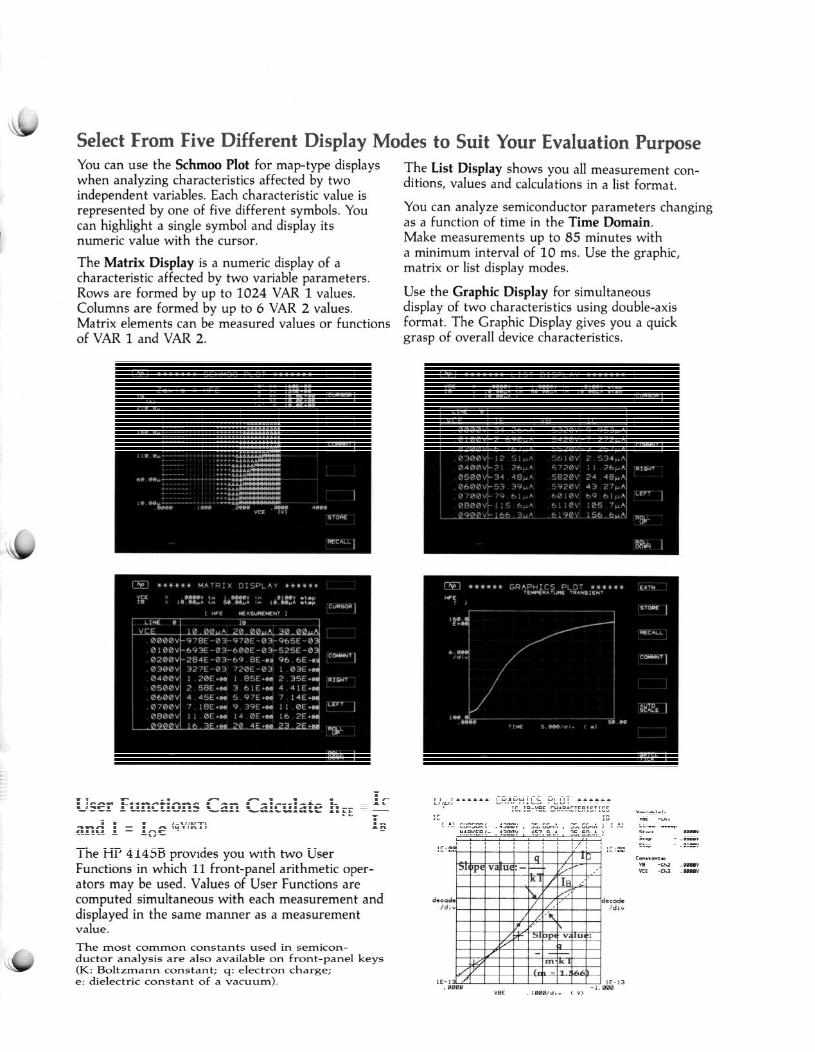
You can use the Schmoo Plot for map-type displays when analyzing characteristics affected by two independent variables. Each characteristic value is represented by one of five different symbols. You can highlight a single symbol and display its numeric value with the cursor.
The List Display shows you all measurement con- ditions, values and calculations in a list format.
You can analyze semiconductor parameters changing as a function of time in the Time Domain. Make measurements up to 85 minutes with a minimum interval of 10 ms. Use the graphic, matrix or list display modes. The Matrix Display is a numeric display of a
characteristic affected by two variable parameters. Rows are formed by up to 1024 VAR 1 values. Use the Graphic Display for simultaneous Columns are formed by up to 6 VAR 2 values. display of two characteristics using double-axis Matrix elements can be measured values or functions format. The Graphic Display gives you a quick of VAR 1 and VAR 2. grasp of overall device characteristics.
Select From Five Different Display Modes to Suit Your Evaluation Purpose
User Functions Can Calculate h,, = f and 1 = I, e hV/KT) B
[hp]****** GRAPHICS PLOT ****I* IC,IB-VBE CHARACTERISTICS y-,~,-l
IC ( A) CUR5Off(- .430RV t 35.66nA , 35.&d :"( A)
)
The HP 4145B provides you with two User Functions in which II front-panel arithmetic oper-
1E+00 lE+00
.DIY mm
ators may be used. Values of User Functions are computed simultaneous with each measurement and displayed in the same manner as a measurement value.
d-cad. /dl"
decade /dl"
The most common constants used in semicon- ductor analysis are also available on front-panel keys (K: Boltzmann constant; q: electron charge; e: dielectric constant of a vacuum). IE-13
-1.000 VBE .1000/d.v ( W
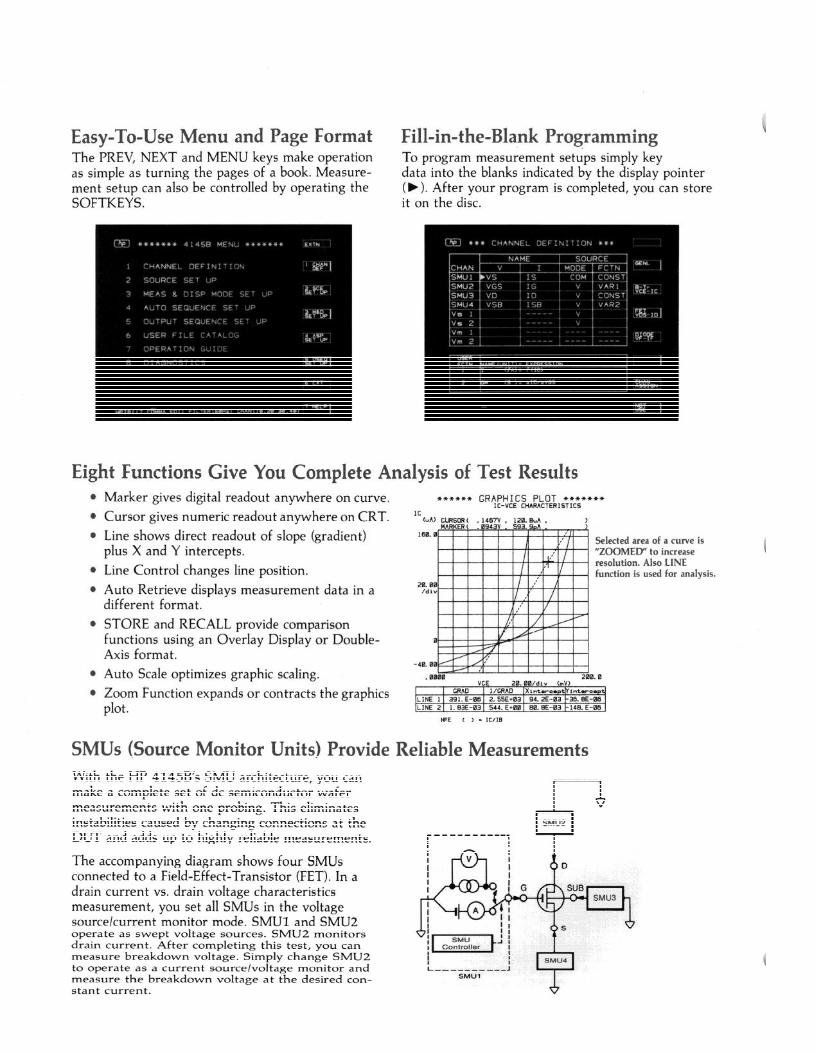
Easy-To-Use Menu and Page Format Fill-in-the-Blank Programming The PREV, NEXT and MENU keys make operation as simple as turning the pages of a book. Measure- ment setup can also be controlled by operating the SOFTKEYS.
To program measurement setups simply key data into the blanks indicated by the display pointer (b). After your program is completed, you can store it on the disc.
Eight Functions Give You Complete Analysis of Test Results Marker gives digital readout anywhere on curve. Cursor gives numeric readout anywhere on CRT. Line shows direct readout of slope (gradient) plus X and Y intercepts. Line Control changes line position. Auto Retrieve displays measurement data in a different format.
****** GRAPHICS PLOT ******* XC-“CE CHARAtTERISTICS .-
STORE and RECALL provide comparison functions using an Overlay Display or Double- Axis format. Auto Scale optimizes graphic scaling. Zoom Function expands or contracts the graphics plot.
Selected area of a curve is “ZOOMED” to increase resolution. Also LINE function is used for analysis.
SMUs (Source Monitor Units) Provide Reliable Measurements With the HP 4145B’s SMU architecture, you can make a complete set of dc semiconductor wafer measurements with one probing. This eliminates instabilities caused by changing connections at the DUT and adds up to highly reliable measurements.
The accompanying diagram shows four SMUs connected to a Field-Effect-Transistor (FET). In a drain current vs. drain voltage characteristics measurement, you set all SMUs in the voltage source/current monitor mode, SMUl and SMU2 operate as swept voltage sources. SMU2 monitors drain current. After completing this test, you can measure breakdown voltage. Simply change SMU2 to operate as a current source/voltage monitor and measure the breakdown voltage at the desired con- stant current.
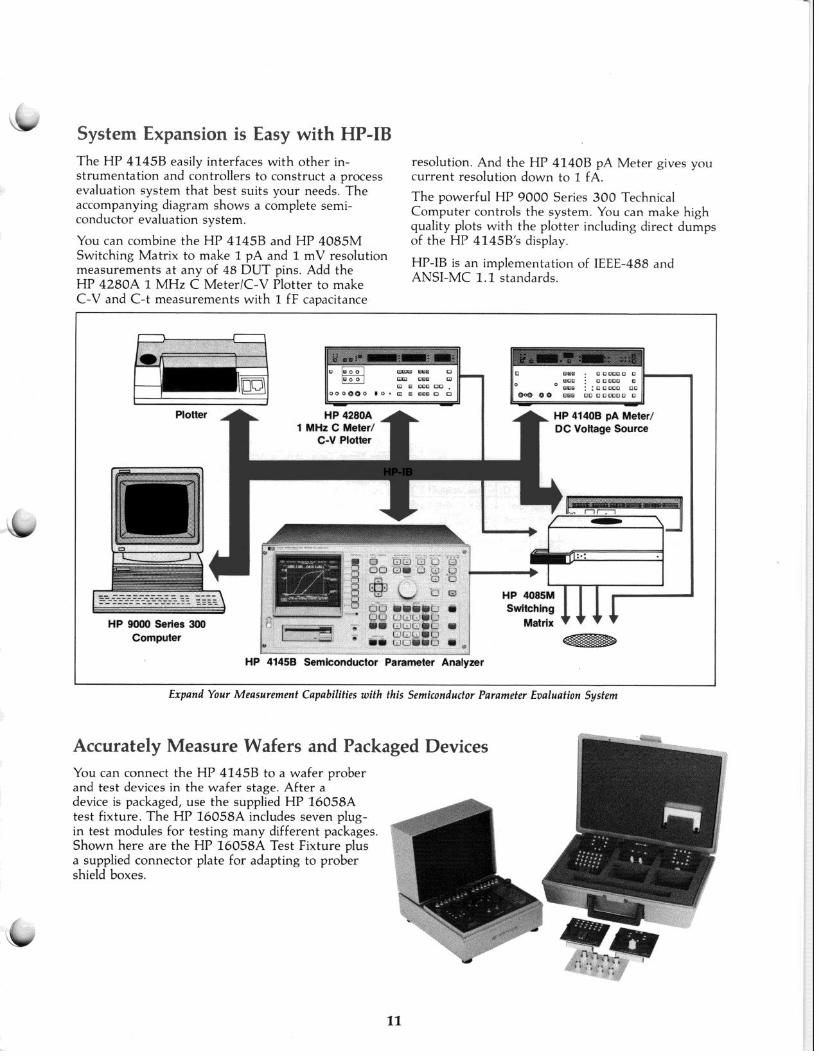
System Expansion is Easy with HP-IB
evaluation system that best suits your needs. The accompanying diagram shows a complete semi- conductor evaluation system.
The HP 4145B easily interfaces with other in- strumentation and controllers to construct a process
resolution. And the HP 4140B pA Meter gives you current resolution down to 1 fA.
The powerful HP 9000 Series 300 Technical Computer controls the system. You can make high quality plots with the plotter including direct dumos
You can combine the HP 4145B and HP 4085M df the HI’ 4145B’s display. I
Switching Matrix to make 1 pA and 1 mV resolution measurements at any of 48 DUT pins. Add the
HP-IB is an implementation of IEEE-488 and
HP 4280A 1 MHz C Meter/C-V Plotter to make ANSI-MC 1.1 standards.
C-V and C-t measurements with 1 fF capacitance
Plotter HP 4280A 1 MHz C Meter/
C-V Plotter
HP 41408 pA Meter/ DC Voltage Source
c HP 9000 Series 300
Computer
HP 4145B Semiconductor Parameter Analyzer
Expand Your Measurement Capabilities with this bemiconductor parameter fvatuation system
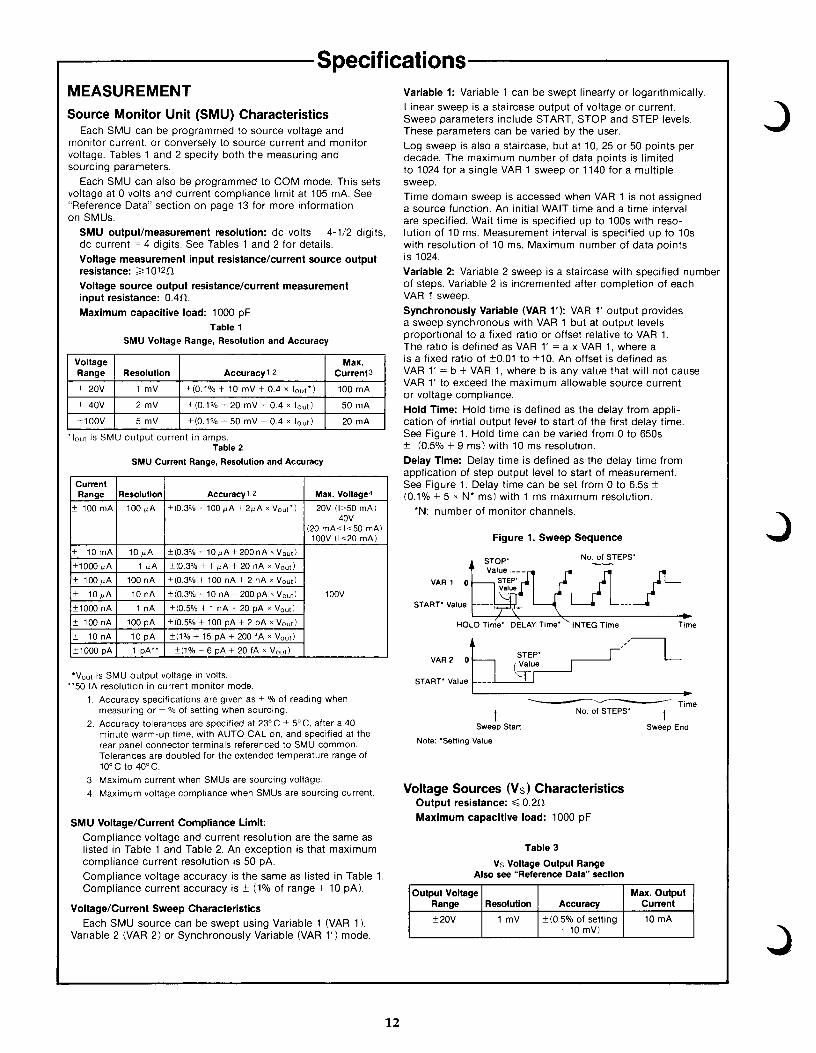
Accurately Measure Wafers and Packaged You can connect the HP 4145B to a wafer prober and test devices in the wafer stage. After a device is packaged, use the supplied HP 16058A test fixture. The HP 16058A includes seven plug- in test modules for testing many different packages. Shown here are the HP 16058A Test Fixture plus a supplied connector plate for adapting to prober shield boxes.
11
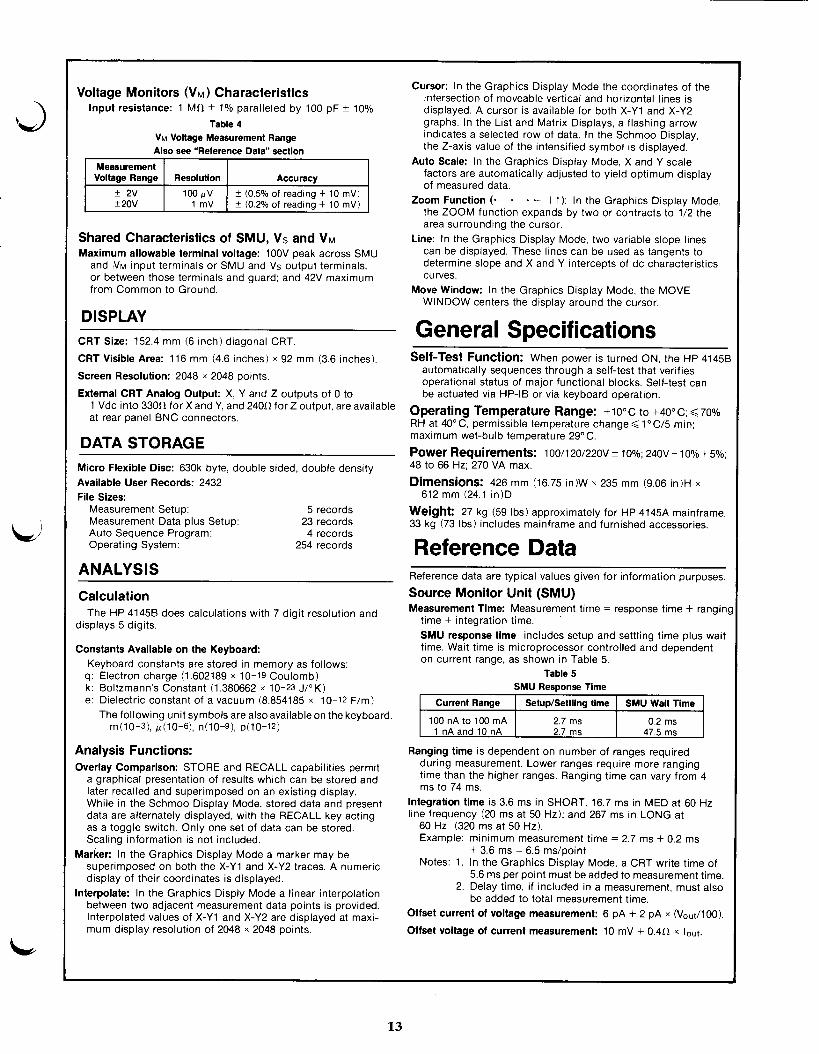
Specifications 1 MEASUREMENT Source Monitor Unit (SMU) Characteristics
Each SMU can be programmed to source voltage and monitor current, or conversely to source current and monitor voltage. Tables 1 and 2 specify both the measuring and sourcing parameters.
Each SMU can also be programmed to COM mode. This sets voltage at 0 volts and current compliance limit at 105 mA. See “Reference Data” section on page 13 for more information on SMUs.
SMU output/measurement resolution: dc volts = 4-l/2 digits, dc current = 4 digits. See Tables 1 and 2 for details.
Voltage measurement input resistance/current source output resistance: > 1012fl Voltage source output resistance/current measurement input resistance: 0.4R. Maximum capacitive load: 1000 pF
Table 1
SMU Voltage Range, Resolution and Accuracy
~1
*IoUt is SMU output current in amps. Table 2
SMU Current Range, Resolution and Accuracy
‘Vout IS SMU output voltage in volts. “50 fA resolution in current monitor mode.
1. Accuracy specifications are given es k % of reading when measuring or i- % of setting when sourcing.
2. Accuracy tolerances are specified at 23’C + 5”C, after a 40 minute warm-up time. with AUTO CAL on, and specified at the rear panel connector terminals referenced to SMU common. Tolerances are doubled for the extended temperature range of 10°C to 4ooc.
3 Maximum current when SMUs are sourcing voltage. 4. Maximum voltage compliance when SMUs are sourcing current.
SMU Voltage/Current Compliance Limit: Compliance voltage and current resolution are the same as listed in Table 1 and Table 2. An exception is that maximum compliance current resolution is 50 pA. Compliance voltage accuracy is the same as listed in Table 1. Compliance current accuracy is i- (1% of range + 10 pAI.
Voltage/Current Sweep Characteristics Each SMU source can be swept using Variable 1 (VAR 1).
Variable 2 (VAR 2) or Synchronously Variable (VAR 1’) mode.
Variable 1: Variable 1 can be swept linearly or logarithmically. Linear sweep is a staircase output of voltage or current. Sweep parameters include START, STOP and STEP levels. These parameters can be varied by the user. Log sweep is also a staircase, but at 10, 25 or 50 points per decade. The maximum number of data points is limited to 1024 for a single VAR 1 sweep or 1140 for a multiple sweep. Time domain sweep is accessed when VAR 1 is not assigned a source function. An initial WAIT time and a time interval are specified. Wait time is specified up to 100s with reso- lution of 10 ms. Measurement interval is specified up to 10s with resolution of 10 ms. Maximum number of data points is 1024. Variable 2: Variable 2 sweep is a staircase with specified number of steps. Variable 2 is incremented after completion of each VAR 1 sweep. Synchronously Variable (VAR 1’): VAR 1’ output provides a sweep synchronous with VAR 1 but at output levels proportional to a fixed ratio or offset relative to VAR 1. The ratio is defined as VAR 1’ = a x VAR 1, where a is a fixed ratio of kO.01 to *lo. An offset is defined as VAR 1’ = b + VAR 1, where b is any value that will not cause VAR 1’ to exceed the maximum allowable source current or voltage compliance. Hold Time: Hold time is defined as the delay from appli- cation of initial output level to start of the first delay time. See Figure 1. Hold time can be varied from 0 to 650s f (0.5% + 9 ms) with 10 ms resolution. Delay Time: Delay time is defined as the delay time from application of step output level to start of measurement. See Figure 1. Delay time can be set from 0 to 6.5s k (0.1% + 5 x N’ ms) with 1 ms maximum resolution.
l N: number of monitor channels.
Figure 1. Sweep Sequence
HOLD Tik \
DELAY Time’ \
INTEG Tome
t Sweep Start
Note: *Settmg Value
No. of STEPS’ t
Sweep End
Voltage Sources (VS) Characteristics Output resistance: < 0.2n Maximum capacitive load: 1000 pF
Table 3
VS Voltage Output Range Also see “Reference Data” section
Output Voltage Max. Output Range Resolution Accuracy Current
-+ 2ov 1 mV *(OS% of setting 10 mA + 10 mV)
3
J
J
12
Ld
Voltage Monitors (VM) Characteristics Input resistance: 1 MR i 1% paralleled by 100 pF f 10%
Table 4 VM Voltage Measurement Range Also see “Reference Data” section
Measurement Voltage Range Resolution Accuracy
* 2v 100 /Iv k (0.5% of reading + 10 mV) f20V 1 mV k (0.2% of reading + 10 mV)
Shared Characteristics of SMU, VS and VM Maximum allowable terminal voltage: 1OOV peak across SMU
and VM input terminals or SMU and Vs output terminals, or between those terminals and guard: and 42V maximum from Common to Ground.
DISPLAY CRT Size: 152.4 mm (6 inch) diagonal CRT.
CRT Visible Area: 116 mm (4.6 inches) x 92 mm (3.6 inches).
Screen Resolution: 2048 x 2048 points.
External CRT Analog Output: X, Y and Z outputs of 0 to 1 Vdc into 3300 for X and Y, and 24Ofl for Z output, are available at rear panel BNC connectors.
DATA STORAGE Micro Flexible Disc: 630k byte, double sided, double density Available User Records: 2432 File Sizes:
Measurement Setup: 5 records Measurement Data plus Setup: 23 records Auto Sequence Program: 4 records Operating System: 254 records
ANALYSIS
Calculation The HP 41458 does calculations with 7 digit resolution and
displays 5 digits.
Constants Available on the Keyboard: Keyboard constants are stored in memory as follows:
q: Electron charge (1.602189 x lo-19 Coulomb) k: Boltzmann’s Constant (1.380662 x lo-23 J/OK) e: Dielectric constant of a vacuum (8.854185 x lo-12 F/m)
The following unit symbols are alsoavailableon the keyboard. m(lO-s), p(lO-s), n(lO-s), p(lO-12)
Analysis Functions: Overlay Comparison: STORE and RECALL capabilities permit
a graphical presentation of results which can be stored and later recalled and superimposed on an existing display. While in the Schmoo Display Mode, stored data and present data are alternately displayed, with the RECALL key acting as a toggle switch. Only one set of data can be stored. Scaling information is not included.
Marker: In the Graphics Display Mode a marker may be superimposed on both the X-Y1 and X-Y2 traces. A numeric display of their coordinates is displayed.
Interpolate: In the Graphics Disply Mode a linear interpolation between two adjacent measurement data points is provided. Interpolated values of X-Y1 and X-Y2 are displayed at maxi- mum display resolution of 2048 x 2048 points.
Cursor: In the Graphics Display Mode the coordinates of the intersection of moveable vertical and horizontal lines is displayed. A cursor is available for both X-Y1 and X-Y2 graphs. In the List and Matrix Displays, a flashing arrow indicates a selected row of data. In the Schmoo Display, the Z-axis value of the intensified symbol is displayed.
Auto Scale: In the Graphics Display Mode, X and Y scale factors are automatically adjusted to yield optimum display of measured data.
Zoom Function (- - - - I 1): In the Graphics Display Mode, the ZOOM function expands by two or contracts to l/2 the area surrounding the cursor.
Line: In the Graphics Display Mode, two variable slope lines can be displayed. These lines can be used as tangents to determine slope and X and Y intercepts of dc characteristics curves.
Move Window: In the Graphics Display Mode, the MOVE WINDOW centers the display around the cursor.
General Specifications Self-Test Function: When power is turned ON, the HP 4145E
automatically sequences through a self-test that verifies operational status of major functional blocks. Self-test can be actuated via HP-IB or via keyboard operation.
Operating Temperature Range: +IO”C to +40°c; ~70% RH at 4O”C, permissible temperature change < l”C/5 min; maximum wet-bulb temperature 29°C.
Power Requirements: 100/i 20/22ov i 10s; 240v - I 0% + 5%; 48 to 66 Hz; 270 VA max.
Dimensions: 426 mm (16.75 in)W x 235 mm (9.06 in)H x 612 mm (24.1 in)D
Weight: 27 kg (59 Ibs) approximately for HP 4145A mainframe. 33 kg (73 Ibs) includes mainframe and furnished accessories.
Reference Data Reference data are typical values given for information purposes.
Source Monitor Unit (SMU) Measurement Time: Measurement time = response time + rangin!
time + integration time. SMU response time includes setup and settling time plus wait time. Wait time is microprocessor controlled and dependent on current range, as shown in Table 5.
Table 5 SMU Response Time
Current Range Setup/Settling time SMU Wait Time
100 nA to 100 mA 2.7 ms 0.2 ms 1 nA and 10 nA 2.7 ms 47.5 ms
Ranging time is dependent on number of ranges required during measurement. Lower ranges require more ranging time than the higher ranges. Ranging time can vary from 4 ms to 74 ms.
Integration time is 3.6 ms in SHORT, 16.7 ms in MED at 60 Hz line frequency (20 ms at 50 Hz); and 267 ms in LONG at
60 Hz (320 ms at 50 Hz). Example: minimum measurement time = 2.7 ms + 0.2 ms
+ 3.6 ms = 6.5 ms/point Notes: 1. In the Graphics Display Mode, a CRT write time of
5.6 ms per point must be added to measurement time. 2. Delay time, if included in a measurement, must also
be added to total measurement time. Offset current of voltage measurement: 6 pA + 2 pA x (V&100).
Offset voltage of current measurement 10 mV + 0.40 x lout.
13
Noise Characteristics Voltage source noise: 0.01% of range (rms). Current source noise: 0.03% of range t 3 pA t 0.005 pA x
Ordering Information Cg’ (rms). STANDARD CONFIGURATION
HP 41458 Semiconductor Parameter Analyzer
Voltage monitor: 0.02% of range (peak to peak). Current monitor: 0.3% of range t 10 pA (peak to peak). *Cc is externally added capacitance from the guard terminal
to center conductor, and expressed in pF. ACCESSORIES FURNISHED Output Overshoot HP 16058A Test Fixture
Voltage source: 5 mV 04145-60001 Connector Plate
Current source: < 1% 0414561622 Triaxial Cable (3m), 4 ea. 0414561630 BNC Cable (3m), 4 ea. 0414561623 Shorting Connector 0414561501 System Disc
Current Range Switching Transient Noise Range Increment: 0.01% of voltage range + 10 mV.* Range decrement: 10 mV”. Maximum internal guard to ground capacitance: 700 pF Guard potential offset: 1 mV Guard current induced voltage error: lOOn x Ia where Is is the guard current. ‘When switching between 10 nA and 100 nA ranges, add 120/(3 + C,) mV where CX is the load capacitance in pF.
Voltage Source (VS) Output noise: 6 mV rms
Voltage Monitor (VM) Noise level at input: 0.3 mV p-p on 2 V range* 3 mV p-p on 20 V range *With integration time set to MED or LONG
Source Monitor Unit (SMU) and Voltage Monitor (VM)
Noise rejection guidelines are valid when line frequency is either 50 Hz or 60 Hz. Normal mode noise rejection: 260 dB Common mode noise rejection: Current monitor: <2 PAN ‘With integration time set to MED or LONG
OPTIONS Option 907: Front Handle Kit
(HP P/N 5061-0091) Option 908: Rack Flange Kit
(HP P/N 5061-0079) Option 909: Rack and Handle Kit
(HP P/N 5061-0085) Option 910: Extra Manual
(HP P/N 0414590000)
AVAILABLE ACCESSORIES 16267A File Transfer Software
HP 4145A Software (Special HP 4145A Operating System) transfers files from the HP 4145A to the HP 41458.
16266A BS&DM* File Creation Software Operates on the HP 9000 Series 200/300 Computers. Reads data from the HP 41458 disc and converts the data from HP 41458 format to the BS&DM* format. (3.5 inch flexible disc.) ‘BS&DM is the Basic Statistics and Data Manipulation format used in the HP 9882OA/B/C Statistical Library.
92192A 3-l/2” Double-sided Microfloppy (Box of 10)
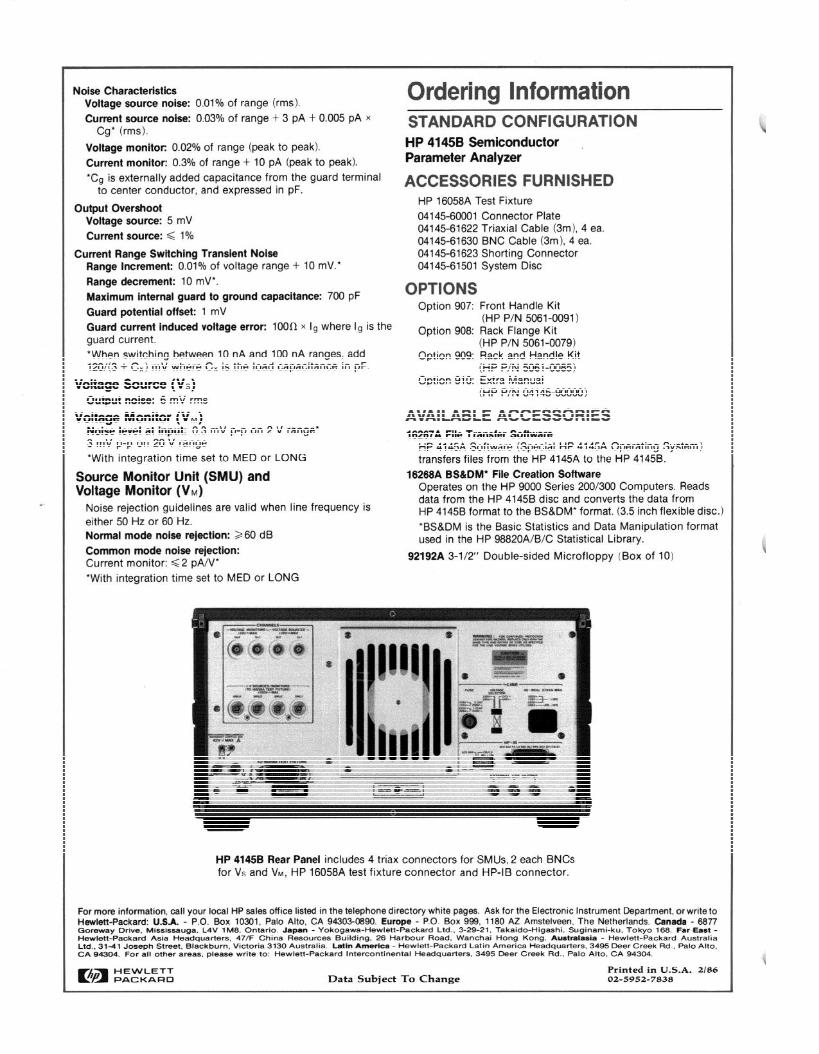
HP 41458 Rear Panel includes 4 triax connectors for SMUs, 2 each BNCs for VS and VU, HP 16058A test fixture connector and HP-IB connector.
For more information, call your local HP sales office listed in the telephone directory white pages. Ask for the Electronic Instrument Department, orwriteto Hewlett-Packard: U.S.A. - P.O. Box 10301, Palo Alto, CA 94303-0690. Europe - P.O. Box 999, 1160 AZ Amstelveen, The Netherlands. Canada - 6677 Goreway Drive, Mississauga. L4V lM6, Ontario. Japan - Yokogawa-Hewlett-Packard Ltd., 3-29-21, Takaido-Higashi. Suginami-ku, Tokyo 168. Far East - Hewlett-Packard Asia Headquarters, 47/F China Resources Building, 26 Harbour Road, Wanchai Hong Kong. Australasia - Hewlett-Packard Australia Ltd., 3141 Joseph Street, Blackburn, Victoria 3130 Australia. Latin America - Hewlett-Packard Latin America Headquarters. 3495 Deer Creek Rd., Palo Alto, CA 94304. For all other areas, please write to: Hewlett-Packard Intercontinental Headquarters, 3495 Deer Creek Rd.. Palo Alto, CA 94304.
EEY HEWLETT Printed in U.S.A. 2/86 PACKARD Data Subject To Change 02-5952-7838