Embed Size (px)
Citation preview

HP INC. Q1 FY18
February 22, 2018http://www.hp.com/investor/home
Forward-looking statements
This presentation contains forward-looking statements that involve risks, uncertainties and assumptions. If the risks or uncertainties ever materialize or the assumptions proveincorrect, the results of HP Inc. and its consolidated subsidiaries (“HP”) may differ materially from those expressed or implied by such forward-looking statements and assumptions.
All statements other than statements of historical fact are statements that could be deemed forward-looking statements, including but not limited to any projections of netrevenue, margins, expenses, effective tax rates, net earnings, net earnings per share, cash flows, benefit plan funding, deferred taxes, share repurchases, foreign currency exchangerates or other financial items; any projections of the amount, timing or impact of cost savings or restructuring and other charges; any statements of the plans, strategies andobjectives of management for future operations, including, but not limited to, our sustainability goals, the execution of restructuring plans and any resulting cost savings, netrevenue or profitability improvements; any statements concerning the expected development, performance, market share or competitive performance relating to products orservices; any statements regarding current or future macroeconomic trends or events and the impact of those trends and events on HP and its financial performance; anystatements regarding pending investigations, claims or disputes; any statements of expectation or belief, including with respect to the timing and expected benefits of acquisitionsand other business combination and investment transactions; and any statements of assumptions underlying any of the foregoing.
Risks, uncertainties and assumptions include the need to address the many challenges facing HP’s businesses; the competitive pressures faced by HP’s businesses; risks associatedwith executing HP’s strategy; the impact of macroeconomic and geopolitical trends and events; the need to manage third-party suppliers and the distribution of HP’s products andthe delivery of HP’s services effectively; the protection of HP’s intellectual property assets, including intellectual property licensed from third parties; risks associated with HP’sinternational operations; the development and transition of new products and services and the enhancement of existing products and services to meet customer needs and respondto emerging technological trends; the execution and performance of contracts by HP and its suppliers, customers, clients and partners; the hiring and retention of key employees;integration and other risks associated with business combination and investment transactions; the results of the restructuring plans, including estimates and assumptions related tothe cost (including any possible disruption of HP’s business) and the anticipated benefits of the restructuring plans; the impact of changes in tax laws, including uncertainties relatedto the interpretation and application of the Tax Cuts and Jobs Act of 2017 on HP’s tax obligations and effective tax rate; the resolution of pending investigations, claims and disputes;and other risks that are described in HP’s Annual Report on Form 10-K for the fiscal year ended October 31, 2017 and HP’s other filings with the Securities and ExchangeCommission.
As in prior periods, the financial information set forth in this presentation, including any tax-related items, reflects estimates based on information available at this time. While HPbelieves these estimates to be reasonable, these amounts could differ materially from reported amounts in HP’s Quarterly Report on Form 10-Q for the fiscal quarter ended January31, 2018 and HP’s other filings with the Securities and Exchange Commission. HP assumes no obligation and does not intend to update these forward-looking statements. HP’sInvestor Relations website at http://www.hp.com/investor/home contains a significant amount of information about HP, including financial and other information for investors. HPencourages investors to visit its website from time to time, as information is updated and new information is posted.
© Copyright 2018 HP Development Company, L.P. The information contained herein is subject to change without notice.2

Use of non-GAAP financial information
HP has included non-GAAP financial measures in this presentation to supplement HP’s consolidated financial statements presented on a GAAP basis. Definitions of these non-GAAPfinancial measures and reconciliations of these non-GAAP financial measures, to the most directly comparable GAAP financial measures are included elsewhere in this presentation.
HP’s management uses net revenue on a constant currency basis, non-GAAP total operating expense, non-GAAP operating profit, non-GAAP tax rate, non-GAAP net earnings, andnon-GAAP diluted net earnings per share to evaluate and forecast HP’s performance before gains, losses or other charges that are considered by HP’s management to be outside ofHP’s core business segment operating results. Gross cash, net cash (debt), and free cash flow are liquidity measures that provide useful information to management about theamount of cash available for investment in HP’s businesses, funding acquisitions, repurchasing stock and other purposes. Net cash (debt) provides useful information tomanagement about the state of HP’s consolidated balance sheet.
These non-GAAP financial measures may have limitations as analytical tools, and these measures should not be considered in isolation or as a substitute for analysis of HP’s resultsas reported under GAAP. For example, items such as amortization of intangible assets, though not directly affecting HP’s cash position, represent the loss in value of intangibleassets over time. The expense associated with this change in value is not included in non-GAAP operating profit, non-GAAP tax rate, non-GAAP net earnings, and non-GAAP dilutednet earnings per share and therefore does not reflect the full economic effect of the change in value of those intangible assets. In addition, items such as restructuring and othercharges, acquisition-related charges, non-operating retirement-related credits/(charges), defined benefit plan settlement charges, tax indemnifications, US tax reform adjustment,net valuation allowances, separation taxes and adjustments and the related tax impact on these items that are excluded from non-GAAP total operating expense, non-GAAPoperating profit, non-GAAP tax rate, non-GAAP net earnings and non-GAAP diluted net earnings per share can have a material impact on the equivalent GAAP earnings financialmeasures and cash flow. HP may not be able to immediately liquidate the short-term and long-term investments included in gross cash, which may limit the usefulness of grosscash as a liquidity measure. In addition, free cash flow, which includes net capital expenditures, does not represent the total increase or decrease in cash for the period. The non-GAAP financial information that we provide also may differ from the non-GAAP information provided by other companies.
We compensate for the limitations on our use of these non-GAAP financial measures by relying primarily on our GAAP financial statements and using non-GAAP financial measuresonly supplementally. We also provide robust and detailed reconciliations of each non-GAAP financial measure to the most directly comparable GAAP measure, and we encourageinvestors to review those reconciliations carefully.
We believe that providing these non-GAAP financial measures in addition to the related GAAP measures provides investors with greater transparency to the information used byHP’s management in its financial and operational decision-making and allows investors to see HP’s results “through the eyes” of management. We further believe that providing thisinformation better enables investors to understand HP’s operating performance and financial condition and to evaluate the efficacy of the methodology and information used byHP’s management to evaluate and measure such performance and financial condition.
HP’s Investor Relations website at http://www.hp.com/investor/home contains a significant amount of information about HP, including financial and other information for investors.HP encourages investors to visit its website from time to time, as information is updated and new information is posted.
© Copyright 2018 HP Development Company, L.P. The information contained herein is subject to change without notice.3

Q1 FY18 highlights
• Net revenue of $14.5 billion, up 14% from theprior-year period and up 13% in constant currency1
• Non-GAAP2 diluted net earnings per share of$0.48, above the previously provided outlook of$0.40 to $0.43 per share
• GAAP diluted net earnings per share of $1.16, above the previously provided outlook of $0.38 to $0.42 per share
• Free cash flow of $977 million2,3
• Returned $692 million to shareholders in theform of share repurchases and dividends
© Copyright 2018 HP Development Company, L.P. The information contained herein is subject to change without notice.4
1. Adjusted to exclude the effect of foreign currency exchange fluctuations calculated by translating current period revenues using monthly average exchange ratesfrom the comparative period and excluding any hedging impact recognized in the current period
2. A reconciliation of specific adjustments to GAAP results for the current and prior periods is included on slide 13 and in the GAAP to non-GAAP slides that appear as partof the supplemental slides of this presentation. A description of HP’s use of non-GAAP information is provided on slide 3 under “Use of non-GAAP financial information”
3. Free cash flow includes net cash provided by operations of $996 million and net investments in property, plant and equipment of $19 million.

Q1 FY18 results overview
$ in millionsQ1 Net
revenueGrowth
y/y%Growth
CC1 y/y%Non-GAAP
OP $
Non-GAAP OP
% of rev
Non-GAAP OP
$ y/y
Non-GAAP OP
% of rev y/y
Printing $5,076 13.7% 12.4% $801 15.8% $87 (0.2) pts
Personal Systems $9,440 14.9% 13.0% $337 3.6% $25 (0.2) pts
Corp investments / Other $1 nm2 nm2 ($127) nm2 ($4) nm2
Total HP 3
$14,517 14.5% 12.8% $1,011 7.0% $108 (0.1) pts
© Copyright 2018 HP Development Company, L.P. The information contained herein is subject to change without notice.5
See HP’s Form 8-K filed on February 22, 2018 for segment and business unit realignment details
1. CC = constant currency; adjusted to exclude the effect of foreign currency exchange fluctuations calculated by translating current period revenues using monthly average exchange rates from the comparative period and excluding any hedging impact recognized in the current period
2. Not meaningful
3. A reconciliation of specific adjustments to GAAP results for the current period is included on slide 13and in the GAAP to non-GAAP slides that appear as part of the supplemental slides of this presentation.A description of HP’s use of non-GAAP information is provided on slide 3 under “Use of non-GAAP financial information”
Non-GAAP operating profit2
By key segment3
Net revenueBy key segment and business unit1 Net revenue by region
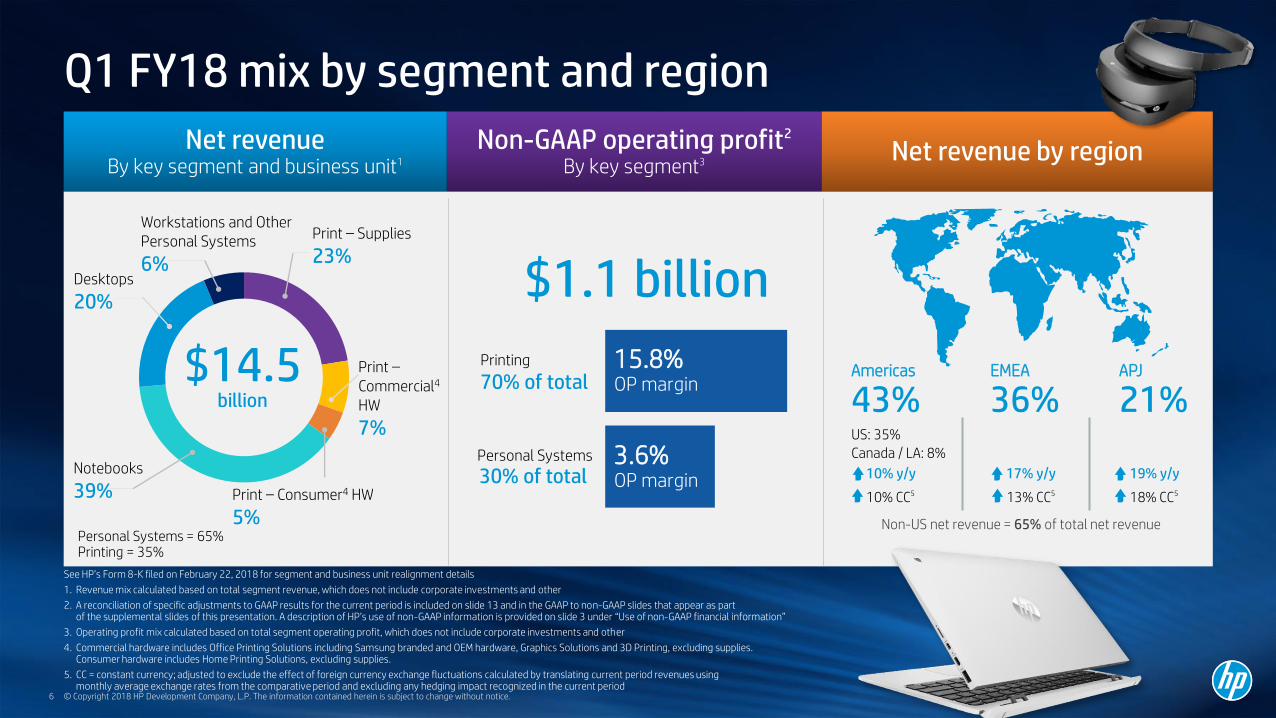
Q1 FY18 mix by segment and region
$1.1 billion
Printing
Personal Systems
30% of total
70% of total
Non-US net revenue = 65% of total net revenue
$14.5billion
Notebooks
39% Print – Consumer4 HW
5%
Desktops
20%
Workstations and Other Personal Systems
6%
Print – Supplies
23%
Print –Commercial4
HW
7%
Personal Systems = 65%Printing = 35%
15.8%OP margin
3.6%OP margin
APJ
21%EMEA
36%Americas
43%US: 35%
Canada / LA: 8%
10% y/y
10% CC5
17% y/y
13% CC5
19% y/y
18% CC5
© Copyright 2018 HP Development Company, L.P. The information contained herein is subject to change without notice.6
See HP’s Form 8-K filed on February 22, 2018 for segment and business unit realignment details
1. Revenue mix calculated based on total segment revenue, which does not include corporate investments and other
2. A reconciliation of specific adjustments to GAAP results for the current period is included on slide 13 and in the GAAP to non-GAAP slides that appear as partof the supplemental slides of this presentation. A description of HP’s use of non-GAAP information is provided on slide 3 under “Use of non-GAAP financial information”
3. Operating profit mix calculated based on total segment operating profit, which does not include corporate investments and other
4. Commercial hardware includes Office Printing Solutions including Samsung branded and OEM hardware, Graphics Solutions and 3D Printing, excluding supplies.Consumer hardware includes Home Printing Solutions, excluding supplies.
5. CC = constant currency; adjusted to exclude the effect of foreign currency exchange fluctuations calculated by translating current period revenues usingmonthly average exchange rates from the comparative period and excluding any hedging impact recognized in the current period
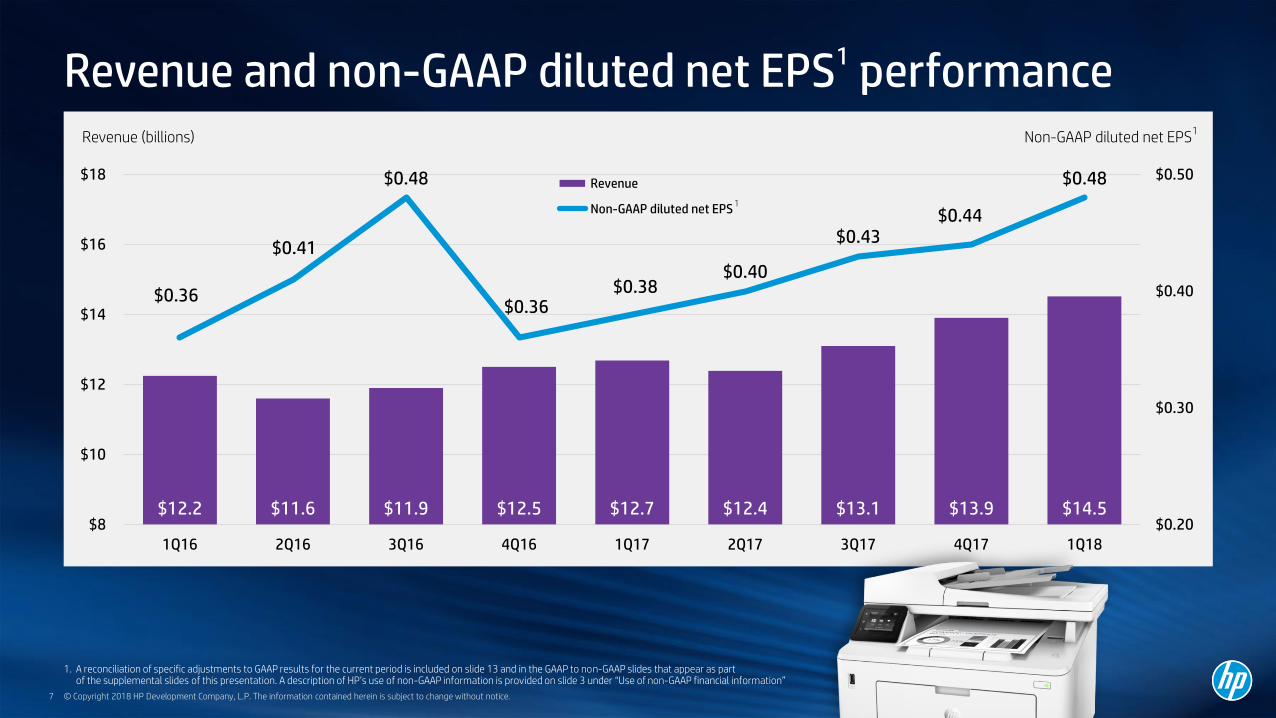
Non-GAAP diluted net EPS1
Revenue (billions)
$12.2 $11.6 $11.9 $12.5 $12.7 $12.4 $13.1 $13.9 $14.5
$0.36
$0.41
$0.48
$0.36 $0.38
$0.40
$0.43 $0.44
$0.48
$0.20
$0.30
$0.40
$0.50
$8
$10
$12
$14
$16
$18
1Q16 2Q16 3Q16 4Q16 1Q17 2Q17 3Q17 4Q17 1Q18
Revenue
Non-GAAP diluted net EPS1
Revenue and non-GAAP diluted net EPS1 performance
© Copyright 2018 HP Development Company, L.P. The information contained herein is subject to change without notice.7
1. A reconciliation of specific adjustments to GAAP results for the current period is included on slide 13 and in the GAAP to non-GAAP slides that appear as partof the supplemental slides of this presentation. A description of HP’s use of non-GAAP information is provided on slide 3 under “Use of non-GAAP financial information”

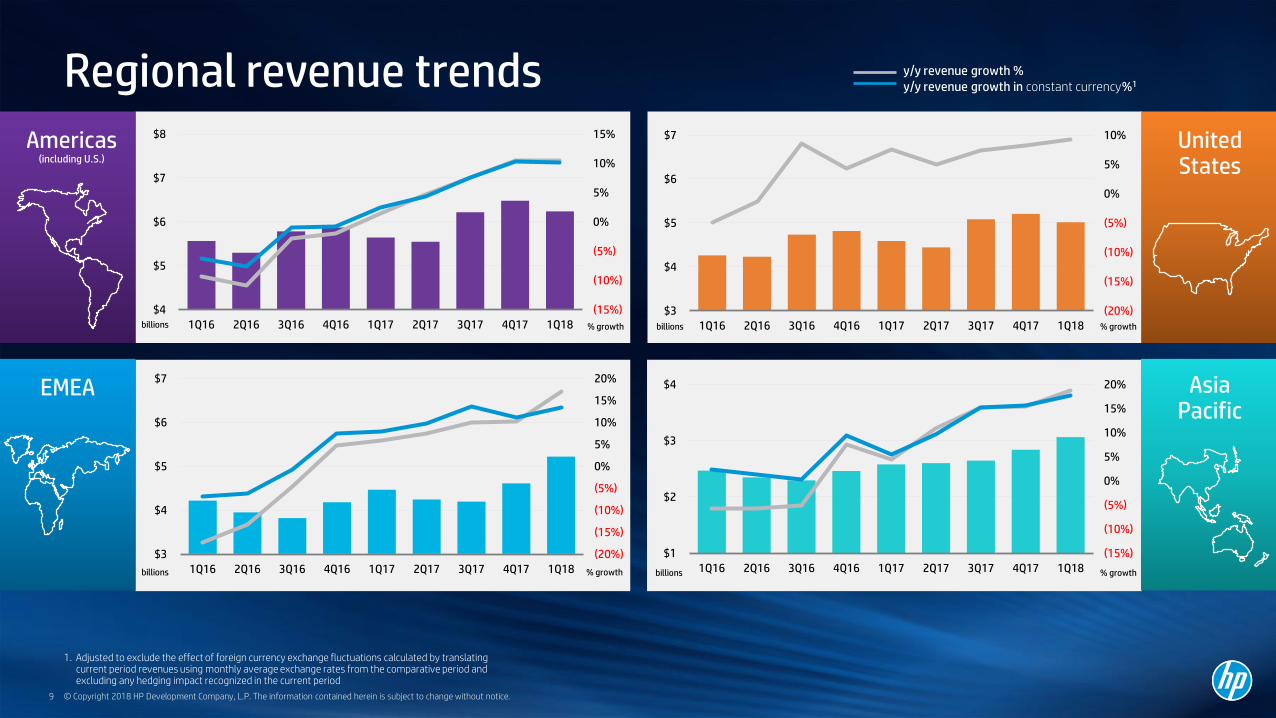
Revenue growth
1. Adjusted to exclude the effect of foreign currency exchange fluctuations calculated by translating current period revenues using monthly average exchange rates from the comparative period and excluding any hedging impact recognized in the current period
© Copyright 2018 HP Development Company, L.P. The information contained herein is subject to change without notice.8
(4.9%) (5.4%)
(0.7%)
3.8% 4.9%
7.2%
10.9% 11.7%
12.8%
(11.6%) (10.7%)
(3.8%)
2.0%
3.6%
6.9%
9.8% 11.3%
14.5%
(15%)
(10%)
(5%)
0%
5%
10%
15%
1Q16 2Q16 3Q16 4Q16 1Q17 2Q17 3Q17 4Q17 1Q18
Revenue growth in constant currency Revenue growth as reported1
y/y growth (%)
(20%)
(15%)
(10%)
(5%)
0%
5%
10%
15%
20%
$3
$4
$5
$6
$7
1Q16 2Q16 3Q16 4Q16 1Q17 2Q17 3Q17 4Q17 1Q18billions
y/y revenue growth %y/y revenue growth in constant currency%1
EMEA
(15%)
(10%)
(5%)
0%
5%
10%
15%
$4
$5
$6
$7
$8
1Q16 2Q16 3Q16 4Q16 1Q17 2Q17 3Q17 4Q17 1Q18
Americas(including U.S.)
billions % growth
(20%)
(15%)
(10%)
(5%)
0%
5%
10%
$3
$4
$5
$6
$7
1Q16 2Q16 3Q16 4Q16 1Q17 2Q17 3Q17 4Q17 1Q18billions % growth
United States
Regional revenue trends
© Copyright 2018 HP Development Company, L.P. The information contained herein is subject to change without notice.9
(15%)
(10%)
(5%)
0%
5%
10%
15%
20%
$1
$2
$3
$4
1Q16 2Q16 3Q16 4Q16 1Q17 2Q17 3Q17 4Q17 1Q18% growth billions % growth
Asia Pacific
1. Adjusted to exclude the effect of foreign currency exchange fluctuations calculated by translatingcurrent period revenues using monthly average exchange rates from the comparative period andexcluding any hedging impact recognized in the current period

Personal Systems
© Copyright 2018 HP Development Company L.P. The information contained herein is subject to change without notice.10
Q1 FY18
See HP’s Form 8-K filed on February 22, 2018 for segment and business unit realignment details
1. CC = constant currency; adjusted to exclude the effect of foreign currency exchange fluctuations calculated by translating current period revenues using monthly average exchange rates from the comparative period and excluding any hedging impact recognized in the current period
2. CQ4’17 IDC PC Unit share data
3. Based on HP internal testing using the PCMark 10 benchmark, 8th Gen Intel® Core™ i7-8705G Processor with Radeon RX Vega M GL graphics, Radeon RX Vega M Graphics, 16gb RAM, 512gb SSD, 4K display.
Operating profit
$337 million
3.6% of revenue
Revenue
$9.4 billion
15% y/y 13% CC1
0%
1%
2%
3%
4%
5%
6%
$0.0
$2.0
$4.0
$6.0
$8.0
$10.0
$12.0
In billions
Notebooks 59% Desktops 31% Workstations 6% Other 4%
• Continued double digit revenue growth y/y across all regions,driven by innovation and focus on strategic growth areas
• Consistent operational execution in the face of difficult commodity price environment
• Outgrew all major competitors with profitable share growth of1.7 pts y/y to 23.5%2; grew commercial share by 0.5 pts y/y to 25.8%2
• Innovation: 77 awards at CES: Spectre x360 15 – most powerful convertible PC3;HP ENVY x2 – always connected PCs. OMEN X 65 inch gaming display.Expanded DaaS offering.
Keymessages
Total units up 7% y/y
Notebooks revenue up 14% y/y, units up 8% y/y
Desktops revenue up 17% y/y, units up 6% y/y
Commercial revenue up 16% y/y
Consumer revenue up 13% y/y
Key metricsRevenue and OP % trendRevenue breakdown
Rev
enu
e
OP
% r
even
ue

PrintingQ1 FY18
Supplies 66% Commercial3 Hardware 21% Consumer3 Hardware 13%
• Acquisition of Samsung‘s printer business closed on November 1, 2017
• Continued y/y revenue growth across hardware and supplies in all regions
• Growth in strategic areas: A3, Graphics, MPS2 and Instant Ink
• Investment in hardware placement drove strong unit growth
• 3D momentum with new partners and materials
• Innovation: Introduced color 3D Printing solution at lower price point;next generation Sprocket and Sprocket App
Supplies revenue up 10% (10% CC1) y/y
Total Hardware units up 14% y/y
Commercial3 Hardware units up 73% y/y
Consumer3 Hardware units up 7% y/y
Key metricsRevenue and OP % trendRevenue breakdown
Revenue
$5.1 billion
14% y/y 12% CC1
Keymessages
Operating profit
$801 million
15.8% of revenue
4%
6%
8%
10%
12%
14%
16%
18%
20%
22%
$0.0
$1.0
$2.0
$3.0
$4.0
$5.0
$6.0
$7.0
$8.0
Rev
enu
e
OP
% r
even
ue
In billions
See HP’s Form 8-K filed on February 22, 2018 for segment and business unit realignment details
1. CC = constant currency; adjusted to exclude the effect of foreign currency exchange fluctuations calculated by translating current period revenuesusing monthly average exchange rates from the comparative period and excluding any hedging impact recognized in the current period
2. MPS = Managed Print Services
3. Commercial hardware includes Office Printing Solutions including Samsung branded and OEM hardware, Graphics Solutions and 3D Printing, excluding supplies.Consumer hardware includes Home Printing Solutions, excluding supplies
© Copyright 2018 HP Development Company L.P. The information contained herein is subject to change without notice.11

Non-GAAP1 financial information
© Copyright 2018 HP Development Company, L.P. The information contained herein is subject to change without notice.12
$ in millions, exceptper share amounts
Q1 FY18 Q4 FY17 Q1 FY17
Revenue $14,517 $13,927 $12,684
Cost of revenue 11,935 82.2% 11,407 81.9% 10,436 82.3%
Total OpEx 1,571 10.8% 1,501 10.8% 1,345 10.6%
Operating profit $1,011 7.0% $1,019 7.3% $903 7.1%
Interest and other, net (66) (65) (90)
Pre-tax earnings 945 6.5% 954 6.9% 813 6.4%
Income tax (142) (205) (167)
Net earnings 803 5.5% 749 5.4% 646 5.1%
Diluted net earnings per share $0.48 $0.44 $0.38
1. A reconciliation of specific adjustments to GAAP results for the current period is included on slide 13 and in the GAAP tonon-GAAP slides that appear as part of the supplemental slides of this presentation. A description of HP’s use of non-GAAPinformation is provided on slide 3 under “Use of non-GAAP financial information”

$ in millions, except tax rate and pershare amounts
GAAP
Amortizationof
intangible assets
Restructuring and other charges
Acquisition-related charges
Defined benefit plan settlement
charges
Tax indemnification
US tax reform adjustment
Non-operating retirement
related credits /(charges)
Non-GAAP
Revenue $14,517 $14,517
Cost of revenue 11,935 11,935
Total OpEx 1,609 (20) (31) (42) (1) 56 1,571
Operating profit 973 20 31 42 1 (56) 1,011
Interest and other, net (68) 2 (66)
Pre-tax earnings 905 20 31 42 1 2 (56) 945
Income tax 1,033 (5) (8) (18) (2) (1,145) 3 (142)
Tax rate (114.1)% 15.0%
Net earnings 1,938 15 23 24 1 (1,145) (53) $803
Diluted netearnings per share
$1.16 $0.48
Q1 FY18 GAAP to non-GAAP bridge
© Copyright 2018 HP Development Company, L.P. The information contained herein is subject to change without notice.13
A description of HP’s use of non-GAAP information is provided on slide 3 under “Use of non-GAAP financial information”

Select cash and debt balances
© Copyright 2018 HP Development Company, L.P. The information contained herein is subject to change without notice.14
1. Net cash (debt) is defined as gross cash less gross debt after adjusting the effect of unamortized premium / discount ondebt issuance, debt issuance costs and unrealized gains / losses on fair value hedges and interest rate swaps
2. Gross cash includes cash and cash equivalents, short-term investments, and certain liquid long-term investments
$ in billions 1Q17 2Q17 3Q17 4Q17 1Q18
Gross cash2 6.3 6.2 8.0 8.1 6.7
Gross debt 6.8 6.8 7.8 7.8 7.9
Net cash (debt)1 (0.5) (0.6) 0.2 0.3 (1.2)
In billions
Net cash (debt)1
($10.0)
($5.0)
$0.0
$5.0
$10.0
$15.0
$20.0
1Q17 2Q17 3Q17 4Q17 1Q18
Gross cash Gross debt2

Cash flow
© Copyright 2018 HP Development Company, L.P. The information contained herein is subject to change without notice.15
1. Free cash flow = net cash provided by operations less net capital expenditures; net capital expenditures = investments in property, plant and equipment less proceeds from the sale of property, plant and equipment
$ millions
1
$3,677
$996$767
$996
$3,344
$977$735
$977
0
500
1,000
1,500
2,000
2,500
3,000
3,500
4,000
FY17 FY18 YTD Q117 Q118
Net cash provided by operations Free cash flow

Shareholder return
© Copyright 2018 HP Development Company, L.P. The information contained herein is subject to change without notice.16
894
230 227 230
1,412
462 386 462
0
500
1,000
1,500
2,000
2,500
FY17 FY18 YTD Q117 Q118
Dividend payment Share repurchase
Shares repurchased 25.5 million21.2 million79.53 million
Dividend per share $0.1327$0.1393$0.5308
$613 million$692 million
21.2 million
$0.1393
$ millions $2.3 billion
$0.7 billion
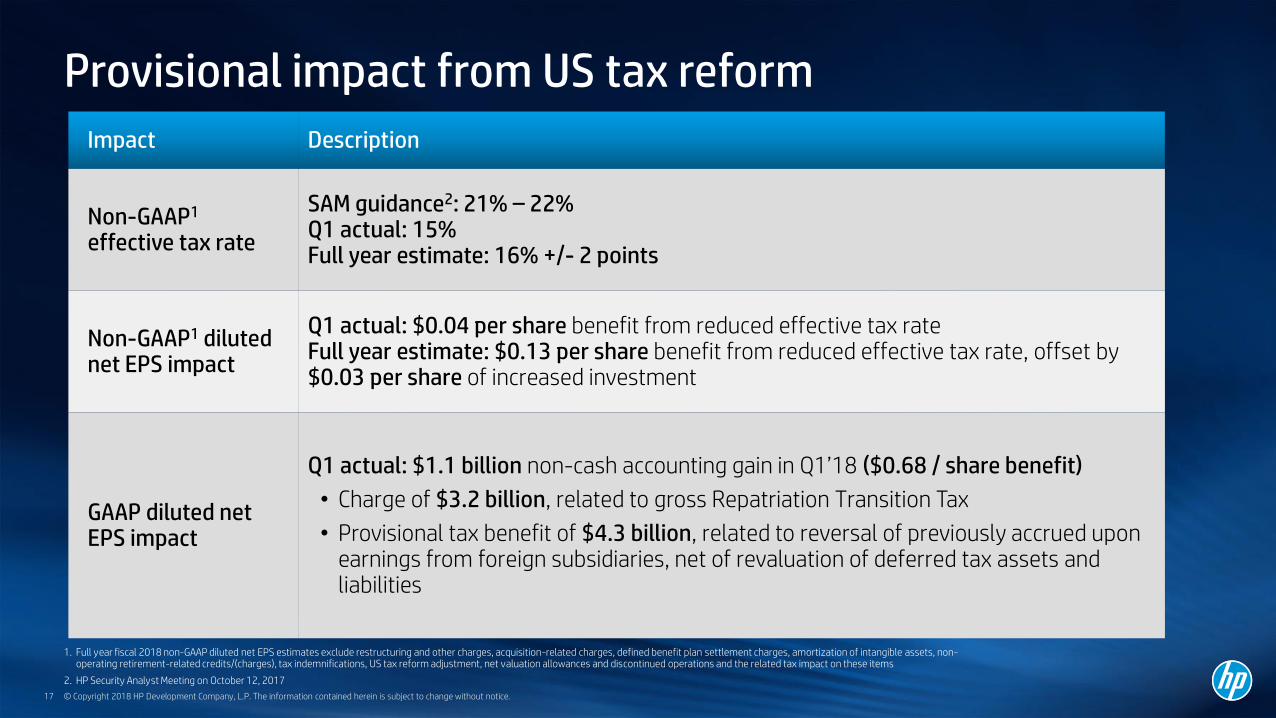
Provisional impact from US tax reform
© Copyright 2018 HP Development Company, L.P. The information contained herein is subject to change without notice.17
Impact Description
Non-GAAP1
effective tax rate
SAM guidance2: 21% – 22% Q1 actual: 15%Full year estimate: 16% +/- 2 points
Non-GAAP1 diluted net EPS impact
Q1 actual: $0.04 per share benefit from reduced effective tax rateFull year estimate: $0.13 per share benefit from reduced effective tax rate, offset by $0.03 per share of increased investment
GAAP diluted net EPS impact
Q1 actual: $1.1 billion non-cash accounting gain in Q1’18 ($0.68 / share benefit)
• Charge of $3.2 billion, related to gross Repatriation Transition Tax
• Provisional tax benefit of $4.3 billion, related to reversal of previously accrued upon earnings from foreign subsidiaries, net of revaluation of deferred tax assets and liabilities
1. Full year fiscal 2018 non-GAAP diluted net EPS estimates exclude restructuring and other charges, acquisition-related charges, defined benefit plan settlement charges, amortization of intangible assets, non-operating retirement-related credits/(charges), tax indemnifications, US tax reform adjustment, net valuation allowances and discontinued operations and the related tax impact on these items
2. HP Security Analyst Meeting on October 12, 2017

Outlook
© Copyright 2018 HP Development Company, L.P. The information contained herein is subject to change without notice.18
Q2 FY18 net EPS guidance
GAAP diluted net EPS $0.42 – $0.46
Non-GAAP diluted net EPS1 $0.45 – $0.49
Full year FY18 net EPS guidance
GAAP diluted net EPS $2.53 – $2.63
Non-GAAP diluted net EPS2 $1.90 – $2.00
Full year FY18 free cash flow
Free cash flow At least $3.0B
1. Second quarter fiscal 2018 non-GAAP diluted net EPS estimates exclude restructuring and other charges, acquisition-related charges, defined benefit plan settlement charges,amortization of intangible assets, non-operating retirement-related credits / (charges), tax indemnifications, US tax reform adjustment, net valuation allowances anddiscontinued operations and the related tax impact on these items
2. Full year fiscal 2018 non-GAAP diluted net EPS estimates exclude restructuring and other charges, acquisition-related charges, defined benefit plan settlement charges,amortization of intangible assets, non-operating retirement-related credits / (charges), tax indemnifications, US tax reform adjustment, net valuation allowances anddiscontinued operations and the related tax impact on these items

Supplemental slides
19 © Copyright 2018 HP Development Company, L.P. The information contained herein is subject to change without notice.

Inventory and accounts receivable
© Copyright 2018 HP Development Company, L.P. The information contained herein is subject to change without notice.20
1. % of revenue calculations based on trailing 4-quarter net revenue
$3.5
$4.0
$4.5 $4.6 $4.8
$5.2
$5.8 $5.7
7.3%
8.3%
9.3%9.4% 9.6%
10.2%
11.1%10.5%
0.0%
2.0%
4.0%
6.0%
8.0%
10.0%
12.0%
14.0%
16.0%
$0.0
$1.0
$2.0
$3.0
$4.0
$5.0
$6.0
$7.0
Apr16 Jul16 Oct16 Jan17 Apr17 Jul17 Oct17 Jan18
$3.9 $4.0 $4.1
$3.5 $3.8
$4.2 $4.4 $4.4
8.0%8.4% 8.5%
7.1% 7.6%
8.4% 8.5% 8.2%
0.0%
2.0%
4.0%
6.0%
8.0%
10.0%
12.0%
14.0%
16.0%
$0.0
$1.0
$2.0
$3.0
$4.0
$5.0
$6.0
$7.0
Apr16 Jul16 Oct16 Jan17 Apr17 Jul17 Oct17 Jan18
In billions In billions
% o
f re
ven
ue
1
% o
f re
ven
ue
1
Account receivableInventory

PP&E and accounts payable
© Copyright 2018 HP Development Company, L.P. The information contained herein is subject to change without notice.21
In billions
$9.1
$10.4 $11.1 $11.0 $11.1
$12.8 $13.3
$12.8
$0.0
$2.0
$4.0
$6.0
$8.0
$10.0
$12.0
$14.0
$16.0
Apr16 Jul16 Oct16 Jan17 Apr17 Jul17 Oct17 Jan18
$1.6 $1.6 $1.7 $1.7 $1.7 $1.7
$1.9 $2.0
3.2% 3.3%3.6%
3.6%3.4%
3.4%3.6%
3.8%
0.0%
1.0%
2.0%
3.0%
4.0%
5.0%
6.0%
$0.0
$0.5
$1.0
$1.5
$2.0
$2.5
Apr16 Jul16 Oct16 Jan17 Apr17 Jul17 Oct17 Jan18
% o
f re
ven
ue
1
Accounts payablePP&E
In billions
1. % of revenue calculations based on trailing 4-quarter net revenue
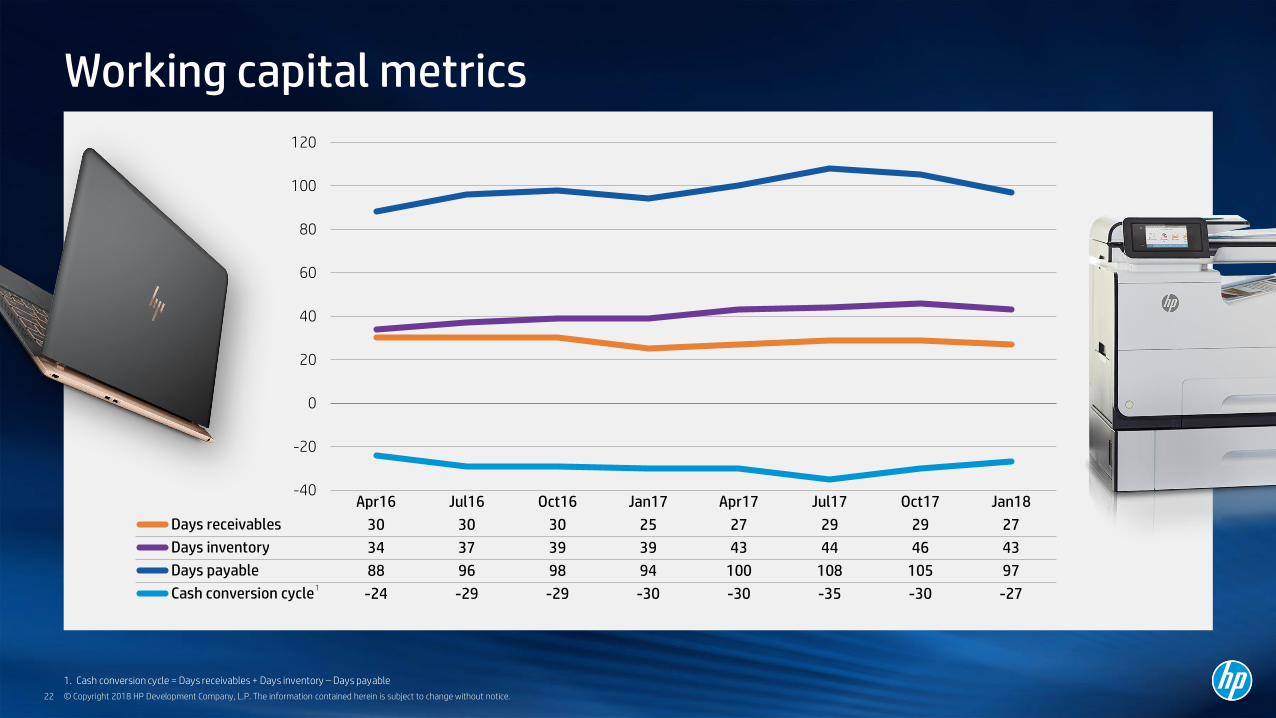
Working capital metrics
© Copyright 2018 HP Development Company, L.P. The information contained herein is subject to change without notice.22
-40
-20
0
20
40
60
80
100
120
Apr16 Jul16 Oct16 Jan17 Apr17 Jul17 Oct17 Jan18
Days receivables 30 30 30 25 27 29 29 27
Days inventory 34 37 39 39 43 44 46 43
Days payable 88 96 98 94 100 108 105 97
Cash conversion cycle -24 -29 -29 -30 -30 -35 -30 -271
1. Cash conversion cycle = Days receivables + Days inventory – Days payable

FY17 GAAP to non-GAAP bridge
© Copyright 2018 HP Development Company, L.P. The information contained herein is subject to change without notice.23
$ in millions, except tax rate and pershare amounts
GAAP
Amortizationof
intangible assets
Restructuring and other charges
Acquisition-relatedcharges
Defined benefit plan settlement
charges
Tax indemnification
Valuation allowances, net and separation
taxes and adjustments
Non-operating retirement
related credits /(charges)
Discontinued operations
Non-GAAP
Revenue $52,056 $52,056
Cost of revenue 42,478 42,478
Total OpEx 6,059 (1) (362) (125) (5) 135 5,701
Operating profit 3,519 1 362 125 5 (135) 3,877
Interest and other, net (243) (47) (290)
Pre-tax earnings 3,276 1 362 125 5 (47) (135) 3,587
Income tax (750) (82) (44) 50 54 (772)
Tax rate 22.9% 21.5%
Net earnings from continuing operations
$2,526 1 280 81 5 3 (81) $2,815
Net earnings (loss) from discontinued operations
- -
Net earnings $2,526 1 280 81 5 3 (81) $2,815
Diluted netearnings per share
$1.48 $1.65
A description of HP’s use of non-GAAP information is provided on slide 3 under “Use of non-GAAP financial information”

Q4 FY17 GAAP to non-GAAP bridge
© Copyright 2018 HP Development Company, L.P. The information contained herein is subject to change without notice.24
$ in millions, except tax rate and pershare amounts
GAAP
Amortizationof
intangible assets
Restructuring and other charges
Acquisition-relatedcharges
Defined benefit plan settlement
charges
Tax indemnification
Valuation allowances, net and separation
taxes and adjustments
Non-operating retirement
related credits /(charges)
Discontinued operations
Non-GAAP
Revenue $13,927 $13,927
Cost of revenue 11,407 11,407
Total OpEx 1,630 (113) (49) (1) 34 1,501
Operating profit 890 113 49 1 (34) 1,019
Interest and other, net (42) (23) (65)
Pre-tax earnings 848 113 49 1 (23) (34) 954
Income tax (188) (37) (16) 23 13 (205)
Tax rate 22.2% 21.5%
Net earnings from continuing operations
$660 76 33 1 (21) $749
Net earnings (loss) from discontinued operations
- -
Net earnings $660 76 33 1 (21) $749
Diluted netearnings per share
$0.39 $0.44
A description of HP’s use of non-GAAP information is provided on slide 3 under “Use of non-GAAP financial information”

Q3 FY17 GAAP to non-GAAP bridge
© Copyright 2018 HP Development Company, L.P. The information contained herein is subject to change without notice.25
$ in millions, except tax rate and pershare amounts
GAAP
Amortizationof
intangible assets
Restructuring and other charges
Acquisition-relatedcharges
Defined benefit plan settlement
charges
Tax indemnification
Valuation allowances, net and separation
taxes and adjustments
Non-operating retirement
related credits /(charges)
Discontinued operations
Non-GAAP
Revenue $13,060 $13,060
Cost of revenue 10,633 10,633
Total OpEx 1,472 (46) (40) (1) 34 1,419
Operating profit 955 46 40 1 (34) 1,008
Interest and other, net (56) (10) (66)
Pre-tax earnings 899 46 40 1 (10) (34) 942
Income tax (203) (14) (15) 10 15 (207)
Tax rate 22.6% 22.0%
Net earnings from continuing operations
$696 32 25 1 (19) $735
Net earnings (loss) from discontinued operations
- -
Net earnings $696 32 25 1 (19) $735
Diluted netearnings per share
$0.41 $0.43
A description of HP’s use of non-GAAP information is provided on slide 3 under “Use of non-GAAP financial information”
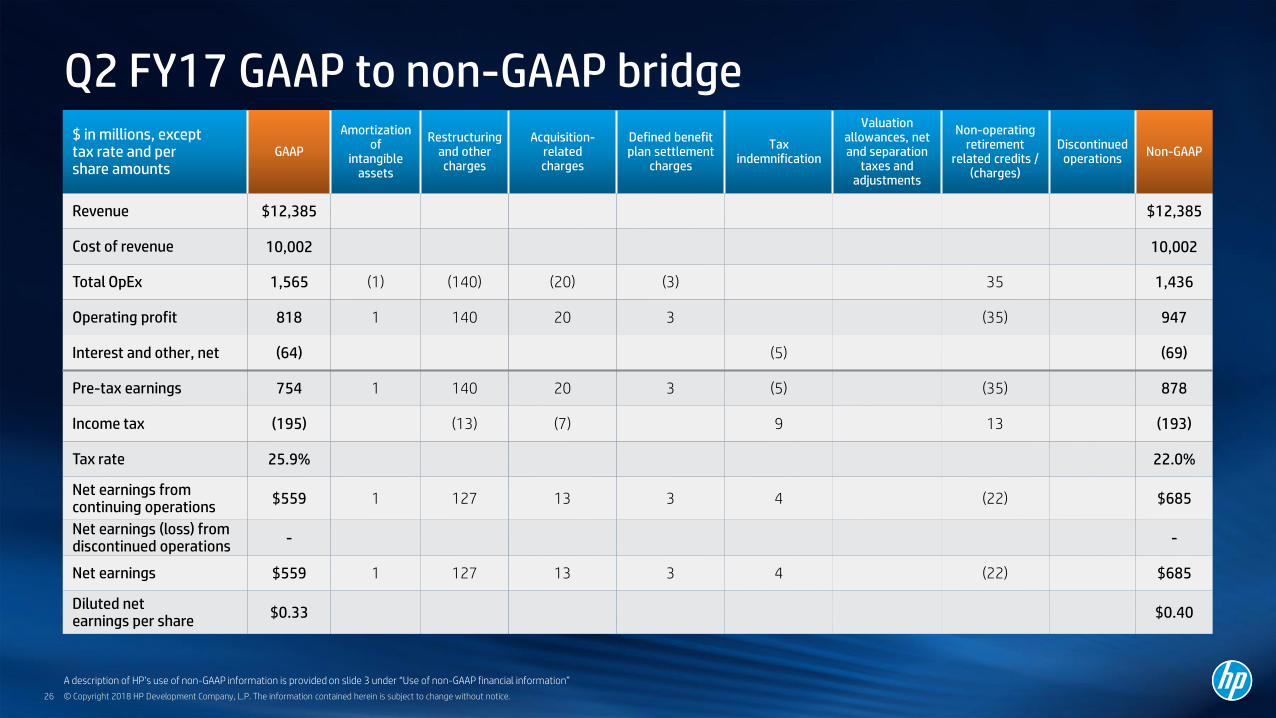
Q2 FY17 GAAP to non-GAAP bridge
© Copyright 2018 HP Development Company, L.P. The information contained herein is subject to change without notice.26
$ in millions, except tax rate and pershare amounts
GAAP
Amortizationof
intangible assets
Restructuring and other charges
Acquisition-relatedcharges
Defined benefit plan settlement
charges
Tax indemnification
Valuation allowances, net and separation
taxes and adjustments
Non-operating retirement
related credits /(charges)
Discontinued operations
Non-GAAP
Revenue $12,385 $12,385
Cost of revenue 10,002 10,002
Total OpEx 1,565 (1) (140) (20) (3) 35 1,436
Operating profit 818 1 140 20 3 (35) 947
Interest and other, net (64) (5) (69)
Pre-tax earnings 754 1 140 20 3 (5) (35) 878
Income tax (195) (13) (7) 9 13 (193)
Tax rate 25.9% 22.0%
Net earnings from continuing operations
$559 1 127 13 3 4 (22) $685
Net earnings (loss) from discontinued operations
- -
Net earnings $559 1 127 13 3 4 (22) $685
Diluted netearnings per share
$0.33 $0.40
A description of HP’s use of non-GAAP information is provided on slide 3 under “Use of non-GAAP financial information”
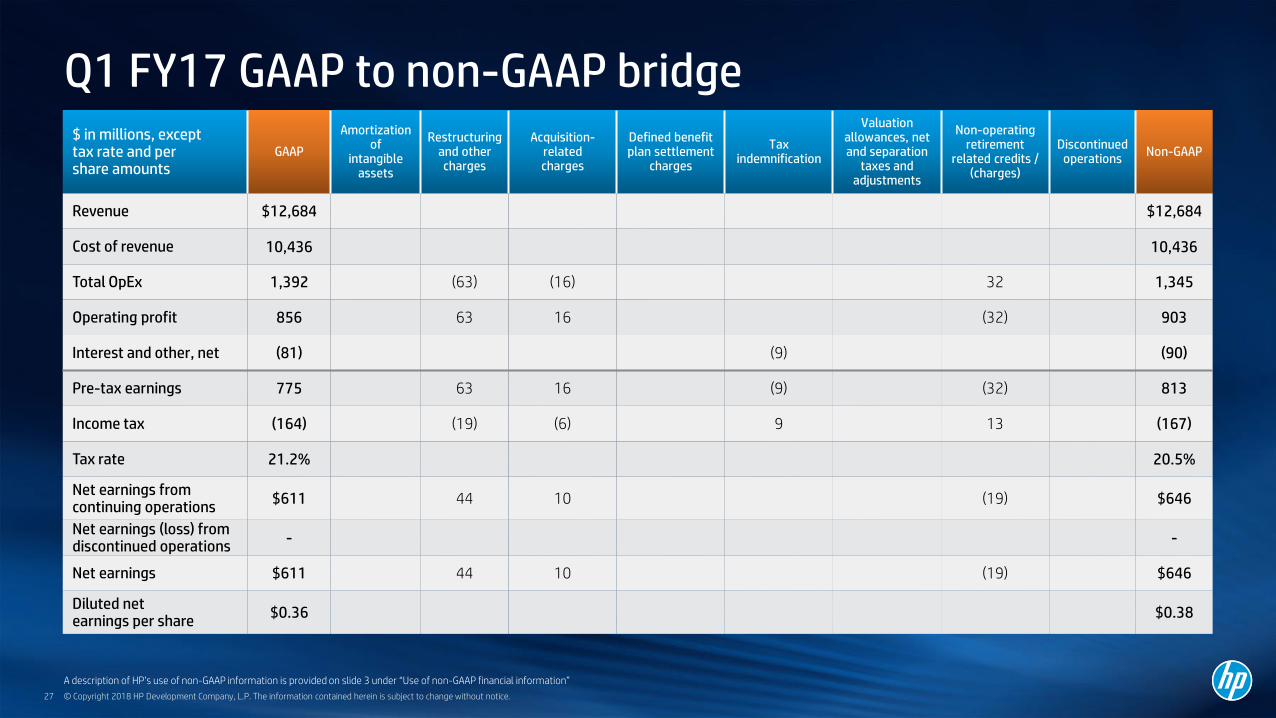
Q1 FY17 GAAP to non-GAAP bridge
© Copyright 2018 HP Development Company, L.P. The information contained herein is subject to change without notice.27
$ in millions, except tax rate and pershare amounts
GAAP
Amortizationof
intangible assets
Restructuring and other charges
Acquisition-relatedcharges
Defined benefit plan settlement
charges
Tax indemnification
Valuation allowances, net and separation
taxes and adjustments
Non-operating retirement
related credits /(charges)
Discontinued operations
Non-GAAP
Revenue $12,684 $12,684
Cost of revenue 10,436 10,436
Total OpEx 1,392 (63) (16) 32 1,345
Operating profit 856 63 16 (32) 903
Interest and other, net (81) (9) (90)
Pre-tax earnings 775 63 16 (9) (32) 813
Income tax (164) (19) (6) 9 13 (167)
Tax rate 21.2% 20.5%
Net earnings from continuing operations
$611 44 10 (19) $646
Net earnings (loss) from discontinued operations
- -
Net earnings $611 44 10 (19) $646
Diluted netearnings per share
$0.36 $0.38
A description of HP’s use of non-GAAP information is provided on slide 3 under “Use of non-GAAP financial information”

FY16 GAAP to non-GAAP bridge
© Copyright 2018 HP Development Company, L.P. The information contained herein is subject to change without notice.28
$ in millions, except tax rate and pershare amounts
GAAP
Amortizationof
intangible assets
Restructuring and other charges
Acquisition-relatedcharges
Defined benefit plan settlement
charges
Tax indemnification
Valuation allowances, net and separation
taxes and adjustments
Non-operating retirement
related credits /(charges)
Discontinued operations
Non-GAAP
Revenue $48,238 $48,238
Cost of revenue 39,240 39,240
Total OpEx 5,449 (16) (205) (7) (179) 146 5,188
Operating profit 3,549 16 205 7 179 (146) 3,810
Interest and other, net 212 (472) (260)
Pre-tax earnings 3,761 16 205 7 179 (472) (146) 3,550
Income tax (1,095) (3) (60) (2) (47) 406 38 (763)
Tax rate 29.1% 21.5%
Net earnings from continuing operations
$2,666 13 145 5 132 (66) (108) $2,787
Net earnings (loss) from discontinued operations
(170) 170 -
Net earnings $2,496 13 145 5 132 (66) (108) 170 $2,787
Diluted netearnings per share
$1.43 $1.60
A description of HP’s use of non-GAAP information is provided on slide 3 under “Use of non-GAAP financial information”

Q4 FY16 GAAP to non-GAAP bridge
© Copyright 2018 HP Development Company, L.P. The information contained herein is subject to change without notice.29
$ in millions, except tax rate and pershare amounts
GAAP
Amortizationof
intangible assets
Restructuring and other charges
Acquisition-relatedcharges
Defined benefit plan settlement
charges
Tax indemnification
Valuation allowances, net and separation
taxes and adjustments
Non-operating retirement
related credits /(charges)
Discontinued operations
Non-GAAP
Revenue $12,512 $12,512
Cost of revenue 10,221 10,221
Total OpEx 1,628 (49) (7) (179) 28 1,421
Operating profit 663 49 7 179 (28) 870
Interest and other, net 347 (435) (88)
Pre-tax earnings 1,010 49 7 179 (435) (28) 782
Income tax (497) (13) (2) (62) 397 9 (168)
Tax rate 49.2% 21.5%
Net earnings from continuing operations
$513 36 5 117 (38) (19) $614
Net earnings (loss) from discontinued operations
(21) 21 -
Net earnings $492 36 5 117 (38) (19) 21 $614
Diluted netearnings per share
$0.28 $0.36
A description of HP’s use of non-GAAP information is provided on slide 3 under “Use of non-GAAP financial information”

Q3 FY16 GAAP to non-GAAP bridge
© Copyright 2018 HP Development Company, L.P. The information contained herein is subject to change without notice.30
$ in millions, except tax rate and pershare amounts
GAAP
Amortizationof
intangible assets
Restructuring and other charges
Acquisition-relatedcharges
Defined benefit plan settlement
charges
Tax indemnification
Valuation allowances, net and separation
taxes and adjustments
Non-operating retirement
related credits /(charges)
Discontinued operations
Non-GAAP
Revenue $11,892 $11,892
Cost of revenue 9,720 9,720
Total OpEx 1,055 (2) (36) 38 1,055
Operating profit 1,117 2 36 (38) 1,117
Interest and other, net (36) (29) (65)
Pre-tax earnings 1,081 2 36 (29) (38) 1,052
Income tax (238) (8) 6 14 (226)
Tax rate 22.0% 21.5%
Net earnings from continuing operations
$843 2 28 (23) (24) $826
Net earnings (loss) from discontinued operations
(60) 60 -
Net earnings $783 2 28 (23) (24) 60 $826
Diluted netearnings per share
$0.45 $0.48
A description of HP’s use of non-GAAP information is provided on slide 3 under “Use of non-GAAP financial information”

Q2 FY16 GAAP to non-GAAP bridge
© Copyright 2018 HP Development Company, L.P. The information contained herein is subject to change without notice.31
$ in millions, except tax rate and pershare amounts
GAAP
Amortizationof
intangible assets
Restructuring and other charges
Acquisition-relatedcharges
Defined benefit plan settlement
charges
Tax indemnification
Valuation allowances, net and separation
taxes and adjustments
Non-operating retirement
related credits /(charges)
Discontinued operations
Non-GAAP
Revenue $11,588 $11,588
Cost of revenue 9,338 9,338
Total OpEx 1,409 (6) (100) 40 1,343
Operating profit 841 6 100 (40) 907
Interest and other, net (5) (8) (13)
Pre-tax earnings 836 6 100 (8) (40) 894
Income tax (176) (1) (32) 2 15 (192)
Tax rate 21.1% 21.5%
Net earnings from continuing operations
$660 5 68 (6) (25) $702
Net earnings (loss) from discontinued operations
(31) 31 -
Net earnings $629 5 68 (6) (25) 31 $702
Diluted netearnings per share
$0.36 $0.41
A description of HP’s use of non-GAAP information is provided on slide 3 under “Use of non-GAAP financial information”

Q1 FY16 GAAP to non-GAAP bridge
© Copyright 2018 HP Development Company, L.P. The information contained herein is subject to change without notice.32
$ in millions, except tax rate and pershare amounts
GAAP
Amortizationof
intangible assets
Restructuring and other charges
Acquisition-relatedcharges
Defined benefit plan settlement
charges
Tax indemnification
Valuation allowances, net and separation
taxes and adjustments
Non-operating retirement
related credits /(charges)
Discontinued operations
Non-GAAP
Revenue $12,246 $12,246
Cost of revenue 9,961 9,961
Total OpEx 1,357 (8) (20) 40 1,369
Operating profit 928 8 20 (40) 916
Interest and other, net (94) (94)
Pre-tax earnings 834 8 20 (40) 822
Income tax (184) (2) (6) 15 (177)
Tax rate 22.1% 21.5%
Net earnings from continuing operations
$650 6 14 (25) $645
Net earnings (loss) from discontinued operations
(58) 58 -
Net earnings $592 6 14 (25) 58 $645
Diluted netearnings per share
$0.33 $0.36
A description of HP’s use of non-GAAP information is provided on slide 3 under “Use of non-GAAP financial information”

THANK YOU
© Copyright 2018 HP Development Company, L.P. The information contained herein is subject to change without notice.33