Embed Size (px)
Citation preview
HPS Weekly Report
4 April 2012Volume 46 No. 2012/14ISSN 1753-4224 (Online)
Contents
CURRENT NOTES
• Literature reviews to inform HAI quality improvement tools - Launched
• EFSA report on Schmallenberg virus
• Latest research published by the FSA
• Warning over Mistral Laboratory Chemicals
• SEPA agrees MOD plan for Dalgety Bay
• Eurosurveillance special issues - calls for submissions
pages108-110
SURVEILLANCE REPORT
• Quarterly report on the surveillance of Staphylococcusaureus bacteraemias in Scotland, October – December 2011
pages 111 - 116
• Quarterly report on the surveillance of Clostridiumdifficile infection (CDI) in Scotland, October - December 2011
pages 117 - 122
NOTIFIABLE TABLE
to 23/3/2012
pages 123 - 124
CURRENT NOTES
Correspondence to:The Editor, HPS Weekly ReportHPSMeridian Court5 Cadogan StreetGlasgow, G2 6QEScotland
T 0141-300 1100 F 0141-300 1172
E [email protected] http://www.ewr.hps.scot.nhs.uk/
Printed in the UKHPS is a division of the NHS National Services Scotland Registered as a newspaper at the Post Office © HPS 2012
Literature reviews to inform HAI quality improvement tools - Launched
46/1401 The HPS review of the content of infection prevention and control care bundles and other tools issued on their web pages in 2008 is now complete.
Key recommendations and updated Literature Reviews focused on prevention of prevalent HAI in NHSScotland are now available on the HPS HAI+IC website pages http://www.hps.scot.nhs.uk/haiic/ic/evidenceforcarebundles.aspx in fulfilment of HPS’s allocated task of the HAI Taskforce Delivery Plan 2011-2012.
The main audience for the documents produced by HPS are infection prevention and control teams working in NHSScotland and other groups with infection prevention and control remit, such as societies like the Infection Prevention Society Scottish Branch. Additionally, those working on HAI improvement in NHS boards alongside the Scottish Patient Safety Programme will find it useful in reviewing the recommendations to ensure consistency.
NHS boards are strongly encouraged to map the content of their bundles and tools against the recommendations presented.
EFSA report on Schmallenberg virus
46/1402 The European Food Safety Authority (EFSA) published its second report on the Schmallenberg virus (SBV) on 2 April. The virus that to date has been identified in eight EU member states can affect domestic and wild ruminants, leading in some cases to severe birth defects. Although uncertainties and gaps in data remain, this report (available at http://www.efsa.europa.eu/en/supporting/pub/261e.htm) importantly shows that when based on worst case scenario assumptions, the number of infected ruminants is low compared to the total number of these animals in each member state.
The data collected by member states have allowed the Authority to analyse the current geographical distribution and impact of the disease in the European Union. Some caution nevertheless should be exerted when interpreting the data as underreporting or lack of diagnostic confirmation may affect the picture that we have today of the prevalence of the disease. While all member states have submitted detailed information about confirmed cases, only two also reported on suspected cases. Data recommendations stated in this report will be used to refine further data collection.
EFSA intends to publish periodical reports on the status and analysis of the data collected and to assess the overall impact of the SBV infection on animal health, animal production and animal welfare together with a characterisation of the pathogen by 31 May 2012.
The results of EFSA’s report were shared at a scientific seminar held in Brussels and organised by the European Commission’s Health and Consumers Directorate General (DG SANCO) that aims to present the current state of play on the latest scientific information on SBV and the risk management approach taken by the EU.
There is currently no evidence that the Schmallenberg virus could cause illness in humans. A risk assessment on the the virus’s zoonotic potential was issued by the Human Animal Infections and Risk Surveillance Group (HAIRS) on 24 February at http://www.hpa.org.uk/webc/HPAwebFile/HPAweb_C/1317132996975. [Source: EFSA Press Release, 2 April 2012. http://www.efsa.europa.eu/en/press/news/120402.htm]
Latest research published by the FSA
46/1403 The Agency has produced a summary of its research published in March 2012. This includes the development of a number of new methods for screening for genetically modified organisms (GMOs) and an estimation of nutrient intakes in Scotland.
A number of new methods were developed to aid the detection of GMOs in food and animal feed. A software tool has also been created that optimises the screening of samples for authorised and unauthorised GMOs, saving time and money. Once the methods have been successfully validated, they will be made available worldwide to improve the ability of enforcement laboratories to detect GMOs in food and feed.

HP
S W
EE
KLY R
EP
OR
T Volum
e 46 No.2012/14
4 April 2012
109
Data from the Living Costs and Food Survey was used to monitor progress towards the Scottish Dietary Targets (SDTs). It was found that:
• Although none of the SDTs were met by 2009, there have been some measurable improvements in the diet of the Scottish population.
• There were small increases in the population consumption of fruit and vegetables and brown/wholemeal bread and high fibre breakfast cereals between 2001 and 2009. However, consumption of these foods remained significantly lower in the most deprived groups.
• There was a small decrease in consumption of saturated fat and added sugars. However, consumption of added sugars continued to be higher in the most deprived compared with the least deprived.
• Only slow progress is being made towards dietary improvement in Scotland and more effort is required to achieve future population health benefit.
The Agency carries out and commissions extensive scientific research and survey work to ensure that our advice to the public is based on the best and most up-to-date science. [Source: FSA News Release, 29 March 2012. http://www.food.gov.uk/news/newsarchive/2012/mar/march-research]
Warning over Mistral Laboratory Chemicals
46/1404 On 29 March, the Food Standards Agency (FSA) advised companies and individuals who have bought chemicals used for food production from a company called Mistral Laboratory Chemicals not to use them.
The company, based in Antrim, Northern Ireland, sells products from its website and also through other sites such as eBay. The company has voluntarily ceased distribution of its food grade products.
Italian authorities are investigating the circumstances of the recent death of a woman at a private medical clinic in Italy. Products for food use supplied by Mistral have been implicated in that investigation. However, enquiries are still ongoing. There have been no reported food related incidents in the UK linked to products supplied by Mistral, and the FSA is issuing this warning as a precaution.
The FSA is advising people to inform their local environmental health officer immediately if they have any of these food grade chemicals and is working with local authorities to arrange disposal of these products.
The FSA will provide more information as it becomes available. [FSA News Release, 29 March 2012. http://www.food.gov.uk/news/newsarchive/2012/mar/mistral]
SEPA agrees MOD plan for Dalgety Bay
46/1405 The Scottish Environment Protection Agency (SEPA) announced at a recent (27 March) meeting of the Dalgety Bay Forum that an investigation plan, including the development of remediation options, had been agreed with the Ministry of Defence (MOD).
In November last year, SEPA set deadlines for MOD to provide a credible remediation plan for the area to prevent the need to designate Dalgety Bay as radioactive contaminated land, the first such designation in the UK. However, work carried out for SEPA over the winter months showed that the situation at the beach was more complicated than initially believed, and therefore a comprehensive investigation was required, before remediation options could be identified.
The agency is satisfied that real progress is being made and, as a result, will not be designating the beach at this time. The agency expects the investigation plan to be implemented by the end of May 2013 at which stage urgent action will be expected.
A copy of the plan will be made available on SEPA’s website in the next few weeks at http://www.sepa.org.uk/radioactive_substances/publications/dalgety_bay_reports.aspx. [Source: SEPA News Release, 27 March 2012. http://www.sepa.org.uk/about_us/news/2012/sepa_agress_mod_plan_for_dalge.aspx]
Eurosurveillance special issues - calls for submissions
46/1406 Eurosurveillance is inviting authors to submit papers for a special issue on the molecular epidemiology of human pathogens and on the epidemiology of leishmaniasis in Europe.
As exemplified in the 2011 outbreak of the Shiga toxin-producing Escherichia coli (STEC) O104:H4 strain in Germany, advanced sequencing technologies are being introduced for application in microbiological investigations supporting surveillance and outbreak investigations. While such scientific and technological advances have great potential to increase the resolution and accuracy of microbiological investigations and deepen our understanding of human pathogens and the diseases they cause, various operational issues need to be resolved in order for such advanced techniques to be incorporated into public health practice.
HP
S W
EE
KLY R
EP
OR
T Volum
e 46 No.2012/14
4 April 2012
110
The aim of this special issue is to provide a comprehensive picture of the current thinking on the role and possible opportunities of applying modern molecular microbiology for informing public health action. It follows from a recent consultation organised by the European Centre for Disease Prevention and Control, which initiated discussion on how public health can benefit from the recent advances in molecular microbiology. Eurosurveillance is inviting interested scientists and public health experts to share their findings and views and submit original papers for peer review and possible publication. Further details are available at http://www.eurosurveillance.org/ViewArticle.aspx?ArticleId=20053.
Leishmaniasis, a vector-borne disease transmitted by sand flies, is endemic in southern European countries. Autochthonous cases in Europe are mainly due to infection with Leishmania infantum, which causes zoonotic visceral and cutaneous leishmaniasis. L. tropica, endemic only in Greece with a sporadic pattern, causes anthroponotic cutaneous leishmaniasis. Dogs are the main reservoir for L. infantum. Most reported cases have visceral leishmaniasis.
The aim of the special issue is to contribute to the existing body of evidence and to make available data that can help paint a better picture of the epidemiological situation and burden of autochthonous leishmaniasis in Europe. Eurosurveillance is inviting interested scientists and public health experts to share their surveillance data, findings and views and submit original papers for peer review and possible publication. Further details are available at http://www.eurosurveillance.org/ViewArticle.aspx?ArticleId=20126.
Submission deadlines for these special issues are 15 May and 15 July 2012 respectively.
HP
S W
EE
KLY R
EP
OR
T Volum
e 46 No.2012/14
4 April 2012
111
Surveillance Report
Quarterly report on the surveillance of Staphylococcus aureus bacteraemiasin Scotland, October – December 2011
Prepared by: Health Protection Scotland
Executive Summary
• This report provides a summary of Staphylococcus aureus (S. aureus) bacteraemia data for the fourth quarter of 2011, October to December 2011, in 15 NHS boards. This includes data on both meticillin resistant S. aureus (MRSA) and meticillin sensitive S. aureus (MSSA) bacteraemias; these data are compared to previous quarters.
• Altogether, 408 new S. aureus bacteraemia cases were reported to Health Protection Scotland (HPS) during this period. This is a decrease of 13.0% compared with the same quarter of the previous year, October to December 2010, when 469 cases were reported and it is the third lowest number of cases reported since the start of the mandatory S. aureus bacteraemia surveillance programme.
• In the last year, January 2011 to December 2011, 1609 episodes of S. aureus bacteraemia were reported to HPS. This represents a decrease of 12.3% on the previous year, January 2010 to December 2010, when 1835 episodes were reported.
• The overall rate of S. aureus bacteraemias for Scotland was 0.322 S. aureus bacteraemia cases per 1000 acute occupied bed days (AOBDs). This is a small increase of 4.9% on the previous quarter (from 0.307 to 0.322) which may be due to seasonal variation. It is also, nonetheless, the third lowest rate reported since the start of the mandatory S. aureus bacteraemia surveillance programme.
• In comparison with the same quarter of 2010, the overall S. aureus bacteraemia rate for Scotland has decreased by 12.6%, from 0.368 to 0.322 per 1000 AOBDs.
• The number and rate of MRSA bacteraemias reported in the period October to December 2011 was the second lowest of any quarter reported since the start of this surveillance programme with 50 cases and 0.039 per 1000 AOBDs.
• During this quarter, the S. aureus, MRSA and MSSA bacteraemia rates at all NHS boards were within or below the 95% confidence limits on the funnel plots.
• The national surveillance programme reports on S. aureus bacteraemias arising three months or longer before publication of this report. Therefore, this report does not replace the need for local monitoring of S. aureus bacteraemias by NHS boards themselves.
• The report provides a commentary on the microbiology and typing of recent S. aureus isolates.
1. Introduction
Staphylococcus aureus (S. aureus) is a gram positive bacterium which colonises the nasal cavity of about 30% of the healthy population. Although this colonisation is usually harmless, S. aureus may cause serious infections. These infections are commonly associated with healthcare interventions, often because of failures to implement infection prevention methods. As a result, both meticillin sensitive and meticillin resistant S. aureus (MSSA and MRSA) remain endemic in many UK hospitals, causing a range of infections. Amongst the most serious of these are bacteraemias.
The Health Protection Scotland (HPS) S. aureus bacteraemia surveillance programme monitors the occurrence of S. aureus bacteraemias amongst all patients in Scotland. It includes S. aureus bacteraemias occurring in patients who have been in contact with the healthcare system (in both acute and non-acute hospitals, as well as in primary care settings) and those who have acquired S. aureus bacteraemias in the community, without any healthcare contacts.
The surveillance programme in Scotland includes data on both MRSA and MSSA bacteraemias. Many other countries restrict surveillance of S. aureus bacteraemias to those caused only by MRSA.
This quarterly report is concerned with the incidence of S. aureus bacteraemias in Scotland and within individual NHS boards. HPS publishes an annual report on S. aureus bacteraemias in Scotland.1 This report contains further analyses of S. aureus data, including trends in S. aureus bacteraemias.
The quarterly S. aureus bacteraemia data produced by HPS are based on interim data for both bed occupancy and incident S. aureus bacteraemias. These data are subject to revision as finalised data become available. Therefore there may occasionally be minor numeric discrepancies between reports, reflecting the availability of such updated data.
This report also includes Scottish data from the European Centres for Disease Control (ECDC) antimicrobial resistance surveillance system (EARS-Net formerly EARSS) and the HPS MRSA snapshot programme (representative surveillance) for the fourth quarter of 2011. Details of these programmes and the methods of data collection can be accessed from the ECDC, and the Scottish MRSA Reference Laboratory (SMRSARL) websites respectively.2,3 The HPS MRSA snapshot programme data have been included in this report. These data relate to isolates from all body sites and have been included as providing further intelligence on the microbiology of S. aureus bacteraemias.
HP
S W
EE
KLY R
EP
OR
T Volum
e 46 No.2012/14
4 April 2012
112
Finally, it should be noted that the national S. aureus bacteraemia surveillance programme contains information on bacteraemias occurring three to six months prior to the publication of this report. It is therefore vital that NHS boards have their own local S. aureus bacteraemia surveillance systems to alert local teams to any need for immediate action. This surveillance report does not replace local monitoring of S. aureus bacteraemias by NHS boards’ infection control teams.
2. Methods2.1. Data sources
In Scotland, all (15) NHS boards providing clinical services report every isolate of MSSA or of MRSA from blood cultures to HPS. These reports come from routine hospital laboratory data systems.
All NHS boards’ laboratories submit every first isolate of S. aureus from a patient’s blood to the SMRSARL for typing and antimicrobial susceptibility testing, under the ECDC antimicrobial resistance surveillance system. NHS boards also submit isolates periodically throughout the year to the SMRSARL as part of the MRSA snapshot surveillance. These isolates undergo the same typing and antimicrobial susceptibility testing as the bacteraemia isolates.
Episodes of S. aureus bacteraemia are identified for this quarterly surveillance report from both the routine hospital laboratory systems and from the SMRSARL system. These data are transmitted to HPS via the ECOSS electronic reporting system.4 On occasion an NHS board will not submit a S. aureus blood isolate to the SMRSARL and therefore typing and antimicrobial susceptibility will not be performed. As a result the total numbers in the two surveillance systems may differ. HPS will continue to monitor submission of isolates to the SMRSARL in order to ensure compliance with HDL(2006) 38.5
This report is based on data for all S. aureus bacteraemias reported to HPS between October 2011 and December 2011. These numerator data are derived from de-duplicated merged S. aureus bacteraemia case data supplied by both NHS boards’ laboratories and the SMRSARL.
Acute occupied bed days (AOBDs) statistics for individual NHS boards are provided by the Information Services Division (ISD) of NHS National Services Scotland (NSS).6 These AOBDs include some estimated bed occupancy data, due to incomplete data availability at the time of this publication.
2.2. Laboratory testing
Phenotypic confirmation of S. aureus is carried out on all isolates submitted to the SMRSARL. Isolates are typed using biotype and antibiogram. Genotyping is performed using polymerase chain reaction (PCR) ribotyping, pulsed-field gel electrophoresis (PFGE) and Staphylococcal protein A (spa) typing.
Isolates are tested for resistance to 21 antibiotics using breakpoints derived from the Clinical Laboratory Standards Institute (CLSI) criteria. Isolates with reduced susceptibility to mupirocin are further tested by PCR for the presence of the mupA gene to distinguish between high and low level mupirocin resistance. PCR toxin tests are performed on selected isolates.
2.3. Definitions
An episode of S. aureus bacteraemia (MRSA or MSSA) is defined as a person from whose blood MRSA or MSSA has been isolated and reported by a diagnostic microbiology laboratory, in the absence of a positive blood culture in the previous two weeks.7
AOBD is a hospital acute bed which was occupied at midnight. An acute bed is any bed other than a care of the elderly long stay or a psychiatric bed.7
Cases are allocated to individual NHS boards based on the location of the diagnostic laboratory where the specimen was tested.
2.4. Data analysis and reporting
Calculation of rates
The bacteraemia incidence rates were calculated as:
number of S. aureus or MRSA
Rate per 1000 acute or MSSA bacteraemia cases * 1000
occupied bed days = ___________________
number of AOBDs for Scotland or NHS board
The denominator is the number of acute occupied bed days (AOBDs) for Scotland or each NHS board for the relevant quarter. These S. aureus bacteraemia rates are calculated for each NHS board, enabling comparisons between boards (online appendix 1 at: http://www.hps.scot.nhs.uk/haiic/sshaip/publicationsdetail.aspx?id=30248). These rates are calculated either for the latest quarter only or for the previous four quarters.
Identification of outliers
Comparisons of NHS boards’ S. aureus bacteraemia, MRSA and MSSA rates are shown using funnel plots.8 These are scatterplots of the observed S. aureus bacteraemia events, measured as rates, plotted against their precision, indicated by the number of acute occupied bed days. The plots in this report show the upper and lower 95% confidence limits as curved lines. If an individual NHS board’s rate was outwith the 95% confidence limit, this would be regarded as an outlier, suggesting that that NHS board had a S. aureus bacteraemia rate which was significantly different to other NHS boards.
Analysis of trends
Analysis of trends in the rates of S. aureus bacteraemias was carried out within an over-dispersed Poisson regression model. The regression included terms for NHS board, year and quarter. Model checking was performed using residual plots and these demonstrated that the model assumptions were reasonable. Trend analyses were based on the latest 27 quarters of data.
3. Results
3.1. Surveillance dataDuring the period October to December 2011, HPS received reports of S. aureus bacteraemias from 22 diagnostic laboratories in 14 NHS boards as well as from the SMRSARL.
The total number of S. aureus bacteraemia cases identified in Scotland was 408, of which 50 were MRSA bacteraemias

HP
S W
EE
KLY R
EP
OR
T Volum
e 46 No.2012/14
4 April 2012
113
TABLE 1: Quarterly numbers of S. aureus bacteraemias (MRSA and MSSA) in Scotland*.Quarter MRSA
bacteraemias**(n)
MSSA bacteraemias**
(n)
S. aureus bacteraemias**
(n)
Acute Occupied Bed Days (AOBDs)
MRSA bacteraemias per 1000 AO-
BDs
MSSA bacteraemias
per 1000 AOBDs
S. aureus bacteraemias
per 1000 AOBDs
Apr 05-Jun 05 221 375 596 1327034 0.167 0.283 0.449
Jul 05-Sep 05 247 511 758 1325690 0.186 0.385 0.572
Oct 05-Dec 05 264 422 686 1342990 0.197 0.314 0.511
Jan 06-Mar 06 274 464 738 1390111 0.197 0.334 0.531
Apr 06-Jun 06 252 358 610 1362072 0.185 0.263 0.448
Jul 06-Sep 06 212 389 601 1329262 0.159 0.293 0.452
Oct 06-Dec 06 227 300 527 1339822 0.169 0.224 0.393
Jan 07-Mar 07 249 364 613 1378926 0.181 0.264 0.445
Apr 07-Jun 07 215 415 630 1344984 0.160 0.309 0.468
Jul 07-Sep 07 210 459 669 1308607 0.160 0.351 0.511
Oct 07-Dec 07 207 417 624 1321950 0.157 0.315 0.472
Jan 08-Mar 08 198 386 584 1382550 0.143 0.279 0.422
Apr 08-Jun 08 180 397 577 1335033 0.135 0.297 0.432
Jul 08-Sep 08 150 382 532 1299840 0.115 0.294 0.409
Oct 08-Dec 08 161 400 561 1334459 0.121 0.300 0.420
Jan 09-Mar 09 170 386 556 1353145 0.126 0.285 0.411
Apr 09-Jun 09*** 143 392 535 1319537 0.108 0.297 0.405
Jul 09-Sep 09*** 101 384 485 1291267 0.078 0.297 0.376
Oct 09-Dec 09*** 119 362 481 1313717 0.091 0.276 0.366
Jan 10-Mar 10*** 116 388 504 1333244 0.087 0.291 0.378
Apr 10-Jun 10*** 79 343 422 1291781 0.061 0.266 0.327
Jul 10-Sep 10*** 73 367 440 1259905 0.058 0.291 0.349
Oct 10-Dec 10*** 81 388 469 1275015 0.064 0.304 0.368
Jan 11-Mar 11*** 69 355 424 1306794 0.053 0.272 0.324
Apr 11-Jun 11*** 52 342 394 1276507 0.041 0.268 0.309
Jul 11-Sep 11*** 48 335 383 1249450 0.038 0.268 0.307
Oct 11-Dec 11*** 50 358 408 1268554 0.039 0.282 0.322* Figures within this report are provisional and may be subject to update from reporting laboratories.** Mandatory reporting of MSSA bacteraemias was introduced in July 2006 and MSSA were validated back to 1 April 2005.*** Reporting of National Waiting Times Centre (NWTC) data began in April 2010 however retrospective data for the NWTC for the period April 2009 to March 2010
have now been included within the Scottish data.
(12.3%) and 358 were MSSA bacteraemias (87.7%) as shown in Table 1. The total numbers of S. aureus bacteraemias in Scotland increased by 6.5% compared with the previous quarter (July to September 2011) when 383 S. aureus bacteraemia cases were recorded. In that quarter 48 (12.5%) were due to MRSA and 335 (87.5%) to MSSA.
The overall S. aureus bacteraemia rate for Scotland during this quarter, October to December 2011, was 0.322 per 1000 AOBDs. This is a 12.6% decrease on the overall rate for Scotland from the corresponding quarter in the previous year. This represents the third lowest number and rate of S. aureus bacteraemias since the incorporation of MSSA bacteraemias into this surveillance system.
This quarter, October to December 2011, had the second lowest number and rate of MRSA bacteraemias of any quarter since the start of the mandatory S. aureus bacteraemia surveillance programme.
The total number of S. aureus bacteraemia cases and the S. aureus bacteraemia rates for each NHS board during this quarter, October to December 2011, are listed in Table 2, which also indicates the numbers and rates of S. aureus bacteraemia in the preceding year, October 2010 to September 2011. All historic data of cases, AOBDs and S. aureus bacteraemia rates for each NHS board are included in the online appendix 2 (at: http://www.hps.scot.nhs.uk/haiic/sshaip/publicationsdetail.aspx?id=30248).
HP
S W
EE
KLY R
EP
OR
T Volum
e 46 No.2012/14
4 April 2012
114
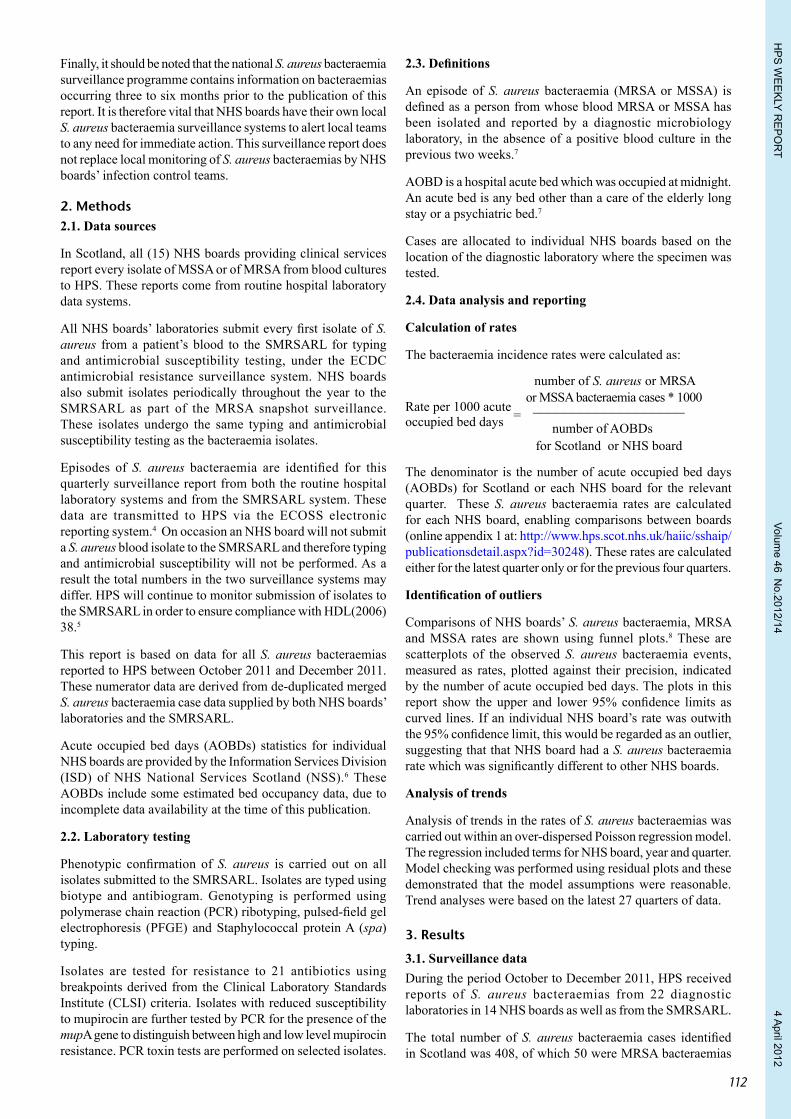
TABLE 2: Total number of S. aureus bacteraemia cases this quarter and annual rates of S. aureus bacteraemias in 15 NHS boards in Scotland.
October 2011 to December 2011 October 2010 to September 2011NHS board AOBDs S. aureus
bacteraemias (n)
S. aureus bacteraemia rate per 1000
AOBDs
AOBDs S. aureus bacteraemias
(n)
S. aureus bacteraemia rate per 1000
AOBDsAyrshire & Arran 88329 32 0.362 347852 113 0.325Borders 24663 12 0.487 103207 31 0.300Dumfries & Galloway 32532 6 0.184 141202 36 0.255Fife 60587 31 0.512 244029 99 0.406Forth Valley 50306 24 0.477 198862 90 0.453Grampian 136413 36 0.264 540912 175 0.324Greater Glasgow & Clyde 375250 111 0.296 1513776 472 0.312Highland 61369 16 0.261 262512 56 0.213
Lanarkshire 113433 36 0.317 465502 168 0.361Lothian 199423 72 0.361 774180 277 0.358National Waiting Times Centre 12524 1 0.080 49193 11 0.224
Orkney 3922 1 0.255 15927 4 0.251Shetland 3375 0 0.000 12275 0 0.000Tayside 100626 29 0.288 415431 134 0.323Western Isles 5802 1 0.172 22906 4 0.175Scotland 1268554 408 0.322 5107766 1670 0.327
3.2. Comparison of NHS boards’ rates
Figure 1a shows a funnel plot of S. aureus bacteraemia rates for individual NHS boards for this quarter, Figures 1b and 1c show similar funnel plots for MRSA and MSSA bacteraemias, respectively. They show that none of the S. aureus bacteraemia rates in NHS boards were above the 95% confidence limit.FIGURE 1a: Funnel plot of S. aureus bacteraemia rates for all NHS boards in Scotland against acute occupied bed days (x1000), 1 October to 31 December 2011.
0.0
0.2
0.4
0.6
0.8
Acute Occupied Bed Days (1000s)
Rat
e pe
r 100
0 ac
ute
occu
pied
bed
day
s
0 100 200 300
AA
BR
DG
FFFV
GRGGC
HG
LNLO
OR
SH
TY
WI
NWTC
FIGURE 1b: Funnel plot of MRSA bacteraemia rates for all NHS boards in Scotland against acute occupied bed days (x1000), 1 October to 31 December 2011. Note that NHS Highland and NHS Fife and NHS National Waiting Times Centre, NHS Orkney, NHS Shetland and NHS Western Isles overlap in the figure below.
0 100 200 300
0.00
0.05
0.10
0.15
0.20
Acute Occupied Bed Days (1000s)
Rat
e pe
r 100
0 ac
ute
occu
pied
bed
day
s
AA
BR
DG FF
FV
GR
GGCHG LN LO
NWTCORSH
TY
WI
FIGURE 1c: Funnel plot of MSSA bacteraemia rates for all NHS boards in Scotland against acute occupied bed days (x1000), 1 October to 31 December 2011.
0 100 200 300
0.0
0.2
0.4
0.6
0.8
Acute Occupied Bed Days (1000s)
Rat
e pe
r 100
0 ac
ute
occu
pied
bed
day
s
AA
BR
DG
FF
FV
GR GGCHG
LNLO
NWTC
OR
SH
TY
WI
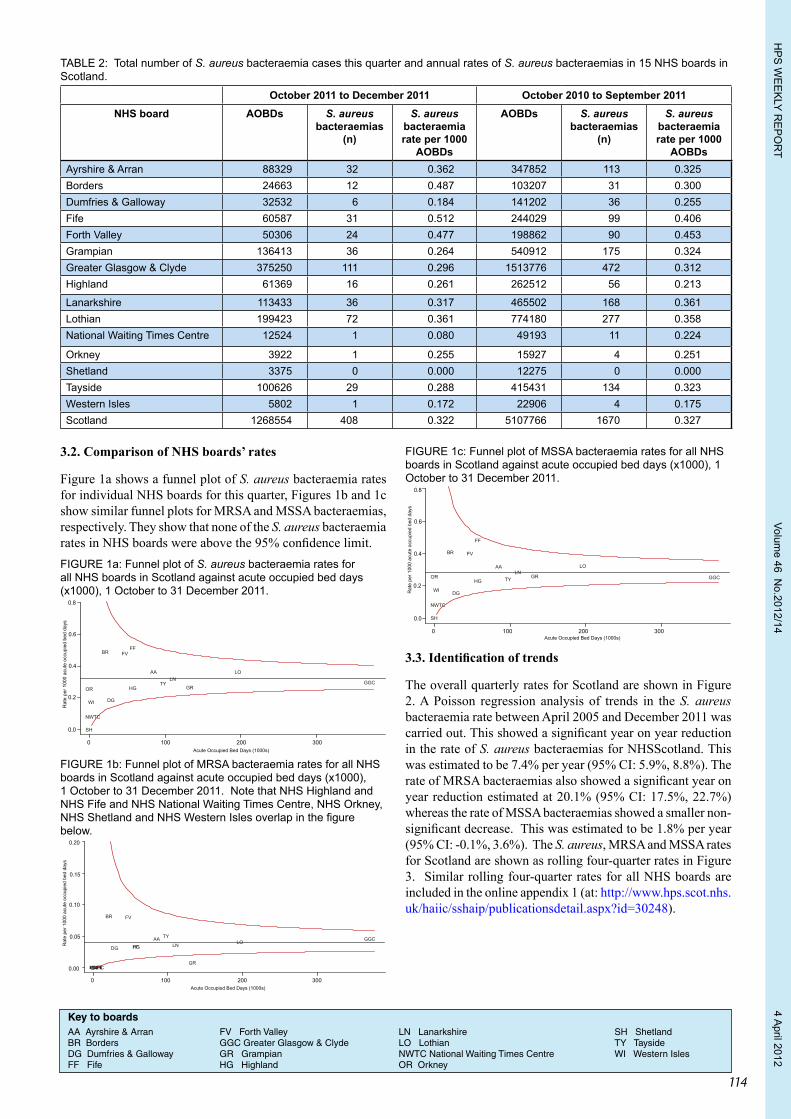
3.3. Identification of trends
The overall quarterly rates for Scotland are shown in Figure 2. A Poisson regression analysis of trends in the S. aureus bacteraemia rate between April 2005 and December 2011 was carried out. This showed a significant year on year reduction in the rate of S. aureus bacteraemias for NHSScotland. This was estimated to be 7.4% per year (95% CI: 5.9%, 8.8%). The rate of MRSA bacteraemias also showed a significant year on year reduction estimated at 20.1% (95% CI: 17.5%, 22.7%) whereas the rate of MSSA bacteraemias showed a smaller non-significant decrease. This was estimated to be 1.8% per year (95% CI: -0.1%, 3.6%). The S. aureus, MRSA and MSSA rates for Scotland are shown as rolling four-quarter rates in Figure 3. Similar rolling four-quarter rates for all NHS boards are included in the online appendix 1 (at: http://www.hps.scot.nhs.uk/haiic/sshaip/publicationsdetail.aspx?id=30248).
Key to boardsAA Ayrshire & Arran FV Forth Valley LN Lanarkshire SH ShetlandBR Borders GGC Greater Glasgow & Clyde LO Lothian TY TaysideDG Dumfries & Galloway GR Grampian NWTC National Waiting Times Centre WI Western IslesFF Fife HG Highland OR Orkney
HP
S W
EE
KLY R
EP
OR
T Volum
e 46 No.2012/14
4 April 2012
115
TABLE 3: S. aureus antimicrobial resistance proportions (% with 95% confidence intervals), October to December 2011.Antibiotic MSSA Q4 2011 bacteraemia (n=323) MRSA Q4 2011 snapshot (n=50) MRSA Q4 2011 bacteraemia (n=120)
ciprofloxacin 5.9 (3.8,9.0) 92.0 (81.2,96.8) 84.2 (76.6,89.6)
clindamycin 0.3 (0.1,1.7) 18.0 (9.8,30.8) 10.8 (6.4,17.7)
erythromycin 6.8 (4.5,10.1) 62.0 (48.2,74.1) 64.2 (55.3,72.2)
fusidic acid 1.5 (0.7,3.6) 0.0 - 3.3 (1.3,8.3)
gentamicin 0.9 (0.3,2.7) 14.0 (7.0,26.2) 10.0 (5.8,16.7)
kanamycin 1.5 (0.7,3.6) 20.0 (11.2,33.0) 17.5 (11.7,25.3)
linezolid 0.0 - 0.0 - 0.0 -
mupirocin (high level) 0.3 (0.1,1.7) 2.0 (0.4,10.5) 5.0 (2.3,10.5)
mupirocin (low level) 0.0 - 0.0 - 0.8 (0.1,4.6)
rifampicin 0.0 - 0.0 - 0.8 (0.1,4.6)
tetracycline 6.2 (4.0,9.4) 26.0 (15.9,39.6) 14.2 (9.0, 21.5)
trimethoprim 3.4 (1.9,6.0) 40.0 (27.6,53.8) 21.7 (15.2,29.9)
vancomycin 0.0 - 0.0 - 0.0 -
FIGURE 2: Overall quarterly S. aureus bacteraemia rates for Scotland (per 1000 total AOBDs) with linear trend line for 27 quarters of mandatory surveillance covering the period 1 April 2005 to 31 December 2011.
S. aureus bacteraemia per 1000 AOBDs Linear (S. aureus bacteraemia per 1000 AOBDs)
Apr 05
-Jun 0
5
Jul 0
5-Sep
05
Oct 05
-Dec
05
Jan 0
6-Mar
06
Apr 06
-Jun 0
6
Jul 0
6-Sep
06
Oct 06
-Dec
06
Jan 0
7-Mar
07
Apr 07
-Jun 0
7
Jul 0
7-Sep
07
Oct 07
-Dec
07
Jan 0
8-Mar
08
Apr 08
-Jun 0
8
Jul 0
8-Sep
08
Oct 08
-Dec
08
Jan 0
9-Mar
09
Apr 09
-Jun 0
9
Jul 0
9-Sep
09
Oct 09
-Dec
09
Jan 1
0-Mar
10
Apr 10
-Jun 1
0
Jul 1
0-Sep
10
Oct 10
-Dec
10
Jan 1
1-Mar
11
Apr 11
-Jun 1
1
July
11-S
ep11
Oct 11
-Dec
110.0
0.1
0.2
0.3
0.4
0.5
0.6
0.7
Year
Rat
e pe
r 10
00 a
cute
occ
upie
d be
d da
ys
FIGURE 3: Rolling four quarter rates of S. aureus, MRSA and MSSA bacteraemia for Scotland (per 1000 total AOBDs) with confidence intervals (CI) from April 2005.
Four quarters ending
S. aureus rate S. aureus_lower CI S. aureus_upper CI
MRSA rate MRSA_lower CI MRSA_upper CIMSSA rate MSSA_lower CI MSSA_upper CI
0
0.1
0.2
0.3
0.4
0.5
0.6
Rat
e pe
r 100
0 ac
ute
occu
pied
bed
day
s
Jan 0
6-Mar
06
Jan 0
7-Mar
07
Jan 0
8-Mar
08
Jan 0
9-Mar
09
Jan 1
0-Mar
10
Jan 1
1-Mar
11
3.4. Typing, susceptibility and toxin production data
Bacteraemia data (ECDC surveillance isolates)
Between October and December 2011, 373 S. aureus bacteraemia isolates were referred to the SMRSARL for typing and antimicrobial susceptibility testing. The majority of isolates were MSSA (n=323). MRSA isolates (n=50) accounted for 13.4% of all S. aureus submissions of which EMRSA-15 (n= 41; 82.0%) were the most common. The non-epidemic
strains accounted for 14.0% (n=7) of all MRSA strains whilst EMRSA-16 isolates accounted for 4.0% (n=2).
For MSSA, the highest proportions of resistance were reported for erythromycin (n=22, 6.8%; 95% CI: 4.5, 10.1), tetracycline (n=20, 6.2%; 95% CI: 4.0, 9.4), ciprofloxacin (n=19, 5.9%; 95% CI: 3.8, 9.0), and trimethoprim (n=11, 3.4%; 95% CI: 1.9, 6.0).
For MRSA the highest proportion of resistances were reported for ciprofloxacin (n=46, 92.0%; 95% CI: 81.2, 96.8), erythromycin (n=31, 62.0%; 95% CI: 48.2, 74.1), trimethoprim (n=20, 40.0%; 95% CI: 27.6, 53.8) and tetracycline (n=13 26.0%; 95% CI: 15.9, 39.6). High level resistance to mupirocin was reported in one isolate (2.0%; 95% CI: 0.1, 4.6) and no low level resistance was reported.
A total of four isolates (three MSSA and one MRSA) were found to be carrying the Panton Valentine Leukocidin (PVL) toxin gene.
MRSA snapshot data (representative surveillance)
Between October and December 2011, 120 MRSA isolates were submitted to the SMRSARL for typing, antimicrobial susceptibility and toxin testing. The majority of isolates originated from superficial skin and soft tissue infections and wound infections. EMRSA-15 accounted for the majority of strains (n=96; 80.0%) followed the non-epidemic strains (n= 15; 12.5%). There were nine EMRSA-16s (7.5%).
The highest proportions of resistance were reported for ciprofloxacin (n=101; 84.2%; 95% CI: 76.6, 89.6), erythromycin (n=77; 64.2%; 95% CI: 55.3, 72.2), trimethoprim (n=26; 21.7%; 95% CI: 9.0, 21.5) and kanamycin (n=21; 17.5%; 95% CI: 11.7, 25.3). High level mupirocin resistance was detected in six isolates (5.0%; 95% CI: 0.7, 5.8) and low level resistance was detected in one isolate (0.8%; 95% CI: 0.1, 4.6).
Nine PVL-positive MRSA strains were reported from superficial skin and soft tissue infections.
An overview of all resistance proportions can be found in Table 3.
HP
S W
EE
KLY R
EP
OR
T Volum
e 46 No.2012/14
4 April 2012
116
The last quarterly report on the surveillance of Staphylococcus aureus bacteraemia in Scotland was in Issue 12/02The next quarterly report on the surveillance of Staphylococcus aureus bacteraemia in Scotland will be in Issue 12/27
4. Discussion
This report covers S. aureus bacteraemia surveillance data for the period October to December 2011. Unlike the national surveillance schemes in many other countries, it includes both MRSA and MSSA bacteraemias.
A number of important caveats associated with the data in this report must be highlighted. This includes the use of estimated denominator data, numerator data being self-reported by participating laboratories, the inclusion of some S. aureus bacteraemias which may be community-acquired and only diagnosed on admission to hospital and possible multiple reports on patients due to non-compliance with treatment or treatment failure.
Altogether, 408 cases of S. aureus bacteraemia were identified during this period. This represents an increase of 6.5% compared with the total number from the previous quarter. This small increase may be due to seasonal variation.
The proportion of S. aureus bacteraemias which were meticillin resistant during the quarter October to December 2011 was 13.3%. The 2010 figures for the UK (published in Antimicrobial resistance surveillance in Europe 2010)9 show that the proportion of S. aureus bacteraemia which were meticillin resistant was 21.6%.
Funnel plot analysis was used to examine variations in NHS board S. aureus bacteraemia rates. No NHS boards were above the 95% confidence intervals in the S. aureus bacteraemia funnel plots. The funnel plots do not account for differences in the clinical activities performed in different NHS boards. Therefore, care must be taken in interpreting these graphs, particularly for the NWTC which is a small board providing specialist services.
The national S. aureus bacteraemia rate per 1000 AOBDs during the period April 2005 to December 2011 showed a significant downward trend and this was estimated as a reduction of 7.4% per year (95% CI: 5.9%, 8.8%).
Typing of MRSA isolates from the bacteraemia and snapshot surveillance data has demonstrated that EMRSA-15 remains the predominant circulating strain in Scotland.
There is little difference in resistance proportions between the MRSA bacteraemia and snapshot isolates with the majority of confidence intervals overlapping. MRSA susceptibility to mupirocin, in particular, is continually monitored by HPS and the SMRSARL. With the roll-out of the national MRSA screening programme it is possible that there will be an increase in the prescribing of mupirocin and so it is essential to monitor any emerging issues. Treatment with mupirocin is
unlikely to be effective in the presence of high level mupirocin resistance, and there is some evidence to suggest that low-level resistance may also predict treatment failure. HPS is working in conjunction with the SMRSARL and NHS boards to monitor any emerging issues.
Altogether, 13 S. aureus isolates were reported as being PVL-positive. The clinical sequelae of PVL-positive S. aureus infection tend to be more severe than PVL-negative. Infections range from superficial skin infections to more serious conditions such as necrotising pneumonia. Whilst the number of number of PVL-positive isolates remains low, as stated in previous reports, it is possible that the burden of PVL-related disease in Scotland remains underestimated. Improvements in both surveillance and case ascertainment are required to establish the burden of disease and associated risk factors. All isolates suspected of being PVL-positive should be referred to the SMRSARL for confirmatory tests. It is important to monitor which strains are circulating, track disseminated clones and monitor for the emergence of new or emerging strains. This is essential to the development of evidence-based guidance for effective patient management and infection control strategies.
Acknowledgements
Health Protection Scotland is grateful to all of the microbiologists throughout Scotland who provided the S. aureus bacteraemia data for this report and helped in its preparation, staff at the Scottish MRSA Reference Laboratory who provided the ECDC data and to the Information Services Division of National Services Scotland for providing the hospital activity data. Our thanks also go to Information Services Division of National Services Scotland for their statistical support.
References1. Health Protection Scotland. The Annual Surveillance of Healthcare Associated
Infections Report January - December 2010 [online]. Available: http://www.hps.scot.nhs.uk/haiic/sshaip/publicationsdetail.aspx?id=47876 [accessed 01 March 2012]. 2011.
2. European Centre for Disease Prevention and Control. European Antimicrobial Resistance Surveillance Network (EARS-Net) [online]. 2010. Available: http://ecdc.europa.eu/en/activities/surveillance/EARS-Net/Pages/index.aspx [accessed 01 March 2012].
3. Scottish MRSA Reference Laboratory. Services Available [online]. 2010. Available: http://www.smrsarl.scot.nhs.uk/services.asp [accessed 01 March 2012].
4. Health Protection Scotland. National Systems Relating to Notifications. Available: http://www.scotland.gov.uk/Resource/Doc/924/0076150.doc [accessed 01March 2012]. 2008.
5. The Scottish Office. A revised framework for national surveillance of healthcare associated infection in Scotland. SGHD. 2006;HDL(2006)38. Available: http://www.show.scot.nhs.uk/sehd/mels/HDL2006_38.pdf [accessed 28 March 2012]
6. Information Services Division of National Services Scotland. Home Page. Available: http://www.isdscotland.org/index.asp [accessed 01 March 2012]. 2010.
7. Health Protection Scotland. Protocol for the Scottish Mandatory Surveillance Programme for Staphylococcus aureus bacteraemia [online]. Available: http://www.documents.hps.scot.nhs.uk/hai/sshaip/guidelines/s-aureus/s-aureus-bacteraemia-protocol-v4-2011-09.pdf [accessed 01 March 2012]. 2011.
8. Spiegelhalter D. Funnel plots for comparing institutional performance. Statistics in Medicine. 2005 //;24:1185-202.
9. European Centre for Disease Prevention and Control (ECDC). Antimicrobial resistance surveillance in Europe 2010. Annual report of the European Antimicrobial Resistance Surveillance Network (EARS-Net). Available: http://ecdc.europa.eu/en/publications/Publications/Forms/ECDC_DispForm.aspx?ID=774 [accessed 01 March 2012]. 2011:1- 208.
Commencing with the Q1 2012 report, the scaling factor used in reporting incidence rates will be ‘per 100,000 bed days’ instead of the previously used ‘per 1,000 bed days’. This change has been introduced to ensure consistency with wider UK and ECDC reporting, and in light of decreases in the observed rates.
The methods used in obtaining the figures remain unchanged, the only change being in the scaling factor used.
HP
S W
EE
KLY R
EP
OR
T Volum
e 46 No.2012/14
4 April 2012
117
Quarterly report on the surveillance of Clostridium difficile infection (CDI) in Scotland, October - December 2011
Prepared by: The HPS C. difficile Working Group
• In this quarter (Q4 2011), 344 new cases of CDI were identified in patients aged ≥65, which represents an overall incidence rate for Scotland of 0.28 cases per 1000 total occupied bed days. In comparison with the previous quarter, the overall incidence rate has decreased 12%.
• In younger patients (aged 15-64), 163 new cases of CDI were identified this quarter, representing overall incidence rate for Scotland of 0.43 cases per 1000 acute occupied bed days. The overall incidence rate has decreased 4%.
• Year on year trend analysis comparing 2010 with 2011 shows there has been a statistically significant reduction in the overall incidence rates for patients aged ≥65 of 33%. In patients aged 15-64, there was a non-significant reduction of 7%.
• A total of 220 C. difficile isolates were ribotyped this quarter: 121 from the clinical surveillance (severe cases and outbreaks); 99 from the representative surveillance (snapshot). Ribotype 027 proportions have decreased this quarter due to control of the outbreaks reported in the previous quarter. The proportion of types 106 and 001 remain low despite a minor increase in the clinical surveillance this quarter.
• CDI remains an important health threat within Scotland. Older patients remain at highest risk for CDI, but the younger age groups are also vulnerable to infection. There remains scope for reduction of incidence rates in both age groups.
1. IntroductionClostridium difficile infection (CDI) is an important healthcare associated infection and is a major cause of morbidity and mortality. Major risk factors for CDI include old age and previous use of antibiotics. Disease ranges from mild self-limiting diarrhoea to severe diarrhoea, pseudomembranous colitis, toxic megacolon and death.
In Scotland, mandatory surveillance of CDI was introduced in 2006 and initially focused on the incidence of CDI in patients aged ≥65 (as the age group most at risk). In April 2009, the programme was expanded to include patients aged 15-64 years.
The programme is supported by a ribotyping service provided by the Scottish Salmonella, Shigella and Clostridium difficile Reference Laboratory (SSSCDRL). Mandatory surveillance of ribotypes falls into two categories: a) clinical surveillance: isolates associated with outbreaks and severe disease, and b) representative surveillance: isolates from a fixed proportion of all cases including mild, moderate and severe disease. The surveillance of severe cases/outbreaks has been running since November 2007, whereas the representative surveillance was implemented in January 2009.
2. Methods 2.1 Data sources and reportingIn Scotland, all 15 NHS boards report cases of CDI to Health Protection Scotland (HPS) and submit isolates from severe cases and outbreaks to the SSSCDRL according to a standard protocol (the Protocol for the Scottish Surveillance Programme for Clostridium difficile Infection). The surveillance protocol (version 3.0) is available from: http://www.hps.scot.nhs.uk/haiic/sshaip/guidelinedetail.aspx?id=40899
The surveillance programme includes all cases identified in NHSScotland, including patients from acute and non-acute hospitals and the community. Cases are allocated to NHS boards based on the location of the diagnostic laboratory where the specimen was first tested.
To further inform understanding of ribotype distribution an assigned number of isolates corresponding to a fixed proportion of CDI cases are submitted by each board to the SSSCDRL according to the protocol for the representative typing scheme (Snapshot Programme). The protocol is available from: http://www.hps.scot.nhs.uk/haiic/sshaip/guidelinedetail.aspx?id=46879
2.2 Data analysis
Calculation of rates
CDI cases and incidence rates are presented by NHS board per 1000 bed days and as an overall incidence rate for Scotland. Population rates for the NHS boards and Scotland are reported per 100,000 population.
Incidence rates in the two age groups (15-64 and ≥65) are not comparable as different denominator data are used for these two groups; bed days from non-acute settings/elderly care are included in the older age group but not in the younger age group.
Identification of outliersFunnel plots are used to plot the incidence rates of CDI per 1000 bed days against the number of bed days in 1000s along with 95% confidence limits of all NHS boards. Incidence rates outside the 95% confidence limits are considered outliers.
Analysis of trendsTrend analysis of incidence rates is based upon the most recent two years of data.
2.3 Resources/DataFor full details of the methods including denominators, calculation of rates and statistical analyses please use the web-link below: http://www.documents.hps.scot.nhs.uk/hai/sshaip/publications/cdi/2011/methods-caveats-q4.pdf
All previous published data can be accessed at: http://www.hps.scot.nhs.uk/haiic/sshaip/clostridiumdifficile.aspx?subjectid=79#ar
Please note CDI rates in this report have been updated due to a subsequent revision of the national figures of hospital activity. Please go to http://www.hps.scot.nhs.uk/haiic/sshaip/publicationsdetail.aspx?id=50174 for the newest revised data.
HP
S W
EE
KLY R
EP
OR
T Volum
e 46 No.2012/14
4 April 2012
118
3. Results
3.1 Surveillance data
CDI incidence in patients aged 65 and over
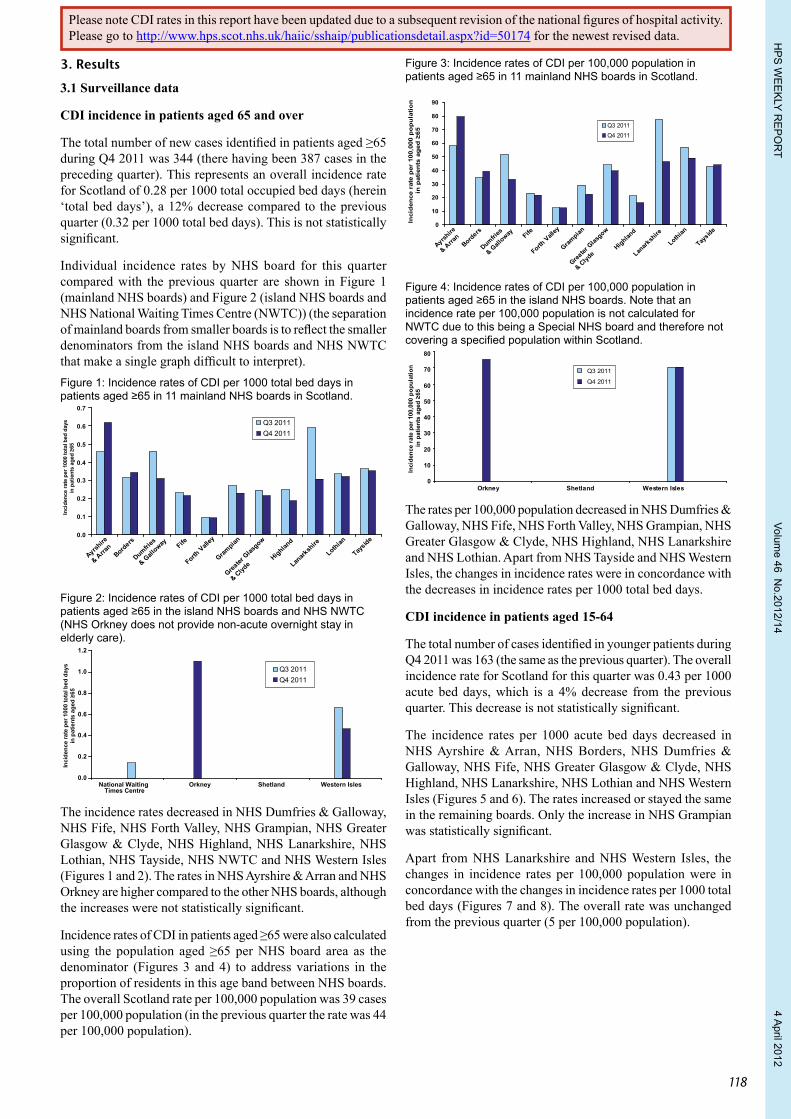
The total number of new cases identified in patients aged ≥65 during Q4 2011 was 344 (there having been 387 cases in the preceding quarter). This represents an overall incidence rate for Scotland of 0.28 per 1000 total occupied bed days (herein ‘total bed days’), a 12% decrease compared to the previous quarter (0.32 per 1000 total bed days). This is not statistically significant.
Individual incidence rates by NHS board for this quarter compared with the previous quarter are shown in Figure 1 (mainland NHS boards) and Figure 2 (island NHS boards and NHS National Waiting Times Centre (NWTC)) (the separation of mainland boards from smaller boards is to reflect the smaller denominators from the island NHS boards and NHS NWTC that make a single graph difficult to interpret). Figure 1: Incidence rates of CDI per 1000 total bed days in patients aged ≥65 in 11 mainland NHS boards in Scotland.
Ayrshire
& Arran
Borders
Dumfries
& Gall
oway Fife
Forth Vall
ey
Grampian
Greater
Glas
gow
& Clyde
Highland
Lanark
shire
Lothian
Tayside
Inci
denc
e ra
te p
er 1
000
tota
l bed
day
sin
pat
ient
s ag
ed ≥
65
Q3 2011Q4 2011
0.0
0.1
0.2
0.3
0.4
0.5
0.6
0.7
Figure 2: Incidence rates of CDI per 1000 total bed days in patients aged ≥65 in the island NHS boards and NHS NWTC (NHS Orkney does not provide non-acute overnight stay in elderly care).
Inci
denc
e ra
te p
er 1
000
tota
l bed
day
s in
pat
ient
s ag
ed ≥
65
0.0
0.2
0.4
0.6
0.8
1.0
1.2
National WaitingTimes Centre
Orkney Shetland Western Isles
Q3 2011Q4 2011
The incidence rates decreased in NHS Dumfries & Galloway, NHS Fife, NHS Forth Valley, NHS Grampian, NHS Greater Glasgow & Clyde, NHS Highland, NHS Lanarkshire, NHS Lothian, NHS Tayside, NHS NWTC and NHS Western Isles (Figures 1 and 2). The rates in NHS Ayrshire & Arran and NHS Orkney are higher compared to the other NHS boards, although the increases were not statistically significant.
Incidence rates of CDI in patients aged ≥65 were also calculated using the population aged ≥65 per NHS board area as the denominator (Figures 3 and 4) to address variations in the proportion of residents in this age band between NHS boards. The overall Scotland rate per 100,000 population was 39 cases per 100,000 population (in the previous quarter the rate was 44 per 100,000 population).
Figure 3: Incidence rates of CDI per 100,000 population in patients aged ≥65 in 11 mainland NHS boards in Scotland.
Inci
den
ce r
ate
per
100
,000
po
pu
lati
on
in
pat
ien
ts a
ged
≥65
Ayrshire
& Arra
nBord
ers
Dumfries
& Gall
oway Fife
Forth V
alley
Grampian
Greater
Glas
gow
& Clyd
eHighlan
d
Lanark
shire
Lothian
Tayside
0
10
20
30
40
50
60
70
80
90
Q3 2011Q4 2011
Figure 4: Incidence rates of CDI per 100,000 population in patients aged ≥65 in the island NHS boards. Note that an incidence rate per 100,000 population is not calculated for NWTC due to this being a Special NHS board and therefore not covering a specified population within Scotland.
0
10
20
30
40
50
60
70
80
Inci
denc
e ra
te p
er 1
00,0
00 p
opul
atio
n in
pat
ient
s ag
ed ≥
65
Orkney Shetland Western Isles
Q3 2011
Q4 2011
The rates per 100,000 population decreased in NHS Dumfries & Galloway, NHS Fife, NHS Forth Valley, NHS Grampian, NHS Greater Glasgow & Clyde, NHS Highland, NHS Lanarkshire and NHS Lothian. Apart from NHS Tayside and NHS Western Isles, the changes in incidence rates were in concordance with the decreases in incidence rates per 1000 total bed days.
CDI incidence in patients aged 15-64
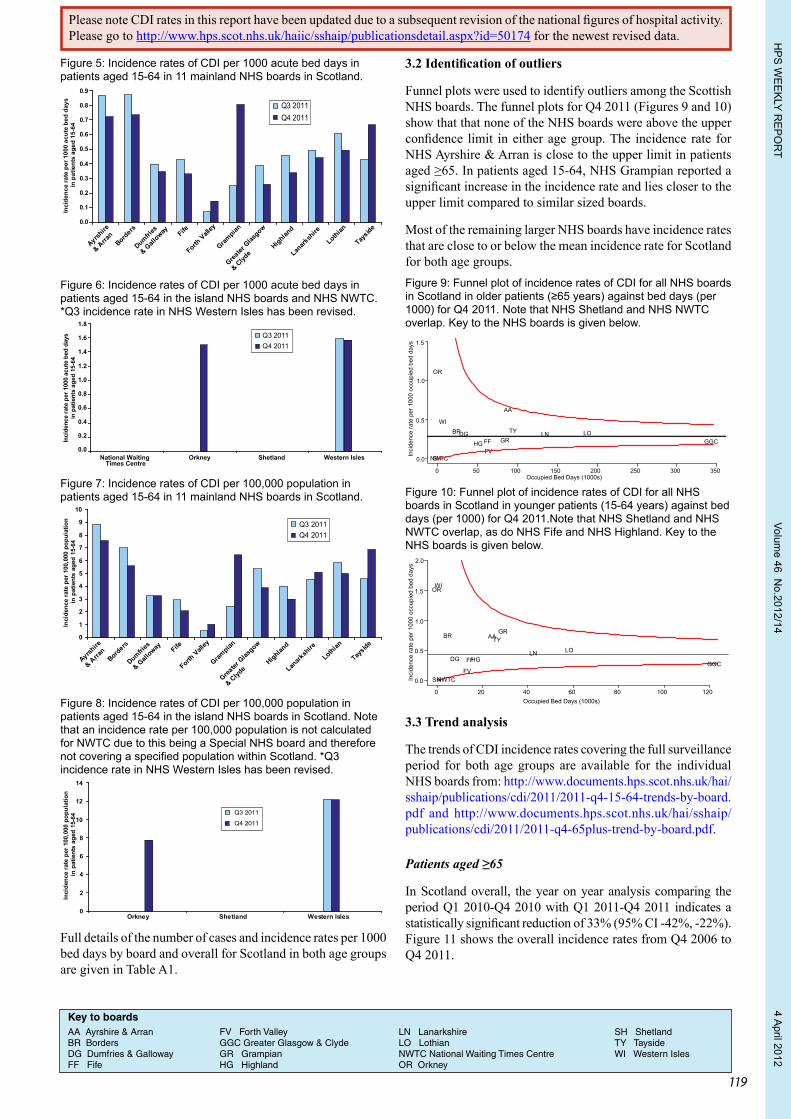
The total number of cases identified in younger patients during Q4 2011 was 163 (the same as the previous quarter). The overall incidence rate for Scotland for this quarter was 0.43 per 1000 acute bed days, which is a 4% decrease from the previous quarter. This decrease is not statistically significant.
The incidence rates per 1000 acute bed days decreased in NHS Ayrshire & Arran, NHS Borders, NHS Dumfries & Galloway, NHS Fife, NHS Greater Glasgow & Clyde, NHS Highland, NHS Lanarkshire, NHS Lothian and NHS Western Isles (Figures 5 and 6). The rates increased or stayed the same in the remaining boards. Only the increase in NHS Grampian was statistically significant.
Apart from NHS Lanarkshire and NHS Western Isles, the changes in incidence rates per 100,000 population were in concordance with the changes in incidence rates per 1000 total bed days (Figures 7 and 8). The overall rate was unchanged from the previous quarter (5 per 100,000 population).
Please note CDI rates in this report have been updated due to a subsequent revision of the national figures of hospital activity. Please go to http://www.hps.scot.nhs.uk/haiic/sshaip/publicationsdetail.aspx?id=50174 for the newest revised data.
HP
S W
EE
KLY R
EP
OR
T Volum
e 46 No.2012/14
4 April 2012
119
Figure 5: Incidence rates of CDI per 1000 acute bed days in patients aged 15-64 in 11 mainland NHS boards in Scotland.
0.0
0.1
0.2
0.3
0.4
0.5
0.6
0.7
0.8
0.9
Inci
denc
e ra
te p
er 1
000
acut
e be
d da
ys
in p
atie
nts
aged
15-
64
Ayrshire
& Arra
nBord
ers
Dumfries
& Gall
oway Fife
Forth V
alley
Grampian
Greater
Glas
gow
& Clyd
eHighlan
d
Lanark
shire
Lothian
Tayside
Q3 2011Q4 2011
Figure 6: Incidence rates of CDI per 1000 acute bed days in patients aged 15-64 in the island NHS boards and NHS NWTC. *Q3 incidence rate in NHS Western Isles has been revised.
Inci
denc
e ra
te p
er 1
000
acut
e be
d da
ys
in p
atie
nts
aged
15-
64
0.0
0.2
0.4
0.6
0.8
1.0
1.2
1.4
1.6
1.8
National WaitingTimes Centre
Orkney Shetland Western Isles
Q3 2011Q4 2011
Figure 7: Incidence rates of CDI per 100,000 population in patients aged 15-64 in 11 mainland NHS boards in Scotland.
Inci
denc
e ra
te p
er 1
00,0
00 p
opul
atio
n in
pat
ient
s ag
ed 1
5-64
Ayrshire
& Arra
nBord
ers
Dumfries
& Gall
oway Fife
Forth V
alley
Grampian
Greater
Glas
gow
& Clyd
eHighlan
d
Lanark
shire
Lothian
Tayside
0
1
2
3
4
5
6
7
8
9
10
Q3 2011Q4 2011
Figure 8: Incidence rates of CDI per 100,000 population in patients aged 15-64 in the island NHS boards in Scotland. Note that an incidence rate per 100,000 population is not calculated for NWTC due to this being a Special NHS board and therefore not covering a specified population within Scotland. *Q3 incidence rate in NHS Western Isles has been revised.
Q3 2011
Q4 2011
0
2
4
6
8
10
12
14
Orkney Shetland Western Isles
Inci
denc
e ra
te p
er 1
00,0
00 p
opul
atio
n in
pat
ient
s ag
ed 1
5-64
Full details of the number of cases and incidence rates per 1000 bed days by board and overall for Scotland in both age groups are given in Table A1.
3.2 Identification of outliers
Funnel plots were used to identify outliers among the Scottish NHS boards. The funnel plots for Q4 2011 (Figures 9 and 10) show that that none of the NHS boards were above the upper confidence limit in either age group. The incidence rate for NHS Ayrshire & Arran is close to the upper limit in patients aged ≥65. In patients aged 15-64, NHS Grampian reported a significant increase in the incidence rate and lies closer to the upper limit compared to similar sized boards.
Most of the remaining larger NHS boards have incidence rates that are close to or below the mean incidence rate for Scotland for both age groups.Figure 9: Funnel plot of incidence rates of CDI for all NHS boards in Scotland in older patients (≥65 years) against bed days (per 1000) for Q4 2011. Note that NHS Shetland and NHS NWTC overlap. Key to the NHS boards is given below.
Occupied Bed Days (1000s)
Inci
denc
e ra
te p
er 1
000
occu
pied
bed
day
s
0 50 100 150 200 250 300 350
0.0
0.5
1.0
1.5
NWTC
AA
BRDGFFFV
GR GGCHGLN LO
OR
SH
TYWI
Figure 10: Funnel plot of incidence rates of CDI for all NHS boards in Scotland in younger patients (15-64 years) against bed days (per 1000) for Q4 2011.Note that NHS Shetland and NHS NWTC overlap, as do NHS Fife and NHS Highland. Key to the NHS boards is given below.
Occupied Bed Days (1000s)
Inci
denc
e ra
te p
er 1
000
occu
pied
bed
day
s
0 20 40 60 80 100 120
0.0
0.5
1.0
1.5
2.0
AABR
DG FF
FV
GR
GGCHG
LN LO
OR
SH
TY
WI
NWTC
3.3 Trend analysis
The trends of CDI incidence rates covering the full surveillance period for both age groups are available for the individual NHS boards from: http://www.documents.hps.scot.nhs.uk/hai/sshaip/publications/cdi/2011/2011-q4-15-64-trends-by-board.pdf and http://www.documents.hps.scot.nhs.uk/hai/sshaip/publications/cdi/2011/2011-q4-65plus-trend-by-board.pdf.
Patients aged ≥65
In Scotland overall, the year on year analysis comparing the period Q1 2010-Q4 2010 with Q1 2011-Q4 2011 indicates a statistically significant reduction of 33% (95% CI -42%, -22%). Figure 11 shows the overall incidence rates from Q4 2006 to Q4 2011.
Key to boardsAA Ayrshire & Arran FV Forth Valley LN Lanarkshire SH ShetlandBR Borders GGC Greater Glasgow & Clyde LO Lothian TY TaysideDG Dumfries & Galloway GR Grampian NWTC National Waiting Times Centre WI Western IslesFF Fife HG Highland OR Orkney
Please note CDI rates in this report have been updated due to a subsequent revision of the national figures of hospital activity. Please go to http://www.hps.scot.nhs.uk/haiic/sshaip/publicationsdetail.aspx?id=50174 for the newest revised data.

HP
S W
EE
KLY R
EP
OR
T Volum
e 46 No.2012/14
4 April 2012
120
Statically significant decreases in the year-on-year comparison were reported in NHS Ayrshire & Arran, NHS Fife, NHS Forth Valley, NHS Greater Glasgow & Clyde, NHS Grampian, NHS Highland, and NHS Lothian. Non-significant decreases were observed in the remaining NHS boards.
The increase in NHS Orkney was not statistically significant.
Trend analyses were not carried out for NHS Shetland and NHS NWTC due to their reporting no or very few cases over the period.
Patients aged 15-64
In Scotland overall, the year on year analysis comparing the period Q1 2010-Q4 2010 with Q1 2011-Q4 2011 indicates a reduction of 7% (95% CI -23%, 12%). Figure 12 shows the overall incidence rates from Q2 2009 to Q4 2011.
Statistically significant decreases in the year-on-year comparison were reported in NHS Highland. Non-significant decreases were observed in NHS Ayrshire & Arran, NHS Dumfries & Galloway, NHS Fife, NHS Forth Valley, NHS Lothian and NHS Tayside.
Of the remaining NHS boards, only NHS Lanarkshire had a statistically significant increase over this period.
Trend analyses were not carried out for NHS Orkney, NHS Shetland, and NHS NWTC due to their reporting no or very few cases over the period.Figure 11: Overall quarterly CDI incidence rates for Scotland (per 1000 total bed days) in patients ≥65 for the period October 2006-December 2011.
Inci
denc
e ra
te p
er 1
000
tota
l bed
day
s in
pat
ient
s ag
ed ≥
65
0.0
0.2
0.4
0.6
0.8
1.0
1.2
1.4
1.6
Q4 Q1 Q2 Q3 Q4 Q1 Q2 Q3 Q4 Q1 Q2 Q3 Q4 Q1 Q2 Q3 Q4 Q1 Q2 Q3 Q42006 2007 2008 2009 2010 2011
Quarter
Figure 12: Overall quarterly CDI incidence rates for Scotland (per 1000 acute bed days) in patients aged 15-64 for the period April 2009-December 2011.
0.0
0.1
0.2
0.3
0.4
0.5
0.6
0.7
0.8
0.9
1.0
Q2 Q3 Q4 Q1 Q2 Q3 Q4 Q1 Q2 Q3 Q42009 2010 2011
Quarter
Inci
denc
e ra
te p
er 1
000
acut
e be
d da
ys
in p
atie
nts
aged
15-
64
3.4 Typing and susceptibility data
Clinical surveillance – ribotypes data from severe cases and outbreaks
The distribution of the ten most common ribotypes in Scotland submitted between November 2007 and December 2011 from
severe cases and outbreaks is shown in Figure 13. The total number of isolates submitted varied considerably between quarters, though there is a decreasing trend in overall isolates submitted since Q3 2008.
This quarter, the total number of isolates submitted was 121. The number of isolates of 106 and 001 increased this quarter but overall numbers remain low compared to previous years. There was a decrease in the number of 027 isolates in Q4 2011 compared to the previous quarter. This type accounted for 5% of the total isolates reported this quarter. Of the other ten commonest types, there were no major variations compared to the preceding quarter.Figure 13: C. difficile PCR ribotypes in Scotland submitted for severe cases and outbreaks. Total number typed was 2639. Rare types (designated ‘Others’) are present in smaller numbers compared to the top ten.
Q4 07
Q1 08
Q2 08
Q3 08
Q4 08
Q1 09
Q2 09
Q3 09
Q4 09
Q1 10
Q2 10
Q3 10
Q4 10
Q1 11
Q211
Q311
Q411
106 001 027 015 005 002 023 014 078 020 Others
0
50
100
150
200
250
300
Num
ber o
f iso
late
s
Antibiotic susceptibilities of ribotypes in Scotland submitted for severe cases and outbreaks for the period January 2011 to December 2011All isolates typed in the past year were sensitive to metronidazole and vancomycin (Table 1). This was also observed for meropenem and piperacillin-tazobactam.
The majority of all isolates typed were resistant to cefotaxime and clindamycin with some variation between the ribotypes. High frequencies of erythromycin resistance (>60%) were observed only in types 106, 001, and 027. Similar results for levofloxacin and moxifloxacin were observed, where only types 106 and 027 showed greater than 95% resistance.
Ribotype 078 had elevated frequencies of resistance to erythromycin (23%) and fluoroquinolones (14-17%).
Representative surveillance - Snapshot data
The distribution of the ten most common ribotypes in Scotland submitted between January 2009 and December 2011 under the representative surveillance programme are shown in Figure 14.
As with the isolates from severe cases and outbreaks, the trends show that there has been a major decrease in the three most common types, 106, 001 and 027 among a representative selection of all CDI cases including mild, moderate and severe disease. Over the last two years, the relative proportions of the other major ribotypes (015, 005, 002, 014, 078, and 020) have increased.
This quarter, the total number of isolates submitted was 99. There were no isolates of 027 isolated which is only the second time this has occurred since the beginning of the snapshot. There was a decrease in type 001 but little change in type 106. Ribotypes 015, 005, 002, 014 and 078 accounted for over half (57%) of all the ribotypes isolated in this quarter.
Please note CDI rates in this report have been updated due to a subsequent revision of the national figures of hospital activity. Please go to http://www.hps.scot.nhs.uk/haiic/sshaip/publicationsdetail.aspx?id=50174 for the newest revised data.
HP
S W
EE
KLY R
EP
OR
T Volum
e 46 No.2012/14
4 April 2012
121
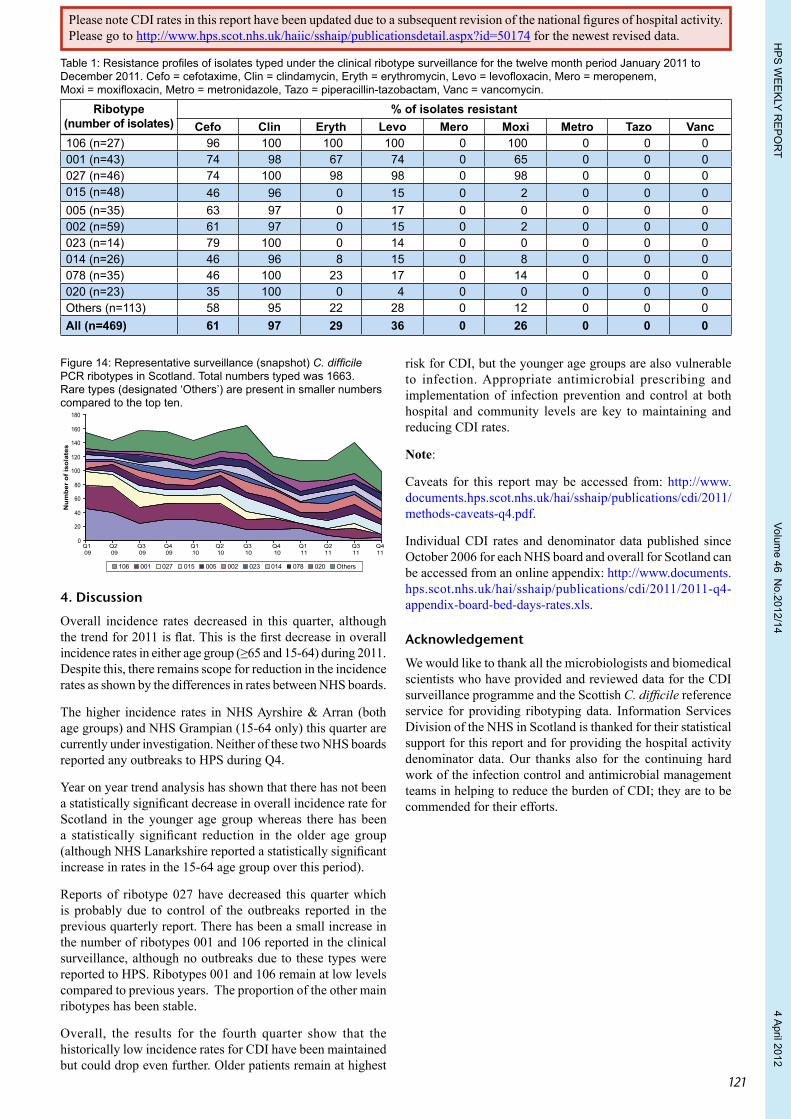
Figure 14: Representative surveillance (snapshot) C. difficile PCR ribotypes in Scotland. Total numbers typed was 1663. Rare types (designated ‘Others’) are present in smaller numbers compared to the top ten.
Q1 09
Q2 09
Q3 09
Q4 09
Q1 10
Q2 10
Q3 10
Q4 10
Q1 11
Q211
Q311
Q411
106 001 027 015 005 002 023 014 078 020 Others
0
20
40
60
80
100
120
140
160
180
Num
ber
of is
olat
es
4. Discussion
Overall incidence rates decreased in this quarter, although the trend for 2011 is flat. This is the first decrease in overall incidence rates in either age group (≥65 and 15-64) during 2011. Despite this, there remains scope for reduction in the incidence rates as shown by the differences in rates between NHS boards.
The higher incidence rates in NHS Ayrshire & Arran (both age groups) and NHS Grampian (15-64 only) this quarter are currently under investigation. Neither of these two NHS boards reported any outbreaks to HPS during Q4.
Year on year trend analysis has shown that there has not been a statistically significant decrease in overall incidence rate for Scotland in the younger age group whereas there has been a statistically significant reduction in the older age group (although NHS Lanarkshire reported a statistically significant increase in rates in the 15-64 age group over this period).
Reports of ribotype 027 have decreased this quarter which is probably due to control of the outbreaks reported in the previous quarterly report. There has been a small increase in the number of ribotypes 001 and 106 reported in the clinical surveillance, although no outbreaks due to these types were reported to HPS. Ribotypes 001 and 106 remain at low levels compared to previous years. The proportion of the other main ribotypes has been stable.
Overall, the results for the fourth quarter show that the historically low incidence rates for CDI have been maintained but could drop even further. Older patients remain at highest
risk for CDI, but the younger age groups are also vulnerable to infection. Appropriate antimicrobial prescribing and implementation of infection prevention and control at both hospital and community levels are key to maintaining and reducing CDI rates.
Note:
Caveats for this report may be accessed from: http://www.documents.hps.scot.nhs.uk/hai/sshaip/publications/cdi/2011/methods-caveats-q4.pdf.
Individual CDI rates and denominator data published since October 2006 for each NHS board and overall for Scotland can be accessed from an online appendix: http://www.documents.hps.scot.nhs.uk/hai/sshaip/publications/cdi/2011/2011-q4-appendix-board-bed-days-rates.xls.
Acknowledgement
We would like to thank all the microbiologists and biomedical scientists who have provided and reviewed data for the CDI surveillance programme and the Scottish C. difficile reference service for providing ribotyping data. Information Services Division of the NHS in Scotland is thanked for their statistical support for this report and for providing the hospital activity denominator data. Our thanks also for the continuing hard work of the infection control and antimicrobial management teams in helping to reduce the burden of CDI; they are to be commended for their efforts.
Table 1: Resistance profiles of isolates typed under the clinical ribotype surveillance for the twelve month period January 2011 to December 2011. Cefo = cefotaxime, Clin = clindamycin, Eryth = erythromycin, Levo = levofloxacin, Mero = meropenem, Moxi = moxifloxacin, Metro = metronidazole, Tazo = piperacillin-tazobactam, Vanc = vancomycin.
Ribotype(number of isolates)
% of isolates resistant Cefo Clin Eryth Levo Mero Moxi Metro Tazo Vanc
106 (n=27) 96 100 100 100 0 100 0 0 0001 (n=43) 74 98 67 74 0 65 0 0 0027 (n=46) 74 100 98 98 0 98 0 0 0015 (n=48) 46 96 0 15 0 2 0 0 0005 (n=35) 63 97 0 17 0 0 0 0 0002 (n=59) 61 97 0 15 0 2 0 0 0023 (n=14) 79 100 0 14 0 0 0 0 0014 (n=26) 46 96 8 15 0 8 0 0 0078 (n=35) 46 100 23 17 0 14 0 0 0020 (n=23) 35 100 0 4 0 0 0 0 0Others (n=113) 58 95 22 28 0 12 0 0 0All (n=469) 61 97 29 36 0 26 0 0 0
Please note CDI rates in this report have been updated due to a subsequent revision of the national figures of hospital activity. Please go to http://www.hps.scot.nhs.uk/haiic/sshaip/publicationsdetail.aspx?id=50174 for the newest revised data.
HP
S W
EE
KLY R
EP
OR
T Volum
e 46 No.2012/14
4 April 2012
122
The last quarterly report on the surveillance of Clostridium difficile infection in Scotland was in Issue 12/02The next quarterly report on the surveillance of Clostridium difficile infection in Scotland will be in Issue 12/27
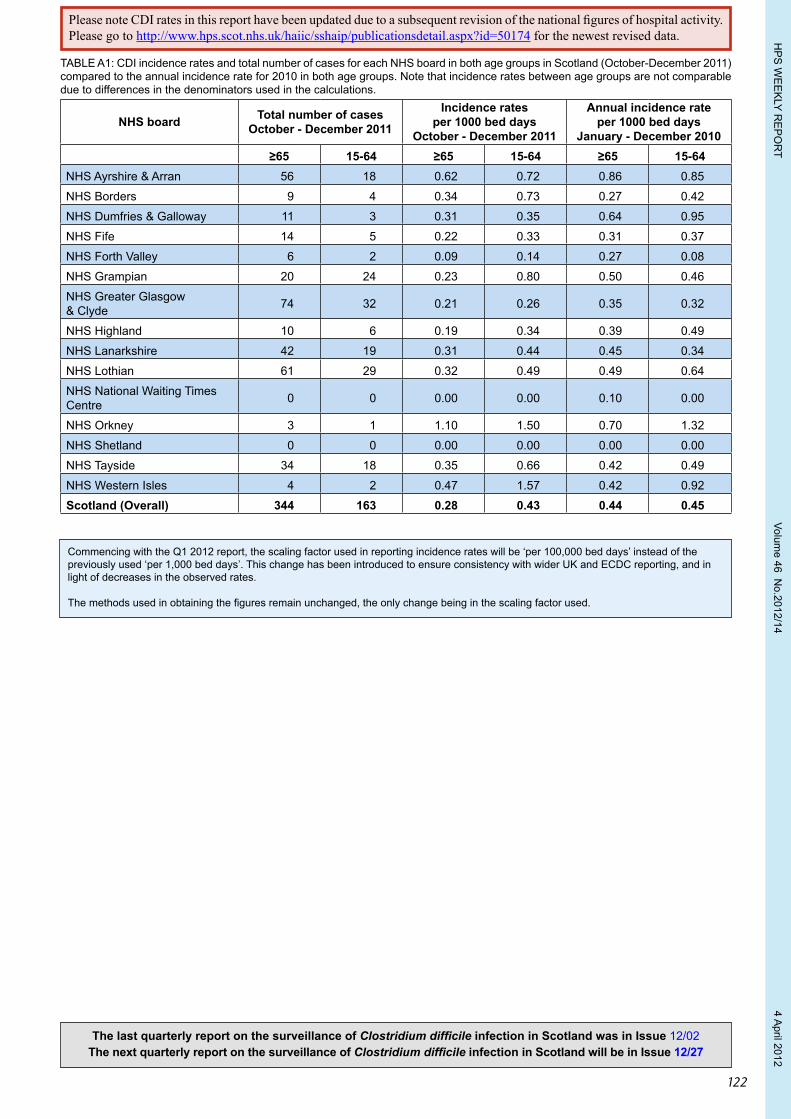
TABLE A1: CDI incidence rates and total number of cases for each NHS board in both age groups in Scotland (October-December 2011) compared to the annual incidence rate for 2010 in both age groups. Note that incidence rates between age groups are not comparable due to differences in the denominators used in the calculations.
NHS board Total number of cases October - December 2011
Incidence rates per 1000 bed days
October - December 2011
Annual incidence rate per 1000 bed days
January - December 2010≥65 15-64 ≥65 15-64 ≥65 15-64
NHS Ayrshire & Arran 56 18 0.62 0.72 0.86 0.85
NHS Borders 9 4 0.34 0.73 0.27 0.42
NHS Dumfries & Galloway 11 3 0.31 0.35 0.64 0.95
NHS Fife 14 5 0.22 0.33 0.31 0.37
NHS Forth Valley 6 2 0.09 0.14 0.27 0.08
NHS Grampian 20 24 0.23 0.80 0.50 0.46
NHS Greater Glasgow & Clyde 74 32 0.21 0.26 0.35 0.32
NHS Highland 10 6 0.19 0.34 0.39 0.49
NHS Lanarkshire 42 19 0.31 0.44 0.45 0.34
NHS Lothian 61 29 0.32 0.49 0.49 0.64
NHS National Waiting Times Centre 0 0 0.00 0.00 0.10 0.00
NHS Orkney 3 1 1.10 1.50 0.70 1.32
NHS Shetland 0 0 0.00 0.00 0.00 0.00
NHS Tayside 34 18 0.35 0.66 0.42 0.49
NHS Western Isles 4 2 0.47 1.57 0.42 0.92
Scotland (Overall) 344 163 0.28 0.43 0.44 0.45
Commencing with the Q1 2012 report, the scaling factor used in reporting incidence rates will be ‘per 100,000 bed days’ instead of the previously used ‘per 1,000 bed days’. This change has been introduced to ensure consistency with wider UK and ECDC reporting, and in light of decreases in the observed rates.
The methods used in obtaining the figures remain unchanged, the only change being in the scaling factor used.
Please note CDI rates in this report have been updated due to a subsequent revision of the national figures of hospital activity. Please go to http://www.hps.scot.nhs.uk/haiic/sshaip/publicationsdetail.aspx?id=50174 for the newest revised data.

HP
S W
EE
KLY R
EP
OR
T Volum
e 46 No.2012/14
4 April 2012
123
Notifiable diseases
Part 2 (Notifiable Diseases, Organisms and Health Risk States) of the Public Health etc.(Scotland) Act came into effect on 1 January 2010 and sets out new duties for registered medical practitioners, NHS boards and directors of diagnostic laboratories. GP practices should familiarise themselves with the Scottish Government guidance on the new notification requirements at: http://www.scotland.gov.uk/Topics/Health/NHS-Scotland/publicact/Implementation/Timetable3333.
Registered medical practitioners report notifiable diseases based on ‘clinical suspicion’. As such, notifications may not be subject to laboratory report confirmation. The published figures will record therefore how many diseases have been clinically suspected.
Patient notifications can, however, be reclassified. When, for example, a suspected (and notified) tuberculosis case is subsequently reported as negative by a laboratory (and found not to be a health protection risk) it would subsequently be removed from the disease totals.
Diseases to be notified by registered medical practitioners with effect from 1 January 2010:
It is recommended that those diseases above marked with an * require urgent notification, i.e. within the same working day.
Note 1: Escherichia coli O157 Clinical suspicion should be aroused by (i) likely infectious bloody diarrhoea or (ii) acute onset non-bloody diarrhoea with a biologically plausible exposure and no alternative explanation. Examples of biologically plausible exposures include:
• contact with farm animals, their faeces or environment;• drinking privately supplied or raw water;• eating foods such as undercooked burgers or unpasteurised dairy products; • contact with a confirmed or suspected case of VTEC infection.
Further guidance is available at: http://www.hps.scot.nhs.uk/giz/e.coli0157.aspx.
Where a case is notified as HUS (Haemolytic Uraemic Syndrome) it should NOT also be notified as ‘Clinical syndrome due to E. coli O157 infection’.
Note 2: Tuberculosis For the purposes of notification, respiratory TB or non-respiratory TB should be taken to have the same meanings as the World Health Organisation definitions of pulmonary TB and non-pulmonary TB respectively:
Pulmonary TB is tuberculosis of the lung parenchyma and/or the tracheobronchial tree.
Non-pulmonary TB is tuberculosis of any other site.
Where tuberculosis is clinically diagnosed in both pulmonary and non-pulmonary sites, this should be treated as pulmonary TB.
Registered medical practitioners have been advised to contact their local NHS Board Health Protection Team for advice should they have any doubts about the diagnosis of suspected cases.
Non-notifiable diseasesRegistered medical practitioners are no longer required to notify the diseases listed below.
• Bacillary dysentery • Chickenpox • Food poisoning • Scarlet fever • Viral hepatitis
These diseases are now covered by a list of notifiable organisms details of which will be reported by laboratories to health protection teams.
Notifiable Diseases which come into effect on 1 January 2010 *Anthrax *Meningococcal disease *Severe Acute Respiratory Syndrome (SARS) *Botulism Mumps *Smallpox Brucellosis *Necrotising fasciitis Tetanus
*Cholera *Paratyphoid Tuberculosis (respiratory or non-respiratory) (see Note 2)
*Clinical syndrome due to E. coli O157 infection (see note 1) *Pertussis (Whooping Cough) *Tularemia
*Diphtheria *Plague *Typhoid *Haemolytic Uraemic Syndrome (HUS) *Poliomyelitis *Viral haemorrhagic fevers*Haemophilus influenzae Type b (Hib) *Rabies *West Nile fever*Measles Rubella Yellow Fever
HP
S W
EE
KLY R
EP
OR
T Volum
e 46 No.2012/14
4 April 2012
124NHS BOARD ABBREVIATIONS
AA Ayrshire & Arran GG Greater Glasgow & Clyde LN Lanarkshire SH Shetland TY TaysideBR Borders FF Fife GR Grampian LO Lothian WI Western IslesDG Dumfries & Galloway FV Forth Valley HG Highland OR Orkney
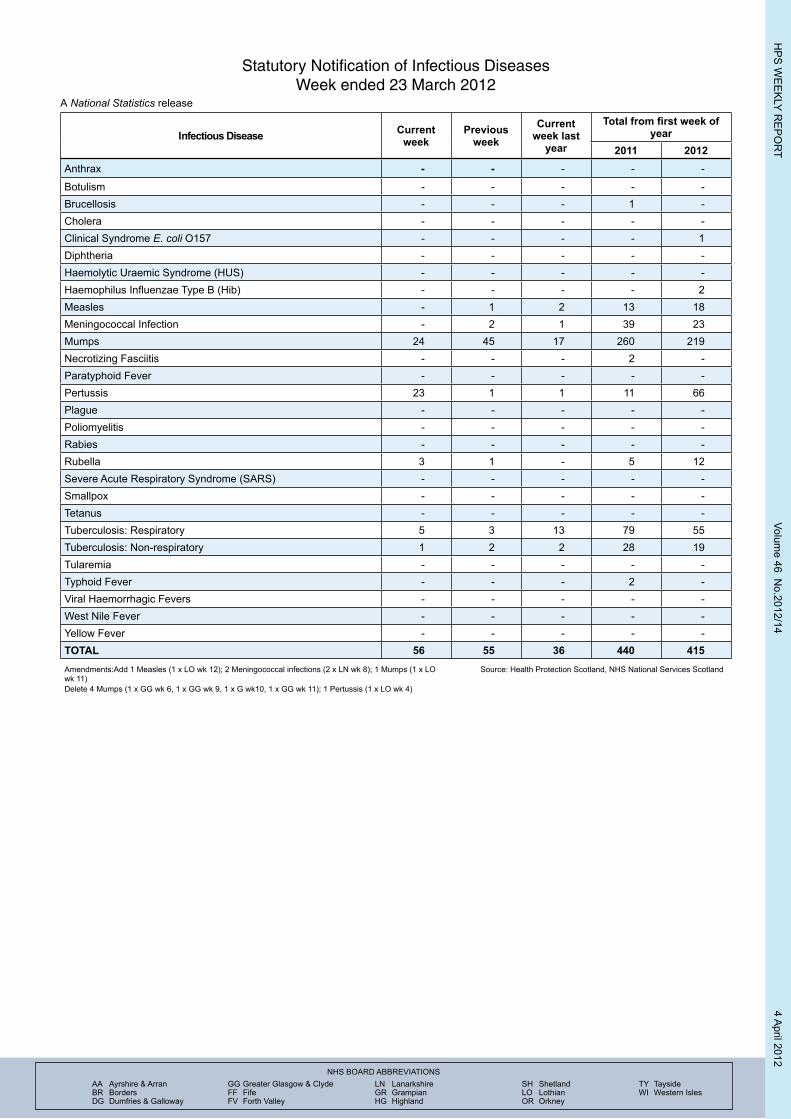
Statutory Notification of Infectious DiseasesWeek ended 23 March 2012
A National Statistics release
Infectious Disease Current week
Previous week
Current week last
year
Total from first week of year
2011 2012Anthrax - - - - -
Botulism - - - - -Brucellosis - - - 1 -Cholera - - - - -Clinical Syndrome E. coli O157 - - - - 1Diphtheria - - - - -Haemolytic Uraemic Syndrome (HUS) - - - - -Haemophilus Influenzae Type B (Hib) - - - - 2Measles - 1 2 13 18Meningococcal Infection - 2 1 39 23Mumps 24 45 17 260 219Necrotizing Fasciitis - - - 2 -Paratyphoid Fever - - - - -Pertussis 23 1 1 11 66Plague - - - - -Poliomyelitis - - - - -Rabies - - - - -Rubella 3 1 - 5 12Severe Acute Respiratory Syndrome (SARS) - - - - -Smallpox - - - - -Tetanus - - - - -Tuberculosis: Respiratory 5 3 13 79 55Tuberculosis: Non-respiratory 1 2 2 28 19Tularemia - - - - -Typhoid Fever - - - 2 -Viral Haemorrhagic Fevers - - - - -West Nile Fever - - - - -Yellow Fever - - - - -TOTAL 56 55 36 440 415Amendments:Add 1 Measles (1 x LO wk 12); 2 Meningococcal infections (2 x LN wk 8); 1 Mumps (1 x LO wk 11)Delete 4 Mumps (1 x GG wk 6, 1 x GG wk 9, 1 x G wk10, 1 x GG wk 11); 1 Pertussis (1 x LO wk 4)
Source: Health Protection Scotland, NHS National Services Scotland