Embed Size (px)
Citation preview

HR & workplace trends 2013
greece
2 HR and workplace trends 3Greece 2013
preface
Welcome to the annual Randstad HR and Workplace Trends Survey report.
As Managing Director, I am pleased to present the 2013 issue. This report, collected from
companies operating within various industries, offers insights into various trends and
developments impacting your business as well as salary statistics.
From October to December 2012 our consultants interviewed 289 key decision makers
and human resources executives across Greece. The 2013 report explores subjects
related to the economy, talent and recruiting, sustainability, trends & innovation in
the workplace, compensation and benefits. The employment market is continuously
changing, not in the least brought on by the volatility of the economic environment.
While companies have focused on emphasizing their core competencies, they are also
planning for the future, in order to remain competitive and successful, and grasp oppor-
tunities for growth if and when they arise. This year’s survey discusses these develop-
ments as well as many others.
At Randstad Hellas, we remain focused on providing the quality talent your teams need to impact your organisation’s bottom line and its future success. In our business, relationships are key, and we extend a sincere ‘thank you’ to everyone who participated in this year’s Survey. We value your contribution and look forward to working with you in 2013.
Sincerely,Leigh OstergardManaging Director
2
Although the content of this publication has been composed with the outmost care, the publisher cannot be held respon-sible for any errors and omissions which may occur. No rights may be derived from this document.
This survey has been conducted by ICMA Group, Waterloo Belgium.
greeceHR and
workplace trends
2013
Dear client,
4 HR and workplace trends 5Greece 2013
In this report you will find:
Key findingsOverview of the main findings.
Company Detailed information on the companies that have participated in the survey.
Participant profile Detailed information on the participants, profile and background.
HR and challenges Current and future challenges that are or will be affecting HR and organiza-tions in the future as well as an outline on how companies deal with skill shortages and the type of benefits they offer to their employees.
Employment and recruitment strategies Perspectives on the sources and processes used to recruit and assess talent; explanations on whether companies are willing to hire temporary or permanent staff and reasons why organizations might fail to attract top talent. Trends and innovation in the workplace Important changes and new ways of working in the workplace and recruit-ment processes.
Economic impact and outlook How does the current economic situation impact the organizations’ initia-tives and future perspectives.
Salaries Job titles vary from company to company, therefore respondents were asked to provide salaries for the standardized titles in the questionnaire that clearly match the functional responsibilities for the position in the company.
contents
structure of the report
1 Structure of the report 5
2 Key findings 6
3 Company 8
4 Participant profile 10
5 HR and challenges 12
6 Employment and recruitment strategies 14
7 Trends and innovation in the workplace 17
8 Economic impact and outlook 20
9 Salaries 22
greece
1HR and
workplace trends
2013
6 HR and workplace trends 7Greece 2013
To manage changes in the workplace, companies mainly prepared their managers (supervisors) by involving people in the change process and creating a “we can do better” vision. Top changes that had been implemented included adding new duties to existing jobs, followed at distance by providing different forms of training and offering more internal career opportunities.With regard to implementing new ways of working, organizations mostly adapted specific technologies that made smarter working practices valuable and resulted in a broader and more embedded collaboration.Only 17% of companies said they were prepared to handle different generations in their working environment. They handled this by implementing different working policies. The most common working policies for the youngest generation (generation Y) were job variation (56%), more international career oppor-tunities (48%) and career development plans (48%). Employees belonging to generation X preferred career development plans (37%), flexible working hours (33%) and more working social events (33%). Top of the list for the more senior generation (baby boomers) were being part of mentoring programs (33%) and re-training programs (29%), flexible working hours (28%) and adapting their job to their physical condition (28%).
V Economic impact and outlookThe consequences for those who had been impacted by the economic downturn predomi-nantly resulted in budget and compensation cuts, but also in employee layoffs and hiring freezes. 49% mentioned that the economic crisis had had a significant impact on their workload. Most layoffs occurred in Sales (31%), followed by Operations (28%) and Accounting/Finance (22%). Looking at recovery, only 8% said they would recover from the economic downfall in 2013. 32% anticipated growth in 2013 and 29% were currently hiring (project) employees. 58% of the companies showed concern with regard to an increase in job turnover. 29% were currently hiring employees and 23% would do so during this year.On a positive note, the economic crisis allowed half of all respondents to negotiate better terms with suppliers and encouraged employees to think differently. It also enabled companies to restructure.
The most important leadership competencies for managers to develop in this year’s survey were as follows: 1. The ability to motivate and inspire others2. The ability to adapt to changing business
demands3. The ability to build trusted relationships.
Additionally, we identified that only 32% of the respondents believed that their managers or employees had the ability to effectively adapt to changes in business demands.To address the issue of shortage of skills, companies would invest in education and training programs followed at a distance by flexible working options and outsourcing business functions.
III Employment and recruitment strategiesDespite the economic downturn, 46% of the companies hired permanent staff in 2012 and 26% hired interim staff. 59% of the organizations said they estimated job turnover to be the highest in employees that had been with the company for longer than 5 years on average. 58% of the organizations believed they did not really have the ability to attract top talent. The main reasons the organizations failed to attract talent were strong competition, the fact that the industry is less appealing than it used to be and uncompetitive salary and benefits. Employee referrals and advertising were the primary sources when recruiting talent. Even though 67% did not use social networking sites for recruitment at all, 30% of the respondents that did use them claimed they were a successful way of recruiting and used them as their main channel for recruiting management or staff. Reference checks and degree verifications were the main standard background checks conducted in a hiring process. Medical insurance was the most common benefit within the organizations, in addition to career development, bonuses and a competitive salary.
IV Trends and innovation in the workplaceProfessional networking sites were used by 24% and social networking sites by 23% as a new trend in recruitment. Less conventional recruitment methods, such as virtual career fairs, speed dating (for recruitment), X-Box and gaming advertising, hosting free lunches or a contest and video résumés were not that common, together accounting for only 6%.
Respondents tended to keep abreast of business trends via traditional resources, such as professional associations, educational seminars and newspapers, but also via more modern media such as professional networking sites.
The popularity of social networking sites such as LinkedIn, Facebook and other web-based sources was seen to be on the increase, with 80% having a LinkedIn account and 53% being a member of the Facebook community. Respondents used these social networking sites mostly to network and to a lesser degree to connect with family and friends.
The networking methods most commonly used were attendance at conferences and conventions and professional networking sites.
II HR and challengesThe key productivity challenge for 2013 within the surveyed companies was to develop leadership skills for the next growth phase (57%). The second biggest challenge (31%) is government legislation impacting workforce flexibility. 1 in 5 see a lack of specialists to drive innovation as a major challenge.
The top 3 challenges identified within HR remain the same as for the previous year: 1. Increasing productivity and performance 2. Retaining top performers 3. Developing talented leaders
I GeneralThis salary, benefits and workplace trends report presents the results of a series of in-depth interviews conducted among 289 key decision-makers at companies in Greece. Fieldwork took place between October and December 2012.The Service sector (i.e. telecommunications, B2B services, food services and entertainment/ hospitality) constituted the largest group in our sample, followed by organizations in FMCG. 57% of the companies interviewed had a workforce of up to 100 employees, 36% operated with a workforce of 100-1,000 people and 7% employed over 1,000 people.
95% of the organizations surveyed in Greece generated a turnover of < 500 million euro. Overall (globally) 43% of 274 companies were companies with turnover of > 500 million euro, which indicates that they are part of a multinational organization or associated with one.
When looking at the participants’ profiles in more detail, we see that the largest group is ‘Managers’ followed by ‘Directors’, mostly working within HR. Most of them found their current position by means of professional contacts and referrals, followed at a distance by internal promotions and executive search firms.
key findings greece
2HR and
workplace trends
2013
8 HR and workplace trends 9Greece 2013
Figure 3.2 Size of company in GreeceTotal 280 295
Figure 3.4 Number of employees in the companyTotal 289 307
Figure 3.3 Size of company overallTotal 274 307
This section shows an overview of the companies that participated in the survey, providing information about the company’s size, industry, and the number of employees within the organization and per department.
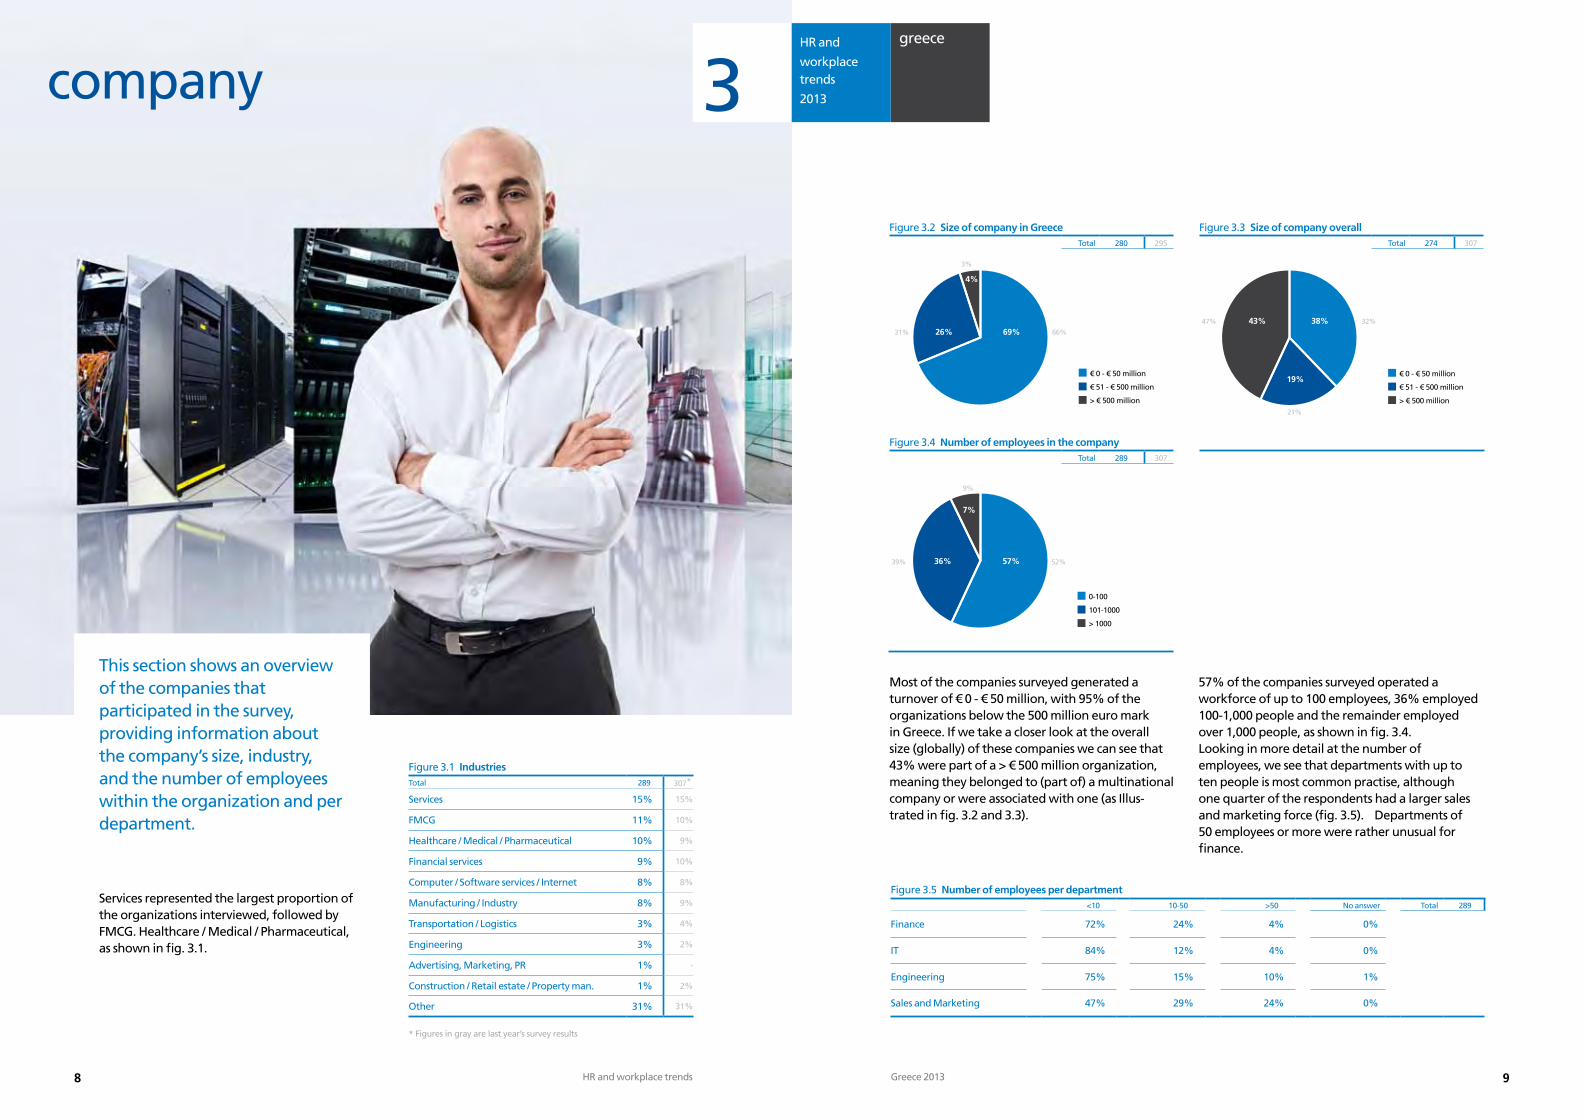
Services represented the largest proportion of the organizations interviewed, followed by FMCG. Healthcare / Medical / Pharmaceutical, as shown in fig. 3.1.
company
> € 500 million
€ 51 - € 500 million
€ 0 - € 50 million
69%
4%
26% 66%31%
3%
> 1000
101-1000
0-100
57%
7%
36% 52%
9%
39%
> € 500 million
€ 51 - € 500 million
€ 0 - € 50 million
32%38%43%
19%
21%
47%
Figure 3.1 IndustriesTotal 289 307*
Services 15% 15%
FMCG 11% 10%
Healthcare / Medical / Pharmaceutical 10% 9%
Financial services 9% 10%
Computer / Software services / Internet 8% 8%
Manufacturing / Industry 8% 9%
Transportation / Logistics 3% 4%
Engineering 3% 2%
Advertising, Marketing, PR 1% -
Construction / Retail estate / Property man. 1% 2%
Other 31% 31%
greece
3
Most of the companies surveyed generated a turnover of € 0 - € 50 million, with 95% of the organizations below the 500 million euro mark in Greece. If we take a closer look at the overall size (globally) of these companies we can see that 43% were part of a > € 500 million organization, meaning they belonged to (part of) a multinational company or were associated with one (as Illus-trated in fig. 3.2 and 3.3).
57% of the companies surveyed operated a workforce of up to 100 employees, 36% employed 100-1,000 people and the remainder employed over 1,000 people, as shown in fig. 3.4.Looking in more detail at the number of employees, we see that departments with up to ten people is most common practise, although one quarter of the respondents had a larger sales and marketing force (fig. 3.5). Departments of 50 employees or more were rather unusual for finance.
* Figures in gray are last year’s survey results
Figure 3.5 Number of employees per department <10 10-50 >50 No answer Total 289
Finance 72% 24% 4% 0%
IT 84% 12% 4% 0%
Engineering 75% 15% 10% 1%
Sales and Marketing 47% 29% 24% 0%
HR and
workplace trends
2013
10 HR and workplace trends 11Greece 2013
Figure 4.3 How did you find your current role?Total 287 304
55% HR 16% Finance13% Sales / Marketing 1% Engineering 0% IT 14% Other
12% CEO / CFO / COO level 2% Vice President level21% Director level 1% Controller level 8% Employee level45% Management level 8% Supervisor level 3% Other
Figure 4.1 Job levelTotal 289
Figure 4.2 DepartmentTotal 289
Finding a job position through professional networking sites or job fairs was not very common.The preferred methods of networking were generally quite traditional, with conferences, conventions and professional networking sites scoring very highly. Social networking sites and to a lesser degree Alumni associations and higher-level professionals were also quite popular, as shown in fig. 4.4.
With regard to keeping up with current business trends (fig. 4.5), we see that networking, profes-sional associations, professional networking sites (LinkedIn) and newspapers were the most frequently used resources (more than 50%).
Reading newspapers was losing popularity in comparison to the last survey.
The survey showed that 80% of respondents were a member of LinkedIn. 53% used Facebook or Twitter. These sites were mainly used for networking, but also for connecting with family and friends and looking for job opportunities. 28% used these sites to recruit.
participant profile
Most participants held the position of ‘Manager’, followed by ‘Director’ (fig. 4.1). As shown in fig. 4.2, most respondents worked in or were responsible for the HR department, with Finance following at a great distance.27% of respondents had 1 to 2 people reporting directly to them; 19% had 5 to 9 people reporting
to them, and 10% had 50 or more employees indirectly reporting to them.
The participants found their current position predominantly by means of professional contacts and referrals (fig. 4.3), followed at a distance by internal promotion and executive search firms.
greece
4
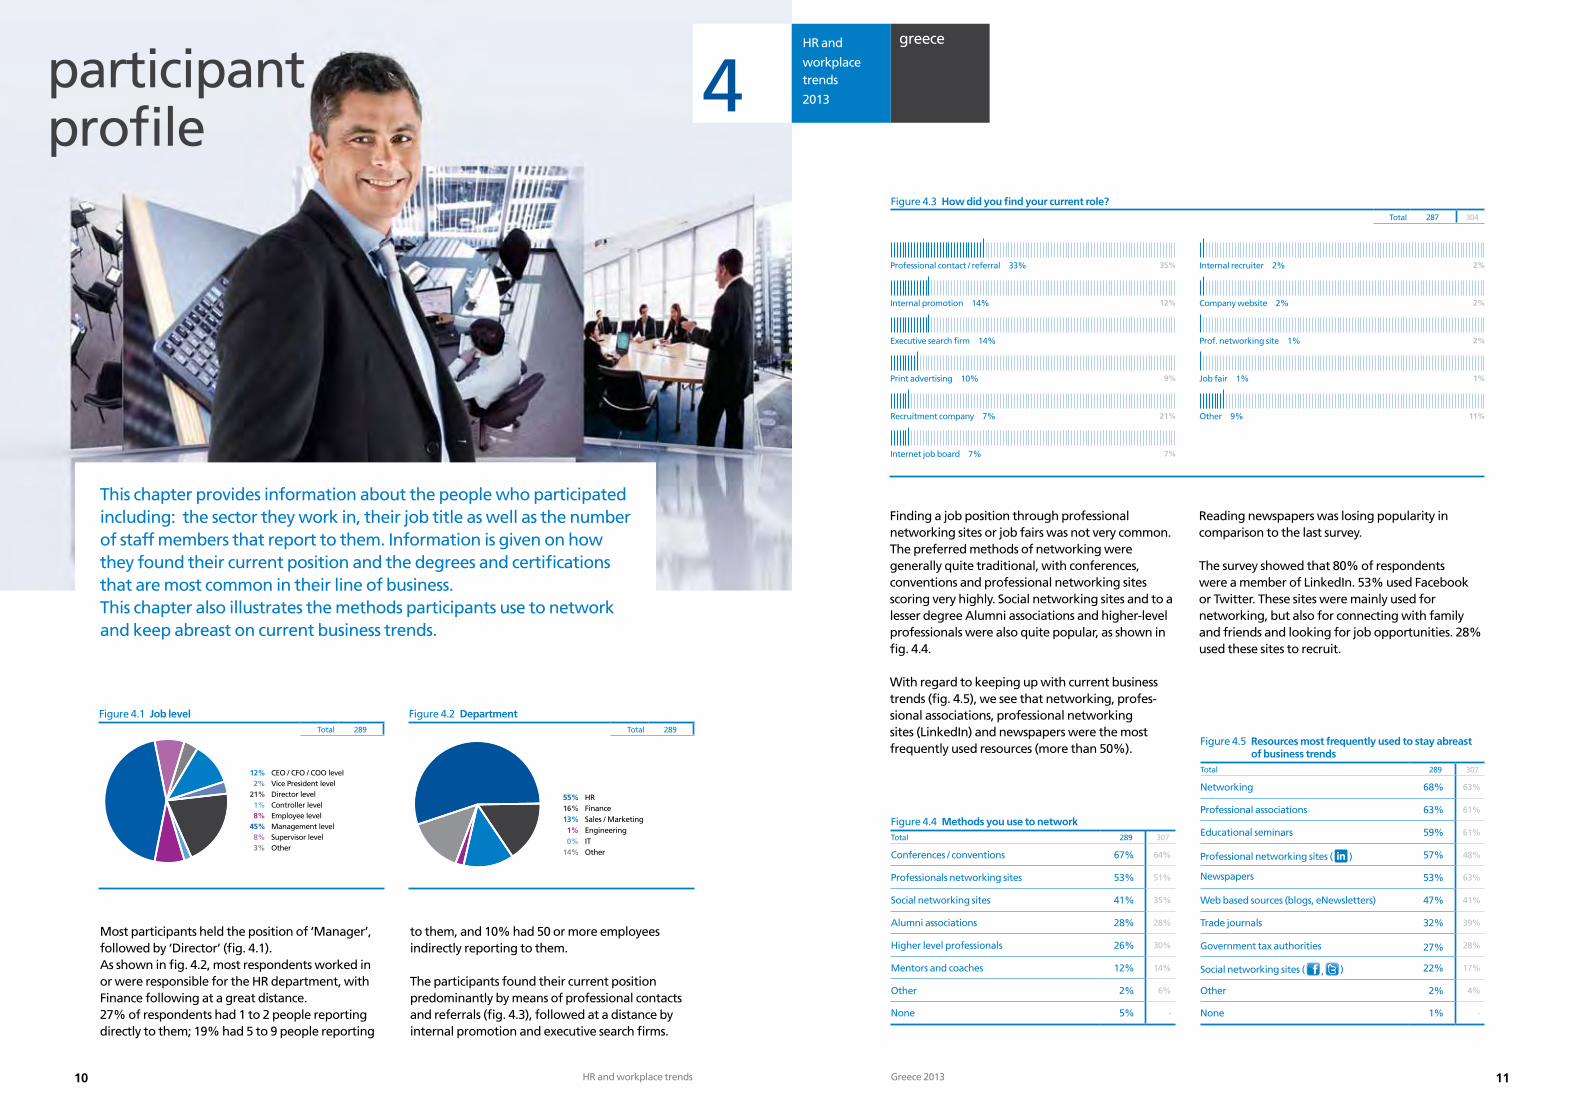
This chapter provides information about the people who participated including: the sector they work in, their job title as well as the number of staff members that report to them. Information is given on how they found their current position and the degrees and certifications that are most common in their line of business. This chapter also illustrates the methods participants use to network and keep abreast on current business trends.
Figure 4.4 Methods you use to networkTotal 289 307
Conferences / conventions 67% 64%
Professionals networking sites 53% 51%
Social networking sites 41% 35%
Alumni associations 28% 28%
Higher level professionals 26% 30%
Mentors and coaches 12% 14%
Other 2% 6%
None 5% -
Figure 4.5 Resources most frequently used to stay abreast of business trends
Total 289 307
Networking 68% 63%
Professional associations 63% 61%
Educational seminars 59% 61%
Professional networking sites ( ) 57% 48%
Newspapers 53% 63%
Web based sources (blogs, eNewsletters) 47% 41%
Trade journals 32% 39%
Government tax authorities 27% 28%
Social networking sites ( , ) 22% 17%
Other 2% 4%
None 1% -
Professional contact / referral 33% 35% Internal recruiter 2% 2%
Internal promotion 14% 12% Company website 2% 2%
Prof. networking site 1% 2%
Job fair 1%
Other 9%
1%
11%
Executive search firm 14%
Print advertising 10% 9%
Recruitment company 7% 21%
Internet job board 7% 7%
HR and
workplace trends
2013
12 HR and workplace trends 13Greece 2013
Looking at fig. 5.3 it seems that the next generation of leaders will be required to have the ability to motivate and inspire others, adapt quickly to changing business demands and build trusted relationships. Analyzing and problem solving skills and having a clear vision for the future are also identified as important competencies.
HR and challenges
When asking organizations about their key produc-tivity challenge, 57% of the respondents indicated that developing leadership skills for the next phase of growth is a major challenge. The second biggest challenge observed was government legislation impacting workforce flexibility (fig. 5.2). Employees using online media during working hours was not really considered to be a danger to productivity.
greece
5
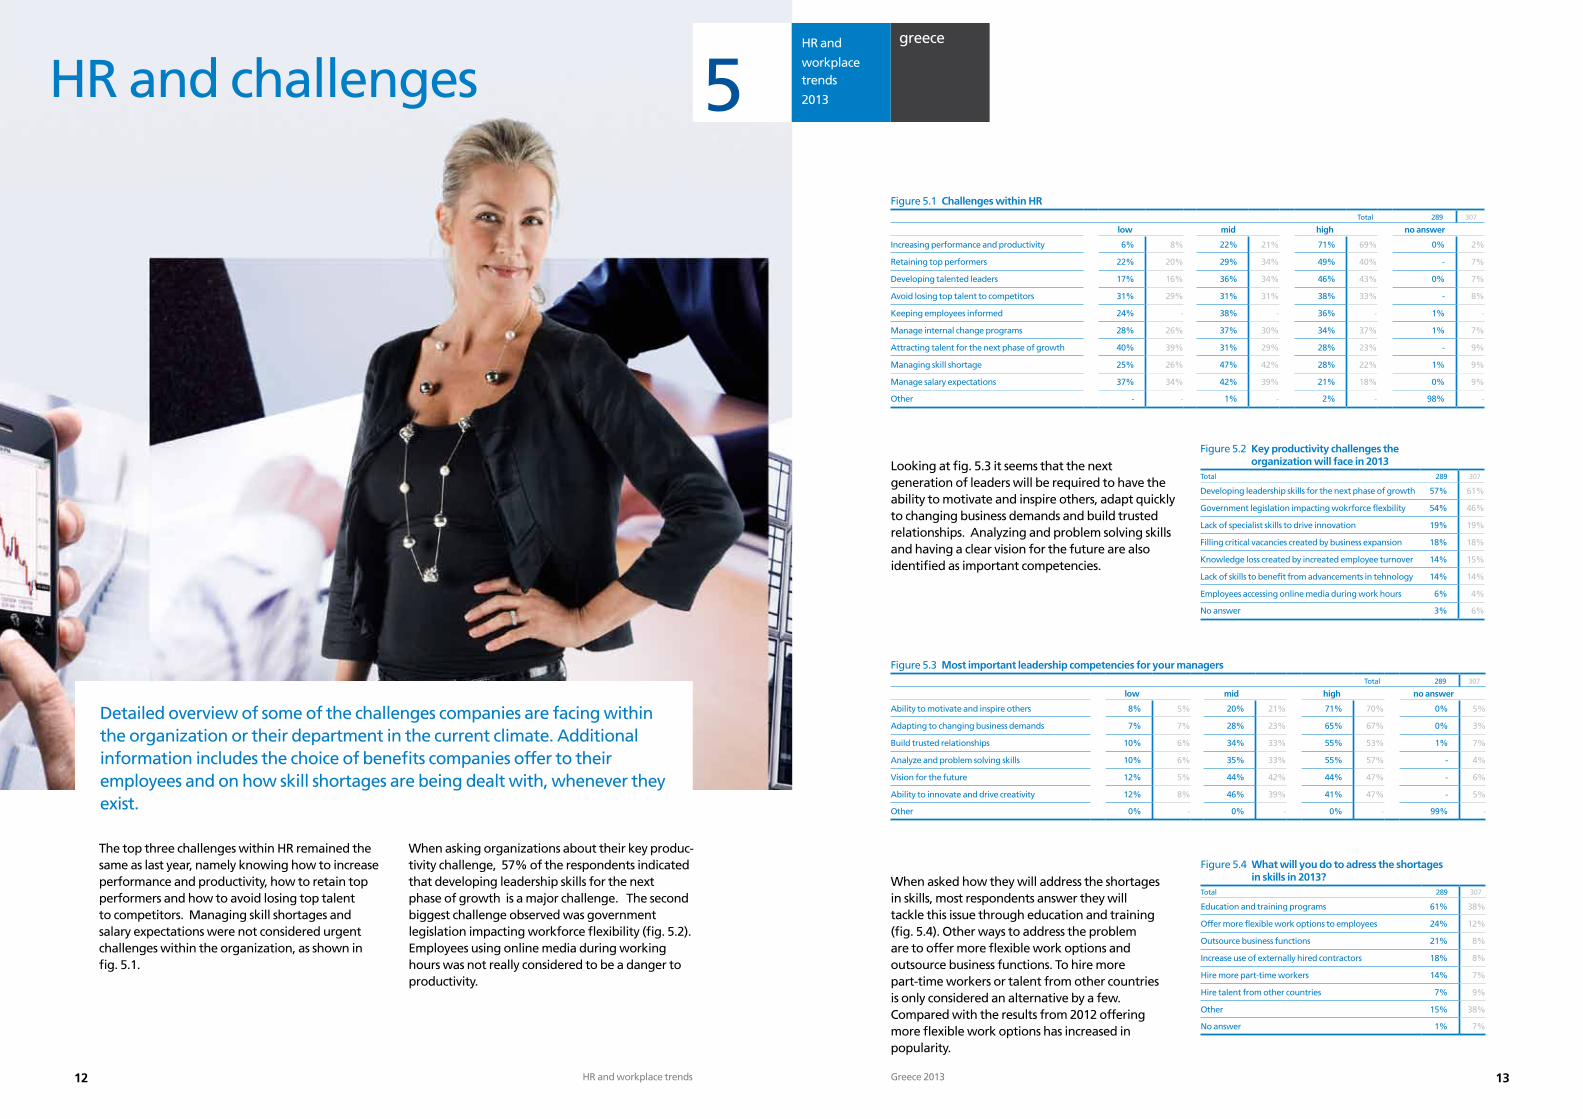
Detailed overview of some of the challenges companies are facing within the organization or their department in the current climate. Additional information includes the choice of benefits companies offer to their employees and on how skill shortages are being dealt with, whenever they exist.
Figure 5.1 Challenges within HRTotal 289 307
low mid high no answer
Increasing performance and productivity 6% 8% 22% 21% 71% 69% 0% 2%
Retaining top performers 22% 20% 29% 34% 49% 40% - 7%
Developing talented leaders 17% 16% 36% 34% 46% 43% 0% 7%
Avoid losing top talent to competitors 31% 29% 31% 31% 38% 33% - 8%
Keeping employees informed 24% - 38% - 36% - 1% -
Manage internal change programs 28% 26% 37% 30% 34% 37% 1% 7%
Attracting talent for the next phase of growth 40% 39% 31% 29% 28% 23% - 9%
Managing skill shortage 25% 26% 47% 42% 28% 22% 1% 9%
Manage salary expectations 37% 34% 42% 39% 21% 18% 0% 9%
Other - - 1% - 2% - 98% -
Figure 5.3 Most important leadership competencies for your managersTotal 289 307
low mid high no answer
Ability to motivate and inspire others 8% 5% 20% 21% 71% 70% 0% 5%
Adapting to changing business demands 7% 7% 28% 23% 65% 67% 0% 3%
Build trusted relationships 10% 6% 34% 33% 55% 53% 1% 7%
Analyze and problem solving skills 10% 6% 35% 33% 55% 57% - 4%
Vision for the future 12% 5% 44% 42% 44% 47% - 6%
Ability to innovate and drive creativity 12% 8% 46% 39% 41% 47% - 5%
Other 0% - 0% - 0% - 99% -
Figure 5.2 Key productivity challenges the organization will face in 2013
Total 289 307
Developing leadership skills for the next phase of growth 57% 61%
Government legislation impacting wokrforce flexbility 54% 46%
Lack of specialist skills to drive innovation 19% 19%
Filling critical vacancies created by business expansion 18% 18%
Knowledge loss created by increated employee turnover 14% 15%
Lack of skills to benefit from advancements in tehnology 14% 14%
Employees accessing online media during work hours 6% 4%
No answer 3% 6%
The top three challenges within HR remained the same as last year, namely knowing how to increase performance and productivity, how to retain top performers and how to avoid losing top talent to competitors. Managing skill shortages and salary expectations were not considered urgent challenges within the organization, as shown in fig. 5.1.
Figure 5.4 What will you do to adress the shortagesin skills in 2013?
Total 289 307
Education and training programs 61% 38%
Offer more flexible work options to employees 24% 12%
Outsource business functions 21% 8%
Increase use of externally hired contractors 18% 8%
Hire more part-time workers 14% 7%
Hire talent from other countries 7% 9%
Other 15% 38%
No answer 1% 7%
When asked how they will address the shortages in skills, most respondents answer they will tackle this issue through education and training (fig. 5.4). Other ways to address the problem are to offer more flexible work options and outsource business functions. To hire more part-time workers or talent from other countries is only considered an alternative by a few. Compared with the results from 2012 offering more flexible work options has increased in popularity.
HR and
workplace trends
2013
14 HR and workplace trends 15Greece 2013
employment and recruitment strategies
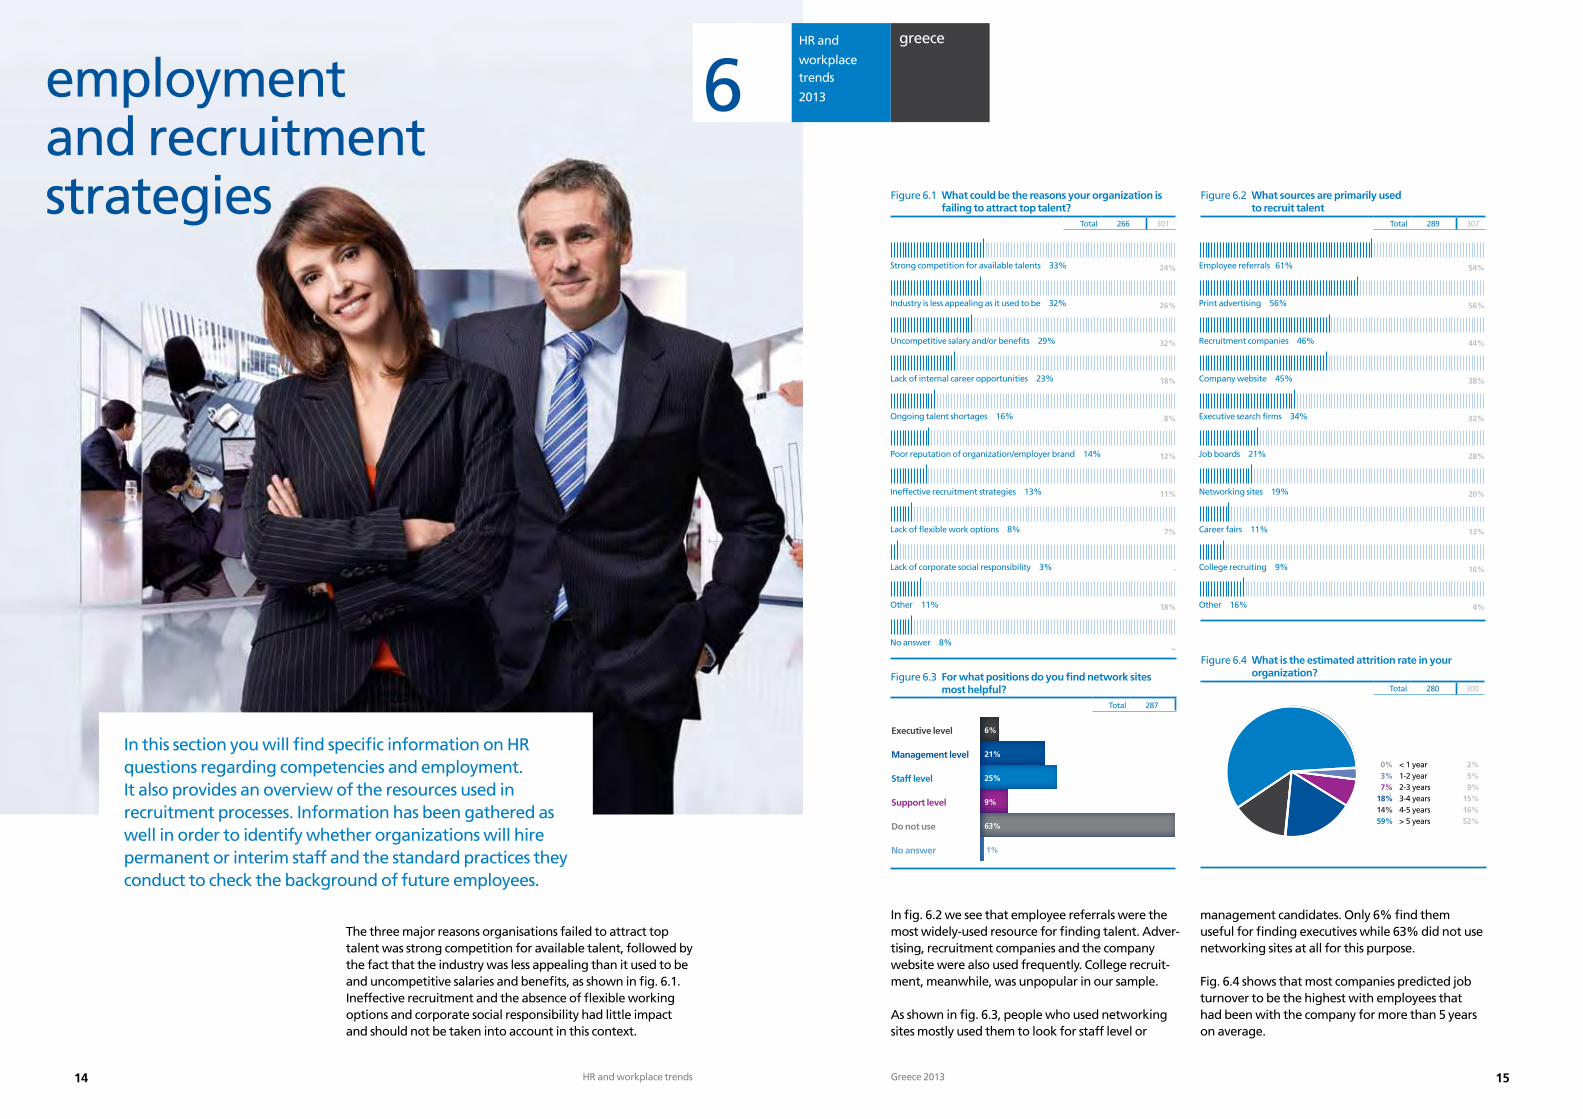
In this section you will find specific information on HR questions regarding competencies and employment. It also provides an overview of the resources used in recruitment processes. Information has been gathered as well in order to identify whether organizations will hire permanent or interim staff and the standard practices they conduct to check the background of future employees.
greece
6Figure 6.1 What could be the reasons your organization is
failing to attract top talent? Total 266 301
Strong competition for available talents 33% Employee referrals 61%
Industry is less appealing as it used to be 32% Print advertising 56%
Uncompetitive salary and/or benefits 29% Recruitment companies 46%
Lack of internal career opportunities 23% Company website 45%
Ongoing talent shortages 16% Executive search firms 34%
Poor reputation of organization/employer brand 14% Job boards 21%
Ineffective recruitment strategies 13% Networking sites 19%
Lack of flexible work options 8% Career fairs 11%
Lack of corporate social responsibility 3% College recruiting 9%
Other 16%Other 11%
No answer 8%
24% 54%
26% 56%
32% 44%
18% 38%
8% 32%
12% 28%
11% 20%
7% 13%
- 16%
4%18%
-
Figure 6.2 What sources are primarily used to recruit talent
Total 289 307
Figure 6.3 For what positions do you find network sites most helpful?
Total 287
6%
21%
25%
9%
63%
1%
0% < 1 year 3% 1-2 year 7% 2-3 years18% 3-4 years14% 4-5 years 59% > 5 years
2%5%9%
15%16%52%
Figure 6.4 What is the estimated attrition rate in your organization?
Total 280 300
Executive level
Management level
Staff level
Support level
Do not use
No answer
In fig. 6.2 we see that employee referrals were the most widely-used resource for finding talent. Adver-tising, recruitment companies and the company website were also used frequently. College recruit-ment, meanwhile, was unpopular in our sample.
As shown in fig. 6.3, people who used networking sites mostly used them to look for staff level or
The three major reasons organisations failed to attract top talent was strong competition for available talent, followed by the fact that the industry was less appealing than it used to be and uncompetitive salaries and benefits, as shown in fig. 6.1. Ineffective recruitment and the absence of flexible working options and corporate social responsibility had little impact and should not be taken into account in this context.
management candidates. Only 6% find them useful for finding executives while 63% did not use networking sites at all for this purpose.
Fig. 6.4 shows that most companies predicted job turnover to be the highest with employees that had been with the company for more than 5 years on average.
HR and
workplace trends
2013
16 HR and workplace trends 17Greece 2013
When we look at trends and innovation in recruit-ment, we can see that professional and social networks scored highest in this category. Still very uncommon were more innovative methods such as virtual career fairs, video résumés etc. No less than 68% of all respondents could not answer this question (fig. 7.1).
When asked about the methods companies used to handle changes in the workplace, 68% said they prepared their managers and supervisors. In second place we see that companies involved people in change processes. Other popular methods included creating a “we can do better” spirit amongst employees and providing clear information early on (fig. 7.2).
trends and innovation inthe workplace
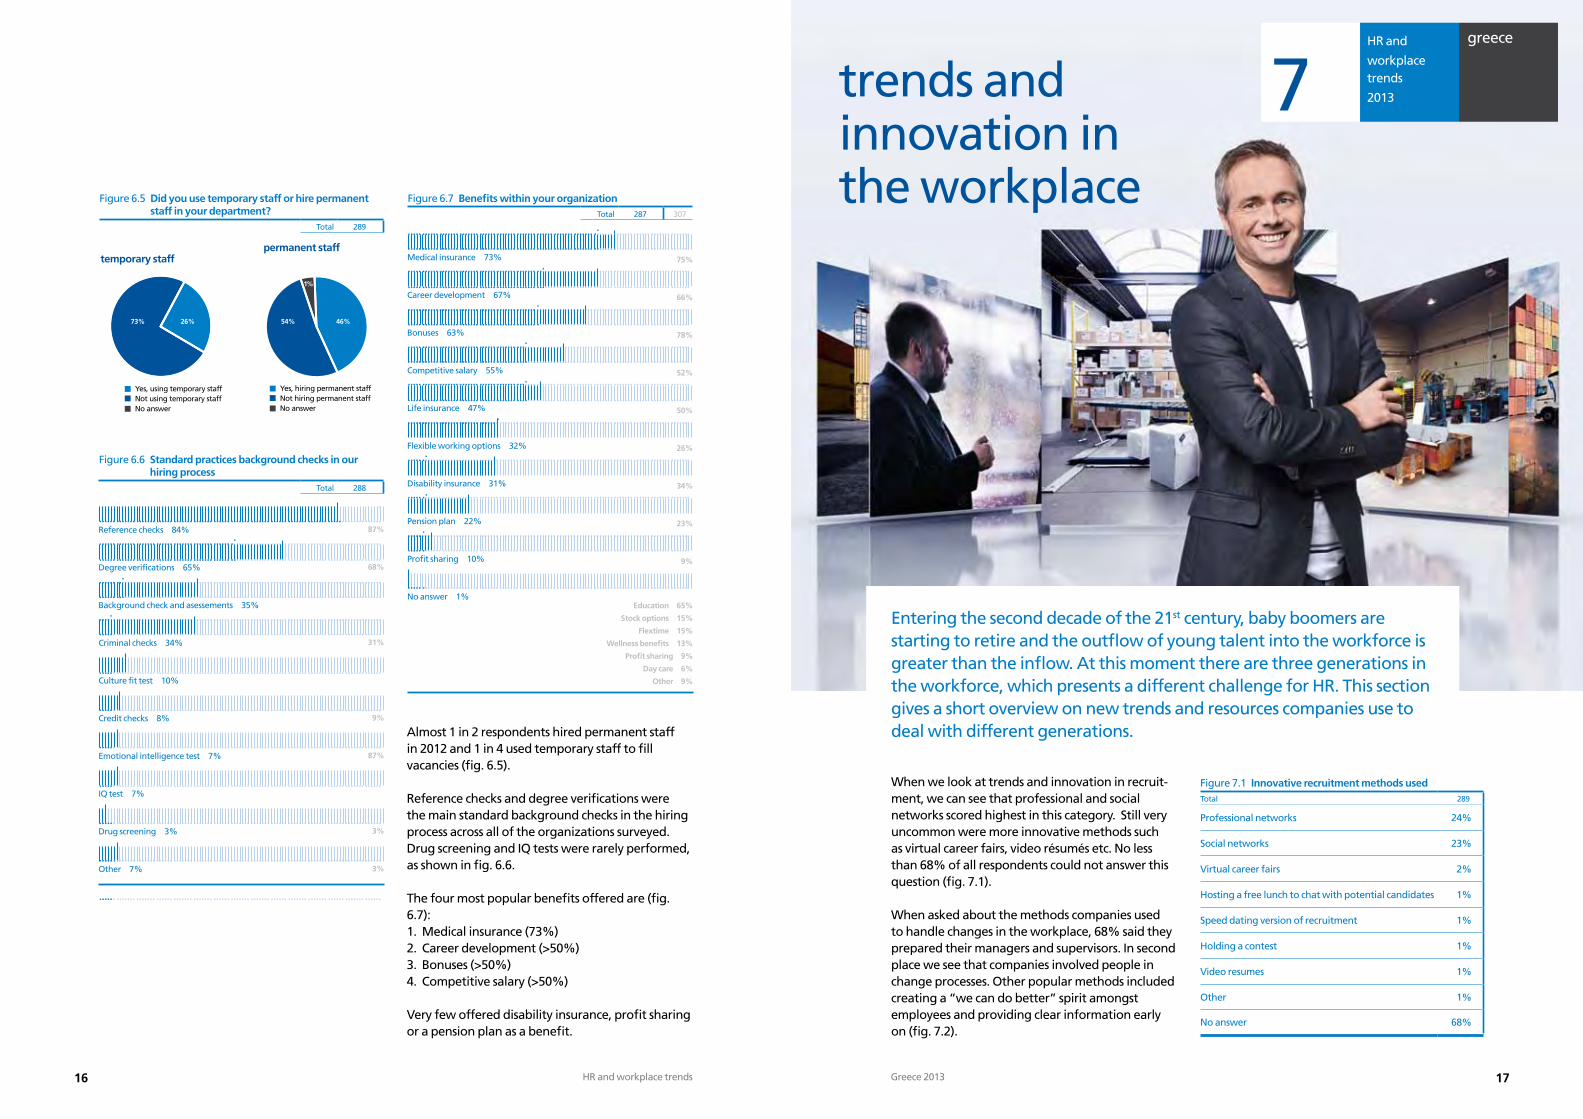
Entering the second decade of the 21st century, baby boomers are starting to retire and the outflow of young talent into the workforce is greater than the inflow. At this moment there are three generations in the workforce, which presents a different challenge for HR. This section gives a short overview on new trends and resources companies use to deal with different generations.
greece
7
No answerNot using temporary staffYes, using temporary staff
54% 46%
1%
No answerNot hiring permanent staffYes, hiring permanent staff
73% 26%
Figure 6.6 Standard practices background checks in our hiring process
Total 288
Reference checks 84%
Degree verifications 65%
Background check and asessements 35%
Criminal checks 34%
Culture fit test 10%
Credit checks 8%
Emotional intelligence test 7%
IQ test 7%
Drug screening 3%
Other 7%
87%
68%
31%
9%
87%
3%
3%
Figure 6.7 Benefits within your organizationTotal 287 307
Medical insurance 73%
Career development 67%
Bonuses 63%
Competitive salary 55%
Life insurance 47%
Flexible working options 32%
Disability insurance 31%
Pension plan 22%
Profit sharing 10%
No answer 1%
75%
66%
78%
52%
50%
26%
34%
23%
9%
Education 65%
Stock options 15%
Flextime 15%
Wellness benefits 13%
Profit sharing 9%
Day care 6%
Other 9%
Figure 6.5 Did you use temporary staff or hire permanent staff in your department?
Total 289
Almost 1 in 2 respondents hired permanent staff in 2012 and 1 in 4 used temporary staff to fill vacancies (fig. 6.5).
Reference checks and degree verifications were the main standard background checks in the hiring process across all of the organizations surveyed. Drug screening and IQ tests were rarely performed, as shown in fig. 6.6.
The four most popular benefits offered are (fig. 6.7):1. Medical insurance (73%)2. Career development (>50%)3. Bonuses (>50%)4. Competitive salary (>50%)
Very few offered disability insurance, profit sharing or a pension plan as a benefit.
Figure 7.1 Innovative recruitment methods usedTotal 289
Professional networks 24%
Social networks 23%
Virtual career fairs 2%
Hosting a free lunch to chat with potential candidates 1%
Speed dating version of recruitment 1%
Holding a contest 1%
Video resumes 1%
Other 1%
No answer 68%
temporary staffpermanent staff
HR and
workplace trends
2013
18 HR and workplace trends 19Greece 2013
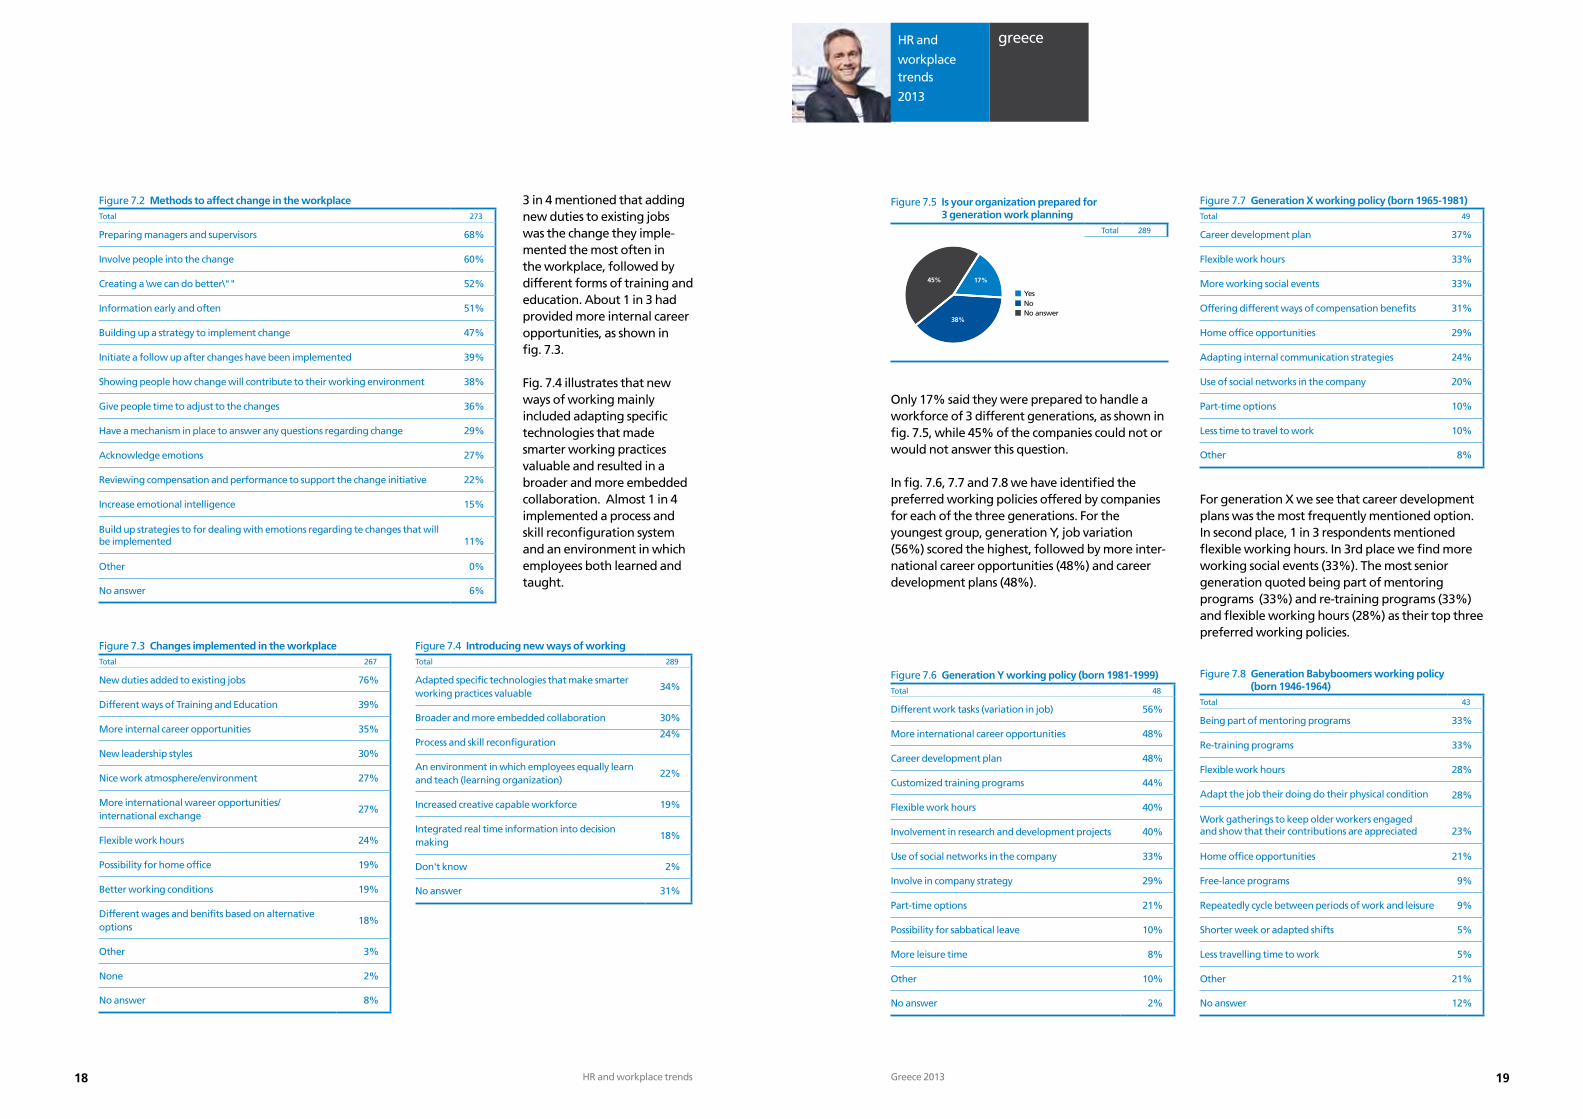
3 in 4 mentioned that adding new duties to existing jobs was the change they imple-mented the most often in the workplace, followed by different forms of training and education. About 1 in 3 had provided more internal career opportunities, as shown in fig. 7.3.
Fig. 7.4 illustrates that new ways of working mainly included adapting specific technologies that made smarter working practices valuable and resulted in a broader and more embedded collaboration. Almost 1 in 4 implemented a process and skill reconfiguration system and an environment in which employees both learned and taught.
Figure 7.2 Methods to affect change in the workplaceTotal 273
Preparing managers and supervisors 68%
Involve people into the change 60%
Creating a \we can do better\"" 52%
Information early and often 51%
Building up a strategy to implement change 47%
Initiate a follow up after changes have been implemented 39%
Showing people how change will contribute to their working environment 38%
Give people time to adjust to the changes 36%
Have a mechanism in place to answer any questions regarding change 29%
Acknowledge emotions 27%
Reviewing compensation and performance to support the change initiative 22%
Increase emotional intelligence 15%
Build up strategies to for dealing with emotions regarding te changes that will be implemented 11%
Other 0%
No answer 6%
Only 17% said they were prepared to handle a workforce of 3 different generations, as shown in fig. 7.5, while 45% of the companies could not or would not answer this question.
In fig. 7.6, 7.7 and 7.8 we have identified the preferred working policies offered by companies for each of the three generations. For the youngest group, generation Y, job variation (56%) scored the highest, followed by more inter-national career opportunities (48%) and career development plans (48%).
Figure 7.3 Changes implemented in the workplaceTotal 267
New duties added to existing jobs 76%
Different ways of Training and Education 39%
More internal career opportunities 35%
New leadership styles 30%
Nice work atmosphere/environment 27%
More international wareer opportunities/ international exchange
27%
Flexible work hours 24%
Possibility for home office 19%
Better working conditions 19%
Different wages and benifits based on alternative options
18%
Other 3%
None 2%
No answer 8%
Figure 7.4 Introducing new ways of workingTotal 289
Adapted specific technologies that make smarter working practices valuable
34%
Broader and more embedded collaboration 30%
Process and skill reconfiguration24%
An environment in which employees equally learn and teach (learning organization)
22%
Increased creative capable workforce 19%
Integrated real time information into decision making
18%
Don't know 2%
No answer 31%
Figure 7.6 Generation Y working policy (born 1981-1999) Total 48
Different work tasks (variation in job) 56%
More international career opportunities 48%
Career development plan 48%
Customized training programs 44%
Flexible work hours 40%
Involvement in research and development projects 40%
Use of social networks in the company 33%
Involve in company strategy 29%
Part-time options 21%
Possibility for sabbatical leave 10%
More leisure time 8%
Other 10%
No answer 2%
Figure 7.7 Generation X working policy (born 1965-1981) Total 49
Career development plan 37%
Flexible work hours 33%
More working social events 33%
Offering different ways of compensation benefits 31%
Home office opportunities 29%
Adapting internal communication strategies 24%
Use of social networks in the company 20%
Part-time options 10%
Less time to travel to work 10%
Other 8%
Figure 7.8 Generation Babyboomers working policy(born 1946-1964)
Total 43
Being part of mentoring programs 33%
Re-training programs 33%
Flexible work hours 28%
Adapt the job their doing do their physical condition 28%
Work gatherings to keep older workers engaged and show that their contributions are appreciated 23%
Home office opportunities 21%
Free-lance programs 9%
Repeatedly cycle between periods of work and leisure 9%
Shorter week or adapted shifts 5%
Less travelling time to work 5%
Other 21%
No answer 12%
Figure 7.5 Is your organization prepared for 3 generation work planning
Total 289
For generation X we see that career development plans was the most frequently mentioned option. In second place, 1 in 3 respondents mentioned flexible working hours. In 3rd place we find more working social events (33%). The most senior generation quoted being part of mentoring programs (33%) and re-training programs (33%) and flexible working hours (28%) as their top three preferred working policies.
greece
No answerNoYes
38%
17%45%
HR and
workplace trends
2013
20 HR and workplace trends 21Greece 2013
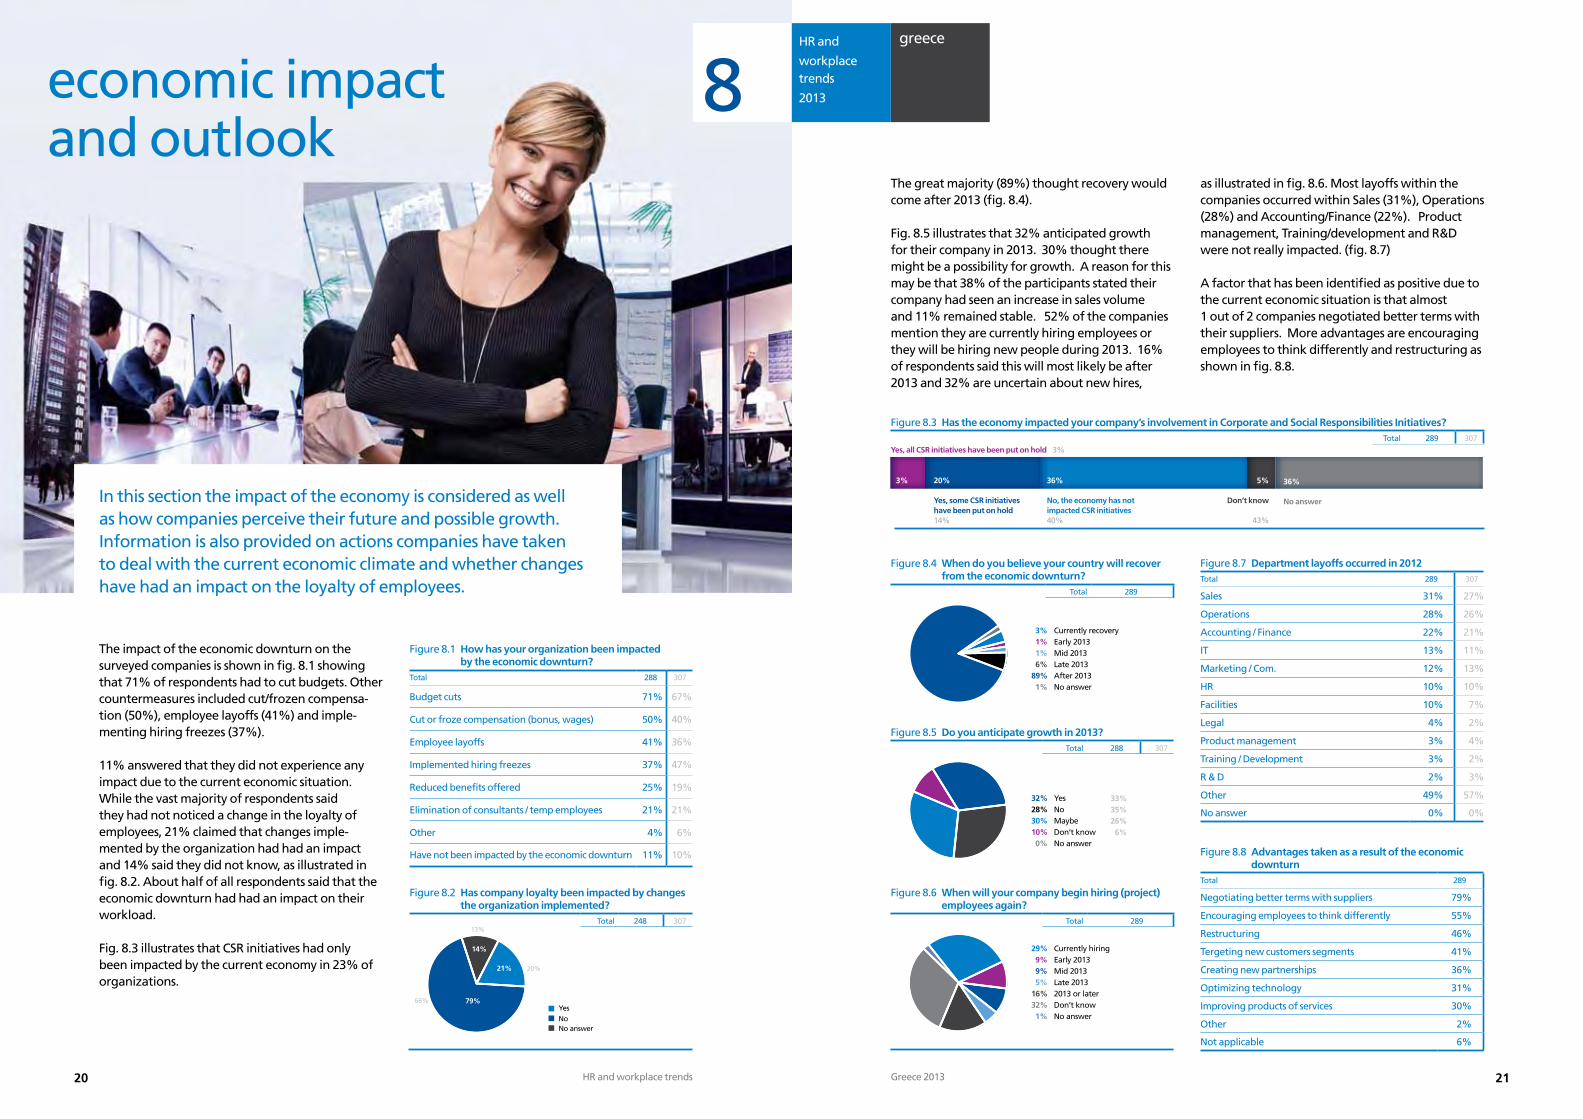
economic impact and outlook
The great majority (89%) thought recovery would come after 2013 (fig. 8.4).
Fig. 8.5 illustrates that 32% anticipated growth for their company in 2013. 30% thought there might be a possibility for growth. A reason for this may be that 38% of the participants stated their company had seen an increase in sales volume and 11% remained stable. 52% of the companies mention they are currently hiring employees or they will be hiring new people during 2013. 16% of respondents said this will most likely be after 2013 and 32% are uncertain about new hires,
greece
8
In this section the impact of the economy is considered as well as how companies perceive their future and possible growth. Information is also provided on actions companies have taken to deal with the current economic climate and whether changes have had an impact on the loyalty of employees.
Figure 8.1 How has your organization been impacted by the economic downturn?
Total 288 307
Budget cuts 71% 67%
Cut or froze compensation (bonus, wages) 50% 40%
Employee layoffs 41% 36%
Implemented hiring freezes 37% 47%
Reduced benefits offered 25% 19%
Elimination of consultants / temp employees 21% 21%
Other 4% 6%
Have not been impacted by the economic downturn 11% 10%
The impact of the economic downturn on the surveyed companies is shown in fig. 8.1 showing that 71% of respondents had to cut budgets. Other countermeasures included cut/frozen compensa-tion (50%), employee layoffs (41%) and imple-menting hiring freezes (37%).
11% answered that they did not experience any impact due to the current economic situation.While the vast majority of respondents said they had not noticed a change in the loyalty of employees, 21% claimed that changes imple-mented by the organization had had an impact and 14% said they did not know, as illustrated in fig. 8.2. About half of all respondents said that the economic downturn had had an impact on their workload.
Fig. 8.3 illustrates that CSR initiatives had only been impacted by the current economy in 23% of organizations.
Figure 8.7 Department layoffs occurred in 2012Total 289 307
Sales 31% 27%
Operations 28% 26%
Accounting / Finance 22% 21%
IT 13% 11%
Marketing / Com. 12% 13%
HR 10% 10%
Facilities 10% 7%
Legal 4% 2%
Product management 3% 4%
Training / Development 3% 2%
R & D 2% 3%
Other 49% 57%
No answer 0% 0%
Figure 8.2 Has company loyalty been impacted by changes the organization implemented?
Total 248 307
Figure 8.4 When do you believe your country will recover from the economic downturn?
Total 289
Figure 8.5 Do you anticipate growth in 2013?Total 288 307
Figure 8.6 When will your company begin hiring (project) employees again?
Total 289
Figure 8.3 Has the economy impacted your company’s involvement in Corporate and Social Responsibilities Initiatives? Total 289 307
Yes, all CSR initiatives have been put on hold 3%
36%
No, the economy has not impacted CSR initiatives40%
5%
Don’t know
43%
36%
No answer
3%
No answerNoYes
79%
21%
14%
20%
13%
66%
3% Currently recovery 1% Early 2013 1% Mid 2013 6% Late 201389% After 2013 1% No answer
32% Yes28% No30% Maybe 10% Don’t know 0% No answer
33%35%26%6%
29% Currently hiring 9% Early 2013 9% Mid 2013 5% Late 201316% 2013 or later 32% Don’t know 1% No answer
20%
Yes, some CSR initiativeshave been put on hold14%
Figure 8.8 Advantages taken as a result of the economic downturn
Total 289
Negotiating better terms with suppliers 79%
Encouraging employees to think differently 55%
Restructuring 46%
Tergeting new customers segments 41%
Creating new partnerships 36%
Optimizing technology 31%
Improving products of services 30%
Other 2%
Not applicable 6%
as illustrated in fig. 8.6. Most layoffs within the companies occurred within Sales (31%), Operations (28%) and Accounting/Finance (22%). Product management, Training/development and R&D were not really impacted. (fig. 8.7)
A factor that has been identified as positive due to the current economic situation is that almost 1 out of 2 companies negotiated better terms with their suppliers. More advantages are encouraging employees to think differently and restructuring as shown in fig. 8.8.
HR and
workplace trends
2013
22 HR and workplace trends 23Greece 2013
salariesgreece
9
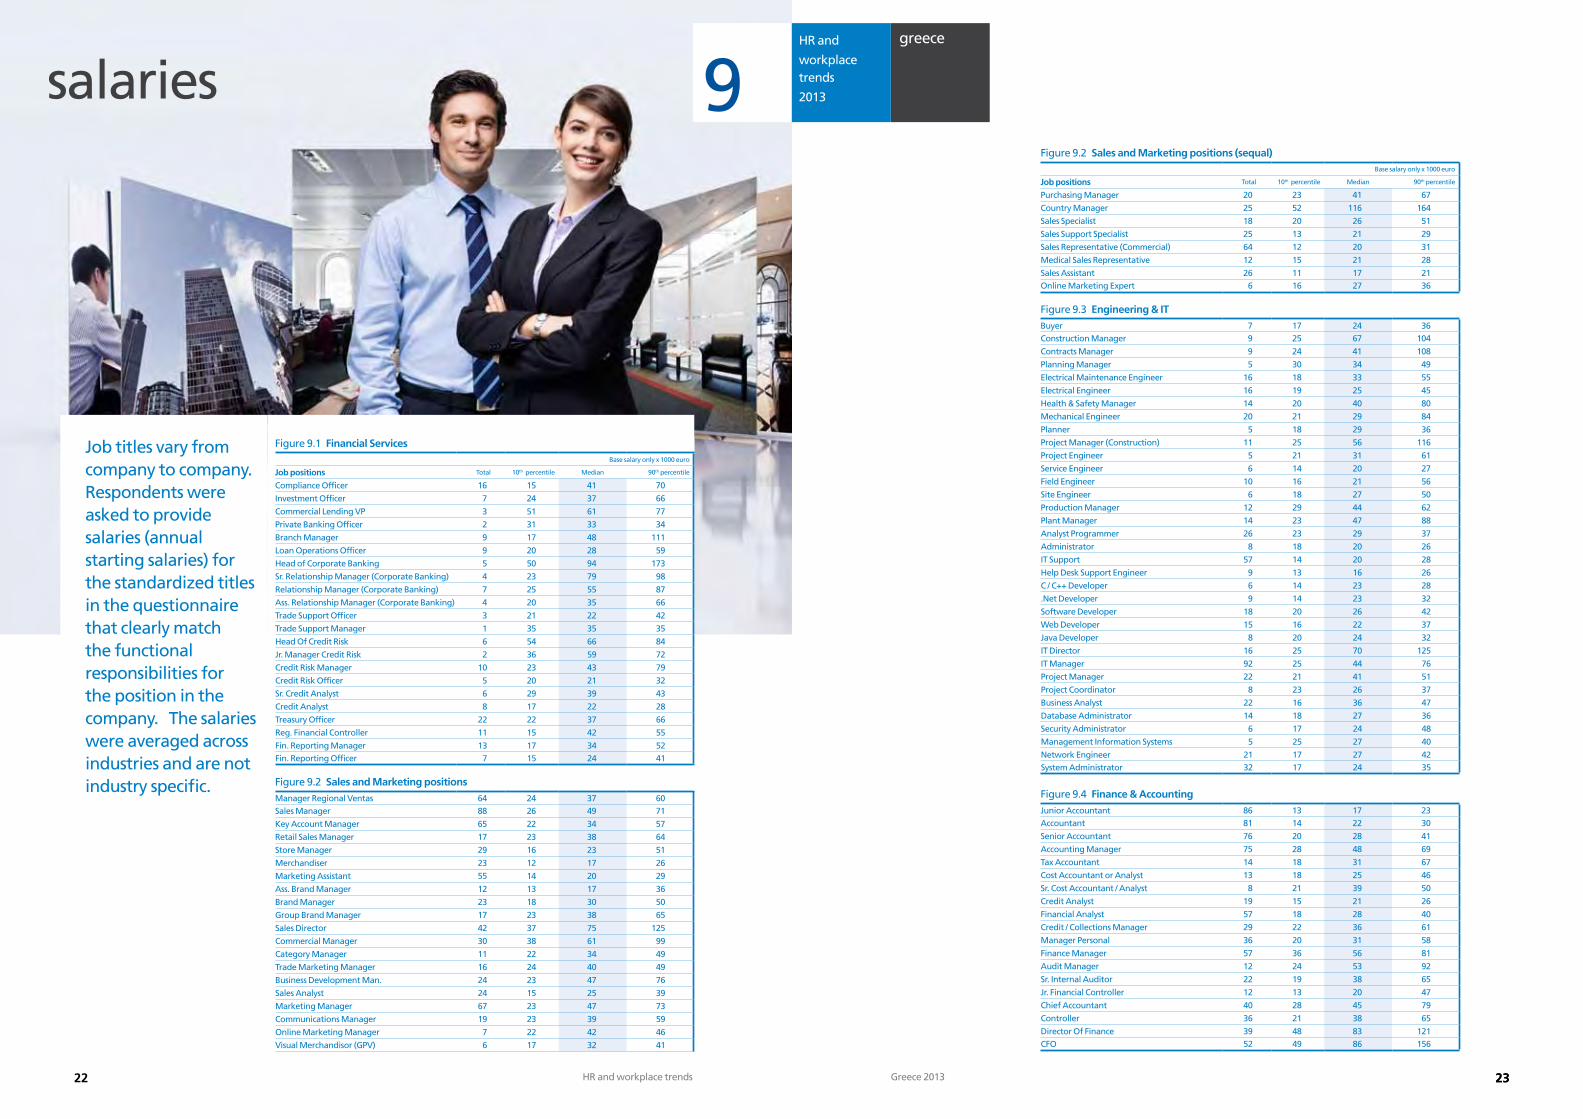
Job titles vary from company to company. Respondents were asked to provide salaries (annual starting salaries) for the standardized titles in the questionnaire that clearly match the functional responsibilities for the position in the company. The salaries were averaged across industries and are not industry specific.
23
Purchasing Manager 20 23 41 67
Country Manager 25 52 116 164
Sales Specialist 18 20 26 51
Sales Support Specialist 25 13 21 29
Sales Representative (Commercial) 64 12 20 31
Medical Sales Representative 12 15 21 28
Sales Assistant 26 11 17 21Online Marketing Expert 6 16 27 36
Figure 9.3 Engineering & ITBuyer 7 17 24 36Construction Manager 9 25 67 104
Contracts Manager 9 24 41 108
Planning Manager 5 30 34 49
Electrical Maintenance Engineer 16 18 33 55
Electrical Engineer 16 19 25 45
Health & Safety Manager 14 20 40 80
Mechanical Engineer 20 21 29 84
Planner 5 18 29 36
Project Manager (Construction) 11 25 56 116
Project Engineer 5 21 31 61
Service Engineer 6 14 20 27
Field Engineer 10 16 21 56
Site Engineer 6 18 27 50
Production Manager 12 29 44 62
Plant Manager 14 23 47 88
Analyst Programmer 26 23 29 37
Administrator 8 18 20 26
IT Support 57 14 20 28
Help Desk Support Engineer 9 13 16 26
C / C++ Developer 6 14 23 28
.Net Developer 9 14 23 32
Software Developer 18 20 26 42
Web Developer 15 16 22 37
Java Developer 8 20 24 32
IT Director 16 25 70 125
IT Manager 92 25 44 76
Project Manager 22 21 41 51
Project Coordinator 8 23 26 37
Business Analyst 22 16 36 47
Database Administrator 14 18 27 36
Security Administrator 6 17 24 48
Management Information Systems 5 25 27 40
Network Engineer 21 17 27 42System Administrator 32 17 24 35
Figure 9.4 Finance & AccountingJunior Accountant 86 13 17 23Accountant 81 14 22 30
Senior Accountant 76 20 28 41
Accounting Manager 75 28 48 69
Tax Accountant 14 18 31 67
Cost Accountant or Analyst 13 18 25 46
Sr. Cost Accountant / Analyst 8 21 39 50
Credit Analyst 19 15 21 26
Financial Analyst 57 18 28 40
Credit / Collections Manager 29 22 36 61
Manager Personal 36 20 31 58
Finance Manager 57 36 56 81
Audit Manager 12 24 53 92
Sr. Internal Auditor 22 19 38 65
Jr. Financial Controller 12 13 20 47
Chief Accountant 40 28 45 79
Controller 36 21 38 65
Director Of Finance 39 48 83 121CFO 52 49 86 156
Figure 9.2 Sales and Marketing positions (sequal)Base salary only x 1000 euro
Job positions Total 10th percentile Median 90th percentile
Figure 9.1 Financial ServicesBase salary only x 1000 euro
Job positions Total 10th percentile Median 90th percentile
Compliance Officer 16 15 41 70
Investment Officer 7 24 37 66
Commercial Lending VP 3 51 61 77
Private Banking Officer 2 31 33 34
Branch Manager 9 17 48 111
Loan Operations Officer 9 20 28 59
Head of Corporate Banking 5 50 94 173
Sr. Relationship Manager (Corporate Banking) 4 23 79 98
Relationship Manager (Corporate Banking) 7 25 55 87
Ass. Relationship Manager (Corporate Banking) 4 20 35 66
Trade Support Officer 3 21 22 42
Trade Support Manager 1 35 35 35
Head Of Credit Risk 6 54 66 84
Jr. Manager Credit Risk 2 36 59 72
Credit Risk Manager 10 23 43 79
Credit Risk Officer 5 20 21 32
Sr. Credit Analyst 6 29 39 43
Credit Analyst 8 17 22 28
Treasury Officer 22 22 37 66
Reg. Financial Controller 11 15 42 55
Fin. Reporting Manager 13 17 34 52Fin. Reporting Officer 7 15 24 41
Figure 9.2 Sales and Marketing positionsManager Regional Ventas 64 24 37 60Sales Manager 88 26 49 71
Key Account Manager 65 22 34 57
Retail Sales Manager 17 23 38 64
Store Manager 29 16 23 51
Merchandiser 23 12 17 26
Marketing Assistant 55 14 20 29
Ass. Brand Manager 12 13 17 36
Brand Manager 23 18 30 50
Group Brand Manager 17 23 38 65
Sales Director 42 37 75 125
Commercial Manager 30 38 61 99
Category Manager 11 22 34 49
Trade Marketing Manager 16 24 40 49
Business Development Man. 24 23 47 76
Sales Analyst 24 15 25 39
Marketing Manager 67 23 47 73
Communications Manager 19 23 39 59
Online Marketing Manager 7 22 42 46
Visual Merchandisor (GPV) 6 17 32 41
HR and
workplace trends
2013

www.randstad.gr