Embed Size (px)
Citation preview

HR Controlling2013
www.pwc.cz/lidskezdroje
Measuring Performance of Human Capital
Final Report


HR Controlling 2013 3
CONTENT
1 INTRODUCTION.....................................................................................................................................................6
1.1 ABOUT THE STUDY........................................................................................................................................6
1.2 HR CONTROLLING ........................................................................................................................................7
1.3 SUMMARY OF THE MOST INTERESTING RESULTS .............................................................................. 11
2 ANALYSES AND STUDY RESULTS .....................................................................................................................13
2.1 CHAPTERS CONTENT..................................................................................................................................13
2.2 PARTICIPANT PROFILE ..............................................................................................................................16
2.3 LIST OF PARTICIPANTS ..............................................................................................................................18
2.4 DATA PRESENTATION ............................................................................................................................... 20
2.5 WORKFORCE STRUCTURE........................................................................................................................ 22
2.5.1 Workforce Structure according to Employee Categories .................................................................. 22
2.5.2 Rookie Ratio......................................................................................................................................... 24
2.5.3 Workforce Diversity: Women ............................................................................................................. 28
2.5.4 Span of Control .................................................................................................................................... 32
2.6 PRODUCTIVITY AND ADDED VALUE ...................................................................................................... 36
2.6.1 Revenue per FTE ..................................................................................................................................37
2.6.2 Costs per FTE........................................................................................................................................41
2.6.3 Profit per FTE .......................................................................................................................................45
2.6.4 Wealth Created per FTE...................................................................................................................... 49
2.6.5 Remuneration Costs to Revenue .........................................................................................................53
2.6.6 Remuneration Costs to Total Costs .....................................................................................................57
2.6.7 Human Capital Return on Investment (HC ROI)...............................................................................61
2.7 COMPENSATION AND BENEFITS ............................................................................................................ 66
2.7.1 Average Compensation.........................................................................................................................67
2.7.2 Average Remuneration.........................................................................................................................72
2.7.3 Average Benefits .................................................................................................................................. 78
2.7.4 Benefit Costs to Compensation Costs ................................................................................................. 84
2.7.5 Variable Compensation ....................................................................................................................... 89
2.7.6 Performance Related Pay .................................................................................................................... 94
2.7.7 Attendance Related Pay....................................................................................................................... 98
2.8 ABSENCE AND TURNOVER ......................................................................................................................102
2.8.1 Absence Rate.......................................................................................................................................103
2.8.2 Sickness Absence Rate........................................................................................................................109
2.8.3 Number of Absence Days per FTE..................................................................................................... 114
2.8.4 Number of Sickness Absence Days per FTE...................................................................................... 114
2.8.5 Termination Rate................................................................................................................................122
2.8.6 Involuntary Termination Rate ........................................................................................................... 127
2.8.7 Resignation Rate.................................................................................................................................132
2.8.8 Lost Time Incident Rate.....................................................................................................................143

HR Controlling 2013 4
2.8.9 Lost Time per Incident ....................................................................................................................... 147
2.9 RESOURCING.............................................................................................................................................. 151
2.9.1 External Recruitment Rate ................................................................................................................152
2.9.2 Cost per Hire ....................................................................................................................................... 157
2.9.3 Time to Accept ....................................................................................................................................162
2.9.4 Internal Appointment Rate................................................................................................................ 167
2.9.5 Internal Promotion Rate .................................................................................................................... 174
2.9.6 Acceptance Rate.................................................................................................................................. 181
2.9.7 Career Path Ratio................................................................................................................................186
2.10 LEARNING AND DEVELOPMENT............................................................................................................190
2.10.1 FTEs per L&D Function FTE ............................................................................................................. 191
2.10.2 L&D Investment per FTE ...................................................................................................................195
2.10.3 Internal L&D Cost per FTE ................................................................................................................199
2.10.4 External L&D Cost per FTE............................................................................................................... 203
2.10.5 L&D Investment to Compensation Costs ......................................................................................... 207
2.10.6 L&D Hours per FTE............................................................................................................................ 211
2.10.7 In-House Hours per FTE....................................................................................................................216
2.10.8 External Hours per FTE .................................................................................................................... 220
2.10.9 Percentage of In-House Hours ......................................................................................................... 224
2.10.10 Learning Events per Head................................................................................................................. 228
2.10.11 Learning Penetration......................................................................................................................... 232
2.10.12 Assignees per International assignment FTE .................................................................................. 236
2.10.13 Average length of assignments ended .............................................................................................. 236
2.11 TALENT MANAGEMENT .......................................................................................................................... 242
2.11.1 Percentage of Key Positions Covered ............................................................................................... 242
2.11.2 Succession Pipeline Depth ................................................................................................................ 246
2.11.3 Talent Resignation Rate .................................................................................................................... 250
2.12 HR FUNCTION ........................................................................................................................................... 253
2.12.1 HR Department Costs to Total Costs................................................................................................ 254
2.12.2 FTEs per HR Department FTE ......................................................................................................... 258
2.12.3 Average HR Remuneration ............................................................................................................... 262
2.12.4 HR Outsource Rate............................................................................................................................ 266
2.12.5 HR Department Costs per FTE......................................................................................................... 270
2.12.6 Form of HR Strategy.......................................................................................................................... 274
2.12.7 Priorities in HR Management........................................................................................................... 274
2.13 SUPPORT FUNCTIONS ..............................................................................................................................275
Indicators..........................................................................................................................................................277
2.14 CORPORATE SOCIAL RESPONSIBILITY................................................................................................ 279
2.14.1 Community Investments per FTE .................................................................................................... 279
2.14.2 Community Hours per 1,000 FTEs .................................................................................................. 283
2.14.3 Community Investments Compared to Profit.................................................................................. 287
3 CLOSING..............................................................................................................................................................291

HR Controlling 2013 5
3.1 ABOUT SARATOGA.....................................................................................................................................291
3.2 USE OF THE REPORT AND DATA ............................................................................................................291
3.3 PROJECT TEAM ......................................................................................................................................... 292
3.4 OTHER HRM SERVICES ........................................................................................................................... 292
HR Controlling 2013 6
1 INTRODUCTION
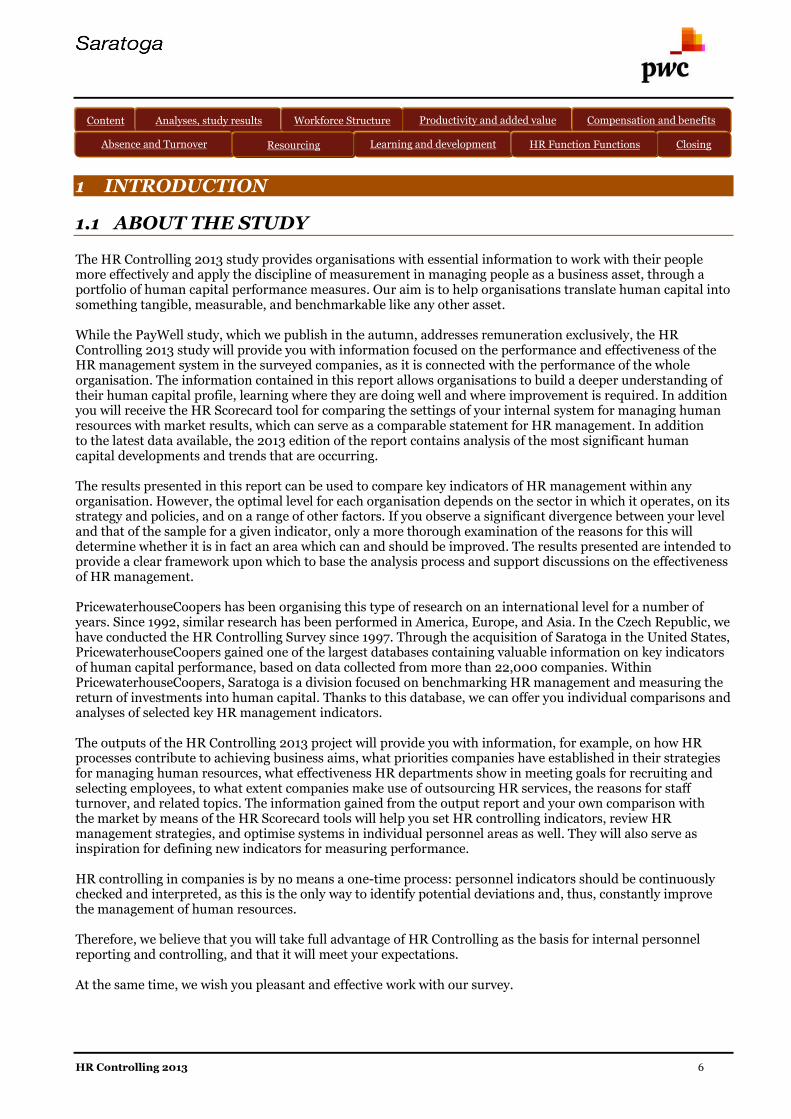
1.1 ABOUT THE STUDY
The HR Controlling 2013 study provides organisations with essential information to work with their peoplemore effectively and apply the discipline of measurement in managing people as a business asset, through aportfolio of human capital performance measures. Our aim is to help organisations translate human capital intosomething tangible, measurable, and benchmarkable like any other asset.
While the PayWell study, which we publish in the autumn, addresses remuneration exclusively, the HRControlling 2013 study will provide you with information focused on the performance and effectiveness of theHR management system in the surveyed companies, as it is connected with the performance of the wholeorganisation. The information contained in this report allows organisations to build a deeper understanding oftheir human capital profile, learning where they are doing well and where improvement is required. In additionyou will receive the HR Scorecard tool for comparing the settings of your internal system for managing humanresources with market results, which can serve as a comparable statement for HR management. In additionto the latest data available, the 2013 edition of the report contains analysis of the most significant humancapital developments and trends that are occurring.
The results presented in this report can be used to compare key indicators of HR management within anyorganisation. However, the optimal level for each organisation depends on the sector in which it operates, on itsstrategy and policies, and on a range of other factors. If you observe a significant divergence between your leveland that of the sample for a given indicator, only a more thorough examination of the reasons for this willdetermine whether it is in fact an area which can and should be improved. The results presented are intended toprovide a clear framework upon which to base the analysis process and support discussions on the effectivenessof HR management.
PricewaterhouseCoopers has been organising this type of research on an international level for a number ofyears. Since 1992, similar research has been performed in America, Europe, and Asia. In the Czech Republic, wehave conducted the HR Controlling Survey since 1997. Through the acquisition of Saratoga in the United States,PricewaterhouseCoopers gained one of the largest databases containing valuable information on key indicatorsof human capital performance, based on data collected from more than 22,000 companies. WithinPricewaterhouseCoopers, Saratoga is a division focused on benchmarking HR management and measuring thereturn of investments into human capital. Thanks to this database, we can offer you individual comparisons andanalyses of selected key HR management indicators.
The outputs of the HR Controlling 2013 project will provide you with information, for example, on how HRprocesses contribute to achieving business aims, what priorities companies have established in their strategiesfor managing human resources, what effectiveness HR departments show in meeting goals for recruiting andselecting employees, to what extent companies make use of outsourcing HR services, the reasons for staffturnover, and related topics. The information gained from the output report and your own comparison withthe market by means of the HR Scorecard tools will help you set HR controlling indicators, review HRmanagement strategies, and optimise systems in individual personnel areas as well. They will also serve asinspiration for defining new indicators for measuring performance.
HR controlling in companies is by no means a one-time process: personnel indicators should be continuouslychecked and interpreted, as this is the only way to identify potential deviations and, thus, constantly improvethe management of human resources.
Therefore, we believe that you will take full advantage of HR Controlling as the basis for internal personnelreporting and controlling, and that it will meet your expectations.
At the same time, we wish you pleasant and effective work with our survey.
Content Analyses, study results Productivity and added value Compensation and benefitsAbsence and Turnover
ClosingAbsence and Turnover
Workforce Structure
Learning and developmentHR Function
HR Function FunctionsResourcing
HR Controlling 2013 7
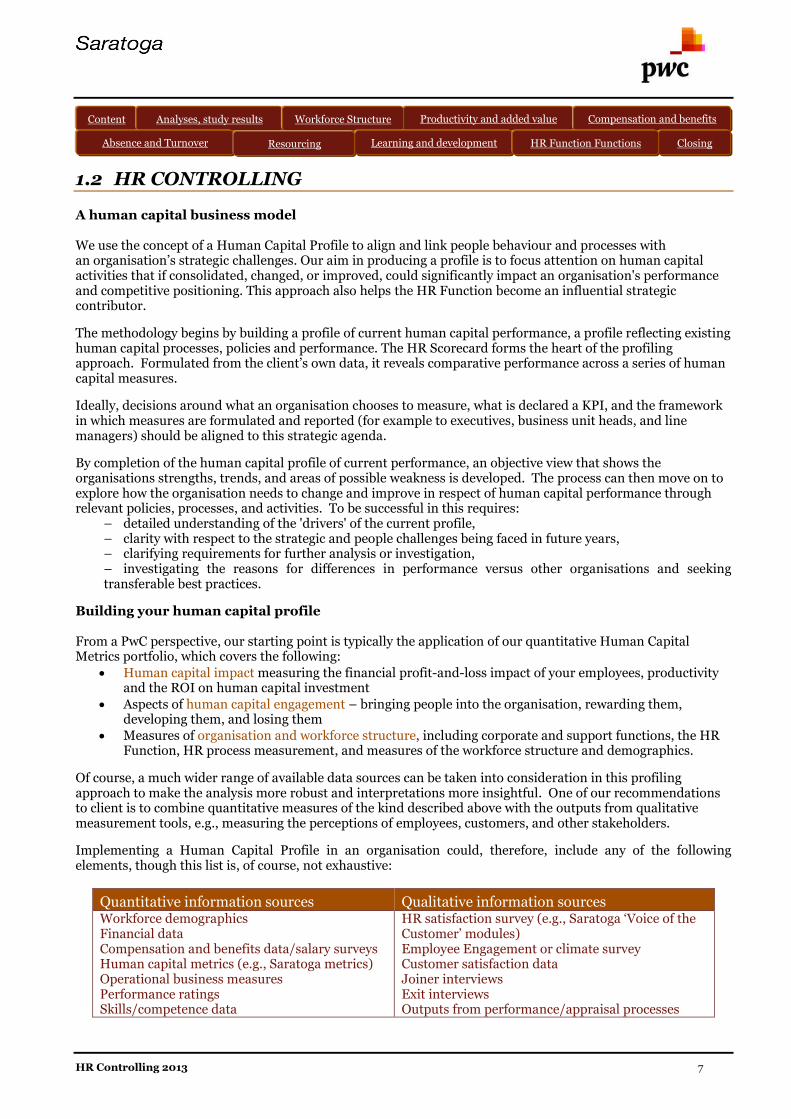
1.2 HR CONTROLLING
A human capital business model
We use the concept of a Human Capital Profile to align and link people behaviour and processes withan organisation’s strategic challenges. Our aim in producing a profile is to focus attention on human capitalactivities that if consolidated, changed, or improved, could significantly impact an organisation's performanceand competitive positioning. This approach also helps the HR Function become an influential strategiccontributor.
The methodology begins by building a profile of current human capital performance, a profile reflecting existinghuman capital processes, policies and performance. The HR Scorecard forms the heart of the profilingapproach. Formulated from the client’s own data, it reveals comparative performance across a series of humancapital measures.
Ideally, decisions around what an organisation chooses to measure, what is declared a KPI, and the frameworkin which measures are formulated and reported (for example to executives, business unit heads, and linemanagers) should be aligned to this strategic agenda.
By completion of the human capital profile of current performance, an objective view that shows theorganisations strengths, trends, and areas of possible weakness is developed. The process can then move on toexplore how the organisation needs to change and improve in respect of human capital performance throughrelevant policies, processes, and activities. To be successful in this requires:
– detailed understanding of the 'drivers' of the current profile,– clarity with respect to the strategic and people challenges being faced in future years,– clarifying requirements for further analysis or investigation,– investigating the reasons for differences in performance versus other organisations and seekingtransferable best practices.
Building your human capital profile
From a PwC perspective, our starting point is typically the application of our quantitative Human CapitalMetrics portfolio, which covers the following:
Human capital impact measuring the financial profit-and-loss impact of your employees, productivityand the ROI on human capital investment
Aspects of human capital engagement – bringing people into the organisation, rewarding them,developing them, and losing them
Measures of organisation and workforce structure, including corporate and support functions, the HRFunction, HR process measurement, and measures of the workforce structure and demographics.
Of course, a much wider range of available data sources can be taken into consideration in this profilingapproach to make the analysis more robust and interpretations more insightful. One of our recommendationsto client is to combine quantitative measures of the kind described above with the outputs from qualitativemeasurement tools, e.g., measuring the perceptions of employees, customers, and other stakeholders.
Implementing a Human Capital Profile in an organisation could, therefore, include any of the followingelements, though this list is, of course, not exhaustive:
Quantitative information sources Qualitative information sourcesWorkforce demographicsFinancial dataCompensation and benefits data/salary surveysHuman capital metrics (e.g., Saratoga metrics)Operational business measuresPerformance ratingsSkills/competence data
HR satisfaction survey (e.g., Saratoga ‘Voice of theCustomer’ modules)Employee Engagement or climate surveyCustomer satisfaction dataJoiner interviewsExit interviewsOutputs from performance/appraisal processes
Content Analyses, study results Productivity and added value Compensation and benefits
ClosingAbsence and Turnover
Workforce Structure
Learning and development HR Function FunctionsResourcing

HR Controlling 2013 8
Key metrics
While we encourage all organisations to derive their own key metrics (and targets), we highlight a series fromthe Saratoga portfolio relevant to most organisations that provide an overview of an organisation’s humancapital performance.
Human Capital Impact key metrics
These are fundamental indicators of the suitability and effectiveness of all human capital activities, whilereflecting the contribution of current HR policies and processes to organisation performance. They fall into twogroups:
Financial Impact Productivity and ROI
Revenue per FTE Remuneration/Revenue
Cost per FTE Remuneration/Total Costs
Profit per FTE Human Capital ROI
Wealth Created per FTE
Human Capital Engagement key metrics
These metrics are used to describe levels of workforce commitment and engagement. We are primarilyinterested in objective measurement of how employees behave, as distinct from perceptions of how they feel.Behaviours of employees measured by these HC Engagement metrics strongly influence HC Impact metricsabove.
Human Capital Engagement
Acceptance Rate L&D Hours per FTE
Average Remuneration Learning Penetration
Performance Related Pay Absence Rate
Attendance Related Pay Resignation Rate
Considering the above described various 'output' or 'impact' aspects of HR policy and human capitalmanagement, it is valuable for organisations to understand a series of ‘input’ measures as contextual toperformance in the above areas.
Organisation and Workforce Structure key metrics
While the above two groups of key metrics describe 'output' or 'impact' aspects of HR policy and human capitalmanagement, Organisation and Workforce Structure metrics help understand a series of ‘input’ measures thatinfluence performance in the measured areas above. Typically, these are measures of resource inputs,processes, support functions, and other structural indicators including measures of workforce structure,including:
Organisation and Workforce Structure
FTEs per Functional FTE Percentage of Managers
Functional Costs per FTE Rookie Ratio
Function Costs/Total Costs Gender Diversity
HR Outsource Rate Workforce Structure by Age/Education

HR Controlling 2013 9
Developing an integrated measurement framework
Identifying the metrics and measures appropriate to your organisation's circumstances is a critical startingpoint for any measurement initiative. While organisations often have a reasonable idea of what they want tomeasure, it nonetheless remains important to consider what is relevant. The identification process should startwith business challenges and corporate strategies, and, on the basis of these strategic challenges, HCmanagement strategy and HR priorities are to be defined. These linkages, illustrated in Figure 1 below, shouldtherefore guide measurement and benchmarking activities, helping to define relevant metrics and measuresand create business buy-in.
Fig 1: Deriving performance indicators from strategic challenges
The process used to drive this design process can take many forms, from a simple desktop review of strategydocuments, to a consultative process with key stakeholders such as senior management teams, finance,corporate development, or strategy units. To assist with the clarification of issues from a business and humancapital perspective, we put forward the following questions for review and discussion:
QUESTIONS TO ASSIST THE CLARIFICATION OF KEY BUSINESS ISSUES
What are the top three business challenges facing your organisation over the next two years?
Have the business challenges changed over the last year?
Has your organisation structure changed significantly over the last year?
What is the most important change that has occurred in the organisation in the last year?
What significant structural or other changes, if any, do you anticipate in the next year?
Who are your top three competitors?
What is your number one customer/client proposition?
What has been the most significant change in human capital policy or behaviours in the last year?
What single change in human capital policy or employee behaviour would significantly improve thecustomer relationship?
What single change in human capital policy or employee behaviour would significantly hurt thecustomer relationship?
The next stage is to populate a series of metrics and measures linked to the agreed business and humancapital/HR agenda. Better alignment of the metrics utilised to current business, people or HR challengesimproves the relevance of the whole process and increases the value to be gained from your measurement andbenchmarking activity. Below is a very simple example of linking metrics selection to an organisation's strategicissues.
Strategic ChallengeRelated Human Capital or HRIssue
Potential Saratoga metrics
Knowledge &
Capability
Performance management
Learning and development
Productivity and ROI
Compensation andbenefits
Turnover
Learning and development
HR Processes
Talent Management
Cost Efficiency
HR Function efficiency
Corporate functions
Operational/productionefficiency
Financial Impact
Productivity and ROI
HR Processes
Corporate and supportfunction metrics
StrategicChallenges
Human Capital &HR Challenges
Key PerformanceIndicators

HR Controlling 2013 10
The next stage is to consider the design of your framework at a more granular level: for example, which are yourtrue key metrics or KPIs; which are supporting metrics or contextual measures; and which are relevant todifferent audiences for your measurement outputs, be they management information (MI) packs, scorecards, orweb-tools. One approach is to stratify the information according to the level of management control andintervention. Such design stage should also allow you to define the most relevant formats and frequency ofoutputs from your framework. Figure 2 illustrates such a tiered approach.
Fig 2: A tiered approach to measurement and reporting
Strategic measures: Primary measures expected to improve with any strategic initiative or policy change;these reflect broad corporate/organisational strategy. Are you trying to grow revenues or market share,are you in a cost reduction phase, or focussing on shareholder value? Measures at this level typicallyinclude financial KPIs, shareholder return often combined with critical customer, and production or salesmeasures by business, product, or region.
Management measures: Measures that will show movement after policy implementation and allow moreregular monthly or quarterly monitoring. These are more often reported at business-unit level and forma core part of business unit balanced scorecards.
Operational measures: Specifically designed to drive and track performance improvement at a functionalor process level. They would include KPIs for line managers, function heads and even employee groups.For HR, we would often see a portfolio of process, activity, and efficiency measures, including rewardfocus, learning and development activity, skills profiles, resource planning and activity, performancemanagement, and succession/talent management together with administrative and activity measures forHR contact centres and shared services.
STRATEGIC MEASURES (CORE KPIs)
MANAGEMENT MEASURES
OPERATIONAL MEASURES
Revenue per FTE Cost per FTE Profit per FTE Human Capital ROI
HeadcountApplied
Comp & BenStructures
L & D Programs RecruitmentFocus
PerformanceMgnt Process
Remuneration/Revenue
Remuneration/Costs
L&D Investmentper FTE
Absence rate Resignation Rate Cost per Hire
AverageRemuneration
Benefits/Compensation
HR Controlling 2013 13
2 ANALYSES AND STUDY RESULTS
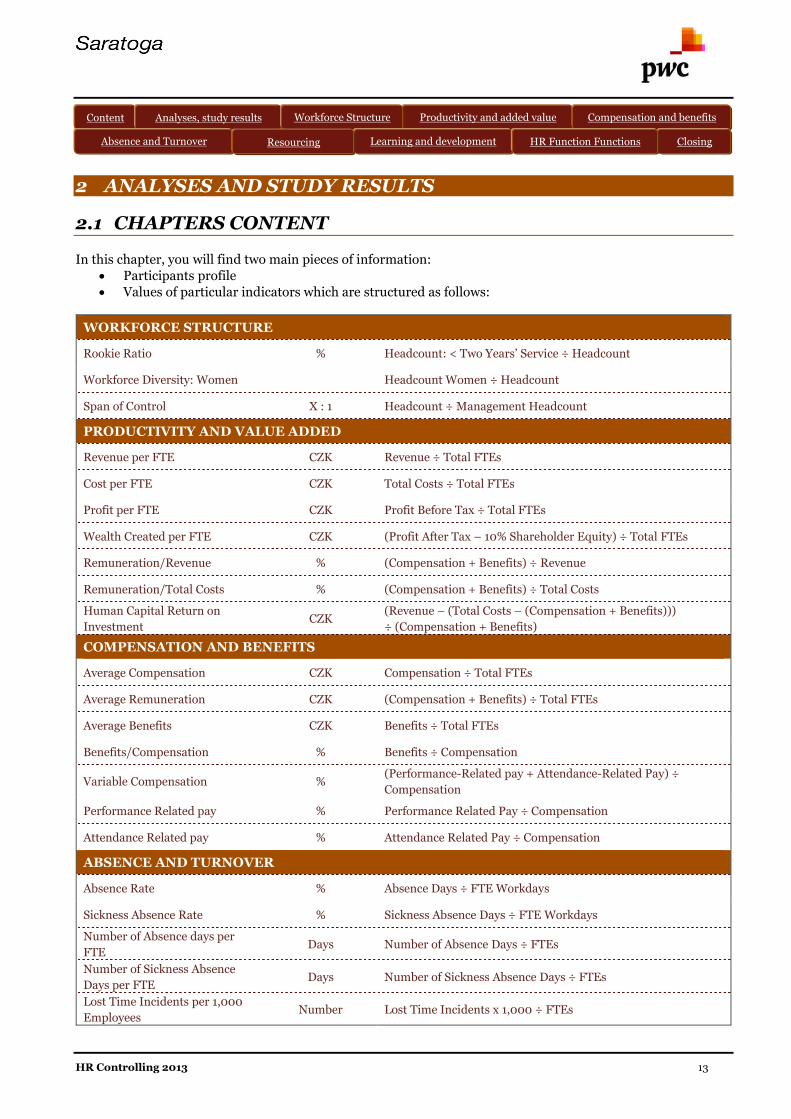
2.1 CHAPTERS CONTENT
In this chapter, you will find two main pieces of information: Participants profile Values of particular indicators which are structured as follows:
WORKFORCE STRUCTURE
Rookie Ratio % Headcount: < Two Years’ Service ÷ Headcount
Workforce Diversity: Women Headcount Women ÷ Headcount
Span of Control X : 1 Headcount ÷ Management Headcount
PRODUCTIVITY AND VALUE ADDED
Revenue per FTE CZK Revenue ÷ Total FTEs
Cost per FTE CZK Total Costs ÷ Total FTEs
Profit per FTE CZK Profit Before Tax ÷ Total FTEs
Wealth Created per FTE CZK (Profit After Tax – 10% Shareholder Equity) ÷ Total FTEs
Remuneration/Revenue % (Compensation + Benefits) ÷ Revenue
Remuneration/Total Costs % (Compensation + Benefits) ÷ Total Costs
Human Capital Return on
InvestmentCZK
(Revenue – (Total Costs – (Compensation + Benefits)))
÷ (Compensation + Benefits)
COMPENSATION AND BENEFITS
Average Compensation CZK Compensation ÷ Total FTEs
Average Remuneration CZK (Compensation + Benefits) ÷ Total FTEs
Average Benefits CZK Benefits ÷ Total FTEs
Benefits/Compensation % Benefits ÷ Compensation
Variable Compensation %(Performance-Related pay + Attendance-Related Pay) ÷
Compensation
Performance Related pay % Performance Related Pay ÷ Compensation
Attendance Related pay % Attendance Related Pay ÷ Compensation
ABSENCE AND TURNOVER
Absence Rate % Absence Days ÷ FTE Workdays
Sickness Absence Rate % Sickness Absence Days ÷ FTE Workdays
Number of Absence days per
FTEDays Number of Absence Days ÷ FTEs
Number of Sickness Absence
Days per FTEDays Number of Sickness Absence Days ÷ FTEs
Lost Time Incidents per 1,000
EmployeesNumber Lost Time Incidents x 1,000 ÷ FTEs
Content Analyses, study results Productivity and added value Compensation and benefitsAbsence and Turnover
ClosingAbsence and Turnover
Workforce Structure
Learning and developmentHR Function
HR Function FunctionsResourcing

HR Controlling 2013 14
Lost Time per Incident Days Working Days Lost ÷ Lost Time Incidents
Termination Rate % Terminations ÷ Headcount
Involuntary Termination Rate % Involuntary Terminations ÷ Headcount
Resignation Rate % Resignations ÷ Headcount
Resignation Rate by Tenure%
Resignations within each Tenure range ÷ Total Resignations
Less than One Year of Service
1 3 years of service
3 5 years of service
5 10 years of service
10+ years of service
RESOURCING
External Recruitment Rate % External Recruits ÷ Headcount
Cost per Hire CZK External Recruitment Costs ÷ External Recruits
Time to Accept Days Days to Accept
Internal Appointment Rate
(Managers/Specialists)% Internal Appointments ÷ Headcount (Managers/Specialists)
Internal Promotion Rate
(Managers/Specialists)% Internal Promotions ÷ Headcount (Managers/Specialists)
Acceptance Rate % Job Offers Accepted ÷ Job Offers Made
Career Path Ratio % Internal Promotions ÷ Internal Appointments
LEARNING AND DEVELOPMENT
FTEs per L&D Function FTE X : 1 FTEs ÷ L&D Function FTE
L&D Investment per FTE - Total CZK L&D Investment ÷ FTEs
External Cost per FTE CZK External Costs ÷ FTEs
In-house Cost per FTE CZK In-house Cost ÷ FTEs
L&D Investment/Compensation % L&D Investment ÷ Compensation
L&D Hours per FTE Hours L&D Hours ÷ FTEs
In-House Hours per FTE Hours In-house L&D Hours ÷ FTEs
External Hours per FTE Hours External L&D Hours ÷ FTEs
Percentage of In-house % In-House L&D Hours ÷ Total L&D Hours
Learning Events per Head Number Attendees Trained ÷ Headcount
Learning Penetration % Employees Receiving ≥ 1 Training Day ÷ Headcount
Average length of assignments
endedMonths Average length of international assignments ended
Workforce with internationalassignment experience
%Employees with international assignment experience ÷
Headcount

HR Controlling 2013 15
TALENT MANAGEMENT
% Key Positions Covered % Key Positions Covered ÷ Key Positions Identified
Succession Pipeline Depth % Successors ÷ Key Positions Identified
Talent Resignation Rate % Talent Resignations ÷ Talent Group Headcount
HR FUNCTION
HR Department Costs/Total
Costs% HR Department Costs ÷ Total Costs
FTEs per HR Department FTE X : 1 FTEs ÷ HR Department FTEs
HR Department Costs per FTE CZK HR Department Costs ÷ FTEs
Average HR Remuneration CZK HR Remuneration ÷ HR FTEs
HR Outsource Rate % HR Outsource Costs ÷ HR Costs
CORPORATE AND SUPPORT FUNCTIONS
Metrics are available for each of the following HR processes:
Finance Procurement
Sales Payroll
Marketing Occupational Health and Safety
Customer Service Logistics
IT Production
R&D
FTEs per Function FTE X : 1 FTEs ÷ Function FTEs
% Function Managers and
Professionals% Management and Professional Function FTEs ÷ Function FTEs
Function Costs/Total Costs % Function Costs ÷ Total Costs
CORPORATE RESPONSIBILITY
Community Investments per
FTECZK Community Investments ÷ FTE
Community Hours per 1,000
FTEnumber Community Working Hours Spent x 1,000 ÷ FTE
Community Investments/Profit CZK Community Investments ÷ Profit Before Tax
HR Controlling 2013 18
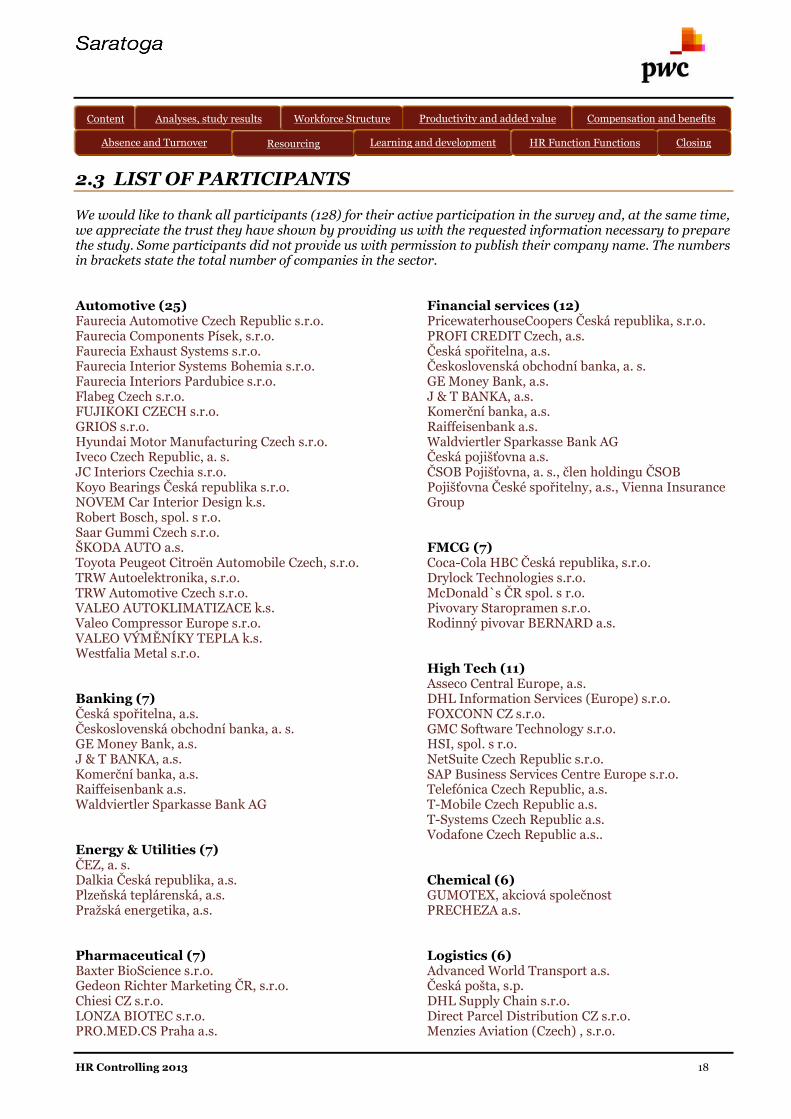
2.3 LIST OF PARTICIPANTS
We would like to thank all participants (128) for their active participation in the survey and, at the same time,we appreciate the trust they have shown by providing us with the requested information necessary to preparethe study. Some participants did not provide us with permission to publish their company name. The numbersin brackets state the total number of companies in the sector.
Automotive (25)Faurecia Automotive Czech Republic s.r.o.Faurecia Components Písek, s.r.o.Faurecia Exhaust Systems s.r.o.Faurecia Interior Systems Bohemia s.r.o.Faurecia Interiors Pardubice s.r.o.Flabeg Czech s.r.o.FUJIKOKI CZECH s.r.o.GRIOS s.r.o.Hyundai Motor Manufacturing Czech s.r.o.Iveco Czech Republic, a. s.JC Interiors Czechia s.r.o.Koyo Bearings Česká republika s.r.o. NOVEM Car Interior Design k.s.Robert Bosch, spol. s r.o.Saar Gummi Czech s.r.o.ŠKODA AUTO a.s.Toyota Peugeot Citroën Automobile Czech, s.r.o.TRW Autoelektronika, s.r.o.TRW Automotive Czech s.r.o.VALEO AUTOKLIMATIZACE k.s.Valeo Compressor Europe s.r.o.VALEO VÝMĚNÍKY TEPLA k.s. Westfalia Metal s.r.o.
Banking (7)Česká spořitelna, a.s. Československá obchodní banka, a. s. GE Money Bank, a.s.J & T BANKA, a.s.Komerční banka, a.s. Raiffeisenbank a.s.Waldviertler Sparkasse Bank AG
Energy & Utilities (7)ČEZ, a. s. Dalkia Česká republika, a.s. Plzeňská teplárenská, a.s. Pražská energetika, a.s.
Pharmaceutical (7)Baxter BioScience s.r.o.Gedeon Richter Marketing ČR, s.r.o. Chiesi CZ s.r.o.LONZA BIOTEC s.r.o.PRO.MED.CS Praha a.s.
Financial services (12)PricewaterhouseCoopers Česká republika, s.r.o. PROFI CREDIT Czech, a.s.Česká spořitelna, a.s. Československá obchodní banka, a. s. GE Money Bank, a.s.J & T BANKA, a.s.Komerční banka, a.s. Raiffeisenbank a.s.Waldviertler Sparkasse Bank AGČeská pojišťovna a.s. ČSOB Pojišťovna, a. s., člen holdingu ČSOB Pojišťovna České spořitelny, a.s., Vienna Insurance Group
FMCG (7)Coca-Cola HBC Česká republika, s.r.o. Drylock Technologies s.r.o.McDonald`s ČR spol. s r.o. Pivovary Staropramen s.r.o.Rodinný pivovar BERNARD a.s.
High Tech (11)Asseco Central Europe, a.s.DHL Information Services (Europe) s.r.o.FOXCONN CZ s.r.o.GMC Software Technology s.r.o.HSI, spol. s r.o.NetSuite Czech Republic s.r.o.SAP Business Services Centre Europe s.r.o.Telefónica Czech Republic, a.s.T-Mobile Czech Republic a.s.T-Systems Czech Republic a.s.Vodafone Czech Republic a.s..
Chemical (6)GUMOTEX, akciová společnost PRECHEZA a.s.
Logistics (6)Advanced World Transport a.s.Česká pošta, s.p. DHL Supply Chain s.r.o.Direct Parcel Distribution CZ s.r.o.Menzies Aviation (Czech) , s.r.o.
Content Analyses, study results Productivity and added value Compensation and benefitsAbsence and Turnover
ClosingAbsence and Turnover
Workforce Structure
Learning and developmentHR Function
HR Function FunctionsResourcing

HR Controlling 2013 19
Trade and distribution (12)Atlas Copco s.r.o.AUTOBENEX, spol. s r.o.BAŤA, akciová společnost BUFAB CZ s.r.o.CeWe Color, a. s.DATART INTERNATIONAL,a.s.DIVA Center s.r.o.EMOS spol. s r.o.REMY COINTREAU CZECH REPUBLIC s.r.o.Stora Enso Praha, s.r.o.TOYOTA TSUSHO EUROPE S.A., organizační složka v České republice UNCLE SAM a.s.
Insurance (3)Česká pojišťovna a.s. ČSOB Pojišťovna, a. s., člen holdingu ČSOB Pojišťovna České spořitelny, a.s., Vienna Insurance Group
Manufacturing (27)ABB s.r.o.Abydos s.r.o.AERO Vodochody AEROSPACE a.s.AGC Flat Glass Czech a.s., člen AGC Group Ammann Czech Republic a.s.Aperam Stainless Services & Solutions Tubes CZs.r.o.ArcelorMittal Ostrava a.s.Ball Aerocan CZ s.r.o.Biocel Paskov a.s.Bodycote HT s.r.o.
Bombardier Transportation Czech Republic a.s.Constellium Extrusions Děčín s.r.o. Crystalex CZ, s.r.o.Doosan Škoda Power s.r.o.Driessen Aerospace CZ s.r.o.Glatt - Pharma, spol. s r.o.HESTEGO a.s.Huhtamaki Česká republika, a.s. Isolit-Bravo, spol. s r.o.LAPP KABEL s.r.o.LINCOLN CZ, s.r.o.MEDIN, a.s.OSTROJ a.s.ROHDE & SCHWARZ závod Vimperk, s.r.o.Schneider Electric, a.s.Siemens, s.r.o.THIMM Obaly, k.s.
Construction (6)Navláčil stavební firma, s.r.o. Skupina firem PKS
Others (2)MBtech Bohemia s.r.o.S U M O s.r.o.

HR Controlling 2013 20
2.4 DATA PRESENTATION
We monitored key HR management indicators from 1 January 2012 to 31 December 2012. Detailed definitionsand formulae of individual indicators are listed in the Appendix “Definitions”.
We have prepared tables for each indicator summary that include the values of these statistical indicators:
Name Method of calculation
Average The sum of all values reported, divided by the number of these values.
1st decile The value dividing the sample in two parts - 10% of the values is below this data point and 90% is above it.
1st quartile The value dividing the sample in two parts - 25% of the values is below this data point and 75% is above it.
MedianThe value is in the middle of the whole data sample - 50% of the values is below this data point and 50% isabove it.
3rd quartile The value dividing the sample in two parts - 75% of the values is below this data point and 15% is above it.
9th decileThe value is dividing the sample in two parts - 90% of the values is below this data point and 10% is aboveit.
The number of responses is stated for each value, which shows the size of the available sample. The greater thenumber, the more reliable the results are. The number may be lower than the number of companies in thesample, as some companies were not able to provide data for all indicators.
Graph sample
Table sample
4 279 342
4 674 817
3 955 761
2 800 234
4 534 961
4 139 795
5 692 904
4 112 189
CZK 0
CZK 1 000 000
CZK 2 000 000
CZK 3 000 000
CZK 4 000 000
CZK 5 000 000
CZK 6 000 000
CZK 7 000 000
CZK 8 000 000
CZK 9 000 000
All companies Includingproduction
Excludingproduction
Czech owned Foreign owned ROE < 5% ROE > 20% Europe
Com pany category Av erage 10. percentile 25. percentile Median 75. percentile 90. percentile Com panies
Including production 6 618 111 1 486 7 87 2 605 009 4 67 4 817 7 620 128 12 807 604 7 7
Excluding production 6 7 7 3 17 2 1 440 47 8 2 07 4 865 3 955 7 61 7 7 65 090 15 150 7 21 49
Czech owned 5 388 695 1 222 447 1 57 4 267 2 800 234 6 056 7 04 10 445 805 32
Foreign owned 7 117 466 1 627 347 2 624 969 4 534 961 7 912 133 14 609 883 94
ROE < 5% 5 412 697 1 288 024 2 17 3 363 4 139 7 95 6 67 2 946 14 281 880 34
ROE > 20% 9 146 453 1 606 601 2 434 67 5 5 692 904 8 261 67 2 26 826 951 38
Europe - - 2 517 217 4 11 2 189 6 892 249 - -
All com panies 6 67 8 413 1 451 815 2 431 7 00 4 27 9 342 7 7 28 850 14 098 818 1 26
3rd Quartile(75th Percentile)
Median(50th Percentile)
1st Quartile(25th Percentile)
Missing value as a result of insufficient numberof inputs into data analysis

HR Controlling 2013 21
In line with PwC’s standard disclosure practice, in order to maintain confidentiality of participants’information, we do not provide an analysis of metrics where less than three companies responded. Averagesand medians are provided where a minimum of three companies responded; 1st and 3rd quartiles (25th and 75th
percentiles) are provided where data was provided by five or more companies; and 1st and 9th deciles areprovided where data was provided by at least nine companies. These rules ensure that it is not possible todeduce the valuesof a particular company.
Please note that in several cases the percentage sum is not equal to 100%, which can be caused by the following:a) The automatic rounding of decimal points for some percentage figures,b) The fact that some companies were not able to provide data for all employee categories.
HR Scorecard – Individual benchmark of a company
In addition to the final report, there is an interactive tool called HR Scorecard. This tool is an integral part ofthe outputs of this study and allows you to benchmark the values of particular HR indicators in your companywith the market. Instructions on how to use this tool can be found directly in the Excel file.

HR Controlling 2013 36
2.6 PRODUCTIVITY AND ADDED VALUE
By linking human capital management to commercial and financial results, these metrics guide the alignmentof improved human capital policy and interventions towards those areas that have a real influence on businesssuccess or failure.
We typically divide the portfolio into two parts - Financial impact and Productivity and Value added. Thesemetrics:
provide an overview of an organisation’s relative performance and competitive position,
increase business and managerial decision-making focus on productivity and efficiency from a humancapital resource perspective,
allow improved prioritisation of human capital management policies.
Content Analyses, study results Productivity and added value Compensation and benefits
ClosingAbsence and Turnover
Workforce Structure
Learning and development HR Function FunctionsResourcing

HR Controlling 2013 37
2.6.1 Revenue per FTE
RevenueTotal FTEs
Total Annual Revenue per FTE
How to use it
Revenue per FTE describes in gross terms, how much money employees are bringing into the organisation,whether directly or indirectly. Ultimately, it reflects whether the organisation's human capital policies arehaving a positive influence on the monies coming into the organisation.
It must be recognised that growth is achieved through dynamic interactions between the market and theworkplace. HR has a clear influence over revenue performance through its resourcing focus, reward strategy,learning and development interventions etc since these directly affect employee capabilities, attitudes andengagement and consequentially work outputs, quality, sales and customer service.
Where Revenue per FTE appears strong in comparative terms, it is not necessarily safe to assume thatunderlying revenues themselves are competitively high. Such a benchmark position may also beachieved by simply generating similar revenues to your competitors but with fewer FTEs employed.
If revenue performs poorly, investigations must begin to understand the effect of the two constituentparts of the metric, revenues in absolute terms and the number of employees. It may reflect to a greateror lesser degree a higher comparative workforce establishment, or issues relating to the commercialproposition, customer/client relationship management, marketing and sales efforts.
Where Revenue per FTE is increasing or decreasing rapidly for your organisation, it is important tounderstand how, if at all, human capital interventions have influenced the situation. Are positivemovements begin affected by new product development, skills training, performance management etc.
In situations where your benchmark positioning remains relatively constant, you should investigate theimpact and effectiveness of recent sales and marketing initiatives, customer service initiatives, productintroductions, your productivity focus, performance management and incentivisation. Explore whetherthese are having any measurable positive effect and consider alternative/corrective actions whereappropriate.
Restructuring, downsizing and outsourcing strategies can have a dramatic positive effect on Revenueper FTE in the short-term as the number of employees (the denominator) is reduced. However, it mustbe recognised that such actions usually bring a one-off gain to an organisations benchmark profile onFTE-based measures. In the longer-term, these strategies may do little to improve the fundamentalperformance of the organisation relative to others. Use of other metrics such as the Human Capital ROIallows organisations to track the underlying effect of such corporate interventions whether positive ornegative.
Target guide – upper quartile
Metric relationships
Cost per FTE Profit per FTE Wealth created per FTE Human capital ROI Remuneration/revenue , Remuneration/Total costs Absence and Resignation rates Learning and development metrics

HR Controlling 2013 291
3 CLOSING
3.1 ABOUT SARATOGA
Saratoga, a part of PricewaterhouseCoopers (PwC), is a global leader in human capital measurement,benchmarking and strategic application of human capital information.
Why is Saratoga different from other benchmarking tools in the market?
With a 29-year track record in people benchmarking, our tools, methodologies and analytical expertise areincomparable. We have a genuinely unrivalled data source – we hold the world’s largest, most robust databaseof people performance metrics. Saratoga works with 40% of the FTSE 100 and the Fortune 500.
Saratoga helps you to: Highlight key people issues Identify areas for improvement Provide objective and consistent analysis Build business cases for people investment
Saratoga has one of the largest databases containing valuable information on key indicators of human capitalperformance collected from over 22,000 organisations across all major sectors of commercial activity in Europeand the US. Using these databases, we can offer you further individual comparisons of your company’s resultsagainst other organisations, whether direct competitors or those seen to be facing similar business or economicchallenges, along with a full interpretive commentary.
The history:
PricewaterhouseCoopers LLP (US organisation) acquired Saratoga Institute in February 2003 andPricewaterhouseCoopers LLP (UK organisation) acquired EP-First in November 2003. Combining these twomarket leaders with PwC’s existing human capital measurement capability has positioned PwC as a dominanthuman capital benchmarking provider.
3.2 USE OF THE REPORT AND DATA
This report is prepared for all participants of the HR Controlling 2013 survey. Non-participants can purchasea copy of this report from the contacts listed in this report.
This report is a copyrighted work within the meaning of Act No. 121/200 Coll., on Copyright, as amended, and,as such, is protected under copyright laws. The information in this report cannot repeatedly or systematically beexploited or used within the meaning of Section 90 of the Copyright Act without the prior written permission ofPricewaterhouseCoopers (PwC). This report, including any re-analysed data, shall not be copied, reproduced,disclosed or transmitted in any form or by any means in whole or in part without the prior written permissionof PwC.
The data used in this report were provided by the participants and PwC has not independently verified,validated, or audited the data. PwC makes no representations or warranties with respect to the accuracy ofthe information contained in this report.
PwC shall not be liable or responsible to any user of this report or to any other person or entity for anyinaccuracy of information contained in this report or any errors or omissions in its content, regardless ofthe cause of such inaccuracy, error or omission.
Content Analyses, study results Productivity and added value Compensation and benefits
ClosingAbsence and Turnover
Workforce Structure
Learning and development HR Function FunctionsResourcing

HR Controlling 2013 292
PwC shall not disclose the name of any participant without prior approval, and under no circumstances will itdisclose individual company data.
This publication is not intended to serve as legal, tax or accounting advice. No reader should act on the basis ofany matter contained in this publication without careful consideration or, if necessary, professional advice onthe current circumstances of the issue.
PwC undertakes to keep confidential all information received from participants of this survey, to usethe information solely for internal purposes and not to distribute the information or post such informationeither on the Internet or Intranet or in any freely accessible information sources.
3.3 PROJECT TEAM
Project Leader:Mgr. Hana Farská
Project Team:Natália Kortišová, MBAIng. Markéta Krejčová, Ph.D. Ing. Daniel SoukupIng. Libor Stodola, MBAIng. Lucie TomáškováMartin Valenta, BA
Contact: PricewaterhouseCoopers, Hvězdova 1734/2c, 140 00 Praha 4, telefon +420 251 151 608.
3.4 OTHER HRM SERVICES
Our team of HR specialists has been successfully advising a wide range of both multinational and Czechcompanies on their HR issues for over 19 years. Our goal is to provide you with comprehensive HR services thatcombine the in-depth knowledge of our HR, corporate finance, management consulting, and personal taxprofessionals.
Whether your challenges are effectiveness of your human capital, competitiveness of your salaries, or retentionof your key executives, our team can help.
Our services cover these areas:
HR Process Audits and Optimisation Job Evaluation Reward and Employee Motivation Consulting Performance Management Human Resources Services for Inward Investors Organisational Consulting and Job Models Employer Brand Creation Employee Opinion Surveys


© 2013 PricewaterhouseCoopers Česká republika, s.r.o. All rights reserved. In this document, “PwC” refers to PricewaterhouseCoopers Česká republika, s.r.o., which is a member firm of PricewaterhouseCoopers International Limited, each member firm of which is a separate legal entity.