Embed Size (px)
Citation preview
Featured Trends
Your Engagement Is Strong, but What About Your Alignment?
Want to Create Leaders? Build Their Networks
Eliminating Reviews: A Lot of Discussion, but Little Action
Part of the CHRO Insight Series CEB Corporate Leadership Council™
First Quarter 2015HR News Report
ii www.executiveboard.com
Part of the CHRO Insight Series
HR NEWS REPORT Functional Insights
CHRO QUARTERLY MAGAZINEBusiness Insights
GLOBAL WORKFORCE INSIGHTS REPORTWorkforce Insights
CHRO VIDEO SERIESPersonal Insights
Piotr BednarczukSVP, Corporate Human ResourcesMerck KGaA
Joanne TownsendSVP, Human ResourcesCommscope
Ben LawrenceCHRO Wesfarmers Limited
Kevin CoxCHROAmerican Express
Eva Sage-GavinVice ChairThe Aspen Institute
Anne SampleCHROThrivent Financial
CEB Corporate Leadership Council™
Executive DirectorBrian Kropp
Senior DirectorDan Metz
DirectorsMatt DudekTiffany FountainAmanda Joseph-LittleJessie KnightLauren Smith
Associate DirectorsSara HaberCaitlyn HongellYi KangEmily Rose McRaeCaroline Roth
Senior Research AnalystsPrajwalita BorahMartha HaddockOana LupuMary Lyons
Research AnalystsLucy CoyleBethany HorstmannMalvika KhajuriaNitin MenonPooja MuthiahJohn RomanRyan Sila
Content Publishing Solutions
Print DesignerTiffany Todd
EditorMary McMenamin
Diversity and InclusionThe Talent Pool for Disability Hiring Is Expanding
Employee Engagement and RetentionEmployees in BRIC Countries More Likely to Leave Business Units
Your Engagement Is Strong, but What About Your Alignment?
Employment Value PropositionUnconventional Development Opportunities Drive Career Progression
HR TransformationAnalytics Professionals Avoid HR Opportunities
LeadershipWant to Create Leaders? Build Their Networks
Learning and DevelopmentL&D Executives Prioritizing Spending on Outsourced Courses in 2015
Leadership Investments Continue to Surge (But Don’t Necessarily Translate to Success)
Organization DesignMany HR Business Partners Still Stuck in Hierarchical Line Relationships
Performance Management and ProductivityEliminating Reviews: A Lot of Discussion, but Little Action
RecruitingSome Large Countries Defy Regional Talent Pool Growth Trends
Total RewardsBig Shift in US Total Rewards Preferences Toward Quality of Life
Employees Want Just as Much Help Managing Their Wealth
How You Can Use Your STI Spend to Double Employee Commitment
1
9
3
11
13
19
5
15
21
23
25
27
7
17
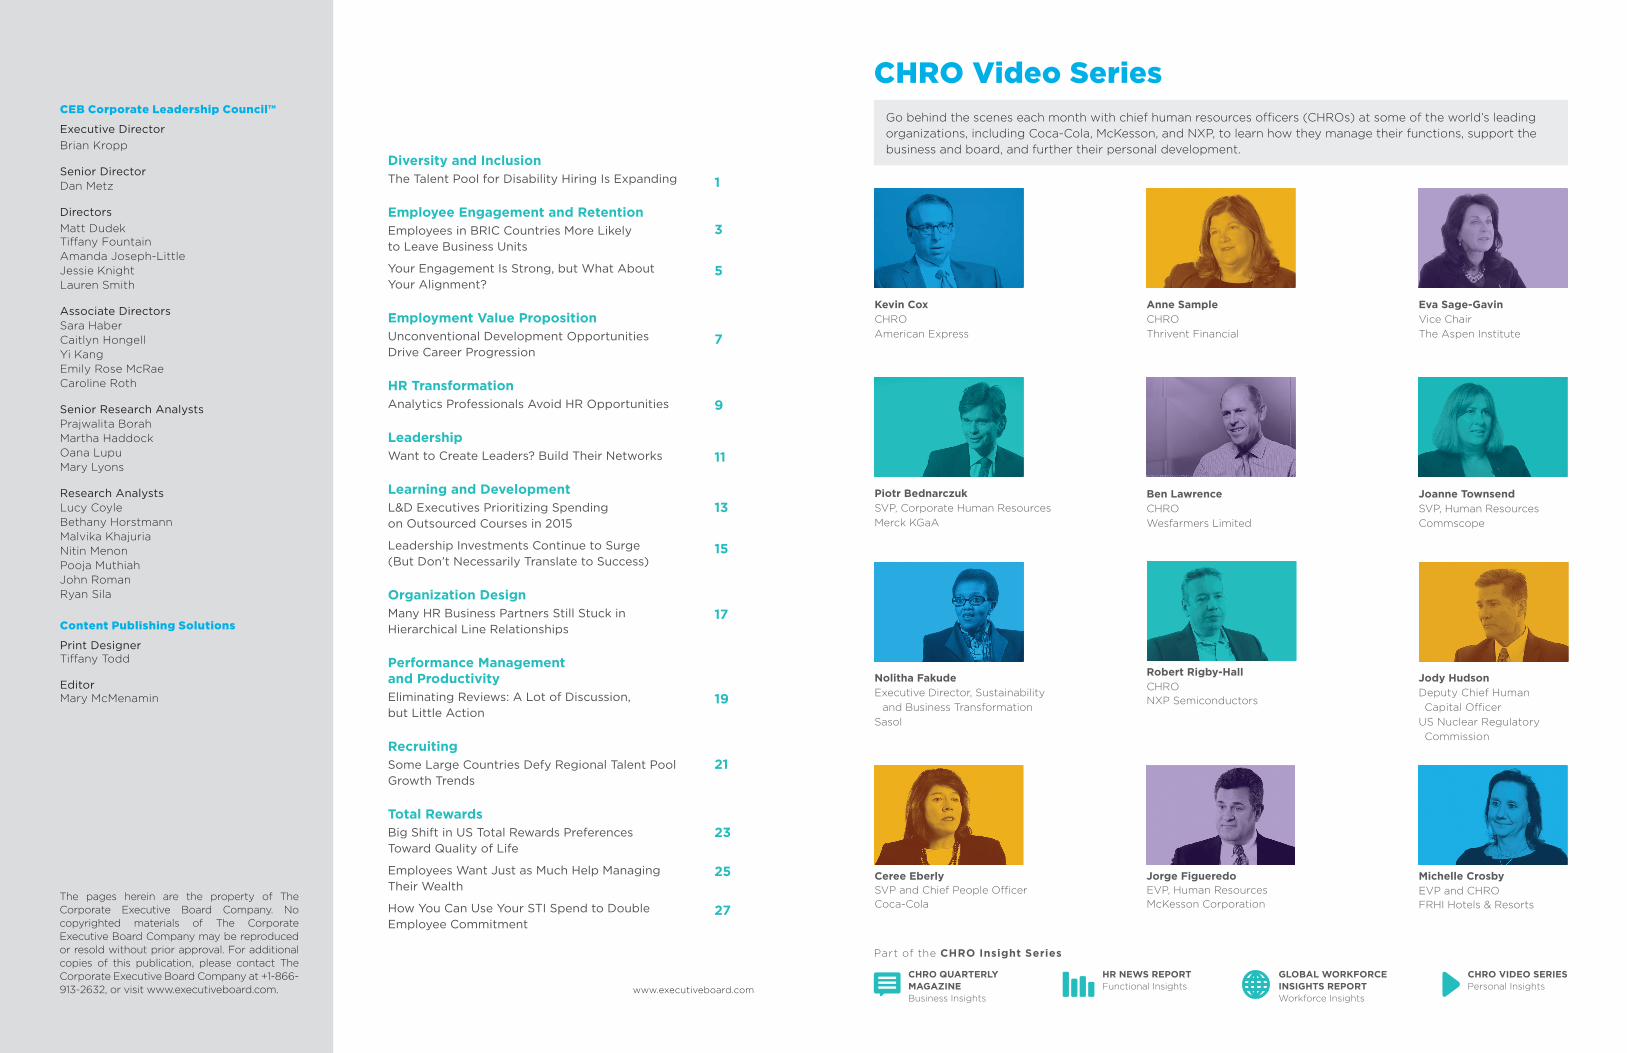
CHRO Video SeriesGo behind the scenes each month with chief human resources officers (CHROs) at some of the world’s leading organizations, including Coca-Cola, McKesson, and NXP, to learn how they manage their functions, support the business and board, and further their personal development.
Jody HudsonDeputy Chief Human Capital Officer
US Nuclear Regulatory Commission
Nolitha FakudeExecutive Director, Sustainability and Business TransformationSasol
Robert Rigby-HallCHRONXP Semiconductors
Ceree EberlySVP and Chief People OfficerCoca-Cola
Jorge FigueredoEVP, Human ResourcesMcKesson Corporation
Michelle CrosbyEVP and CHROFRHI Hotels & Resorts
The pages herein are the property of The Corporate Executive Board Company. No copyrighted materials of The Corporate Executive Board Company may be reproduced or resold without prior approval. For additional copies of this publication, please contact The Corporate Executive Board Company at +1-866-913-2632, or visit www.executiveboard.com.
1 © 2015 CEB. All rights reserved. CLC1697515SYNwww.executiveboard.com 2
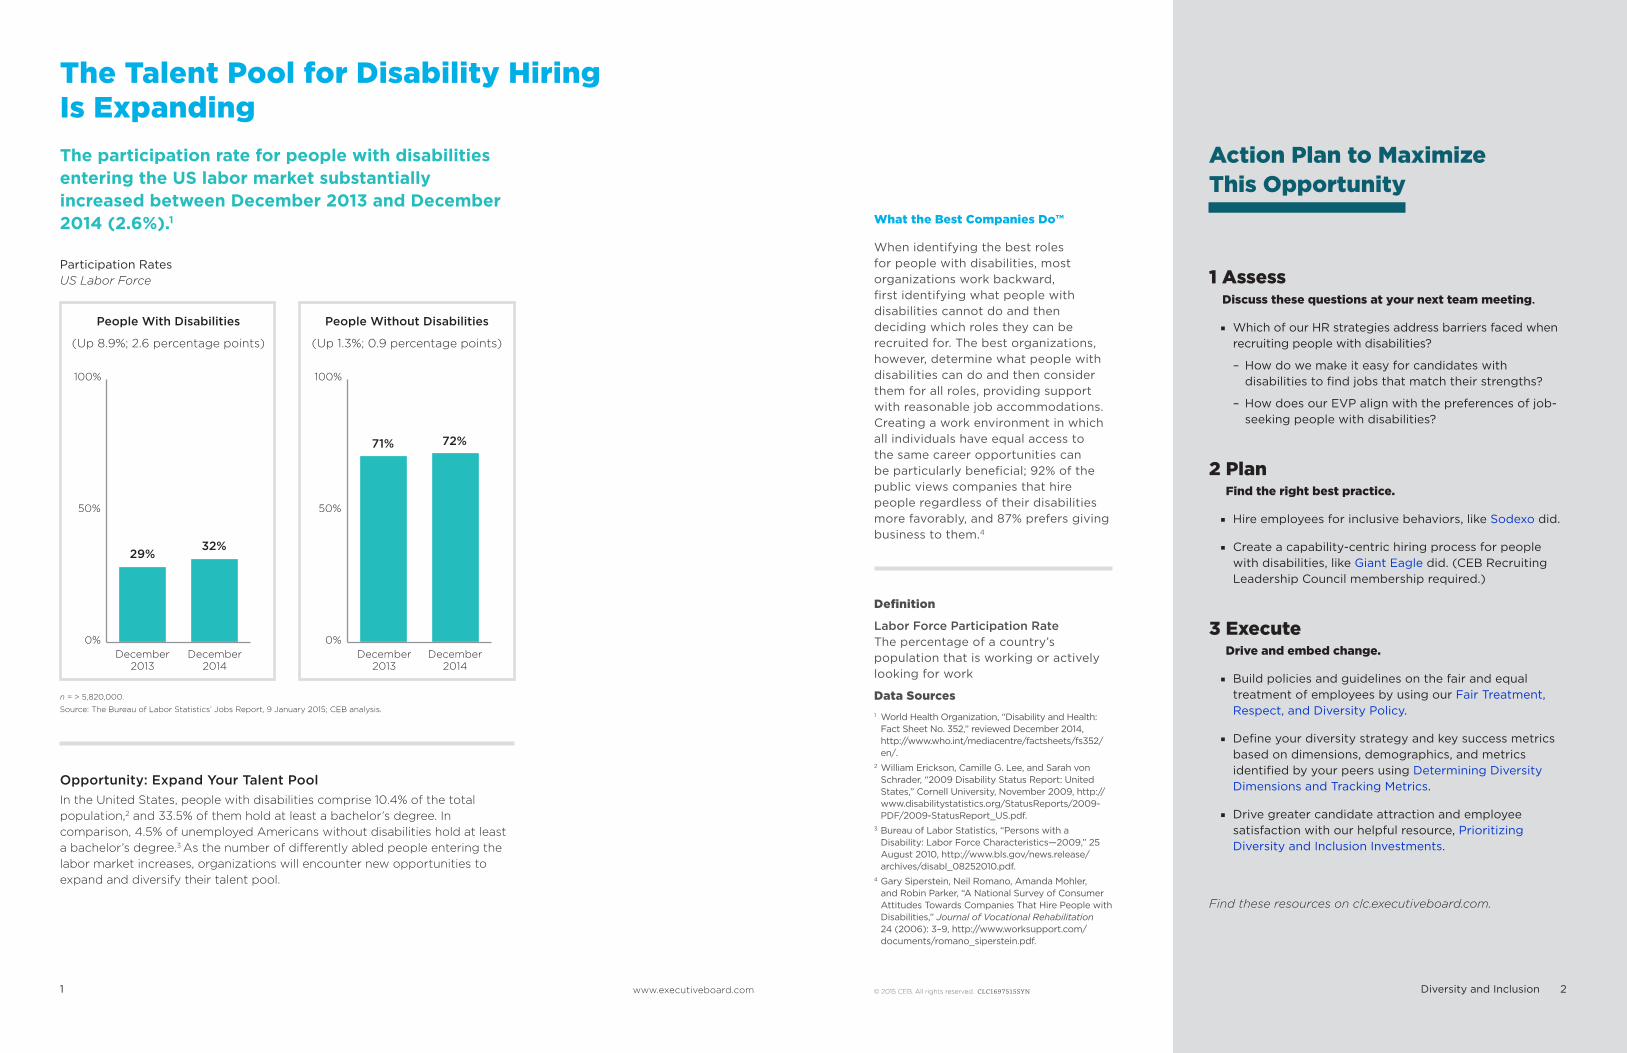
The participation rate for people with disabilities entering the US labor market substantially increased between December 2013 and December 2014 (2.6%).1
Participation RatesUS Labor Force
Find these resources on clc.executiveboard.com.
The Talent Pool for Disability Hiring Is Expanding
1 AssessDiscuss these questions at your next team meeting.
■ Which of our HR strategies address barriers faced when recruiting people with disabilities?
– How do we make it easy for candidates with disabilities to find jobs that match their strengths?
– How does our EVP align with the preferences of job-seeking people with disabilities?
2 Plan Find the right best practice.
■ Hire employees for inclusive behaviors, like Sodexo did.
■ Create a capability-centric hiring process for people with disabilities, like Giant Eagle did. (CEB Recruiting Leadership Council membership required.)
3 Execute Drive and embed change.
■ Build policies and guidelines on the fair and equal treatment of employees by using our Fair Treatment, Respect, and Diversity Policy.
■ Define your diversity strategy and key success metrics based on dimensions, demographics, and metrics identified by your peers using Determining Diversity Dimensions and Tracking Metrics.
■ Drive greater candidate attraction and employee satisfaction with our helpful resource, Prioritizing Diversity and Inclusion Investments.
Opportunity: Expand Your Talent PoolIn the United States, people with disabilities comprise 10.4% of the total population,2 and 33.5% of them hold at least a bachelor’s degree. In comparison, 4.5% of unemployed Americans without disabilities hold at least a bachelor’s degree.3 As the number of differently abled people entering the labor market increases, organizations will encounter new opportunities to expand and diversify their talent pool.
What the Best Companies Do™
When identifying the best roles for people with disabilities, most organizations work backward, first identifying what people with disabilities cannot do and then deciding which roles they can be recruited for. The best organizations, however, determine what people with disabilities can do and then consider them for all roles, providing support with reasonable job accommodations. Creating a work environment in which all individuals have equal access to the same career opportunities can be particularly beneficial; 92% of the public views companies that hire people regardless of their disabilities more favorably, and 87% prefers giving business to them.4
Definition
Labor Force Participation RateThe percentage of a country’s population that is working or actively looking for work
Data Sources1 World Health Organization, “Disability and Health:
Fact Sheet No. 352,” reviewed December 2014, http://www.who.int/mediacentre/factsheets/fs352/en/.
2 William Erickson, Camille G. Lee, and Sarah von Schrader, “2009 Disability Status Report: United States,” Cornell University, November 2009, http://www.disabilitystatistics.org/StatusReports/2009-PDF/2009-StatusReport_US.pdf.
3 Bureau of Labor Statistics, “Persons with a Disability: Labor Force Characteristics—2009,” 25 August 2010, http://www.bls.gov/news.release/archives/disabl_08252010.pdf.
4 Gary Siperstein, Neil Romano, Amanda Mohler, and Robin Parker, “A National Survey of Consumer Attitudes Towards Companies That Hire People with Disabilities,” Journal of Vocational Rehabilitation 24 (2006): 3–9, http://www.worksupport.com/documents/romano_siperstein.pdf.
Action Plan to Maximize This Opportunity
Diversity and Inclusion
n = > 5,820,000.
Source: The Bureau of Labor Statistics’ Jobs Report, 9 January 2015; CEB analysis.
People With Disabilities
(Up 8.9%; 2.6 percentage points)
People Without Disabilities
(Up 1.3%; 0.9 percentage points)
December 2013
December 2014
0%
50%
100%
29%32%
December 2013
December 2014
0%
50%
100%
71% 72%
3 © 2015 CEB. All rights reserved. CLC1697515SYNwww.executiveboard.com 4
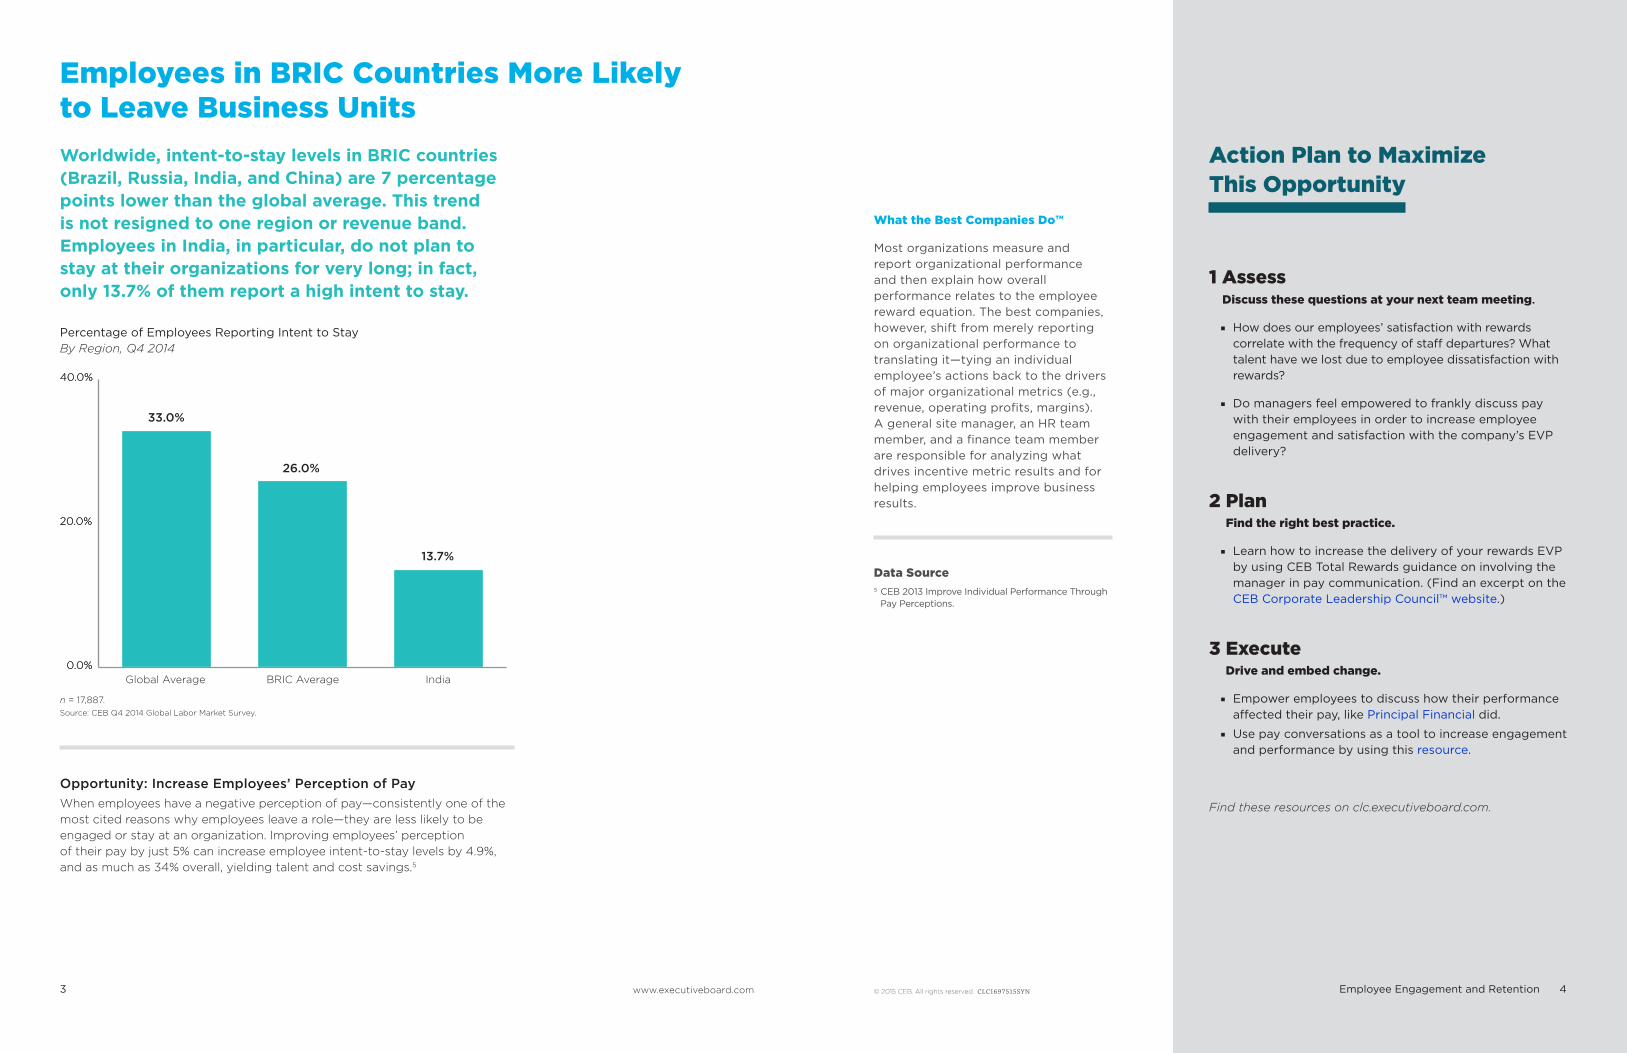
Worldwide, intent-to-stay levels in BRIC countries (Brazil, Russia, India, and China) are 7 percentage points lower than the global average. This trend is not resigned to one region or revenue band. Employees in India, in particular, do not plan to stay at their organizations for very long; in fact, only 13.7% of them report a high intent to stay.
Percentage of Employees Reporting Intent to StayBy Region, Q4 2014
Find these resources on clc.executiveboard.com.
Employees in BRIC Countries More Likely to Leave Business Units
1 AssessDiscuss these questions at your next team meeting.
■ How does our employees’ satisfaction with rewards correlate with the frequency of staff departures? What talent have we lost due to employee dissatisfaction with rewards?
■ Do managers feel empowered to frankly discuss pay with their employees in order to increase employee engagement and satisfaction with the company’s EVP delivery?
2 Plan Find the right best practice.
■ Learn how to increase the delivery of your rewards EVP by using CEB Total Rewards guidance on involving the manager in pay communication. (Find an excerpt on the CEB Corporate Leadership Council™ website.)
3 Execute Drive and embed change.
■ Empower employees to discuss how their performance affected their pay, like Principal Financial did.
■ Use pay conversations as a tool to increase engagement and performance by using this resource.
Opportunity: Increase Employees’ Perception of PayWhen employees have a negative perception of pay—consistently one of the most cited reasons why employees leave a role—they are less likely to be engaged or stay at an organization. Improving employees’ perception of their pay by just 5% can increase employee intent-to-stay levels by 4.9%, and as much as 34% overall, yielding talent and cost savings.5
What the Best Companies Do™
Most organizations measure and report organizational performance and then explain how overall performance relates to the employee reward equation. The best companies, however, shift from merely reporting on organizational performance to translating it—tying an individual employee’s actions back to the drivers of major organizational metrics (e.g., revenue, operating profits, margins). A general site manager, an HR team member, and a finance team member are responsible for analyzing what drives incentive metric results and for helping employees improve business results.
Data Source5 CEB 2013 Improve Individual Performance Through
Pay Perceptions.
Action Plan to Maximize This Opportunity
Employee Engagement and Retention
n = 17,887.Source: CEB Q4 2014 Global Labor Market Survey.
0.0%
20.0%
40.0%
0.0%
20.0%
40.0%
33.0%
26.0%
13.7%
Global Average BRIC Average India
5 © 2015 CEB. All rights reserved. CLC1697515SYNwww.executiveboard.com 6
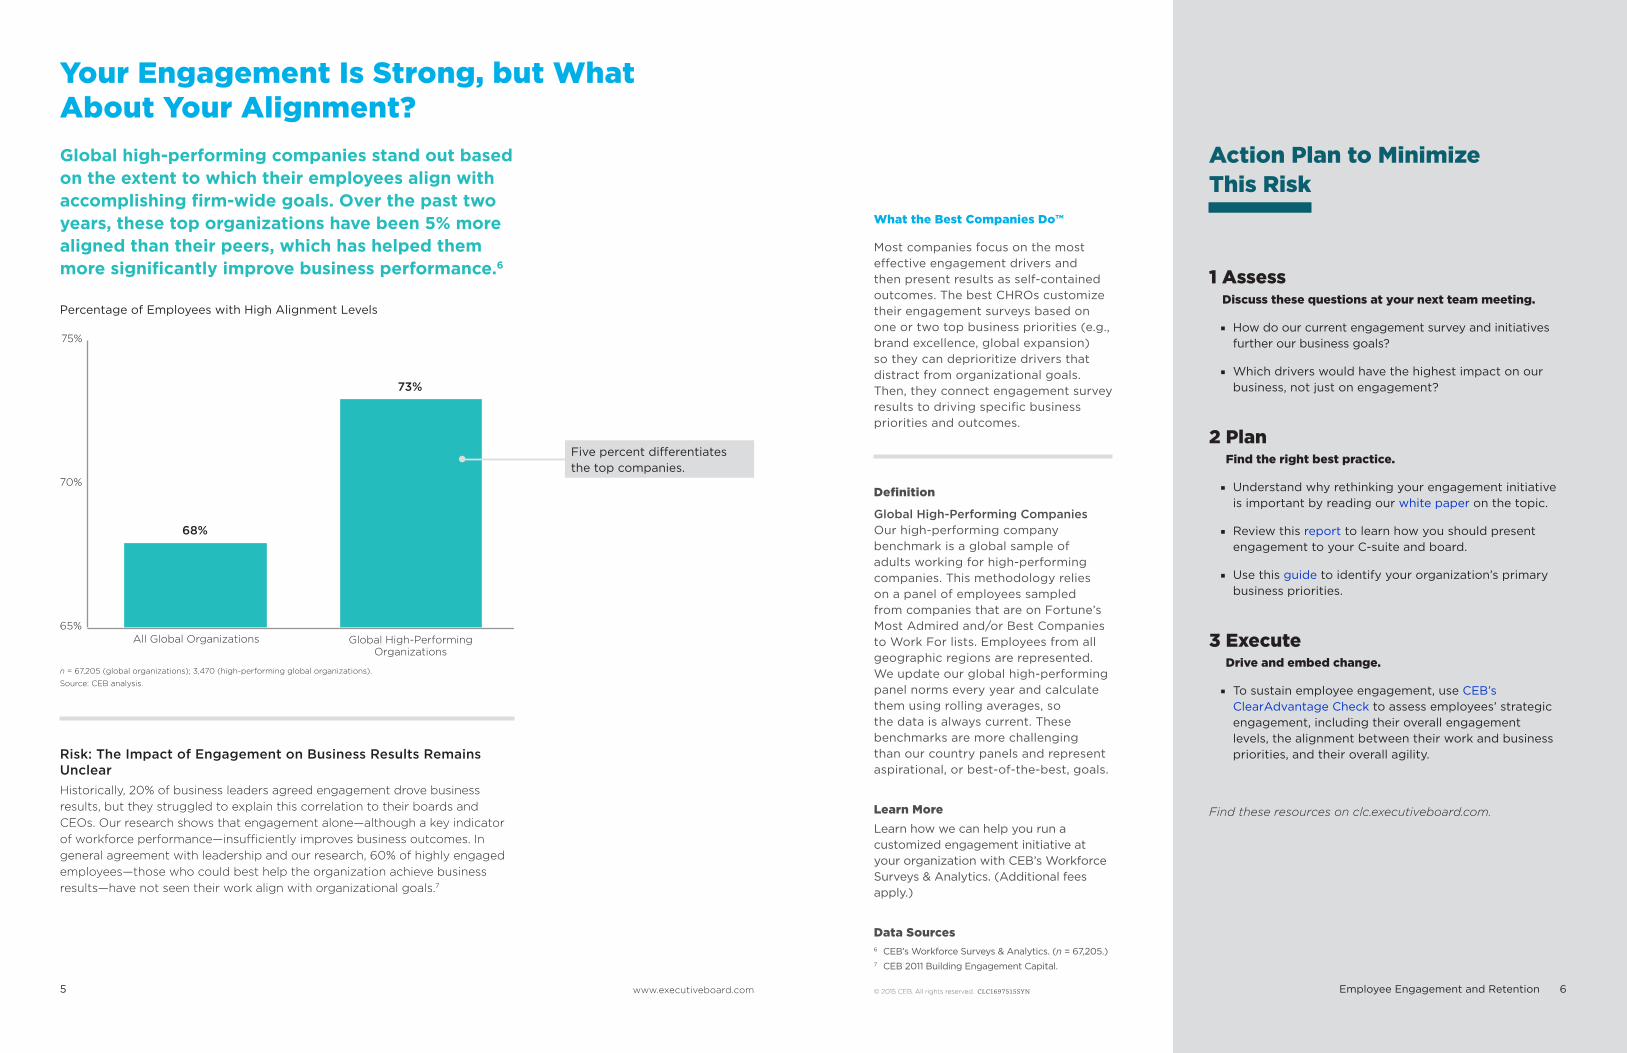
Global high-performing companies stand out based on the extent to which their employees align with accomplishing firm-wide goals. Over the past two years, these top organizations have been 5% more aligned than their peers, which has helped them more significantly improve business performance.6
Find these resources on clc.executiveboard.com.
Your Engagement Is Strong, but What About Your Alignment?
1 AssessDiscuss these questions at your next team meeting.
■ How do our current engagement survey and initiatives further our business goals?
■ Which drivers would have the highest impact on our business, not just on engagement?
2 Plan Find the right best practice.
■ Understand why rethinking your engagement initiative is important by reading our white paper on the topic.
■ Review this report to learn how you should present engagement to your C-suite and board.
■ Use this guide to identify your organization’s primary business priorities.
3 Execute Drive and embed change.
■ To sustain employee engagement, use CEB’s ClearAdvantage Check to assess employees’ strategic engagement, including their overall engagement levels, the alignment between their work and business priorities, and their overall agility.
What the Best Companies Do™
Most companies focus on the most effective engagement drivers and then present results as self-contained outcomes. The best CHROs customize their engagement surveys based on one or two top business priorities (e.g., brand excellence, global expansion) so they can deprioritize drivers that distract from organizational goals. Then, they connect engagement survey results to driving specific business priorities and outcomes.
Definition
Global High-Performing CompaniesOur high-performing company benchmark is a global sample of adults working for high-performing companies. This methodology relies on a panel of employees sampled from companies that are on Fortune’s Most Admired and/or Best Companies to Work For lists. Employees from all geographic regions are represented. We update our global high-performing panel norms every year and calculate them using rolling averages, so the data is always current. These benchmarks are more challenging than our country panels and represent aspirational, or best-of-the-best, goals.
Learn MoreLearn how we can help you run a customized engagement initiative at your organization with CEB’s Workforce Surveys & Analytics. (Additional fees apply.)
Data Sources6 CEB’s Workforce Surveys & Analytics. (n = 67,205.)7 CEB 2011 Building Engagement Capital.
Action Plan to Minimize This Risk
Employee Engagement and Retention
Risk: The Impact of Engagement on Business Results Remains UnclearHistorically, 20% of business leaders agreed engagement drove business results, but they struggled to explain this correlation to their boards and CEOs. Our research shows that engagement alone—although a key indicator of workforce performance—insufficiently improves business outcomes. In general agreement with leadership and our research, 60% of highly engaged employees—those who could best help the organization achieve business results—have not seen their work align with organizational goals.7
Percentage of Employees with High Alignment Levels
n = 67,205 (global organizations); 3,470 (high-performing global organizations).
Source: CEB analysis.
Global High-Performing Organizations
All Global Organizations65%
70%
75%
68%
73%
Five percent differentiates the top companies.
7 © 2015 CEB. All rights reserved. CLC1697515SYNwww.executiveboard.com 8
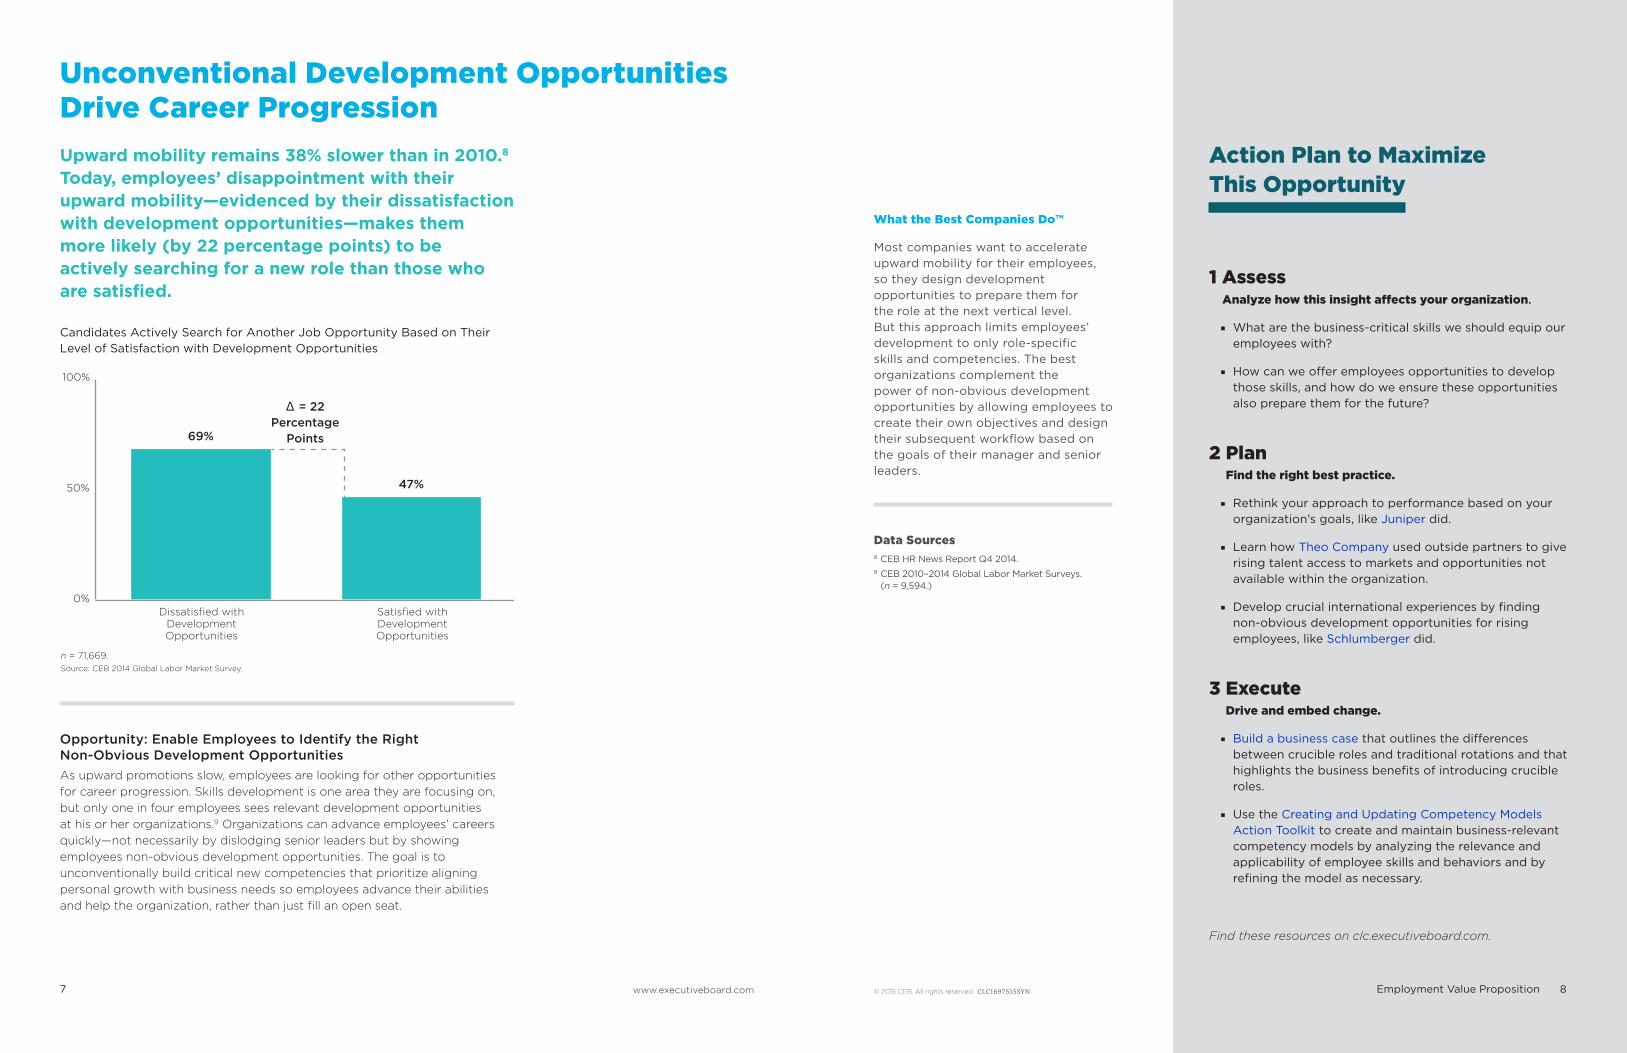
Upward mobility remains 38% slower than in 2010.8 Today, employees’ disappointment with their upward mobility—evidenced by their dissatisfaction with development opportunities—makes them more likely (by 22 percentage points) to be actively searching for a new role than those who are satisfied.
Candidates Actively Search for Another Job Opportunity Based on Their Level of Satisfaction with Development Opportunities
Find these resources on clc.executiveboard.com.
Unconventional Development Opportunities Drive Career Progression
1 AssessAnalyze how this insight affects your organization.
■ What are the business-critical skills we should equip our employees with?
■ How can we offer employees opportunities to develop those skills, and how do we ensure these opportunities also prepare them for the future?
2 Plan Find the right best practice.
■ Rethink your approach to performance based on your organization’s goals, like Juniper did.
■ Learn how Theo Company used outside partners to give rising talent access to markets and opportunities not available within the organization.
■ Develop crucial international experiences by finding non-obvious development opportunities for rising employees, like Schlumberger did.
3 Execute Drive and embed change.
■ Build a business case that outlines the differences between crucible roles and traditional rotations and that highlights the business benefits of introducing crucible roles.
■ Use the Creating and Updating Competency Models Action Toolkit to create and maintain business-relevant competency models by analyzing the relevance and applicability of employee skills and behaviors and by refining the model as necessary.
Action Plan to Maximize This Opportunity
Employment Value Proposition
Opportunity: Enable Employees to Identify the Right Non-Obvious Development OpportunitiesAs upward promotions slow, employees are looking for other opportunities for career progression. Skills development is one area they are focusing on, but only one in four employees sees relevant development opportunities at his or her organizations.9 Organizations can advance employees’ careers quickly—not necessarily by dislodging senior leaders but by showing employees non-obvious development opportunities. The goal is to unconventionally build critical new competencies that prioritize aligning personal growth with business needs so employees advance their abilities and help the organization, rather than just fill an open seat.
What the Best Companies Do™
Most companies want to accelerate upward mobility for their employees, so they design development opportunities to prepare them for the role at the next vertical level. But this approach limits employees’ development to only role-specific skills and competencies. The best organizations complement the power of non-obvious development opportunities by allowing employees to create their own objectives and design their subsequent workflow based on the goals of their manager and senior leaders.
Data Sources8 CEB HR News Report Q4 2014.9 CEB 2010–2014 Global Labor Market Surveys.
(n = 9,594.)
n = 71,669.Source: CEB 2014 Global Labor Market Survey.
Dissatisfied with Development Opportunities
Satisfied with Development Opportunities
0%
50%
100%
69%
47%
∆ = 22 Percentage
Points
9 © 2015 CEB. All rights reserved. CLC1697515SYNwww.executiveboard.com 10
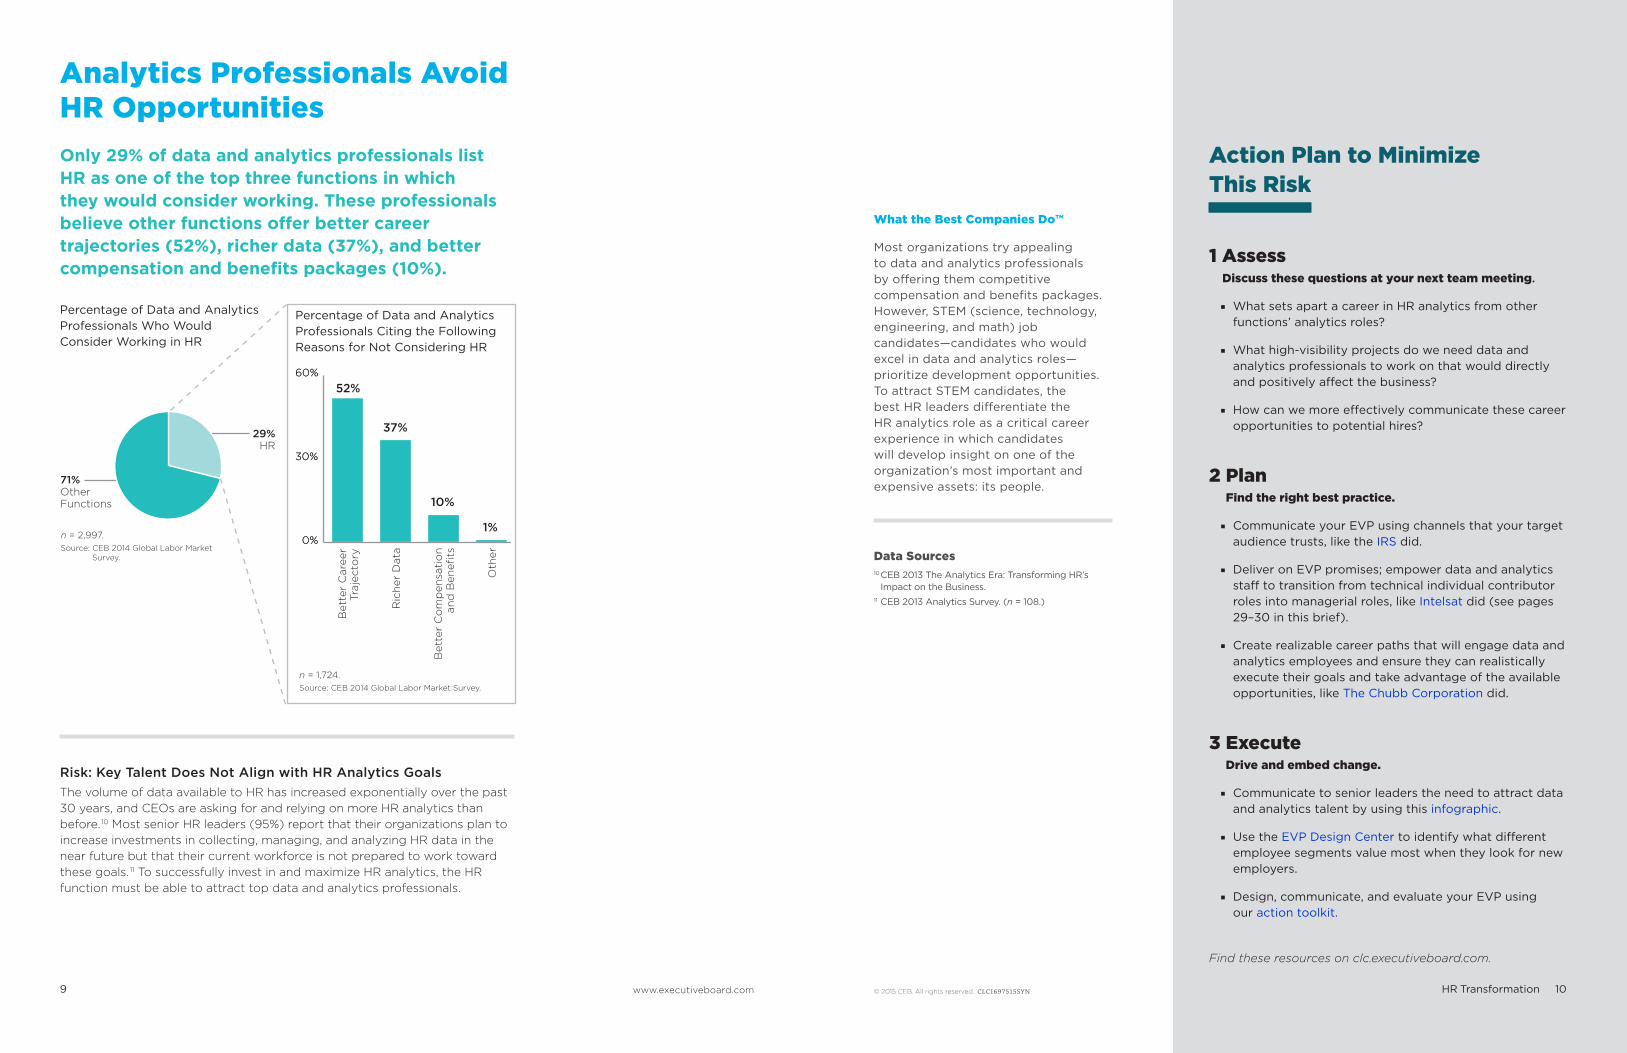
Only 29% of data and analytics professionals list HR as one of the top three functions in which they would consider working. These professionals believe other functions offer better career trajectories (52%), richer data (37%), and better compensation and benefits packages (10%).
Percentage of Data and Analytics Professionals Citing the Following Reasons for Not Considering HR
n = 2,997.Source: CEB 2014 Global Labor Market
Survey.
n = 1,724.Source: CEB 2014 Global Labor Market Survey.
Find these resources on clc.executiveboard.com.
Analytics Professionals Avoid HR Opportunities
1 AssessDiscuss these questions at your next team meeting.
■ What sets apart a career in HR analytics from other functions’ analytics roles?
■ What high-visibility projects do we need data and analytics professionals to work on that would directly and positively affect the business?
■ How can we more effectively communicate these career opportunities to potential hires?
2 Plan Find the right best practice.
■ Communicate your EVP using channels that your target audience trusts, like the IRS did.
■ Deliver on EVP promises; empower data and analytics staff to transition from technical individual contributor roles into managerial roles, like Intelsat did (see pages 29–30 in this brief).
■ Create realizable career paths that will engage data and analytics employees and ensure they can realistically execute their goals and take advantage of the available opportunities, like The Chubb Corporation did.
3 Execute Drive and embed change.
■ Communicate to senior leaders the need to attract data and analytics talent by using this infographic.
■ Use the EVP Design Center to identify what different employee segments value most when they look for new employers.
■ Design, communicate, and evaluate your EVP using our action toolkit.
Risk: Key Talent Does Not Align with HR Analytics GoalsThe volume of data available to HR has increased exponentially over the past 30 years, and CEOs are asking for and relying on more HR analytics than before. 10 Most senior HR leaders (95%) report that their organizations plan to increase investments in collecting, managing, and analyzing HR data in the near future but that their current workforce is not prepared to work toward these goals. 11 To successfully invest in and maximize HR analytics, the HR function must be able to attract top data and analytics professionals.
What the Best Companies Do™
Most organizations try appealing to data and analytics professionals by offering them competitive compensation and benefits packages. However, STEM (science, technology, engineering, and math) job candidates—candidates who would excel in data and analytics roles—prioritize development opportunities. To attract STEM candidates, the best HR leaders differentiate the HR analytics role as a critical career experience in which candidates will develop insight on one of the organization’s most important and expensive assets: its people.
Data Sources10 CEB 2013 The Analytics Era: Transforming HR’s
Impact on the Business.11 CEB 2013 Analytics Survey. (n = 108.)
Action Plan to Minimize This Risk
HR Transformation
0%
30%
60%
0%
30%
60% 52%
37%
10%
1%
Bet
ter
Car
eer
Traj
ecto
ry
Ric
her
Dat
a
Bet
ter
Co
mp
ensa
tio
n
and
Ben
efits
Oth
er71% Other Functions
29% HR
Percentage of Data and Analytics Professionals Who Would Consider Working in HR
52%
11 © 2015 CEB. All rights reserved. CLC1697515SYNwww.executiveboard.com 12
0%
40%
80%71%
52%
67%
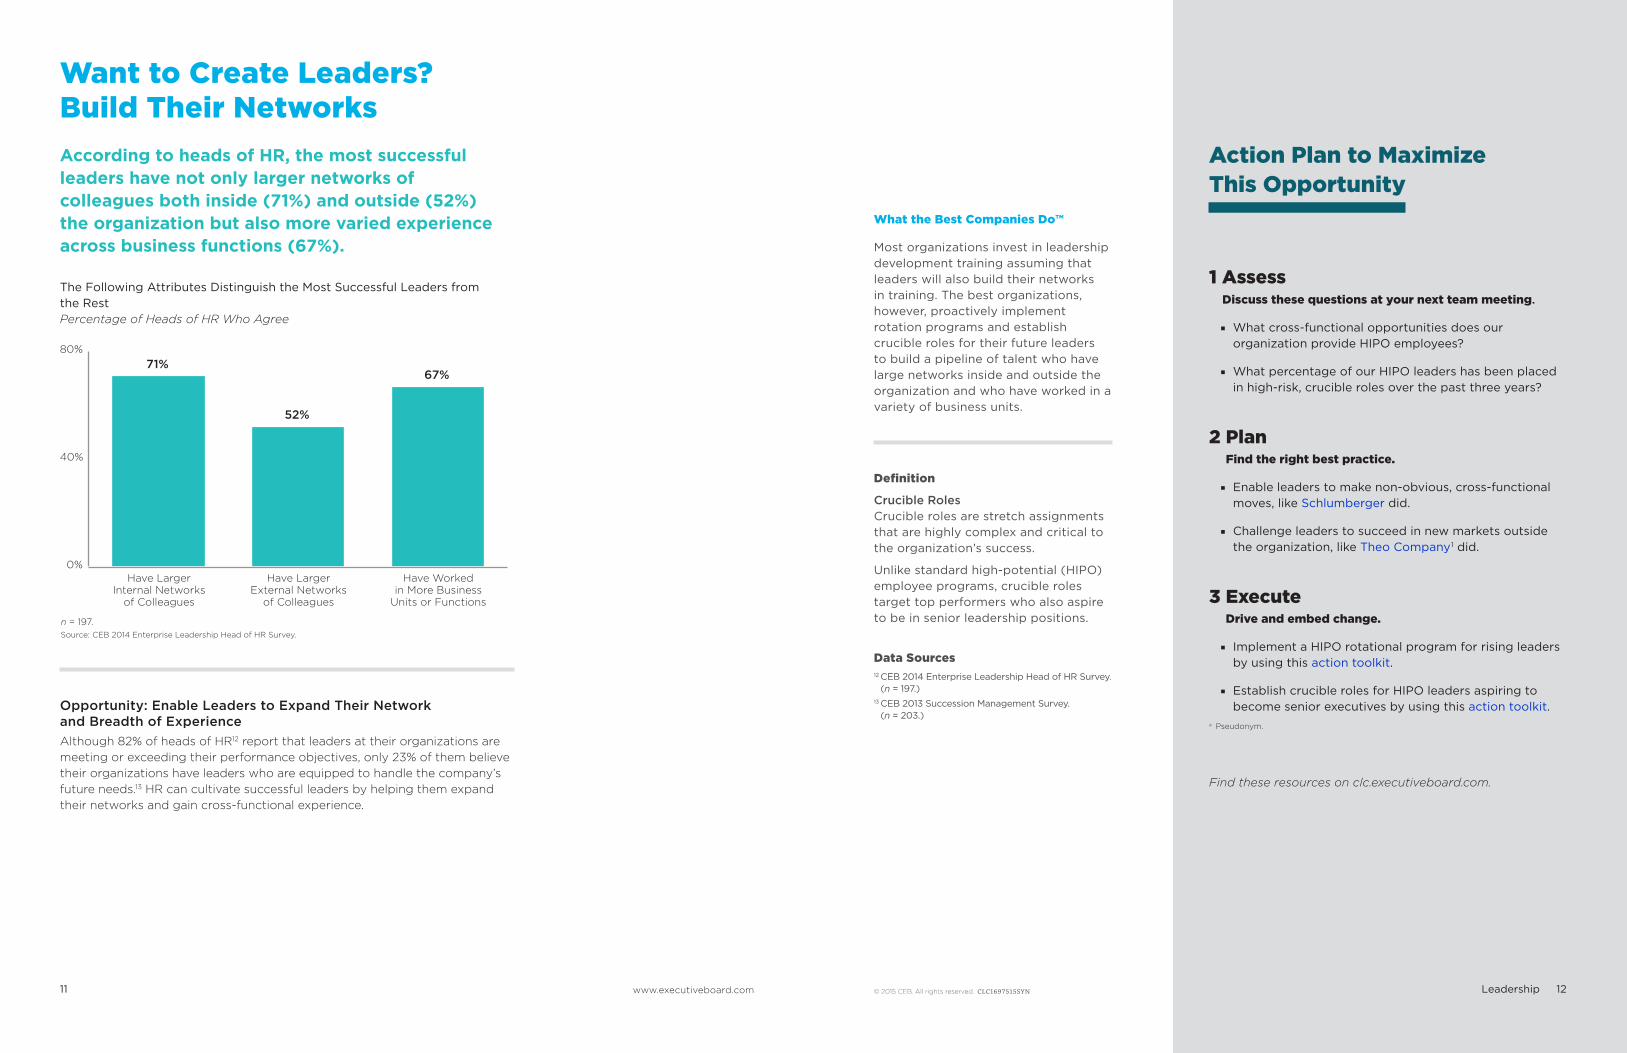
According to heads of HR, the most successful leaders have not only larger networks of colleagues both inside (71%) and outside (52%) the organization but also more varied experience across business functions (67%).
The Following Attributes Distinguish the Most Successful Leaders from the RestPercentage of Heads of HR Who Agree
n = 197.Source: CEB 2014 Enterprise Leadership Head of HR Survey.
Find these resources on clc.executiveboard.com.
Want to Create Leaders? Build Their Networks
1 AssessDiscuss these questions at your next team meeting.
■ What cross-functional opportunities does our organization provide HIPO employees?
■ What percentage of our HIPO leaders has been placed in high-risk, crucible roles over the past three years?
2 Plan Find the right best practice.
■ Enable leaders to make non-obvious, cross-functional moves, like Schlumberger did.
■ Challenge leaders to succeed in new markets outside the organization, like Theo Company1 did.
3 Execute Drive and embed change.
■ Implement a HIPO rotational program for rising leaders by using this action toolkit.
■ Establish crucible roles for HIPO leaders aspiring to become senior executives by using this action toolkit.Opportunity: Enable Leaders to Expand Their Network
and Breadth of ExperienceAlthough 82% of heads of HR12 report that leaders at their organizations are meeting or exceeding their performance objectives, only 23% of them believe their organizations have leaders who are equipped to handle the company’s future needs.13 HR can cultivate successful leaders by helping them expand their networks and gain cross-functional experience.
What the Best Companies Do™
Most organizations invest in leadership development training assuming that leaders will also build their networks in training. The best organizations, however, proactively implement rotation programs and establish crucible roles for their future leaders to build a pipeline of talent who have large networks inside and outside the organization and who have worked in a variety of business units.
Definition
Crucible RolesCrucible roles are stretch assignments that are highly complex and critical to the organization’s success.
Unlike standard high-potential (HIPO) employee programs, crucible roles target top performers who also aspire to be in senior leadership positions.
Data Sources12 CEB 2014 Enterprise Leadership Head of HR Survey.
(n = 197.)13 CEB 2013 Succession Management Survey.
(n = 203.)
Action Plan to Maximize This Opportunity
Leadership
Have Larger Internal Networks
of Colleagues
Have Worked in More Business
Units or Functions
Have Larger External Networks
of Colleagues
a Pseudonym.
13 © 2015 CEB. All rights reserved. CLC1697515SYNwww.executiveboard.com 14
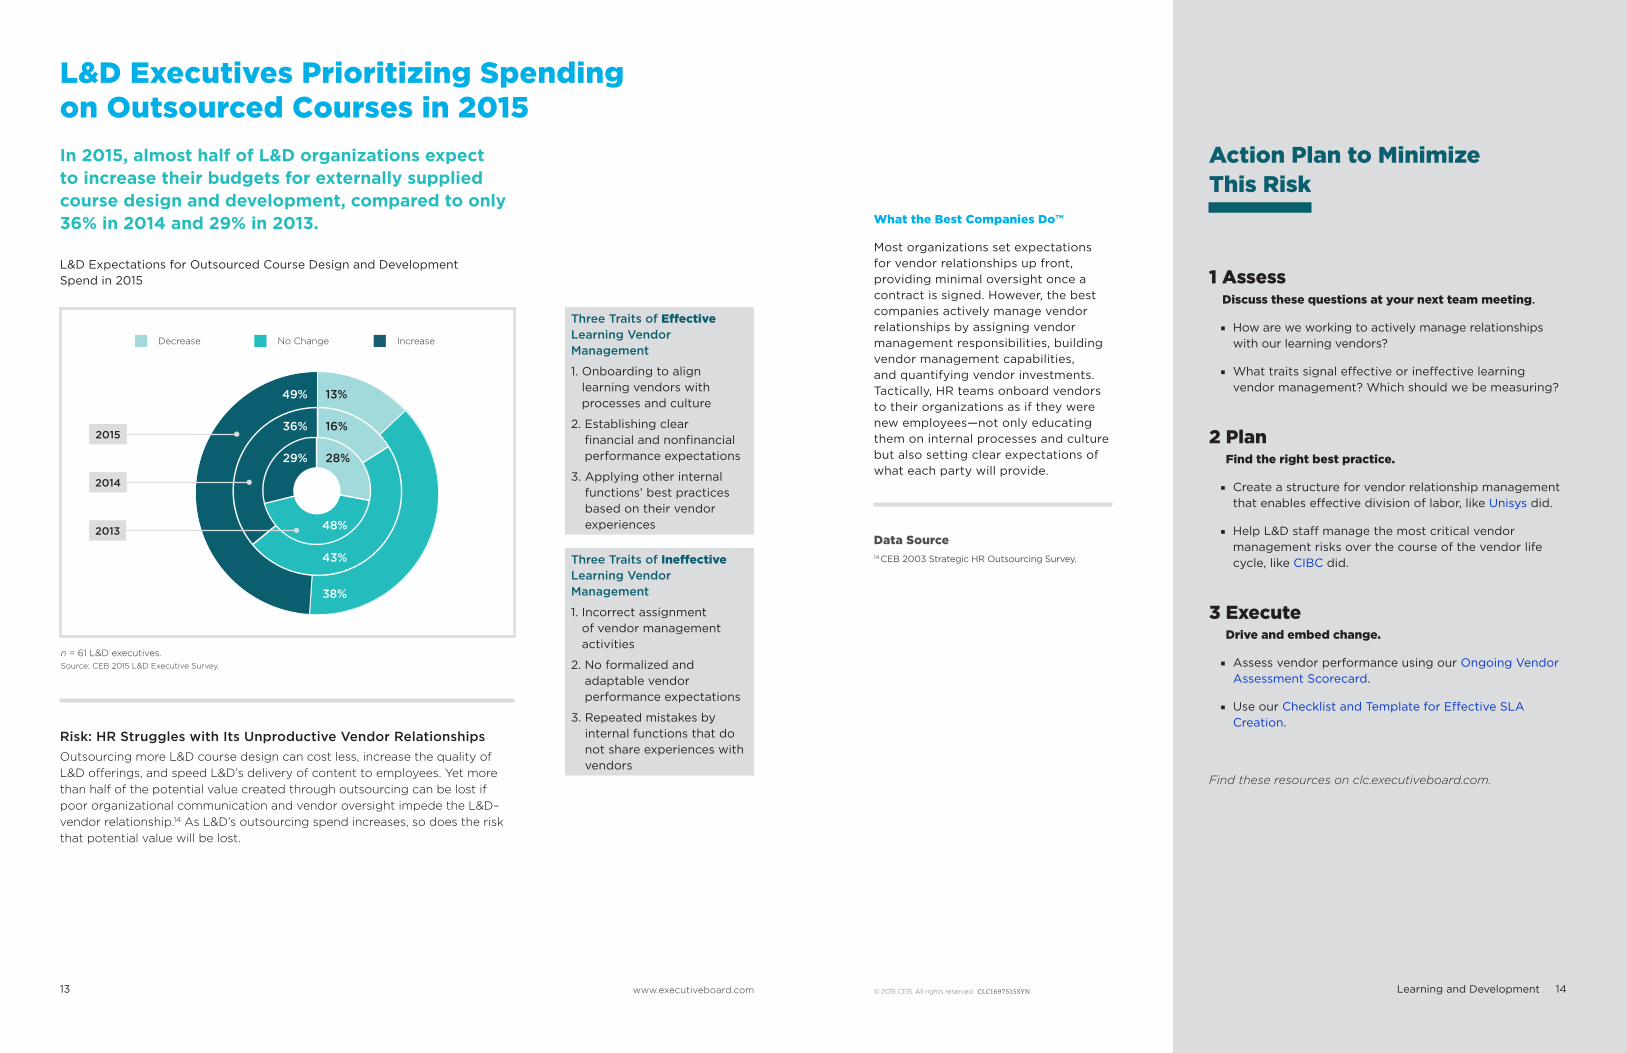
In 2015, almost half of L&D organizations expect to increase their budgets for externally supplied course design and development, compared to only 36% in 2014 and 29% in 2013.
L&D Expectations for Outsourced Course Design and Development Spend in 2015
n = 61 L&D executives.Source: CEB 2015 L&D Executive Survey.
Three Traits of Effective Learning Vendor Management
1. Onboarding to align learning vendors with processes and culture
2. Establishing clear financial and nonfinancial performance expectations
3. Applying other internal functions’ best practices based on their vendor experiences
Three Traits of Ineffective Learning Vendor Management
1. Incorrect assignment of vendor management activities
2. No formalized and adaptable vendor performance expectations
3. Repeated mistakes by internal functions that do not share experiences with vendors
Find these resources on clc.executiveboard.com.
L&D Executives Prioritizing Spending on Outsourced Courses in 2015
1 AssessDiscuss these questions at your next team meeting.
■ How are we working to actively manage relationships with our learning vendors?
■ What traits signal effective or ineffective learning vendor management? Which should we be measuring?
2 Plan Find the right best practice.
■ Create a structure for vendor relationship management that enables effective division of labor, like Unisys did.
■ Help L&D staff manage the most critical vendor management risks over the course of the vendor life cycle, like CIBC did.
3 Execute Drive and embed change.
■ Assess vendor performance using our Ongoing Vendor Assessment Scorecard.
■ Use our Checklist and Template for Effective SLA Creation.
Risk: HR Struggles with Its Unproductive Vendor Relationships Outsourcing more L&D course design can cost less, increase the quality of L&D offerings, and speed L&D’s delivery of content to employees. Yet more than half of the potential value created through outsourcing can be lost if poor organizational communication and vendor oversight impede the L&D–vendor relationship.14 As L&D’s outsourcing spend increases, so does the risk that potential value will be lost.
What the Best Companies Do™
Most organizations set expectations for vendor relationships up front, providing minimal oversight once a contract is signed. However, the best companies actively manage vendor relationships by assigning vendor management responsibilities, building vendor management capabilities, and quantifying vendor investments. Tactically, HR teams onboard vendors to their organizations as if they were new employees—not only educating them on internal processes and culture but also setting clear expectations of what each party will provide.
Data Source14 CEB 2003 Strategic HR Outsourcing Survey.
Action Plan to Minimize This Risk
Learning and Development
16%
28%
48%
43%
36%
29%
2013
Decrease No Change Increase
2014
2015
13%49%
38%
15 © 2015 CEB. All rights reserved. CLC1697515SYNwww.executiveboard.com 16
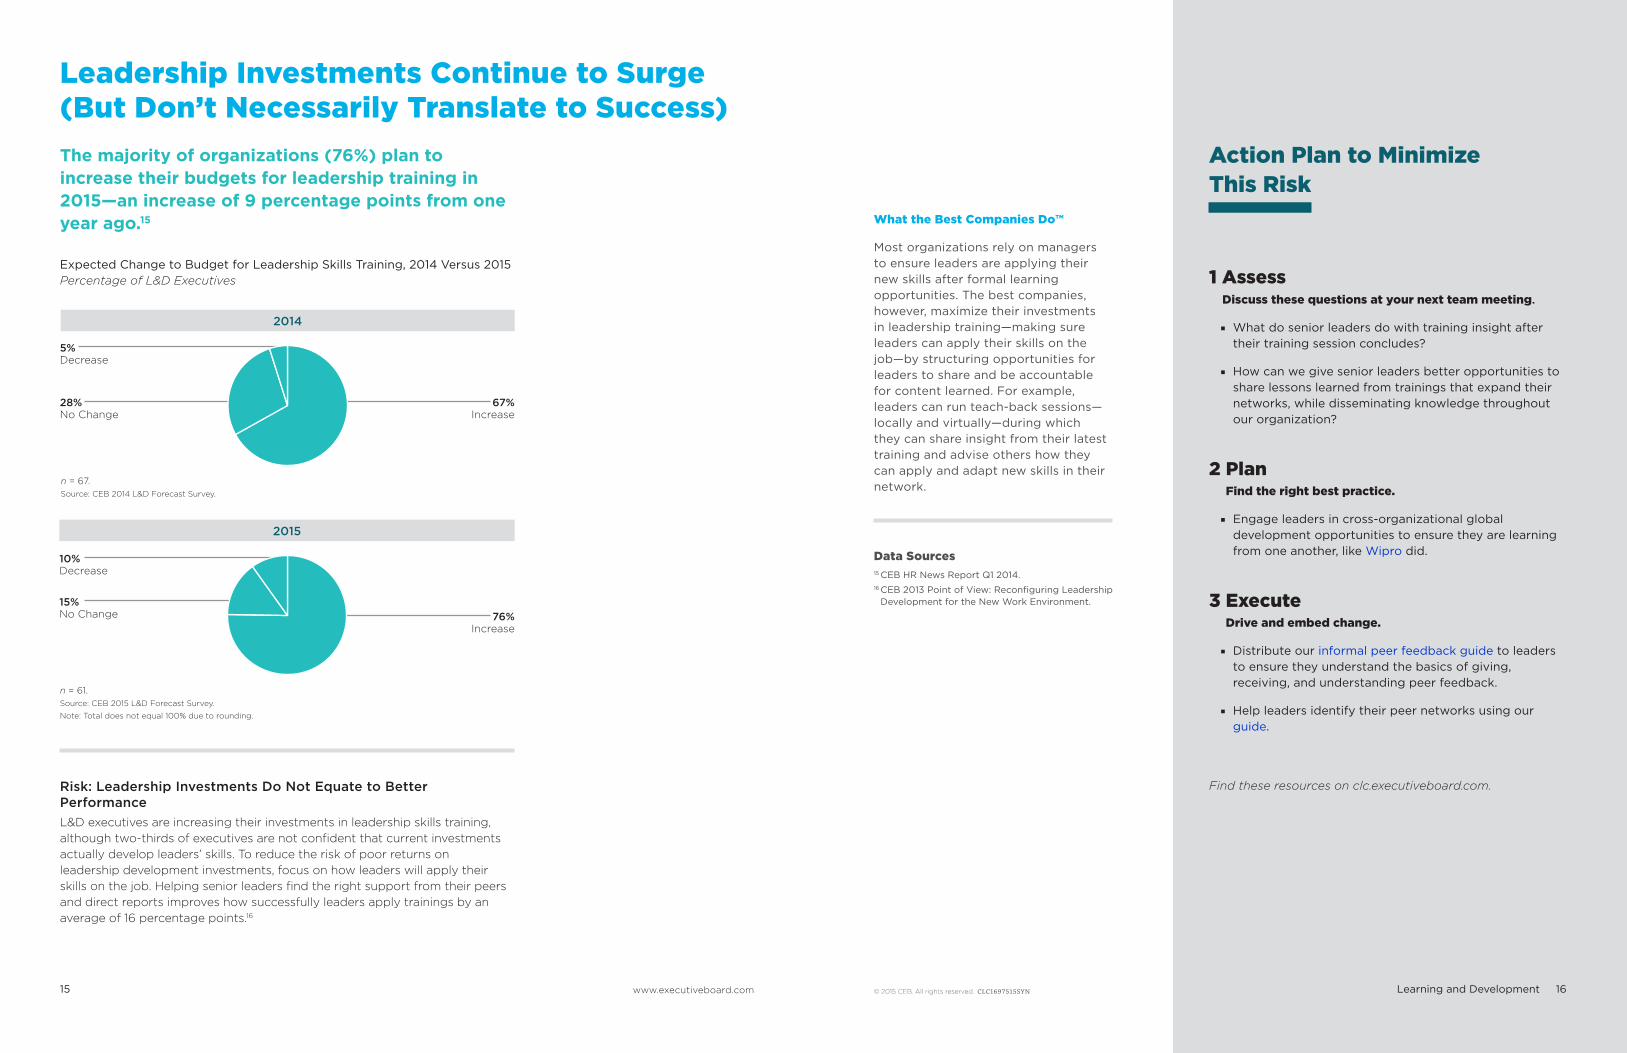
The majority of organizations (76%) plan to increase their budgets for leadership training in 2015—an increase of 9 percentage points from one year ago.15
Expected Change to Budget for Leadership Skills Training, 2014 Versus 2015Percentage of L&D Executives
n = 67.Source: CEB 2014 L&D Forecast Survey.
Find these resources on clc.executiveboard.com.
Leadership Investments Continue to Surge (But Don’t Necessarily Translate to Success)
1 AssessDiscuss these questions at your next team meeting.
■ What do senior leaders do with training insight after their training session concludes?
■ How can we give senior leaders better opportunities to share lessons learned from trainings that expand their networks, while disseminating knowledge throughout our organization?
2 Plan Find the right best practice.
■ Engage leaders in cross-organizational global development opportunities to ensure they are learning from one another, like Wipro did.
3 Execute Drive and embed change.
■ Distribute our informal peer feedback guide to leaders to ensure they understand the basics of giving, receiving, and understanding peer feedback.
■ Help leaders identify their peer networks using our guide.
Risk: Leadership Investments Do Not Equate to Better PerformanceL&D executives are increasing their investments in leadership skills training, although two-thirds of executives are not confident that current investments actually develop leaders’ skills. To reduce the risk of poor returns on leadership development investments, focus on how leaders will apply their skills on the job. Helping senior leaders find the right support from their peers and direct reports improves how successfully leaders apply trainings by an average of 16 percentage points.16
What the Best Companies Do™
Most organizations rely on managers to ensure leaders are applying their new skills after formal learning opportunities. The best companies, however, maximize their investments in leadership training—making sure leaders can apply their skills on the job—by structuring opportunities for leaders to share and be accountable for content learned. For example, leaders can run teach-back sessions—locally and virtually—during which they can share insight from their latest training and advise others how they can apply and adapt new skills in their network.
Data Sources15 CEB HR News Report Q1 2014.16 CEB 2013 Point of View: Reconfiguring Leadership
Development for the New Work Environment.
Action Plan to Minimize This Risk
Learning and Development
2014
2015
5% Decrease
28% No Change
67% Increase
n = 61.Source: CEB 2015 L&D Forecast Survey.
Note: Total does not equal 100% due to rounding.
10% Decrease
15% No Change 76%
Increase
17 © 2015 CEB. All rights reserved. CLC1697515SYNwww.executiveboard.com 18
Find these resources on clc.executiveboard.com.
1 AssessDiscuss these questions at your next team meeting.
■ Can HRBPs articulate how their day-to-day work makes the business better?
■ Do current performance measurements incorporate the business unit’s talent outcomes and financial performance?
■ How are business leaders held accountable for partnering with their HRBPs?
2 Plan Find the right best practice.
■ Instead of providing direct answers to decision makers’ complex talent decisions, help them arrive at their own analytic conclusions, like Seagate did.
■ Deploy HRBPs according to their individual potential to address and solve the business unit’s specific challenges, like Caterpillar did.
3 Execute Drive and embed change.
■ Identify the talent and organizational factors that affect specific business strategies by using our action toolkit.
■ Use the HR Business Alignment Tool to identify the best opportunities to improve HR’s impact on the business.
■ Read our guide to help HRBPs structure conversations with line leaders so they can effectively translate business objectives into workforce strategy.
Risk: Duplicate Talent Solutions Focus on Business Unit—Instead of Enterprise—ImpactReporting directly into line leaders means HRBPs are primarily accountable for business unit—rather than enterprise—outcomes, often resulting in negative consequences for the entire organization. For example, HRBPs can duplicate efforts, creating similar “custom” development programs for their specific business units. To operate successfully in this situation, HRBPs must balance support with debate—enabling unique business unit decisions while accomplishing the firm-wide talent strategy.
What the Best Companies Do™
First, to ensure true partnership, the best HR executives explain to HRBPs that they should show decision makers the implications of their decisions rather than attempt to provide direct answers or HR mandates. Second, they protect this balanced support and debate by frequently rotating HRBPs from one business unit to another. HRBP rotational choices depend on an HRBP’s experience with addressing the individual challenges facing each business unit.
Data Source17 CEB 2013 HR Business Partner Survey.
Action Plan to Minimize This Risk
Organizational Design
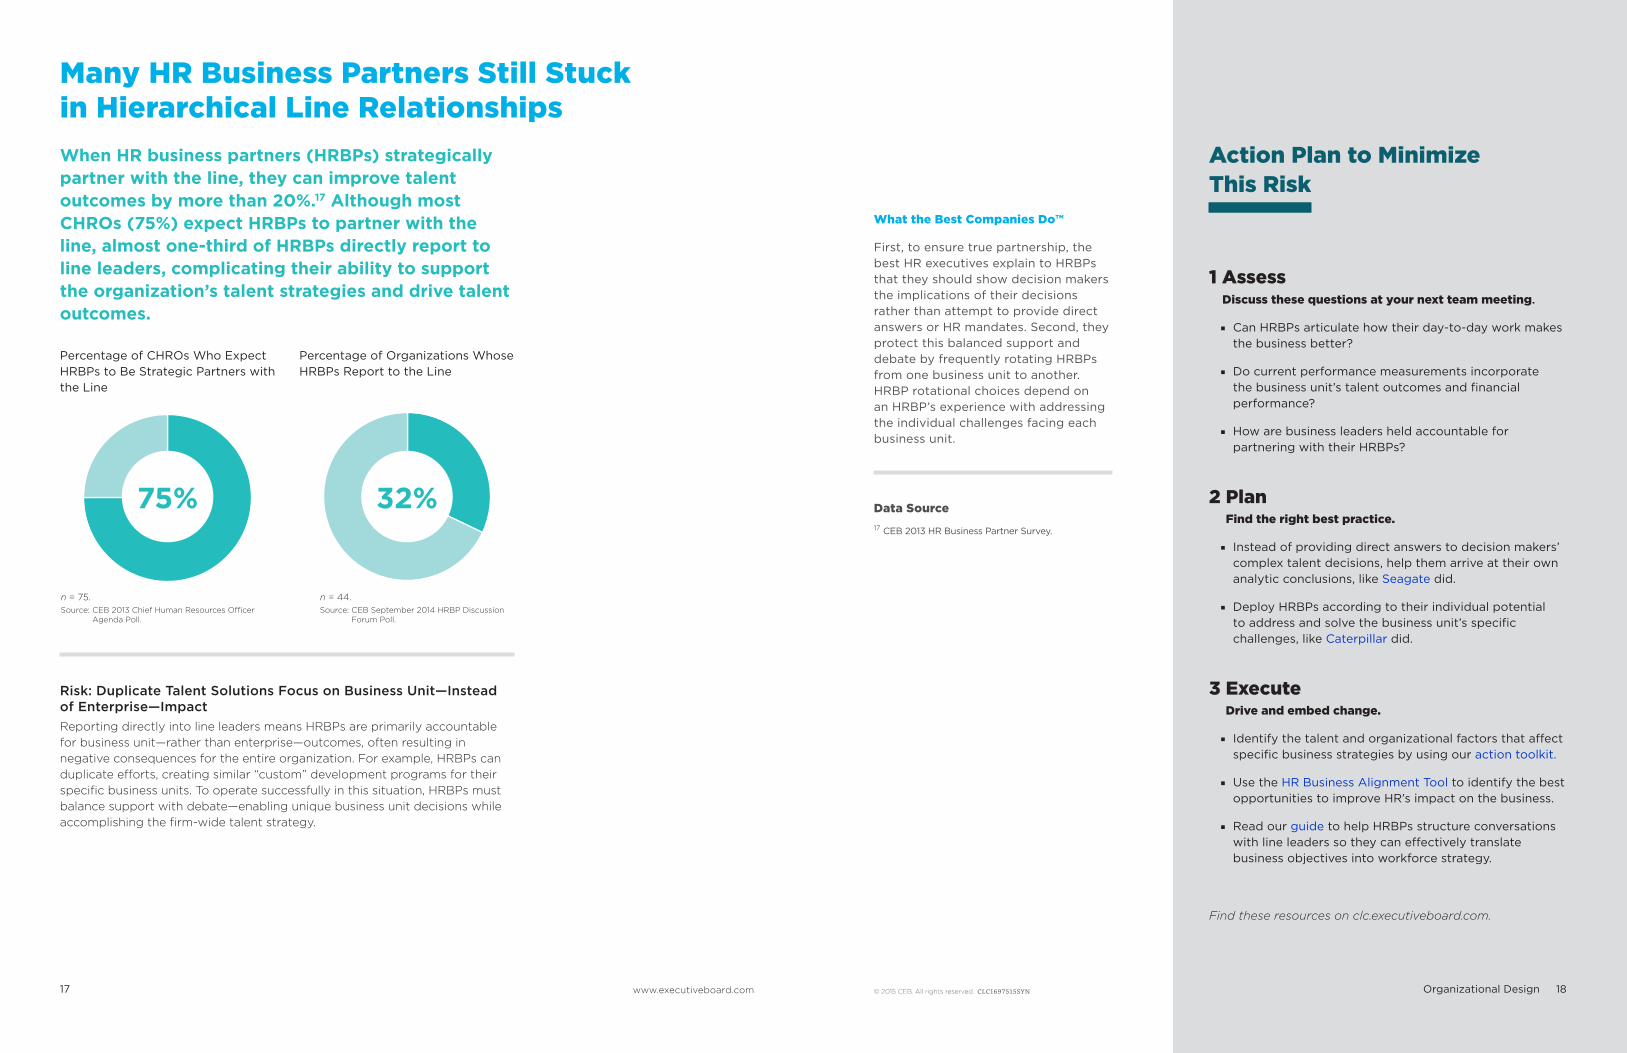
When HR business partners (HRBPs) strategically partner with the line, they can improve talent outcomes by more than 20%.17 Although most CHROs (75%) expect HRBPs to partner with the line, almost one-third of HRBPs directly report to line leaders, complicating their ability to support the organization’s talent strategies and drive talent outcomes.
Percentage of CHROs Who Expect HRBPs to Be Strategic Partners with the Line
Percentage of Organizations Whose HRBPs Report to the Line
n = 75.Source: CEB 2013 Chief Human Resources Officer
Agenda Poll.
n = 44.Source: CEB September 2014 HRBP Discussion
Forum Poll.
Many HR Business Partners Still Stuck in Hierarchical Line Relationships
75% 32%
19 © 2015 CEB. All rights reserved. CLC1697515SYNwww.executiveboard.com 20
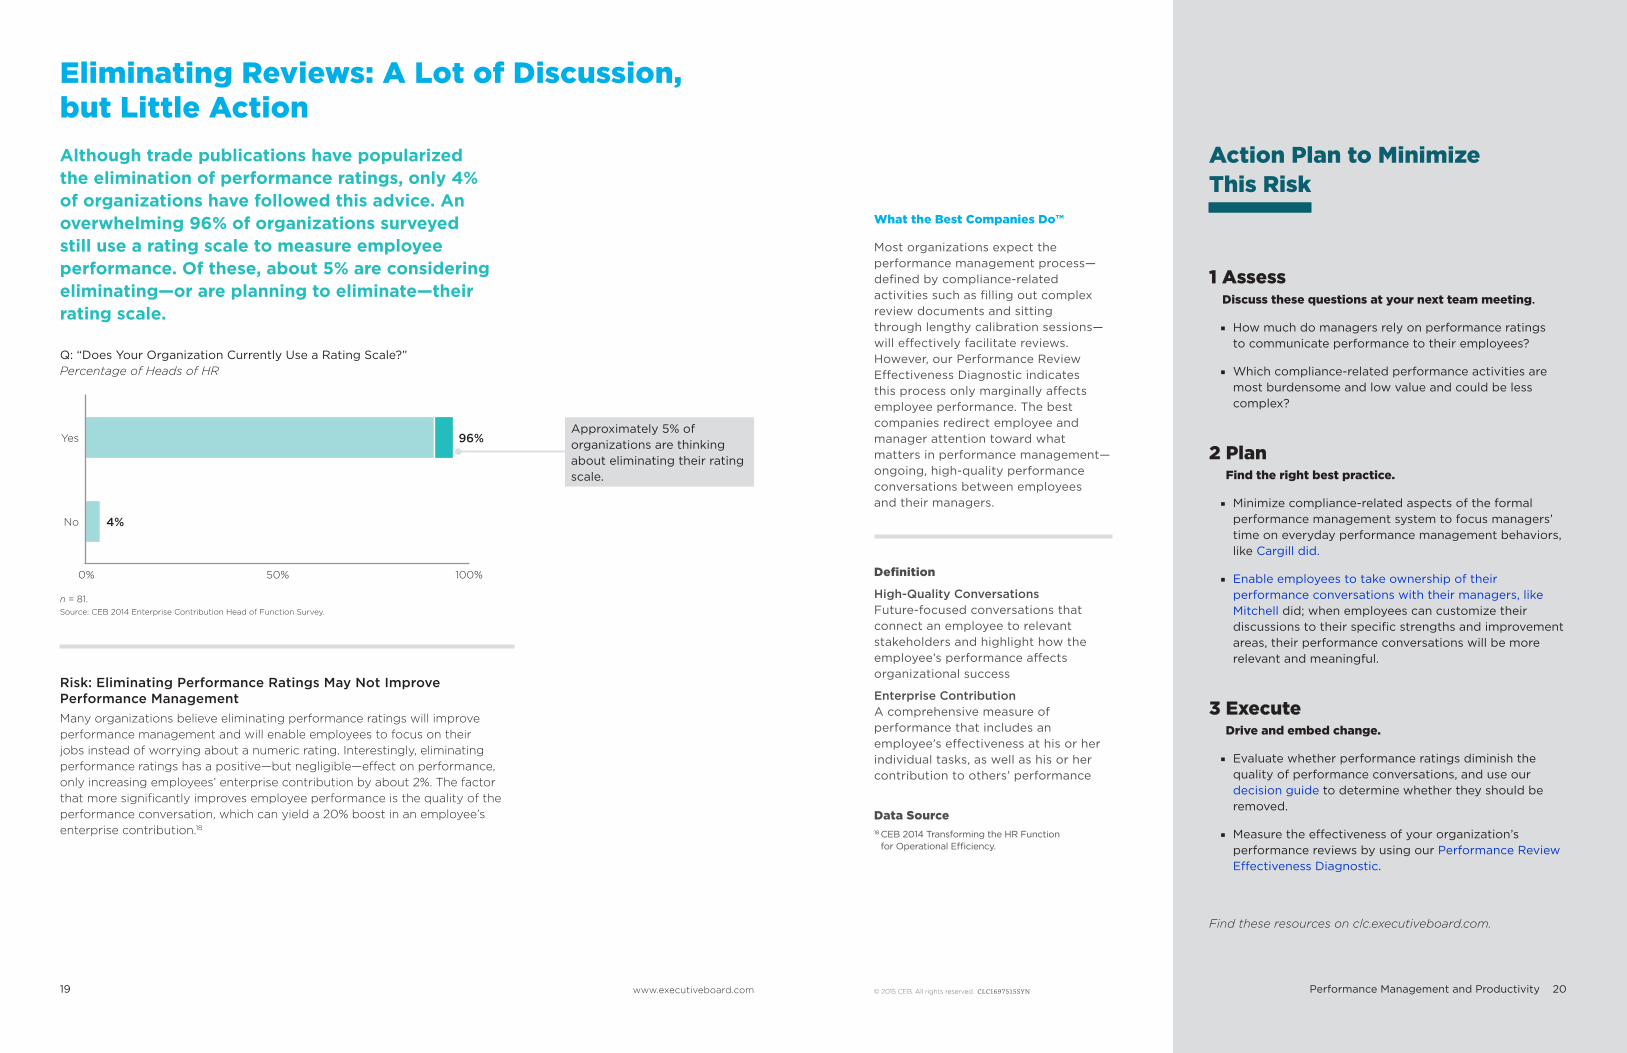
Although trade publications have popularized the elimination of performance ratings, only 4% of organizations have followed this advice. An overwhelming 96% of organizations surveyed still use a rating scale to measure employee performance. Of these, about 5% are considering eliminating—or are planning to eliminate—their rating scale.
Q: “Does Your Organization Currently Use a Rating Scale?”Percentage of Heads of HR
Approximately 5% of organizations are thinking about eliminating their rating scale.
Find these resources on clc.executiveboard.com.
Eliminating Reviews: A Lot of Discussion, but Little Action
1 AssessDiscuss these questions at your next team meeting.
■ How much do managers rely on performance ratings to communicate performance to their employees?
■ Which compliance-related performance activities are most burdensome and low value and could be less complex?
2 Plan Find the right best practice.
■ Minimize compliance-related aspects of the formal performance management system to focus managers’ time on everyday performance management behaviors, like Cargill did.
■ Enable employees to take ownership of their performance conversations with their managers, like Mitchell did; when employees can customize their discussions to their specific strengths and improvement areas, their performance conversations will be more relevant and meaningful.
3 Execute Drive and embed change.
■ Evaluate whether performance ratings diminish the quality of performance conversations, and use our decision guide to determine whether they should be removed.
■ Measure the effectiveness of your organization’s performance reviews by using our Performance Review Effectiveness Diagnostic.
Risk: Eliminating Performance Ratings May Not Improve Performance ManagementMany organizations believe eliminating performance ratings will improve performance management and will enable employees to focus on their jobs instead of worrying about a numeric rating. Interestingly, eliminating performance ratings has a positive—but negligible—effect on performance, only increasing employees’ enterprise contribution by about 2%. The factor that more significantly improves employee performance is the quality of the performance conversation, which can yield a 20% boost in an employee’s enterprise contribution.18
What the Best Companies Do™
Most organizations expect the performance management process—defined by compliance-related activities such as filling out complex review documents and sitting through lengthy calibration sessions—will effectively facilitate reviews. However, our Performance Review Effectiveness Diagnostic indicates this process only marginally affects employee performance. The best companies redirect employee and manager attention toward what matters in performance management—ongoing, high-quality performance conversations between employees and their managers.
Definition
High-Quality ConversationsFuture-focused conversations that connect an employee to relevant stakeholders and highlight how the employee’s performance affects organizational success
Enterprise ContributionA comprehensive measure of performance that includes an employee’s effectiveness at his or her individual tasks, as well as his or her contribution to others’ performance
Data Source18 CEB 2014 Transforming the HR Function
for Operational Efficiency.
Action Plan to Minimize This Risk
Performance Management and Productivity
n = 81.Source: CEB 2014 Enterprise Contribution Head of Function Survey.
0% 50% 100%
Yes
No
96%
4%
21 © 2015 CEB. All rights reserved. CLC1697515SYNwww.executiveboard.com 22
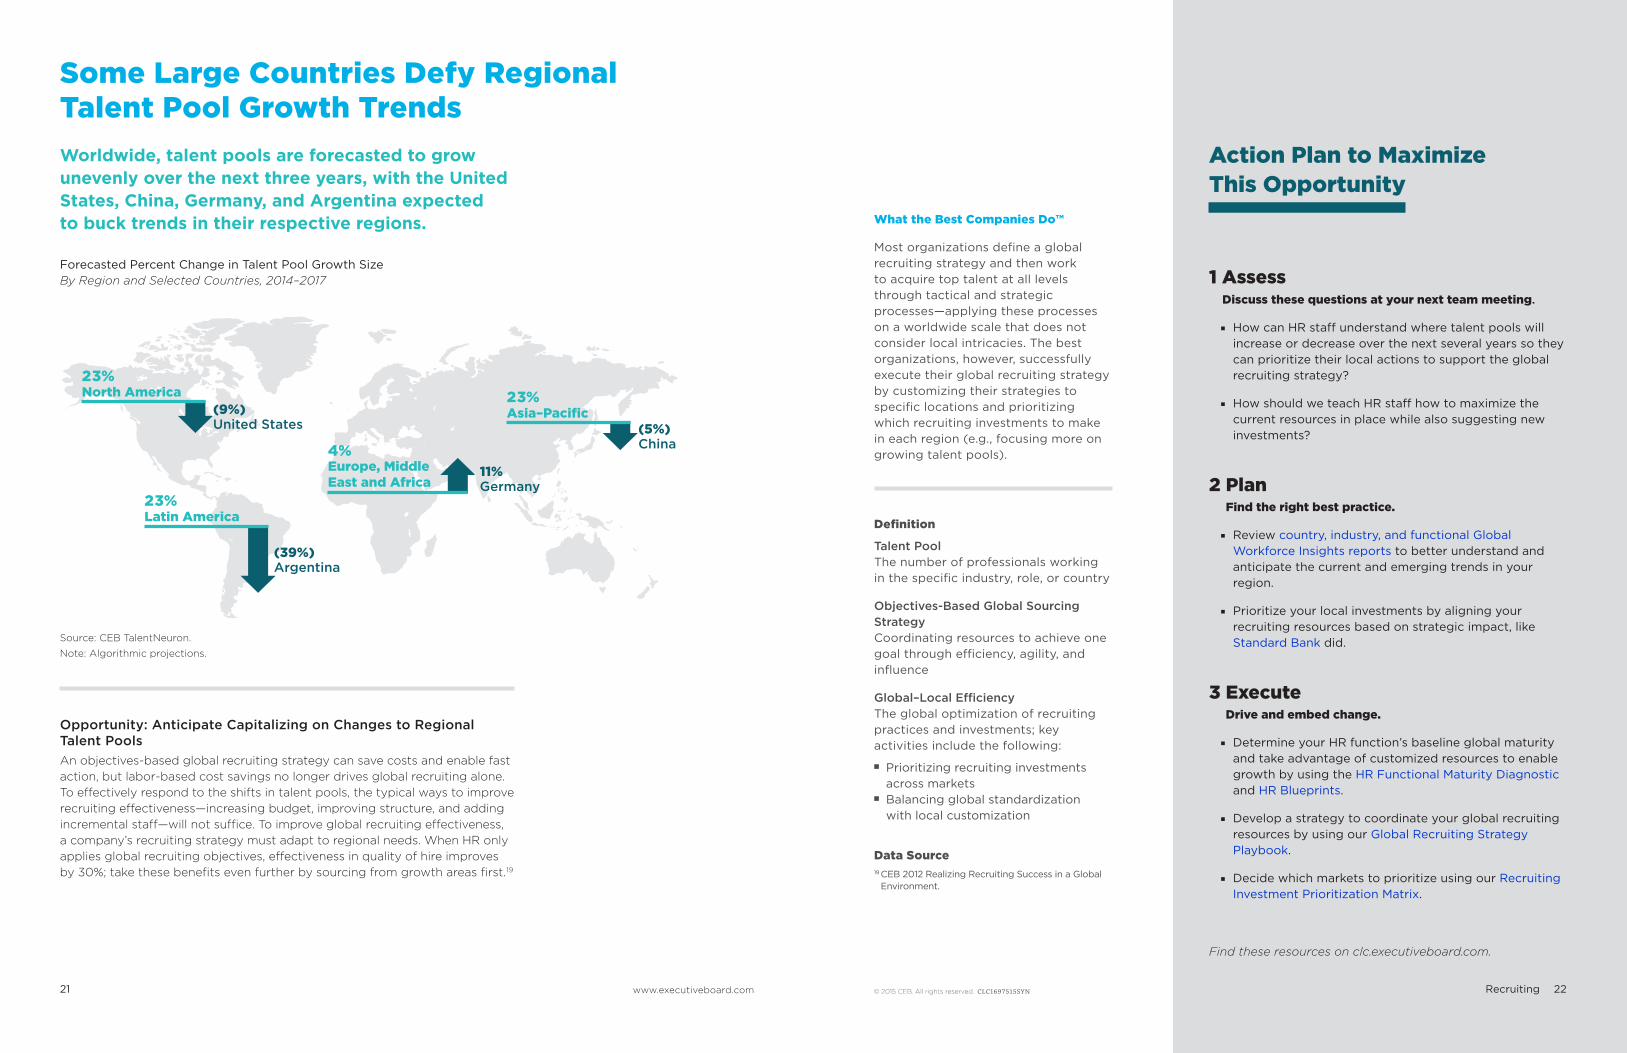
Worldwide, talent pools are forecasted to grow unevenly over the next three years, with the United States, China, Germany, and Argentina expected to buck trends in their respective regions.
Forecasted Percent Change in Talent Pool Growth SizeBy Region and Selected Countries, 2014–2017
Find these resources on clc.executiveboard.com.
Some Large Countries Defy Regional Talent Pool Growth Trends
1 AssessDiscuss these questions at your next team meeting.
■ How can HR staff understand where talent pools will increase or decrease over the next several years so they can prioritize their local actions to support the global recruiting strategy?
■ How should we teach HR staff how to maximize the current resources in place while also suggesting new investments?
2 Plan Find the right best practice.
■ Review country, industry, and functional Global Workforce Insights reports to better understand and anticipate the current and emerging trends in your region.
■ Prioritize your local investments by aligning your recruiting resources based on strategic impact, like Standard Bank did.
3 Execute Drive and embed change.
■ Determine your HR function’s baseline global maturity and take advantage of customized resources to enable growth by using the HR Functional Maturity Diagnostic and HR Blueprints.
■ Develop a strategy to coordinate your global recruiting resources by using our Global Recruiting Strategy Playbook.
■ Decide which markets to prioritize using our Recruiting Investment Prioritization Matrix.
What the Best Companies Do™
Most organizations define a global recruiting strategy and then work to acquire top talent at all levels through tactical and strategic processes—applying these processes on a worldwide scale that does not consider local intricacies. The best organizations, however, successfully execute their global recruiting strategy by customizing their strategies to specific locations and prioritizing which recruiting investments to make in each region (e.g., focusing more on growing talent pools).
Definition
Talent PoolThe number of professionals working in the specific industry, role, or country
Objectives-Based Global Sourcing StrategyCoordinating resources to achieve one goal through efficiency, agility, and influence
Global–Local EfficiencyThe global optimization of recruiting practices and investments; key activities include the following:
■ Prioritizing recruiting investments across markets
■ Balancing global standardization with local customization
Data Source19 CEB 2012 Realizing Recruiting Success in a Global
Environment.
Action Plan to Maximize This Opportunity
Recruiting
Source: CEB TalentNeuron.
Note: Algorithmic projections.
Latin America23%
(39%)Argentina
North America23%
(9%)United States
Europe, Middle East and Africa
4%11%Germany
Asia–Pacific23%
(5%)China
Opportunity: Anticipate Capitalizing on Changes to Regional Talent PoolsAn objectives-based global recruiting strategy can save costs and enable fast action, but labor-based cost savings no longer drives global recruiting alone. To effectively respond to the shifts in talent pools, the typical ways to improve recruiting effectiveness—increasing budget, improving structure, and adding incremental staff—will not suffice. To improve global recruiting effectiveness, a company’s recruiting strategy must adapt to regional needs. When HR only applies global recruiting objectives, effectiveness in quality of hire improves by 30%; take these benefits even further by sourcing from growth areas first.19
23 © 2015 CEB. All rights reserved. CLC1697515SYNwww.executiveboard.com 24
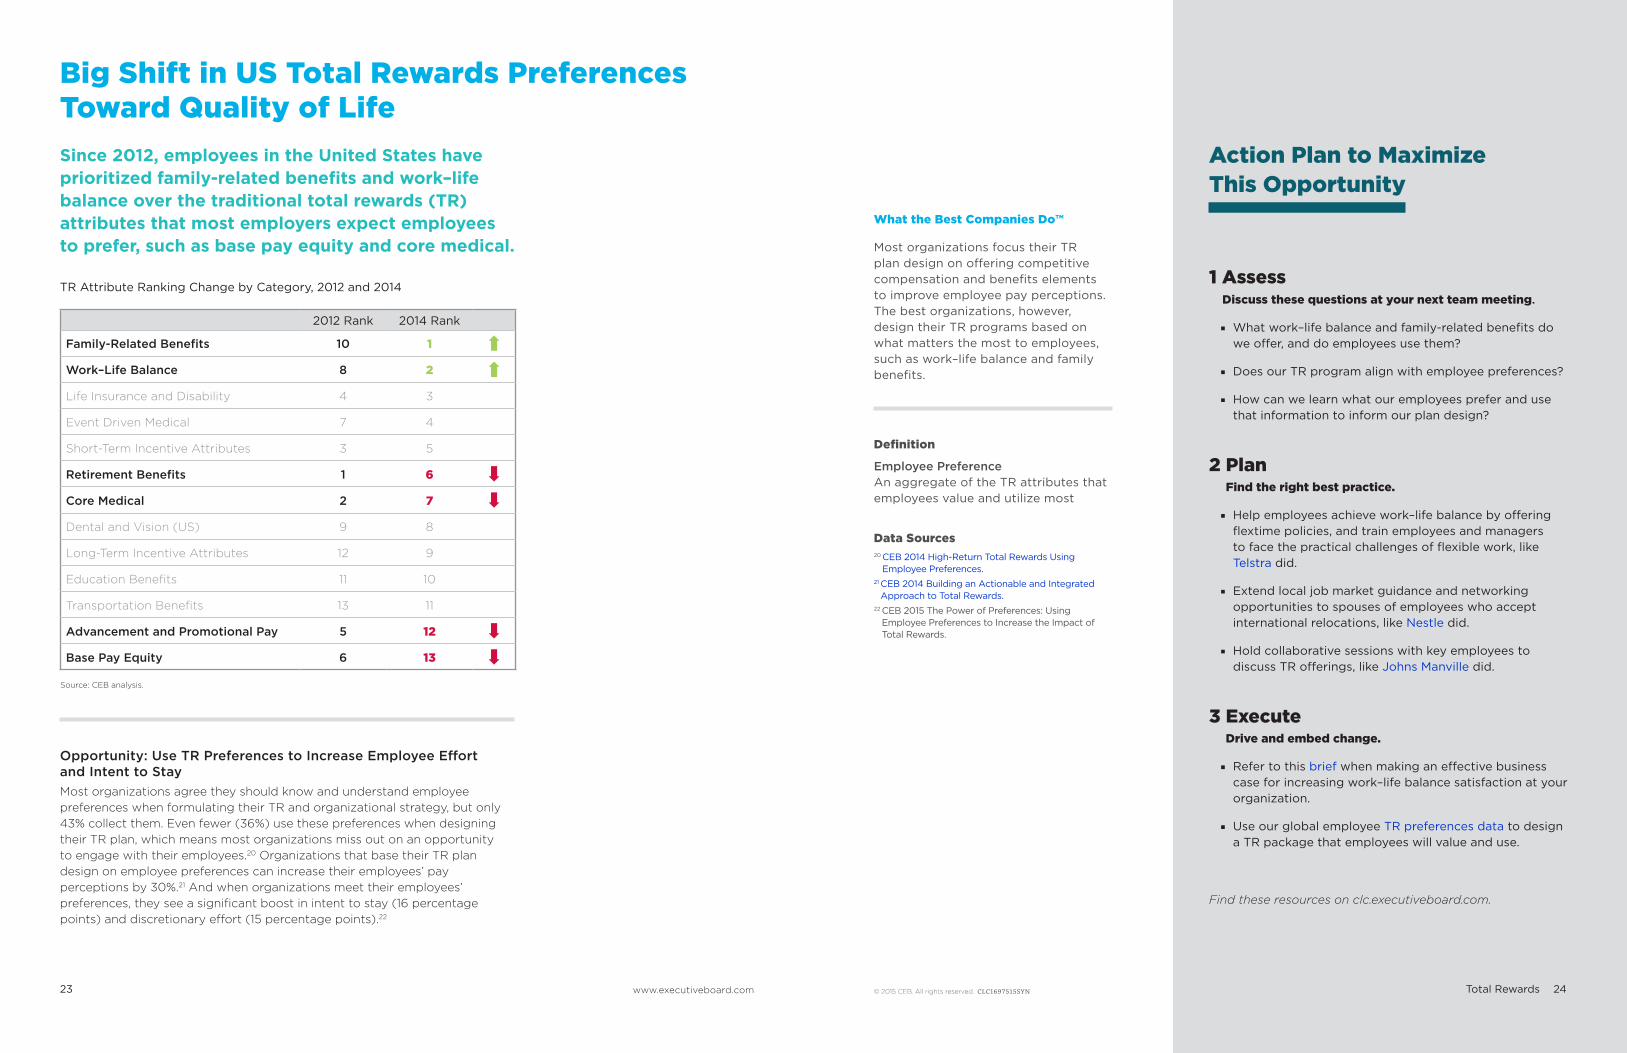
Since 2012, employees in the United States have prioritized family-related benefits and work–life balance over the traditional total rewards (TR) attributes that most employers expect employees to prefer, such as base pay equity and core medical.
TR Attribute Ranking Change by Category, 2012 and 2014
Source: CEB analysis.
Find these resources on clc.executiveboard.com.
Big Shift in US Total Rewards Preferences Toward Quality of Life
1 AssessDiscuss these questions at your next team meeting.
■ What work–life balance and family-related benefits do we offer, and do employees use them?
■ Does our TR program align with employee preferences?
■ How can we learn what our employees prefer and use that information to inform our plan design?
2 Plan Find the right best practice.
■ Help employees achieve work–life balance by offering flextime policies, and train employees and managers to face the practical challenges of flexible work, like Telstra did.
■ Extend local job market guidance and networking opportunities to spouses of employees who accept international relocations, like Nestle did.
■ Hold collaborative sessions with key employees to discuss TR offerings, like Johns Manville did.
3 Execute Drive and embed change.
■ Refer to this brief when making an effective business case for increasing work–life balance satisfaction at your organization.
■ Use our global employee TR preferences data to design a TR package that employees will value and use.
Opportunity: Use TR Preferences to Increase Employee Effort and Intent to StayMost organizations agree they should know and understand employee preferences when formulating their TR and organizational strategy, but only 43% collect them. Even fewer (36%) use these preferences when designing their TR plan, which means most organizations miss out on an opportunity to engage with their employees.20 Organizations that base their TR plan design on employee preferences can increase their employees’ pay perceptions by 30%.21 And when organizations meet their employees’ preferences, they see a significant boost in intent to stay (16 percentage points) and discretionary effort (15 percentage points).22
What the Best Companies Do™
Most organizations focus their TR plan design on offering competitive compensation and benefits elements to improve employee pay perceptions. The best organizations, however, design their TR programs based on what matters the most to employees, such as work–life balance and family benefits.
Definition
Employee PreferenceAn aggregate of the TR attributes that employees value and utilize most
Data Sources20 CEB 2014 High-Return Total Rewards Using
Employee Preferences.21 CEB 2014 Building an Actionable and Integrated
Approach to Total Rewards.22 CEB 2015 The Power of Preferences: Using
Employee Preferences to Increase the Impact of Total Rewards.
Action Plan to Maximize This Opportunity
Total Rewards
2012 Rank 2014 Rank
Family-Related Benefits 10 1
Work–Life Balance 8 2
Life Insurance and Disability 4 3
Event Driven Medical 7 4
Short-Term Incentive Attributes 3 5
Retirement Benefits 1 6
Core Medical 2 7
Dental and Vision (US) 9 8
Long-Term Incentive Attributes 12 9
Education Benefits 11 10
Transportation Benefits 13 11
Advancement and Promotional Pay 5 12
Base Pay Equity 6 13
25 © 2015 CEB. All rights reserved. CLC1697515SYNwww.executiveboard.com 26
0.0
45.0
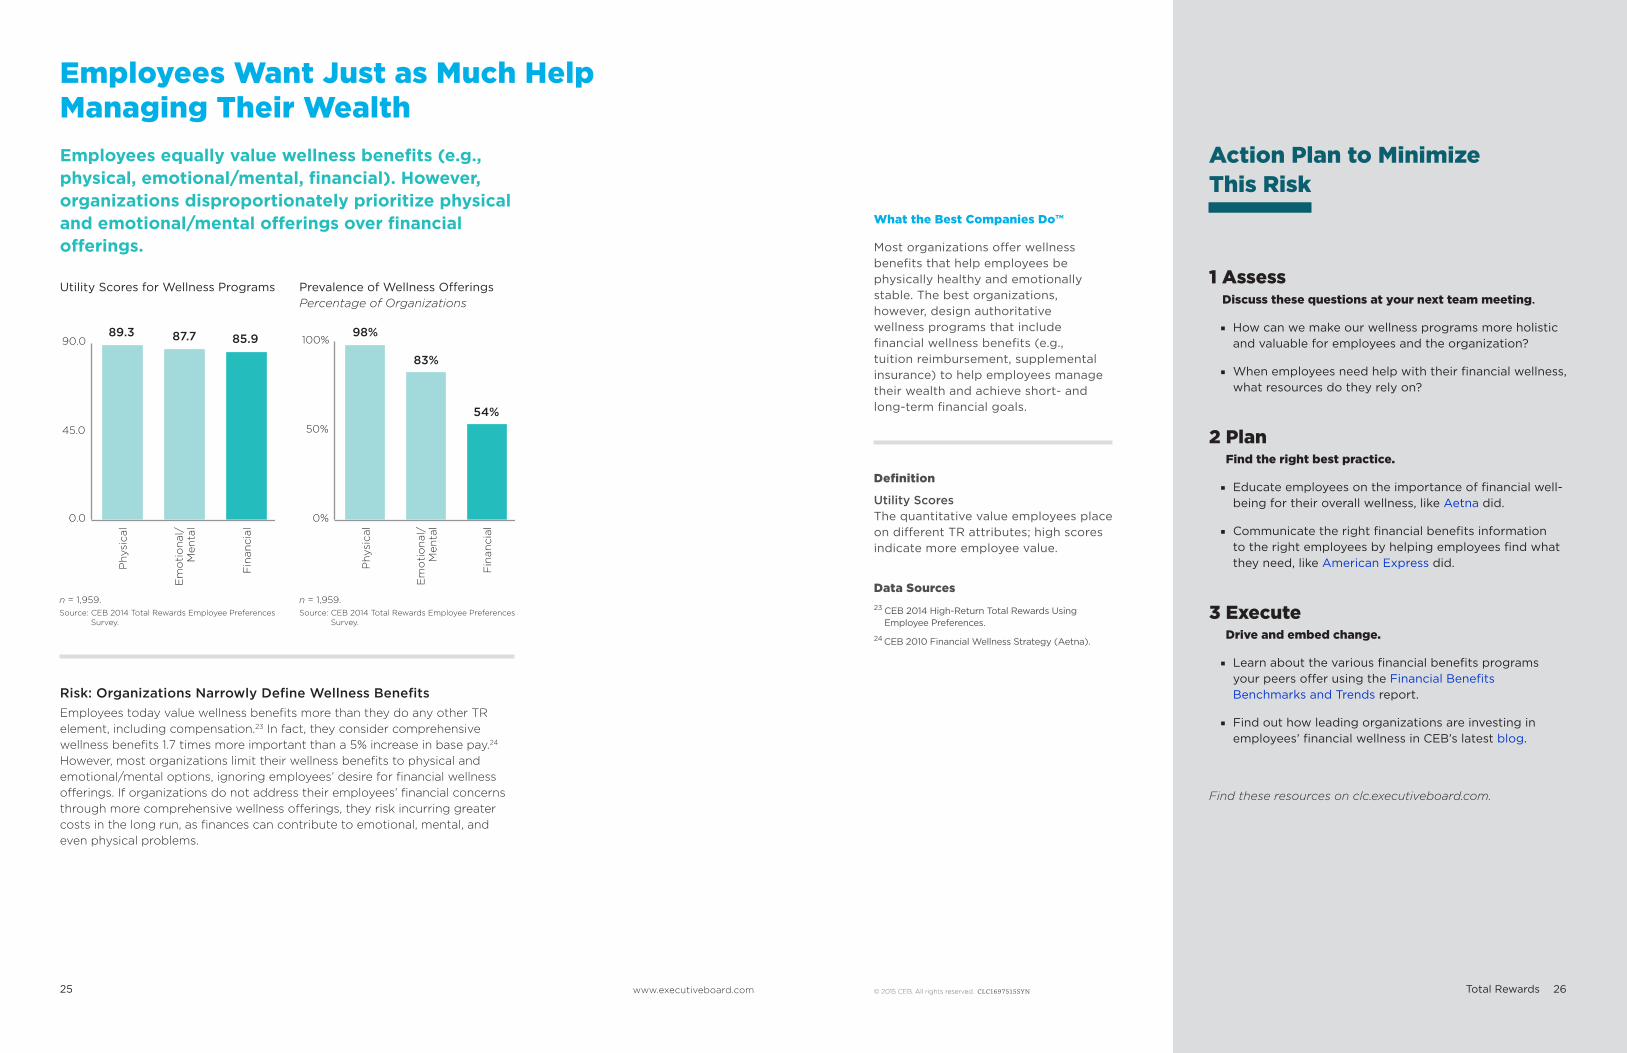
90.089.3 87.7 85.9
Employees equally value wellness benefits (e.g., physical, emotional/mental, financial). However, organizations disproportionately prioritize physical and emotional/mental offerings over financial offerings.
Utility Scores for Wellness Programs Prevalence of Wellness OfferingsPercentage of Organizations
n = 1,959.Source: CEB 2014 Total Rewards Employee Preferences
Survey.
n = 1,959.Source: CEB 2014 Total Rewards Employee Preferences
Survey.
Find these resources on clc.executiveboard.com.
Employees Want Just as Much Help Managing Their Wealth
1 AssessDiscuss these questions at your next team meeting.
■ How can we make our wellness programs more holistic and valuable for employees and the organization?
■ When employees need help with their financial wellness, what resources do they rely on?
2 Plan Find the right best practice.
■ Educate employees on the importance of financial well-being for their overall wellness, like Aetna did.
■ Communicate the right financial benefits information to the right employees by helping employees find what they need, like American Express did.
3 Execute Drive and embed change.
■ Learn about the various financial benefits programs your peers offer using the Financial Benefits Benchmarks and Trends report.
■ Find out how leading organizations are investing in employees’ financial wellness in CEB’s latest blog.
Risk: Organizations Narrowly Define Wellness Benefits Employees today value wellness benefits more than they do any other TR element, including compensation.23 In fact, they consider comprehensive wellness benefits 1.7 times more important than a 5% increase in base pay.24 However, most organizations limit their wellness benefits to physical and emotional/mental options, ignoring employees’ desire for financial wellness offerings. If organizations do not address their employees’ financial concerns through more comprehensive wellness offerings, they risk incurring greater costs in the long run, as finances can contribute to emotional, mental, and even physical problems.
What the Best Companies Do™
Most organizations offer wellness benefits that help employees be physically healthy and emotionally stable. The best organizations, however, design authoritative wellness programs that include financial wellness benefits (e.g., tuition reimbursement, supplemental insurance) to help employees manage their wealth and achieve short- and long-term financial goals.
Definition
Utility ScoresThe quantitative value employees place on different TR attributes; high scores indicate more employee value.
Data Sources23 CEB 2014 High-Return Total Rewards Using
Employee Preferences.
24 CEB 2010 Financial Wellness Strategy (Aetna).
Action Plan to Minimize This Risk
Total Rewards
Phy
sica
l
Phy
sica
l
Em
oti
on
al/
Men
tal
Em
oti
on
al/
Men
tal
Fin
anci
al
Fin
anci
al
0%
50%
100%98%
83%
54%
27 © 2015 CEB. All rights reserved. CLC1697515SYNwww.executiveboard.com 28
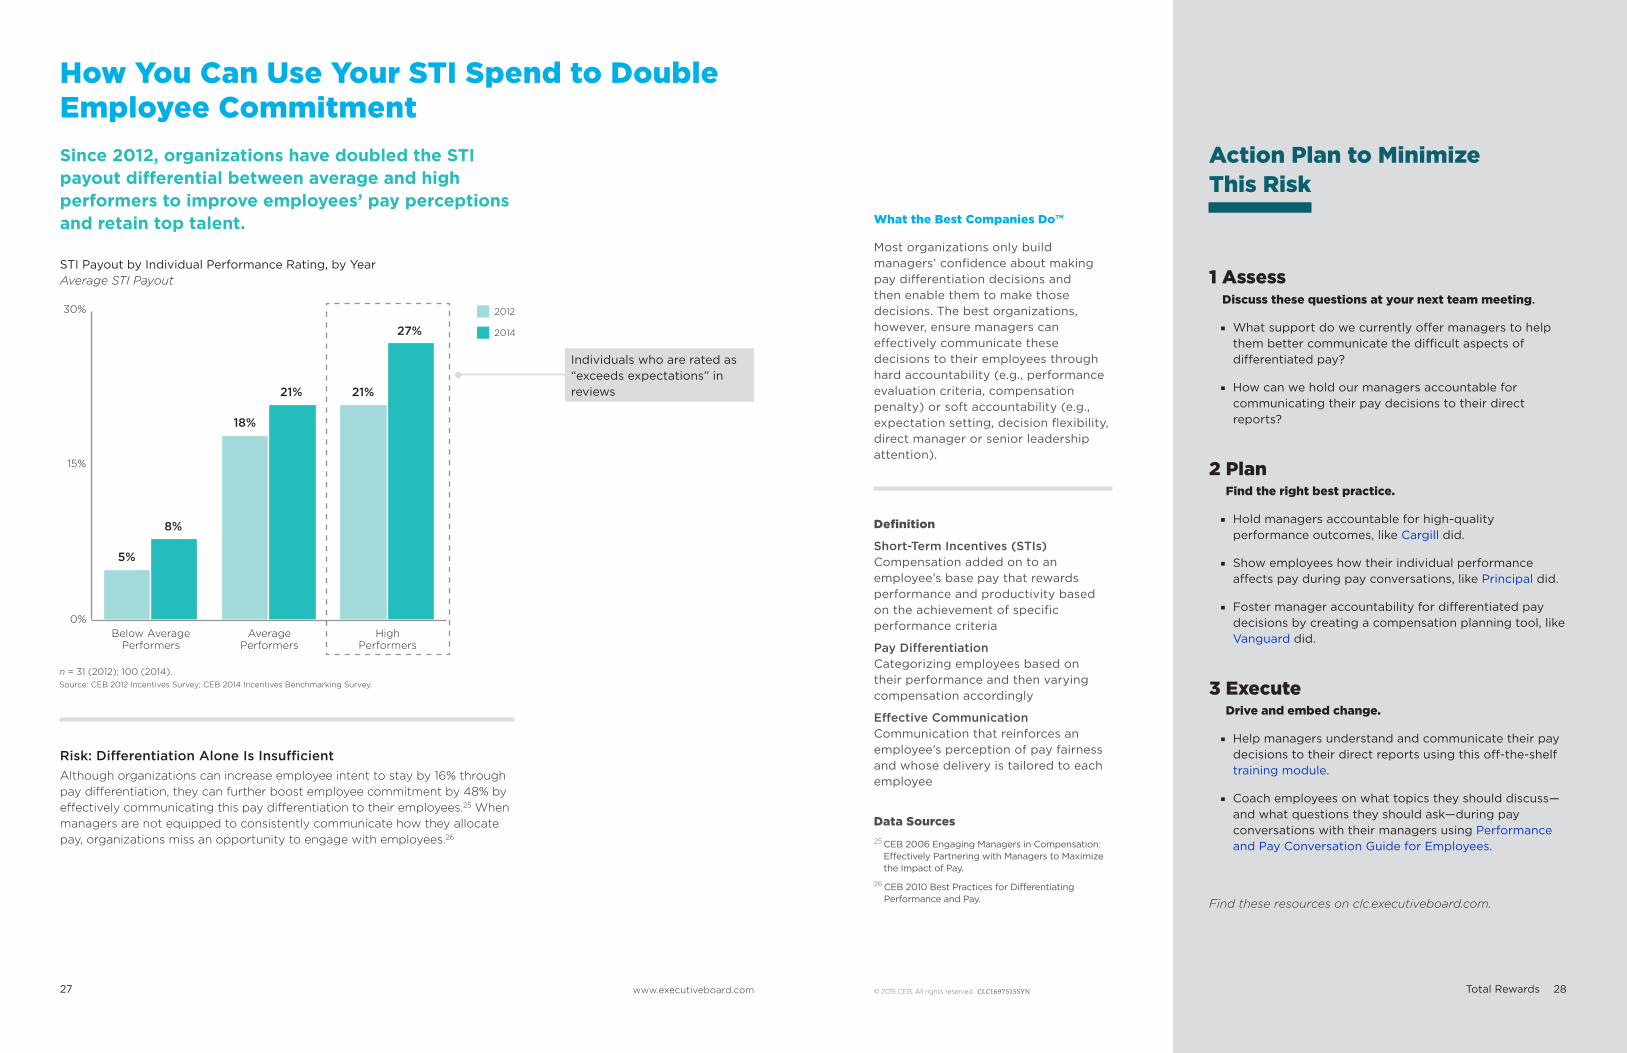
Since 2012, organizations have doubled the STI payout differential between average and high performers to improve employees’ pay perceptions and retain top talent.
STI Payout by Individual Performance Rating, by YearAverage STI Payout
n = 31 (2012); 100 (2014).Source: CEB 2012 Incentives Survey; CEB 2014 Incentives Benchmarking Survey.
Find these resources on clc.executiveboard.com.
How You Can Use Your STI Spend to Double Employee Commitment
1 AssessDiscuss these questions at your next team meeting.
■ What support do we currently offer managers to help them better communicate the difficult aspects of differentiated pay?
■ How can we hold our managers accountable for communicating their pay decisions to their direct reports?
2 Plan Find the right best practice.
■ Hold managers accountable for high-quality performance outcomes, like Cargill did.
■ Show employees how their individual performance affects pay during pay conversations, like Principal did.
■ Foster manager accountability for differentiated pay decisions by creating a compensation planning tool, like Vanguard did.
3 Execute Drive and embed change.
■ Help managers understand and communicate their pay decisions to their direct reports using this off-the-shelf training module.
■ Coach employees on what topics they should discuss—and what questions they should ask—during pay conversations with their managers using Performance and Pay Conversation Guide for Employees.
Risk: Differentiation Alone Is InsufficientAlthough organizations can increase employee intent to stay by 16% through pay differentiation, they can further boost employee commitment by 48% by effectively communicating this pay differentiation to their employees.25 When managers are not equipped to consistently communicate how they allocate pay, organizations miss an opportunity to engage with employees.26
What the Best Companies Do™
Most organizations only build managers’ confidence about making pay differentiation decisions and then enable them to make those decisions. The best organizations, however, ensure managers can effectively communicate these decisions to their employees through hard accountability (e.g., performance evaluation criteria, compensation penalty) or soft accountability (e.g., expectation setting, decision flexibility, direct manager or senior leadership attention).
Definition
Short-Term Incentives (STIs) Compensation added on to an employee’s base pay that rewards performance and productivity based on the achievement of specific performance criteria
Pay Differentiation Categorizing employees based on their performance and then varying compensation accordingly
Effective Communication Communication that reinforces an employee’s perception of pay fairness and whose delivery is tailored to each employee
Data Sources25 CEB 2006 Engaging Managers in Compensation:
Effectively Partnering with Managers to Maximize the Impact of Pay.
26 CEB 2010 Best Practices for Differentiating Performance and Pay.
Action Plan to Minimize This Risk
Total Rewards
2012
2014
0%
15%
30%
5%
8%
18%
21% 21%
27%
Below Average Performers
Average Performers
High Performers
Individuals who are rated as “exceeds expectations” in reviews
Topic Goes Here
THE CHRO INSIGHT SERIES
CEB CORPORATE LEADERSHIP COUNCIL™
www.clc.executiveboard.com
+1-571-303-3000 (North America)
+44-(0)20-7632-6000 (Europe, Middle East, and Africa)
+61-(0)2-9321-7500 (Asia–Pacific)
CHRO QUARTERLY MAGAZINE
Business insights and implications for heads of HR on leading their organization and HR function, featuring personal stories from leading HR executives
GLOBAL WORKFORCE INSIGHTS REPORT
Quarterly workforce insights on global and country-level changes about what attracts, engages, and retains employees, based on data from 18,000+ employees in 20+ countries
CHRO VIDEO SERIES
Personal insights from leading heads of HR on the most important relationships and activities CHROs must manage
HR NEWS REPORT
Quarterly functional insights on advances, challenges, and opportunities in HR categorized by 10 key functional areas
www.executiveboard.com© 2015 CEB. All rights reserved. CLC1697515SYN