Embed Size (px)
Citation preview

HRM, organisational
performance and the
role of firm size
Fons Kortekaas (260214)
December 2007
Coordinator: Dr. A. van Stel
Co-reader: Drs. P. van der Zwan
Erasmus School of Economics
Department of Entrepreneurship, Governance, Organisation & Strategy
Master Entrepreneurship, Strategy & Organisation Economics

HRM, organisational performance and the role of firm size
Master thesis Business & Economics 2
Preface
Labour is often considered as a cost instead of a resource. This negative perspective is due to
a lack of insight in the returns a company will receive from labour. Labour will only be
accepted as a resource, which has to be maximized, if it can be reflected by indicators of
employee performance that are linked to a company’s operational and financial performance.
Then, HR policy will be aimed at investments in employees in order to create value for an
organisation. The high performance work system appears to be such an investment. This study
examines how the HPWS will add value in an organisation but, even more important, if it
applies for different types of organisations (in terms of firm size).
At last, a few words of appreciation to my coordinator and co-reader:
In het bijzonder ben ik dr. A. van Stel erkentelijk voor zijn inspirerende opmerkingen en onze
gesprekken waarin ik mijn gedachten mede heb kunnen vormen en aanscherpen. Drs. P. van
der Zwan bedank ik voor zijn bereidwilligheid om als meelezer op te treden.

HRM, organisational performance and the role of firm size
Master thesis Business & Economics 3
Table of contents
1. Introduction .......................................................................................................................... 5
2. Strategic HRM research ...................................................................................................... 8
2.1 Organisational performance ............................................................................................. 8
2.2 Human resource management .......................................................................................... 9
2.2.1 High performance work system (HPWS) ................................................................ 10
2.3 Theoretical framework ................................................................................................... 12
2.3.1 Employees’ characteristics ..................................................................................... 12
2.3.2 Behavioural outcomes ............................................................................................. 14
2.3.3 Operational performance ........................................................................................ 15
2.3.4 Financial performance ............................................................................................ 17
2.3.5 Theoretical framework ............................................................................................ 18
3. The role of firm size ........................................................................................................... 19
3.1 Literature review ............................................................................................................ 19
3.2 Discussion ...................................................................................................................... 21
3.3 Firm size effect on framework ....................................................................................... 21
3.3.1 HR practices in smaller firms.................................................................................. 22
3.3.2 Employees’ characteristics in smaller firms ........................................................... 23
3.3.3 Behavioural outcomes in smaller firms................................................................... 25
3.3.4 Operational performance in smaller firms.............................................................. 26
3.3.5 Financial performance in smaller firms.................................................................. 27
3.3.6 Adjusted theoretical framework .............................................................................. 28
4. Research methodology ....................................................................................................... 29
4.1 Preliminary remarks ....................................................................................................... 29
4.2 Hypotheses ..................................................................................................................... 30
4.2.1 Hypothesis 1 ............................................................................................................ 30
4.2.2 Hypothesis 2 ............................................................................................................ 31
4.2.3 Hypotheses 3 – 6 ..................................................................................................... 31
4.3 Sample............................................................................................................................ 32
4.4 Variables of interest ....................................................................................................... 34
4.5 Procedure........................................................................................................................ 39
4.5.1 Measuring instrument ............................................................................................. 39
4.5.2 Measuring time........................................................................................................ 40
4.5.3 Data collection ........................................................................................................ 41
4.6 Reliability and validity ................................................................................................... 42

HRM, organisational performance and the role of firm size
Master thesis Business & Economics 4
5. Analyses and results ........................................................................................................... 43
5.1 Univariate analyses ........................................................................................................ 43
5.2 Correlations .................................................................................................................... 50
5.2.1 Interpretation of results........................................................................................... 52
5.3 Firm size, firm age and HPWS....................................................................................... 52
5.3.1 Interpretation of results........................................................................................... 54
5.4 Analysis of hypotheses................................................................................................... 54
5.4.1 Path analysis ........................................................................................................... 54
5.4.1.1 Interpretation of results.................................................................................... 55
5.4.2 Hypotheses 1 and 3 – 6 ........................................................................................... 56
5.4.2.1 Interpretation of results.................................................................................... 58
5.4.3 Firm age and sector of industry in regressions....................................................... 60
5.4.3.1 Interpretation of results.................................................................................... 60
5.4.4 Hypothesis 2 ............................................................................................................ 62
5.4.4.1 Interpretation of results.................................................................................... 63
5.5 Summary of main results................................................................................................ 63
5.5.1 Discussion ............................................................................................................... 65
6. Conclusion........................................................................................................................... 67
6.1 Conclusions .................................................................................................................... 67
6.2 Limitations ..................................................................................................................... 71
6.3 Future research ............................................................................................................... 71
Appendices .............................................................................................................................. 72
A) Voluntary turnover formula ............................................................................................ 72
B) Items on HPWS practices................................................................................................ 73
C) Items on behavioural outcome variables ......................................................................... 75
D) Items on operational performance variables ................................................................... 80
E) Content of first e-mail ..................................................................................................... 82
F) Frequency distributions ................................................................................................... 83
G) Measures of central tendency and dispersion.................................................................. 88
H1) SPSS output of t-tests.................................................................................................... 90
H2) SPSS output of stepwise regressions ............................................................................ 93
Respondents Questionnaires ................................................................................................. 96
I. Questionnaire Chief Executive Officer............................................................................. 97
II. Questionnaire HR department ....................................................................................... 100
III. Questionnaire Employee .............................................................................................. 103
Bibliography ......................................................................................................................... 109

HRM, organisational performance and the role of firm size
Master thesis Business & Economics 5
1. Introduction
Faems et al. (2005) notice that interest in the link between human resource management
(HRM) and organisational performance has risen sharply over the past decade. Most research
about this topic has been done in large companies. Many authors have therefore referred to
the lack of attention given within the HRM literature to small and medium sized enterprises
(SME) (Cassell et al., 2002). Although studies about human resource management and
organisational performance in SMEs are increasing nowadays, there is still much unclearness
in the field of study (Faems et al., 2005).
In general, there is a broad consensus about human resource management having a positive
relationship with organisational performance (Wright et al., 2005; Guest, 2001). Yet, few
studies have addressed how a positive relationship occurs (Guthrie et al., 2004). Some studies
only measure human resource management and, subsequently, performance indicators (e.g.
profit, productivity) in the hope to find a positive relationship. Other research studies try to
explain causality by making a distinction between different levels of performance. These
studies assume that HRM will directly stimulate employee performance, which in turn leads
to a positive effect on higher-levelled organisational performance and, ultimately, on the
highest level of organisational performance. Unfortunately, it often remains with examining
only a few (and usually the same) variables of outcomes at the different levels in this causal
link (e.g. employee productivity, turnover as employee performance; firm productivity, quality
as the lower-levelled organisational performance; profit, other financial performance as the
highest-levelled organisational performance). Moreover, most studies ignore employee
behaviour while it is assumed to be the first part of the causal chain between HRM and
organisational performance (De Kok & Den Hartog, 2006).
In addition, the underlying theories for the consensus are mostly developed and tested in large
companies such that uncertainty exists about the extent to which the theories extend to smaller
organisations (Heneman et al., 2000). Little is known about the role of firm size in the
relationship between HRM and organisational performance. Also, the relative few empirical
studies done (compared to research done in larger companies) will keep the impact of human
resource management on organisational performance in smaller enterprises still more
questionable (Way, 2002).

HRM, organisational performance and the role of firm size
Master thesis Business & Economics 6
It is important to get more understanding about this field of study. The idea of human resource
management as stimulus to organisational performance is a legitimate argument to explore
how a positive relationship exactly occurs. Furthermore, it is interesting to examine if this
relationship will also hold in smaller firms. Several research studies have found a positive
relationship between HRM and organisational performance in SMEs (Sels et al., 2006; Faems
et al., 2005; Way, 2002). However, almost none investigate a potential difference in impact
on organisational performance between larger and smaller companies. The theoretical field
can be enhanced by using firm size as determining factor in order to find if a stimulating effect
of human resource management on organisational performance is equally strong in larger and
smaller companies. More insight herein will also help to determine if the underlying theories,
which assume a positive relationship, are really suitable for smaller firms in the first place. It
can be helpful in giving direction to future HR policies – especially in smaller firms. Smaller
organisations are still the jobs engine of the economy in The Netherlands (De Kok & Tom,
2007).
The goal of this study is to examine if the effect of HRM on organisational performance is
equally strong in smaller and larger companies. This can be summarized in the following
problem statement:
Is the impact of human resource management on organisational performance depending on
firm size (i.e. is the impact different for smaller compared to larger companies)?
The structure of this thesis is as follows. Based upon different HRM literature and research
done in large companies, this study will start with a description on how human resource
management can stimulate organisational performance. Chapter two will create a theoretical
framework wherein a positive relationship between HRM and the highest level of
organisational performance is narrowly analyzed. The framework reflects causal relationships
with intermediate variables (of outcomes) and, ultimately, with financial performance. This
study will use several variables to explore the relationship and, moreover, it emphasizes on
the importance of employee behaviour therein. Chapter two will also explain what
organisational performance actually means. It also discusses what will be the essence of
human resource management – especially for this study.

HRM, organisational performance and the role of firm size
Master thesis Business & Economics 7
The theoretical framework explains how a positive relationship between HRM and financial
performance can occur in large companies, based upon theories and research done in those
organisations. Chapter three will consider several characteristics that are specific for smaller
firms. Those characteristics distinguish smaller from larger companies and they are therefore
used to determine what the influence of firm size is on HRM’s impact on the intermediate
variables (of outcomes) and, ultimately, financial performance in the framework. In this
chapter, a review on HRM studies in small and medium sized enterprises will suggest that
human resource management can have a positive effect on organisational performance in
smaller firms. The focus in chapter three will therefore on a potential difference in the
strength of the HRM effect, due to firm size. Adjustments in the framework will show the
firm size effect (from a theoretical point of view) and, moreover, include a hypothesis
regarding the problem statement at the same time.
The following research questions are guidelines for building a clear and plausible conclusion
on the problem statement. Chapter two will provide answers to the first two research
questions; its framework will give an explanation for the third research question. The answer
to the fourth research question will be given in chapter three. The research questions are:
� What is organisational performance?
� What is the essence of human resource management?
� How can human resource management stimulate organisational performance?
� What characteristics distinguish smaller firms from larger companies that may
influence the relationship between HRM and organisational performance?
Finally, this study adds value by testing hypotheses, derived from the theoretical framework
(chapter 2) and adjustments in the theoretical framework (chapter 3), in an empirical research
study. In order to find empirical support for the theoretical findings, the hypotheses will be
tested in a sample with fifteen companies ranging in firm size from ten to 200 employees. In
chapter four the research methodology will be discussed in more detail. This chapter will
define the variables of interest that are subject to the empirical research. It also discusses the
questionnaires which will be used as measuring instrument (in order to measure the variables
of interest). At last, this chapter will discuss how the measuring data is collected. Chapter five
will present the results of the empirical study while chapter six concludes.

HRM, organisational performance and the role of firm size
Master thesis Business & Economics 8
2. Strategic HRM research
Strategic human resource management has been one of the most rapidly growing areas of
research within human resources (Delery & Shaw, 2001). Unfortunately, there is no
consensus about to what strategic specifically refers. Some authors address to research about
the fit between strategies and human resource management systems (Chan et al., 2004; Delery
& Doty, 1996). More scholars investigate the effect of intensive HRM on organisational
performance in large companies (Guthrie et al., 2004; Hayton, 2003; Ichniowski et al., 1997;
Becker & Gerhart, 1996; Huselid, 1995; Arthur, 1994; Wright & McMahan, 1992). Those
scholars at least suggest that human resource management can have a stimulating effect on
organisational performance.
Based upon different strategic HRM literature and research done in large companies, this
chapter will build a framework that explicitly describes how human resource management can
stimulate organisational performance. Section 2.3 shows the theoretical framework that will
emphasize a causal link between HRM and financial performance. Section 2.2 will discuss the
essence of human resource management – especially for this study. First, section 2.1 will
explain what organisational performance actually means.
2.1 Organisational performance
The absence of a general theory about performance makes it hard to define organisational
performance (Guest, 1997). However, organisational performance can be defined by placing it
in the context of an organisation. In the first place, organisational performance is an objective
dominated by the company (Guest, 1997). The organisation directly controls the indicators of
organisational performance. It differs from outcomes, because those can be considered as
much broader. Outcomes are different objectives whereby it depends upon the different
stakeholders of a company which ones to focus on (Guest, 1997). In brief, the focus is not
only on a company-dominated objective then (e.g. job satisfaction, environmental issues, and
profits). Secondly, organisational performance is based upon measures that reflect the
performance of a work unit, business unit and/or firm as exclusive unit (Delery & Shaw,
2001; Becker & Gerhart, 1996). Becker & Gerhart (1996) notice that it is important to
recognize the level of analysis when measuring outcomes. Organisational performance is
created by (aggregated) measurements at an organisational level (Guthrie et al., 2004).

HRM, organisational performance and the role of firm size
Master thesis Business & Economics 9
As mentioned in the introductory chapter, organisational performance is often divided in
lower- and higher-levelled performance. The first is reflected by operational performance. It
is considered as performance that will be directly influenced by behavioural outcomes from a
company’s workforce (Delaney & Huselid, 1996). Moreover, operational performance is
supposed to indicate how financial results have been achieved (Fey et al., 2000). Operational
indicators (e.g. firm productivity, product quality, absenteeism rate) are mediators for the
higher-levelled financial performance. Guest et al. (2003) argue that „financial performance
lies at the distant end of the chain”. Although financial measures can appear in several
different forms (e.g. economic versus accounting values), the three most common financial
indicators are profit margins, return on assets and return on equity (Tangen, 2003).
2.2 Human resource management
Briefly, human resource management is about managing the workforce of a company. For all
firms, irrespective of their size, hold that human resource management includes activities to
select, develop, motivate and retain employees with required characteristics (Compeer et al.,
2005; Jackson & Schuler, 1995; Deshpande & Golhar, 1994). These activities are the essence
of human resource management and, moreover, considered as the driving force behind the
stimulating effect on organisational performance. The activities are better known as HR
practices.
Two particular issues with relation to HR practices are often discussed in strategic HRM
literature (Wright & Boswell, 2002). In the first place, individual practices are assumed to
have a limited effect on managing a workforce well. The reason is that some practices can
enhance the impact of other practices (and vice versa) by a creation of synergy (Wright &
Boswell, 2002; Dyer & Reeves, 1995). The internal fit perspective encloses the idea of some
practices having a complementary status and the ability to reinforce the effectiveness of each
other practices (Purcell, 1999). The perspective builds upon a bundle of practices that all fit
into, create synergy and thereby manage a workforce even better „than the sum of the parts”
(Becker & Gerhart, 1996). Unfortunately, there is still not much understanding about the
nature of synergy. Even without it seems better to have more practices, because it means a
completion of the concept HRM and more opportunities to manage a workforce well (Delery,
1998).
HRM, organisational performance and the role of firm size
Master thesis Business & Economics 10
Obtaining internal fit is often associated with the best practices approach (Compeer et al.,
2005). The approach emphasizes a set of best practices that are universalistic or, in other
words, appropriate and in general leading to value for every firm (Tzafrir, 2006). Best
practices are bundled and integrated into one index; some of the integrated sets of best
practices are defined as high performance work systems (HPWS). Scholars notice implicitly
that practices in a high performance work system satisfy the internal fit principle (Faems et
al., 2005; Huselid, 1995). However, it is questionable if practices can be defined as best
practices or whether, instead, „the efficacy of any practices can only be determined in the
context of a particular firm's strategic and environmental contingencies” (Huselid, 1995). The
external fit perspective implies that particular practices are not always the best practices for
every company. This critic on the best practices approach is a common issue in the strategic
HRM literature.
Despite of the critic there is a growing adoption of using a high performance work system in
HR research. De Kok & Den Hartog (2006) argue that it is because of promising results about
the effectiveness of those systems. The scholars recognize increased employees’ output that
ultimately will give a boost to financial performance. In addition, more researchers argue that
the best practices approach and the external fit perspective can stand together (Compeer et al.,
2005; Youndt et al., 1996). Both are working on a different level. The scholars see the best
practices as a standardized resource to help managing a workforce well. At the same time,
every firm can use those practices in a way that is most suitable according to its strategies
and/or environmental contingencies. For example, training can be considered as an useful
practice for every firm to manage (develop) its workforce. However, it is not unlikely that the
content of the training will differ for employees working in innovative high-tech or traditional
industries.
This study also continues using a high performance work system. The next paragraph will
discuss the best practices in the high performance work system from Way (2002). These
practices are thought to put a stimulating effect on financial performance into operation.
2.2.1 High performance work system (HPWS)
A high performance work system is a bundle of best practices that are integrated into one
index. Unfortunately, there is little consistency in the chosen practices included within high
performance work systems used in empirical studies (Gerhart et al., 2000). Based upon an

HRM, organisational performance and the role of firm size
Master thesis Business & Economics 11
examination of six exemplary empirical studies (Guthrie, 2001; Becker et al., 1997;
Ichniowski et al., 1997; Huselid, 1995; MacDuffie, 1995; Arthur, 1994), Way (2002) has
selected seven practices for a high performance work system. The scholar’s practices are
similar or, at least, categorized identical to the HR practices in those six highly-respected
studies. More researchers have decided to use practices based upon one of those six studies
(Guthrie et al., 2004; Chan et al., 2004). Other studies demonstrate practices that fit those of
Way (2002) (e.g. Batt, 2002; Koch & McGrath, 1996). Using Way’s (2002) high performance
work system is interesting, because it can (partially) overcome the problem of inconsistency.
Moreover, previous research has already indicated the practices as theoretically appropriate to
select, develop, motivate and retain a workforce.
The first practice in the HPWS is the extensiveness of staffing what is referred to „the extent
that a firm’s staffing process uses information gathered from several selection devices (e.g.
interviews, tests, work samples) to evaluate job candidates” (Way, 2002). Koch & McGrath
(1996) also recognize selection mechanisms – like selection and screening tests – as ways of
getting information about the appropriateness of job candidates.
The next practices are based upon employee compensation (Way, 2002). Group-based
performance pay is expected to align desired goals of employees with those of the firm (e.g.
to retain employees). Youndt et al. (1996) also have group performance pay as a practice in
their human capital enhancing HR system that is linked to firm performance. The second
practice in the high performance work system is pay level and, especially, the relative pay
level (compared to the average pay level in the industry of the company) is focused on.
Cappelli & Neumark (2001) have job rotation as an aspect of HPWS in their research study.
Job rotation implies that employees develop by rotating across jobs or tasks within teams,
production processes and/or the complete organisation (Ichniowski et al., 1997; MacDuffie,
1995). Way (2002) is also utilizing job rotation in his high performance work system.
The fifth practice in HPWS is self-directed teams. Development is the essence of employees
who are highly participating in teams and team programs without a direct supervisory (Arthur,
1994). Batt (2002) also has self-directed teams as an aspect of her system index.

HRM, organisational performance and the role of firm size
Master thesis Business & Economics 12
Again, development is considered as important in training employees. Way (2002) has added
formal training to his high performance work system. Batt (2002) applies training as practice
but the scholar distinguishes between formal training and on-the-job training. Although both
represent a process by which employees acquire knowledge and skills related to their work
requirements, the difference is how the acquisition of knowledge and skills takes place:
during the job, or during an external, in-house training (Westhead & Storey, 1996).
The last practice included in Way’s (2002) HPWS is involvement in meetings discussing
work-related issues. A formal process wherein employees can share their opinions and views
about work-related issues can motivate them in their jobs (Way, 2002; Cappelli & Neumark,
2001).
2.3 Theoretical framework
This section will develop a theoretical framework that explicitly describes how a positive
relationship between HRM and the highest-level of organisational performance can occur.
Financial performance is thought to be stimulated not directly by human resource
management but, rather, through some causal relationships with intermediate variables of
outcomes. It results in the following causal link:
HPWS → employees’ characteristics → behavioural outcomes → operational performance
→ financial performance
The next paragraphs will give more insight in this causal link, starting in paragraph 2.3.1 with
the relationship between the high performance work system and employees’ characteristics.
2.3.1 Employees’ characteristics
The resource-based view (Barney, 1991) is often used as the underlying argument for a
positive relationship between the HPWS and financial performance. In brief, the view
emphasizes that human resources can become a sustained competitive advantage what
ultimately will result in a boost to the financial performance of a company (Way, 2002;
Huselid, 1995). The high performance work system can create employees that will have the
required characteristics to satisfy the conditions of the resource-based view in order to
become a sustained competitive advantage. These conditions include four aspects. In the first
place, employees add value to the effectiveness and/or efficacy in the production processes.

HRM, organisational performance and the role of firm size
Master thesis Business & Economics 13
Secondly, the employees are rare compared to them from rival companies. In addition, the
workers are not perfectly imitable by competitors. At last, the employees can not be replaced
by substituted resources that also add value but then are either not rare or imitable. Two
conditions will always be satisfied, considering that employees are anyhow hard and very
costly to imitate because of their complex social structure (Becker & Gerhart, 1996), and that
employees are not easy to substitute in a world with a continuing shift toward service
industries (Huselid, 1995).
However, employees still need to have the required characteristics to satisfy the other two
conditions. These characteristics include knowledge, skills, abilities and experience on one
hand (Compeer et al., 2005; Delery & Shaw, 2001). Those have been derived from Becker’s
(1964) human capital theory. By definition, employees are rare if their skills, knowledge etc.
are of a high level (Wright & McMahan, 1992). Moreover, they have to differ in their skills,
knowledge etc. (heterogeneous supply of labour) to become valuable for a company (Wright
& McMahan, 1992). Thereby, the company is responsible for providing jobs that require
different characteristics of employees (heterogeneous demand of labour). The practice
extensiveness of staffing gathers information about the job applicants in terms of their skills,
abilities etc. The information gathered will lead to less uncertainty about the capabilities of
the job candidates (Koch & McGrath, 1996). It is used to manipulate the supply of future
workers by choosing only employees who have a high level of characteristics and differ in
them. A high (relative) pay level can achieve the same effect. Youndt & Snell (2001) found in
competitive pay an important factor to distinguish between high levels of human capital. A
competitive pay can also attract a larger applicant pool and, consequently, gives a firm the
opportunity to find employees with different characteristics (Way, 2002). Job rotation will
develop employees’ skills, and broaden their knowledge and experience. It increases learning
a variety of specific skills and employee understanding of other aspects of a firm’s operations
(Cappelli & Neumark, 2001). Job rotation can result in employees having a high level of
characteristics, which they can align to the different needs of a company. Moreover, job
rotation provides the context wherein employees with different characteristics can fulfil the
different needs of the company. Participation in self-directed teams provides opportunities for
continuous learning (Batt, 2002). Employees will feel more responsible, and also have to take
the responsibility. It creates an environment wherein workers can grow to employees with
high-levelled characteristics in order to meet their responsibility. Formal training will give
employees the opportunity to acquire new knowledge and skills, which in turn they can use in

HRM, organisational performance and the role of firm size
Master thesis Business & Economics 14
their working environment. The provision of training can create employees with high levels of
characteristics. Those characteristics can also differ per employee by providing other training
to different employees.
On the one hand, a workforce needs to have many high-quality and different skills, abilities,
knowledge and experience to become a sustained competitive advantage for firms. The high
performance work system can select and develop such a workforce. On the other hand, those
employees also need other characteristics to become valuable for a company. Compeer et al.
(2005) notice that an important aspect of running a successful organisation is to find, motivate
and retain the right employees. The employees should be motivated to apply their many high-
quality and different skills, abilities, knowledge and experience (MacDuffie, 1995). In
addition, those employees should also have the motivation to stay with a company. Group-
based performance pay is expected to align desired goals of employees to those of the firm
(Way, 2002). It can have a stimulating effect on employee interaction and information sharing
(Youndt et al., 1996). Giving employees the opportunity to use their abilities and to make
decisions in doing their jobs is another way to motivate those (Delery & Shaw, 2001). Self-
directed teams will offer this opportunity. Involvement in meetings discussing work-related
issues will motivate because of the opportunity to participate in deciding how to do the work
tasks. Finally, the high performance work system can motivate employees to stay, due to the
working conditions that the practices cause (empowerment, compensation and development
opportunities).
2.3.2 Behavioural outcomes
The sustained competitive advantage is created by the idea that employees with the required
characteristics (to satisfy the conditions of the advantage) can behave in a way that several
preferred behavioural outcomes arise. Moreover, those employees are willing to behave in
that particular way. In the first place, they are responsible for behaviour that ultimately solves
problems. The employees have (multi-)skills, knowledge and experience which are required
to identify problems, to generate possible solutions and, finally, to encounter the problems
and solve them quickly (Coleman, 2006; Atuahene-Gima, 2003; MacDuffie, 1995).
Secondly, Clark et al. (2002) notice individual learning as an increase in the individual level
of knowledge, skill or ability. Employees with the required characteristics have a noteworthy
standard of individual learning. The scholars recognize individual learning as an important

HRM, organisational performance and the role of firm size
Master thesis Business & Economics 15
component in the aggregation of knowledge to get an organisational learning climate. After
all, the individuals will make up the collective (Clark et al., 2002). However, individual
learning is just the beginning of an organisational learning climate. Shipton et al. (2005)
suggest that organisational learning is built upon the creation (i.e. individual learning),
transfer and implementation of knowledge. The transfer of knowledge will occur when
employees behave in a way that there is a shared understanding between them and work
groups by using dialogues. Companies that provide the high performance work system do not
only have employees with a high standard of individual learning, but also employees who are
willing to apply their knowledge etc. They will behave in a way that their knowledge is shared
– or transferred.
Furthermore, the working conditions (empowerment, compensation and development
opportunities) will motivate the workforce to stay with an organisation. Employees tend to
carry out commitment to their company. The psychological contract emphasizes this principle
on the basis of an agreement between employer and employee. The agreement contains
reciprocal obligations or commitments to certain behaviour and actions or, at least, mutual
expectations (Schein, 1978).
Finally, satisfied behaviour is also due to the working conditions that have been provided by
the high performance work system. Participation, for example, will result in job satisfaction
among the involved employees (Cohen & Bailey, 1997). Halsted et al. (2000) define job
satisfaction as „the state of mind that results from an individual’s needs or values being met
by the job and its environment”. It is mainly through this job satisfaction that employees are
willing to put a high level of effort in their work (Huselid, 1995).
2.3.3 Operational performance
The behavioural outcomes will stimulate organisational performance. Rather than directly
stimulating financial performance, these outcomes will first stimulate intermediate operational
performance indicators (Guthrie et al., 2004; Delery & Shaw, 2001; Delaney & Huselid,
1996). Solving problems will help insure quality in the operations of a company (MacDuffie,
1995). The workforce is always able to identify problems in a firm’s operations, and to
analyze their root causes. Subsequently, it can generate possible solutions, and solve the
problems quickly. Quality in a firm’s operations will lead to a good quality of the finishing

HRM, organisational performance and the role of firm size
Master thesis Business & Economics 16
goods of those operations. A firm’s products will satisfy customers’ quality and performance
requirements (i.e. good product quality) (Atuahene-Gima, 2003).
Furthermore, the transfer of knowledge makes an organisational learning climate in a
company possible. Shipton et al. (2005) have noticed that a supportive learning climate is
good for organisational innovation. It is based upon the idea that innovation includes
knowledge-intense processes (Kanter, 1985). As mentioned before, organisational learning is
based upon the creation, transfer and implementation of knowledge. It provides expertise to a
workforce in order to recognize new opportunities in a company. A lack of this expertise in
the first stadium of the innovation process is the reason for most innovation failures
(Böhringer, 2004). Creativity is also an important aspect for innovation, but a factor to
enhance creativity is again knowledge (Baer et al., 2003; Amabile et al., 1996).
Thirdly, Cotton & Tuttle (1986) conclude in their study that either commitment as well as
satisfaction is an important factor to obtain low voluntary turnover rates in organisations. To
reduce the turnover rate, an organisation should reduce employees’ intentions to leave the
firm or increase their commitment and satisfaction (McEvoy & Cascio, 1985). Satisfaction
among employees is also resulting in low sickness absence rates in firms. Absenteeism is a
classic indicator of satisfaction (Liouville & Bayad, 1998). Employees have less incentive to
neglect their work duty if they are feeling right with their job.
The most common operational performance measure is probably firm productivity. Many
authors in strategic HRM research have mentioned or used firm productivity (Tzafrir, 2006;
Guthrie, 2001; Guest, 1999; Ichniowski et al., 1997; Huselid, 1995; MacDuffie, 1995;
Arthurs, 1994). In general, productivity is defined as the relation of output to input (i.e. used
resources) (Tangen, 2003). A workforce with a high level of effort will produce a high level
of output, given the same input. It will result in a high level of productivity ceteris paribus.
Finally, the aforementioned operational performance indicators can also stimulate firm
productivity. Quality in a firm’s operations will result in no waste of time and effort, because
there is no need to re-do things (Tangen, 2003). A minimum of input resources (e.g. labour) is
used to get a certain level of output. Additionally, good product quality can enhance the level
of output. Innovation can create the same stimulating effect on productivity. Mumford (2000)
notices that innovation accomplishes effectiveness and/or efficacy in a company. The first

HRM, organisational performance and the role of firm size
Master thesis Business & Economics 17
will cause an increase in the level of output while the latter will result in a minimum of input
resources. Instead, a high voluntary turnover rate will have a negative effect on productivity.
Turnover means the loss of firm-specific human capital and lessens the productive capability
of the workforce (Guthrie et al., 2004). A high sickness absence rate will reduce the
productive capacity of a company (Pransky et al., 2006). Briefly, productivity will be
hindered by high rates of voluntary turnover and sickness absence (Liouville & Bayad, 1998).
2.3.4 Financial performance
Becker et al. (1997) have mentioned that a HRM system will produce employee behaviours
that focus on key business priorities, which in turn drive profits and ultimately market value.
The high performance work system can create employees who are a sustained competitive
advantage. Many scholars see it as a potential source of profitability that firms can capitalize
(Chan et al., 2004; Guthrie et al., 2004; Guest et al., 2003; Liouville & Bayad, 1998; Delaney
& Huselid, 1996; Dyer & Reeves, 1995; Huselid, 1995).
Productivity is considered as the main direct driver behind the profits of a company. Some
scholars argue that it is hard to find a direct relationship between innovation and profit ratio’s
(Oke et al., 2007; Griffin, 1997). However, innovation can stimulate firm sales (Oke et al.,
2007). It might is an intermediate relationship between innovation and profitability. A similar
discussion can be recognized for product quality. It is not unlikely to suggest that the sales of
a firm will increase if its products satisfy customers’ requirements. Other researchers notice
that voluntary turnover indeed has a direct effect on firm profits (e.g. by replacement costs)
but, however, that its main effect is via firm productivity (Batt, 2002; Huselid, 1995). At last,
Pransky et al. (2006) suggest that the substantial cost of a high sickness absence rate is due to
the loss in productivity.
An increased attention for the high performance work system may have its direct effect on the
profits of a company (Fey et al., 2000). Higher average wages and training expenditures, for
example, are negatively associated with firm profitability. Yet, Guthrie et al. (2004) mention
that a HR system and the existing human capital might enhance the market value of a
company. As intangible assets, they perhaps increase the premium capital markets are willing
to pay for a given portfolio of assets.

HRM, organisational performance and the role of firm size
Master thesis Business & Economics 18
2.3.5 Theoretical framework
Figure 1 briefly summarizes the theoretical framework that is describing how a positive
relationship between HRM and the highest level of organisational performance can occur. It
shows the intermediate causal relationships with several variables of outcomes, as well as a
direct relationship between the high performance work system and profitability (due to the
costs of a HPWS). The signs describe if the variables are positively or negatively related to
each other.
HPWS
Job satisfaction
Required characteristics
Motivated to apply
Stimulated to stay
Solving problems
Knowledge-transfer
Commitment
Effort Productivity
Voluntary turnover
Innovation
Product quality
Sickness absence
Profitability
+
+
+
+
+
+
+
+
+
+
+
+
-
-
+
+
+
--
-
Figure 1: A framework describing how a positive relationship between HRM and organisational performance can occur.

HRM, organisational performance and the role of firm size
Master thesis Business & Economics 19
3. The role of firm size
A lack of attention given within the HRM literature to small and medium sized enterprises
makes that it is still questionable if a positive relationship between HRM and organisational
performance can also occur in those organisations. Fortunately, HR studies that will focus on
SMEs are increasing nowadays. Section 3.1 will discuss a literature review done on HRM
studies in small and medium sized enterprises. This literature review suggests that a positive
relationship indeed can occur in smaller firms (section 3.2). Finally, section 3.3 will determine
several characteristics that are specific for smaller organisations and, moreover, it will
describe what the influence of those characteristics (i.e. firm size effect) is on HRM’s
assumed positive effect on financial performance and the intermediate variables of outcomes
in the theoretical framework from chapter two.
3.1 Literature review
Sels et al. (2006) examine the effect of intensive human resource management on
organisational performance in a sample of small firms with ten up to 100 employees. The
scholars conclude that HRM intensity is stimulating firm profit. King-Kauanui et al. (2006)
find a significant positive effect on an index of organisational performance measures in a
sample of 200 Vietnamese small and medium sized enterprises. The effect is caused by a set
of HR domains, namely training, performance appraisal systems and incentive compensation.
These findings indicate that there is a positive relationship between human resource
management and organisational performance in smaller firms. The researchers do not focus
on a difference in impact due to firm size. Sels et al. (2006) only investigate small businesses
and, thus, control for firm size. King-Kauanui et al. (2006), however, refuse to take the
opportunity to use firm size as determining factor in their sample of small and medium sized
enterprises.
Devins & Johnson (2003) do research in the relationship between a formal training and
development supportive program, called ESF O4, and the extent of activities in training and
development in SMEs. The authors suggest that the program gives especially to small
businesses the opportunity to expand training and development activities. Not doing training
in the absence of ESF O4 decreases significantly with firm size, although most small firms
participating in the program already seem to have commitment to formal training and
development activities. Moreover, the scholars also recognize that the short-term effect of

HRM, organisational performance and the role of firm size
Master thesis Business & Economics 20
ESF O4 on a range of business performance measures is fairly modest. The greatest perceived
impact is on the small companies. Devins & Johnson (2003) notice, as a general rule, that the
hard measures (i.e. financial and market performance) are perceived to be less impacted by
the program than the soft measures are (e.g. confidence in the future, competitiveness, staff
retention).
Unfortunately, the research does not provide an accurate description about how human
resource practices can have a positive effect on organisational performance in the first place.
In a sample of 4,637 small businesses Muse et al. (2005) investigate the effect of
compensation, as reflection of organisational commitment to employees (OCE), on five
performance measures: return on sales, return on assets, return on cash-flow, employee
growth and employee productivity. Compensation is reflected by average salary, a healthcare
program and a pension plan. The scholars find significant positive relationships between OCE
and all five performance measures. The results mention little about how these relationships
came to an achievement. It is not unlikely to suggest that these performance measures are
mutual related, with lower-levelled predictors for higher-levelled performance measures. For
example, employee productivity could be positively related to a higher-levelled financial
performance measure (e.g. return on sales).
Sels et al. (2006) use productivity as important mediator between human resource
management and financial performance in their research study. The findings show that
intensive HRM enhances productivity (i.e. decreases the share of personnel costs in the value
added c.p.) and, through that, has a positive effect on profitability, solvency and liquidity.
Still, the total impact of intensive HRM on solvency and liquidity is nil because at the same
time human resource management is causing higher personnel costs (thus increasing the share
of personnel costs in the value added). The total impact on profitability remains positive and
strong. A possible explanation is that other, intermediate and non-measured (operational)
performance indicators are having a positive effect on profitability.
The performance index in King-Kauanui’s et al. (2006) study contains financial performance
measures (e.g. return on assets, operating profit) but also operational measures like
productivity, innovation (new product development) and quality (product quality). It is not
clear what measures are most responsible for the positive effect of the HR practices on the
performance index figure. Neither can be concluded that, within the index, certain operational

HRM, organisational performance and the role of firm size
Master thesis Business & Economics 21
performances are positive related to the higher-levelled financial performance indicators. But,
a positive total effect can suggest positive relationships between the operational and financial
performance measures.
3.2 Discussion
The findings in the literature review do suggest that human resource management can
stimulate organisational performance in smaller firms too. The results, except for Sels et al.
(2006), are from samples with small and medium sized enterprises. Unfortunately, the
scholars have not examined the effect of firm size on these findings. It could be that the
findings apply only for the small firms, or for the medium sized companies.
Secondly, there is again little attention for questioning how human resource management can
stimulate organisational performance. The researchers assume that a positive relationship will
exist, but they are not exploring the causal link between HRM and organisational performance
in terms of variables at different levels. Sels et al. (2006) have done making the causal link
more explicit. Their descriptive framework is highly based upon strategic HRM research done
in large companies.
3.3 Firm size effect on framework
This section will consider characteristics of smaller firms that distinguish them from larger
companies. These characteristics are used to determine the influence of firm size on the
framework that has been developed in section 2.3. The framework describes the following
causal relationship between HRM and the highest level of organisational performance in
detail:
HPWS → employees’ characteristics → behavioural outcomes → operational performance
→ financial performance
The descriptive framework is based upon literature and research, developed (for) and tested in
large organisations. Additionally, the strength of causality has almost never been examined in
the context of small against large companies or, even, small versus medium sized enterprises.
In this section, the influence of firm size on the impact of the high performance work system
on the intermediate variables (i.e. employees’ characteristics, behavioural outcomes,
operational performance) and, subsequently, financial performance will be examined. The

HRM, organisational performance and the role of firm size
Master thesis Business & Economics 22
findings provide a theoretical conclusion on the problem statement. Paragraph 3.3.1 starts
with describing the availability of a HRM system in smaller firms.
3.3.1 HR practices in smaller firms
A traditional view on smaller businesses is that they are much like large companies, except
they have smaller sales, fewer employees and smaller assets (Cassell et al., 2002). The view
probably underlies the narrowest definition of the European Commission for SMEs. The
European institute classifies micro, small and medium sized enterprises by a turnover less
than respectively two, ten and fifty million euros (or by a balance sheet total less than
respectively two, ten and forty-three million euros)1. Moreover, the companies are supposed
to have less than respectively ten, fifty and 250 employees2. Although narrowly defined, the
criteria could influence the strength of the positive effect of the high performance work
system.
It is possible that fewer employees and lesser financial means bring the development and
implementation of the high performance work system in smaller firms into danger (De Kok &
Den Hartog, 2006; Kotey & Slade, 2005). A smaller workforce probably indicates that
employees are more quickly one of the key workers of an organisation (i.e. important in the
operations of an organisation). It could become a problem if practices claim valuable time and
resources of those employees (like formal training). Furthermore, limited financial resources
can result in a low priority for smaller firms to develop and implement the high performance
work system. Investing in the high performance work system will often bring the need to
extract additional funding. Smaller firms do not have the advantages of scale which make that
they have lesser resources to cover the development costs (Nooteboom, 1993). A lack of
benefits from economies of scale makes it harder for them to return the fixed costs of the high
performance work system. It increases their (relative) costs to develop and implement the HR
practices even more.
However, growing evidence shows that HR practices are not significantly different in smaller
and larger companies (Sels et al., 2006; Drummond & Stone, 2007; Golhar & Desphande,
1997). De Kok & Den Hartog (2006) also confirm that „it seems intuitively likely that HRM
1 http://ec.europa.eu/enterprise/enterprise_policy/sme_definition/index_en.htm
2 http://ec.europa.eu/enterprise/enterprise_policy/sme_definition/index_en.htm

HRM, organisational performance and the role of firm size
Master thesis Business & Economics 23
will also matter in small firms…”. This study therefore assumes that the presence of a high
performance work system will not significantly differ between larger and smaller companies.
3.3.2 Employees’ characteristics in smaller firms
The high performance work system can create employees with characteristics that will satisfy
the conditions of a sustained competitive advantage. It can select and develop a workforce
with a high level and variety of knowledge, skills, abilities and experience. The HPWS can
also motivate this workforce to apply their skills etc. and, moreover, to stay with the
company. It is due to the practices in the high performance work system. De Kok & Den
Hartog (2006) notice however that the quality of implemented HR practices may increase
with firm size.
In the first place, the resources of smaller firms remain scarcer. Limited resources could be a
constraint resulting in a non-optimal usage of the practices in smaller organisations. A lack of
sufficient financial resources may result in not offering the formal training that is most
appropriate for the employees but also more expensive. A lack of sufficient labor force and/or
time might cause that the staffing process is not executed accurately. Perhaps, not all selection
devices are done by the applicants or only a few representatives of the company have been
involved in the process. The information gathered about the job candidates is therefore limited
and too subjective.
Secondly, smaller enterprises are characterized as more informal and operating in a flexible
manner. It corresponds with the need to manage a workforce more systematically and
efficient when the number of employees increases (De Kok & Uhlaner, 2001). Jobs in smaller
firms usually contain more varied work roles and thereby are less narrowly defined, i.e. not
defined independent of the person performing the job (Carroll et al., 1999; Bacon et al.,
1996). Job rotation is maybe a less effective practice in a work environment with no well-
defined jobs (De Kok & Den Hartog, 2006). It is hard to learn job specific skills and to get
understanding of an organisation if jobs are not clearly defined. Furthermore, a more informal
environment probably means that smaller firms often lack specialists familiar with formal HR
practices (Heneman & Berkley, 1999). These HRM specialists can insure a qualitative usage
of the high performance work system.

HRM, organisational performance and the role of firm size
Master thesis Business & Economics 24
Another characteristic of smaller companies is that they usually do not have a middle-
management. A larger workforce will enhance the span of control and that results in the
employment of middle managers to take up the responsibility for daily operations and to
supervise operational staff (Kotey & Slade, 2005). In smaller firms, however, there often is an
owner-manager that has direct control on all activities in the organisation. Human resource
management also remains the domain of the owner-manager. It is questionable if this situation
is good for the quality of the high performance work system. Gatewood & Feild (1987)
suggest that an owner’s attitude towards HRM is not always stimulating the effectiveness of
the practices. The (visible) presence of authority could undermine the practices self-directed
teams and involvement in meetings discussing work-related issues. The effectiveness of these
practices is highly depending upon the opportunity that involved workers get to share their
opinions and to work without direct control. Staffing could also be undermined by a direct
presence of the owner-manager. His personal judgement is usually playing a large role in the
selection procedures (Kotey, 1999; Golhar & Deshpande, 1997). Job candidates are thought to
be more often selected on competencies referred to beliefs and values rather than on
knowledge, skills and abilities (Heneman et al., 2000). It is even argued that good potential
employees are not selected because they pose a threat to the valued independence of the
owner-manager (Kotey & Sheridan, 2004).
At last, Cassell et al. (2002) refer to the importance of giving due attention to the external
market of small and medium sized enterprises. In contrast with large companies, smaller firms
are normally not characterized by a high exposure. Large companies are easier to recognize in
the market than their smaller counterparts. Others draw attention to large enterprises more
quickly because of their strong pull factors (tempting signals from larger and/or older firms).
These pull factors can make that the high performance work system is less effective in smaller
firms to retain employees (Sels et al., 2006). For example, a high (relative) pay level in
smaller businesses is probably hard to recognize for applicants because of the low exposure
those firms face in a market with many competitors.
Aforementioned suggest that the high performance work system is less effective in smaller
firms to select, develop, motivate and retain employees with the required characteristics. If so,
the level of the preferred behavioural outcomes is also expected to be lower in smaller firms
than in larger companies. It will be discussed in the next paragraph.

HRM, organisational performance and the role of firm size
Master thesis Business & Economics 25
3.3.3 Behavioural outcomes in smaller firms
Due to a non-optimal use, it is indeed expected that the high performance work system in
smaller firms has a less positive impact on the employees behaving in a way that will result in
solving problems, knowledge-transfer, job satisfaction and a high level of effort. The level of
these behavioural outcomes will consequently be lower than in larger companies. First,
workers in smaller firms have lower-levelled characteristics (multi-skills, knowledge, and
experience) to display the behaviour that will result in the same extent of problem-solving as
in large companies. The employees feel more difficulties with identifying problems, finding
solutions and solving the problems quickly than their colleagues in larger enterprises.
Secondly, the high performance work system will not only create a workforce with much
knowledge, but it also motivates the employees to apply their knowledge in their working
environment. This share of knowledge among employees is an important aspect in achieving
an organisational learning climate. A less effective high performance work system, however,
will result in less knowledge and knowledge-transferring in smaller firms. It makes that the
organisational learning climate will not be as in larger companies.
Furthermore, the working conditions (empowerment, development and compensation
opportunities) in smaller firms will not be exposed as well as in larger companies. The
practices in the HPWS are less effective in their different purposes due to several elements
that characterize smaller firms (e.g. presence of direct authority, informal structure).
Employees in smaller firms can be less satisfied with their jobs and, consequently, will
display less effort than their colleagues in larger companies.
A minor exposure should also affect the psychological contract principle. Employees do not
value the mutual agreement with employers as high as when completely satisfied with the
working conditions. It implies that workers’ commitment to the organisation is less strong in
smaller firms. However, it is argued that the psychological contract tends to be stronger in
those companies (De Kok & Den Hartog, 2006). This indicates that there will be more
commitment in smaller firms. A possible explanation lies in the typical labour-intensive
character of smaller organisation (Miller, 1987). That can cause close relationships (with
colleagues and/or the employer) in the working environment which may result in more
commitment to the organisation. It seems that there are two different types of commitment
here. Literature studies also recognize two dominating views of commitment. The first is
HRM, organisational performance and the role of firm size
Master thesis Business & Economics 26
attitudinal commitment, considering commitment as a strong affiliation with the organisation
(Chong & Eggleton, 2007; Porter et al., 1974). Individuals identify with the enterprise and are
motivated to pursue organisational interests without personal gain. The typical labour-
intensive character of smaller firms will cause this type of commitment. The second view of
commitment is behavioural commitment. This view notices commitment as consistent human
behaviour caused by extraneous interests occurring with a consistent line of activity (Becker,
1960). In brief, an individual is bound to the organisation because that is in his or her self-
interest (e.g. good working conditions). A mutual agreement based upon working conditions
will cause this type of commitment. More commitment in smaller firms does suggest that
attitudinal commitment is winning from behavioural commitment (because behavioural
commitment will be higher in larger companies, then resulting in more overall commitment in
those organisations compared to smaller firms).
3.3.4 Operational performance in smaller firms
Despite of a less effective high performance work system in smaller firms, its impact on the
operational performance indicators is maybe even stronger than in larger companies. In
general, smaller organisations are typified by a labour-intensive character (King-Kauanui et
al., 2006; Miller, 1987). Some scholars argue that employees in labour-intensive enterprises
have a greater ability to significantly impact an organisation (Gatewood & Feild, 1987;
Solomon, 1984). There are namely fewer restrictions caused by other resources than human
capital (e.g. quality standards of equipment). Given the high performance work system, it
suggests that a smaller firm’s workforce – even with inferior behaviour to solve problems –
can guarantee a better product quality than the workforce in larger companies. The behaviour
of employees in smaller firms will simply impact the organisation more than the higher-scaled
behaviour of employees in larger companies. However, smaller firms’ labour-intense
character does not change the idea that a workforce with less job satisfaction and, therefore, a
lower level of effort will result in a higher sickness absence rate and a lower productivity.
As mentioned before, smaller firms are characterized by fewer employees in their workforce.
This aspect can be advantageous in building innovation. De Kok & Den Hartog (2006) expect
a stronger interaction effect between the high performance work system and innovation where
a larger share of the total workforce is involved in innovative activities. A possible
explanation is that more involved in the innovation process could make it easier to satisfy
important conditions of the process: knowledge creation (expertise), knowledge-sharing,

HRM, organisational performance and the role of firm size
Master thesis Business & Economics 27
commitment among the involved ones (to build coalitions in times of uncertainty about the
benefits of the innovation) and support from policy-makers (Böhringer, 2004). Every
individual involved in innovative activities in smaller firms will be a larger share of the total
workforce than every involved individual in larger companies. It suggests that a higher level
of innovation will occur in smaller firms than in larger companies – even with a high
performance work system that is less effective in creating a high knowledge-level and more
transfer of knowledge.
Despite of less job satisfaction and behavioural commitment among employees in smaller
firms, it is still expected that the voluntary turnover rate in these organisations is lower than in
larger companies. It is suggested that the psychological contract is stronger in smaller firms.
Employees in smaller firms will stay longer with the organisation than their colleagues in
larger enterprises. The assumption is that this effect is due to a higher level of attitudinal
commitment in smaller firms, thereby implying that attitudinal commitment is having more
impact on the voluntary turnover rate than behavioural commitment (and job satisfaction).
3.3.5 Financial performance in smaller firms
De Kok & Den Hartog (2006) have already noticed that investments in HPWS will be more
profitable in case of larger firms. In the first place, scarcer financial resources and a lack of
scale will probably make that the costs of developing and implementing a high performance
work system are (relatively) higher in smaller firms (Sels et al., 2006). It directly depresses
the profits of smaller enterprises. Besides, it is expected that firm profits are also from the
revenues side more stimulated in larger companies. The main driver behind the profits,
productivity, will namely have a lower level in smaller businesses. And although an impulse
in product quality and innovative activities could perhaps drive smaller firms’ profits (through
higher sales), it is doubtful if that is sufficient to rise above the created profitability in larger
companies. It is namely questionable if sales can increase significantly in smaller firms. Many
scholars have argued that smaller organisations pursue growth (i.e. sales growth), but
constantly have to focus on survival opportunities (Heneman et al., 2000; Binks & Ennew,
1996; Brock & Evans, 1989). These organisations are more likely confronted with restrictions
as, for example, limited capacity or access to investment money. Sels et al. (2006) notice that
not every small business therefore the ambition or desire has to grow.

HRM, organisational performance and the role of firm size
Master thesis Business & Economics 28
3.3.6 Adjusted theoretical framework
Figure 2 briefly summarizes the influence of firm size on the theoretical framework developed
in chapter two. It shows the influence of smaller firm characteristics on the impact that the
high performance work system has on the intermediate variables and, subsequently, the
financial performance in the causal link between HRM and organisational performance. In
figure 2, the influence of firm size is reflected by the coloured frames – a green frame means a
higher level of the concerning variable while a red frame means a lower level. Notice that the
signs in this figure are the same as in figure 1. Moreover, commitment has been divided now
in two types of commitment: behavioural and attitudinal commitment.
HPWS
Job satisfaction
Required characteristics
Motivated to apply
Stimulated to stay
Solving problems
Knowledge-transfer
Attit. commitment
Effort
Productivity
Voluntary turnover
Innovation
Product quality
Sickness absence
Profitability
+
+
+
+
+
+
+
+
+
+
+
+
-
-
+
+
+
-
-
-
Figure 2: An adjusted framework describing how a positive relationship between HRM and organisational performance can occur. The
adjustments are caused by the determining factor firm size. A red frame means a lower level in smaller firms (than in larger companies) of
the variable in that particular frame. A green frame means a higher level in smaller firms (than in larger companies) of the variable in that
particular frame.
Behav. commitment+ -

HRM, organisational performance and the role of firm size
Master thesis Business & Economics 29
4. Research methodology
From the adjusted theoretical framework it appeared to be that, given a presence of the high
performance work system, the levels of problem-solving, knowledge-transfer, behavioural
commitment, job satisfaction and effort in smaller firms keep behind the levels of those
behavioural outcomes in larger companies. That is due to a stronger (i.e. more effective)
stimulating effect of the high performance work system in larger enterprises. Consequently,
the sickness absence rate and productivity are respectively lower and higher in larger
organisations. Despite of all, however, the impact on product quality and innovation is larger
in smaller firms. It results in a higher level of product quality and innovative activities in
smaller businesses – moreover, in a lower voluntary turnover rate than in larger companies
(due to more attitudinal commitment). But ultimately, the profits will be more driven in larger
companies than in smaller firms in the presence of the high performance work system. Figure
3 summarizes these theoretical findings in a research framework.
HPWS
Job satisfaction
Solving problems
Knowledge-transfer
Attit. commitment
Effort
Productivity
Voluntary turnover
Innovation
Product quality
Sickness absence
Profitability
+ +
+
+
+
+
+
-
-
+
+
+
-
-
-
Figure 3: The research framework. A red frame means a lower level in smaller firms (than in larger companies) of the variable in that
particular frame. A green frame means a higher level in smaller firms (than in larger companies) of the variable in that particular frame.
Behav. commitment+ -
The theoretical findings in the research framework will lead in this chapter to hypotheses that
will be tested empirically. Subsequently, the methods of the empirical research will be
discussed in this chapter.
4.1 Preliminary remarks
First, it is striking that the intermediate relationships which involve the employee
characteristics have been kept out of the research framework. The reason is that high-quality
measures (in terms of reliability and validity) are hard to find for these characteristics,
because they are not narrowly defined in this study. It is namely thought that the content of

HRM, organisational performance and the role of firm size
Master thesis Business & Economics 30
knowledge, skill, ability and experience can differ among firms without loosing their ability to
stimulate the preferred behavioural outcomes.
Secondly, the research framework reflects the descriptive purpose of this study. It describes a
positive relationship between a high performance work system and organisational
performance in more detail. In addition, it also shows the influence of firm size on this causal
link. The variables in the research framework are subject to the empirical research in order to
test empirical support for a positive relationship and the firm size effect. Moreover, several
questions, which answers indicate if the characteristics of smaller firms are indeed only
present in smaller organisations, are also processed into three questionnaires that will be
completed by the participants of this research. That is done in order to have the opportunity to
assess if a potential less strong HPWS impact perhaps is associated with these characteristics
(and thus with firm size).
At last, quantitative data will be used to measure the variables in the research framework.
Quantitative data is in essence numerical data, and therefore easier to aggregate, compare or
summarize than non-numerical (i.e. qualitative) data (Babbie, 2000). The research framework
emphasizes that a comparison in the variables between smaller and larger companies has to be
made in order to test a potential influence of firm size. Qualitative data (i.e. answers on these
questions related to the proposed characteristics of smaller firms) will be used to interpret the
quantitative information from the questionnaires.
4.2 Hypotheses
The research framework has given the context wherein the empirical study is moving. Next,
specific hypotheses are drafted which, to support the research goal, will be tested on reliance
in the empirical research. The research goal is to examine if the effect of human resource
management on organisational performance is equally strong in smaller and larger companies.
4.2.1 Hypothesis 1
The theoretical findings have accepted that the high performance work system can stimulate
organisational performance through several intermediate relationships – in both smaller and
larger companies. Hypothesis 1 summarizes that.

HRM, organisational performance and the role of firm size
Master thesis Business & Economics 31
Hypothesis 1
There is a positive relationship between the presence of the HPWS on the one hand, and
preferred behavioural outcomes, operational performances (however: a negative relationship
with the sickness absence rate and voluntary turnover rate), and financial performance on the
other hand.
An important way in empirical research to examine causality is the principle of comparison. It
is possible to distinguish in degrees of HPWS presence, based upon the extent that all seven
practices are present in a company. It is not unlikely to suggest that a higher (lower) degree of
HPWS presence will result in a higher (lower) level of the variables in the research
framework (the reverse for the sickness absence and voluntary turnover rates).
4.2.2 Hypothesis 2
The research framework recognizes more attitudinal commitment in smaller firms than in
larger companies. Attitudinal commitment occurs when employees have strong personal
feelings with an organisation. It is not stimulated by the high performance work system, but
nevertheless noticed because of its strong influence on the voluntary turnover rate.
Hypothesis 2
The level of attitudinal commitment is higher in smaller firms than in larger companies.
4.2.3 Hypotheses 3 – 6
The theoretical findings show that the impact of the high performance work system differs
between larger and smaller companies. Some characteristics of smaller firms make that the
HPWS is less effective in stimulating preferred behavioural outcomes in those organisations.
On the contrary, other characteristics of smaller firms give the high performance work system
the opportunity to have a stronger impact on a few operational performances. Hypotheses 3 –
6 emphasize these findings.
Hypothesis 3
For larger companies, a given degree of HPWS presence is associated with higher levels of
five behavioural outcomes (i.e. problem-solving, knowledge-transfer, behavioural
commitment, job satisfaction, employee effort) compared to smaller firms.

HRM, organisational performance and the role of firm size
Master thesis Business & Economics 32
Hypothesis 4
For larger companies, a given degree of HPWS presence is associated with higher levels of
two operational performances (i.e. productivity and voluntary turnover rate) compared to
smaller firms.
Hypothesis 5
For smaller firms, a given degree of HPWS presence is associated with higher levels of three
operational performances (i.e. product quality, innovation, and sickness absence rate)
compared to larger companies.
Hypothesis 6
For larger companies, a given degree of HPWS presence is associated with a higher level of
one financial performance (i.e. profits) compared to smaller firms.
4.3 Sample
The hypotheses will be tested in a sample of Dutch companies. A list of potential companies
as units of analysis is created in the database REACH3. The creation of this list will occur by
the use of some selection criteria that the companies have to satisfy. The first selection
criterion used is the type of industry wherein the companies are operating. This study wants
firms that have services-orientated businesses, i.e. operations in the tertiary area. The impact
of the high performance work system seems especially well to examine in companies wherein
the workforce is a dominating production factor. There are namely lesser restrictions by other,
more dominating production factors (e.g. capital). It is not unlikely that employees play an
important role in companies that are operating in the tertiary area. Fifteen sectors of industry
have been selected in the database REACH – all having the word services in their short area
description in common. It creates a list of 68,648 potential companies.
The second selection criterion used is the age of the companies (number of years since start-
up). Although firm age often is taken as criterion to control for „any advantages associated
with increased time for the evolution or adoption of HR practices or learning curve
advantages in productivity” (Sels et al., 2006), this study will use firm age to increase the
opportunity that the companies in the sample do have some of the high performance work
3 https://reach.bvdep.com

HRM, organisational performance and the role of firm size
Master thesis Business & Economics 33
system in their organisation. Therefore, firms have to be older than (an arbitrary chosen) five
years. After this selection criterion, the list still consists of 58,358 potential companies.
The third selection criterion used is caused by practical implications. The most recent
financial data in REACH (needed for measuring productivity and profit) is per 31st of
December 2006. The financial statements in the database include additive data over the year
2006. However, data over the year 2006 is not provided for every company. For several
companies only data over the year 2005 (or even earlier years) has been provided. It is not
desirable to use these companies in the sample, because further in the past can create other
problems in this empirical research study. Paragraph 4.4.2 will discuss this in more detail. So,
the selection criterion used is the availability of financial data over year 2006 in REACH.
There remain 13,061 potential companies in the list.
The last selection criterion used is the size of the companies. Firm size is here based upon the
number of employees working in the organisation, thereby assuming that companies with a
smaller workforce also dispose the other mentioned characteristics of smaller firms. The
companies are divided in four firm size groups, ranging from ten to fifty, fifty to 100, 100 to
150, and 150 to 200 employees. The first two ranges represent the smaller firms; the latter two
reflect larger companies. This definition is not according to the European guidelines, but it is
commonly accepted that Dutch small and medium sized enterprises have less than 100
employees (Brand & Bax, 2002; Holmes & Gibson, 2001; Hulshoff, 2001). Consequently,
four lists of potential companies come into existence. The list with the smallest firms consists
of 2,434 potential companies. The other lists contain – in increasing size – respectively 285,
114 and sixty-two potential companies.
Finally, 32 companies are at random selected out of the lists (eight per firm size group) in
order to get involved in the empirical research study. Unfortunately, only fifteen of these
companies agreed to participate (anonymously) as sample group in the research. Table 1
shows these companies, categorized by firm size against sector of industry. Table 2 shows the
companies, categorized by firm size against firm age. It would have been better to obtain a
sample that is more homogeneous in terms of firm age and sector of industry. Several scholars
have namely suggested that different sectors of industry and firm ages can influence the
results of research on HRM and organisational performance (Sels et al., 2006; De Kok & Den
Hartog, 2006; Guthrie et al., 2004; Huselid, 1995). In a sample with more uniform
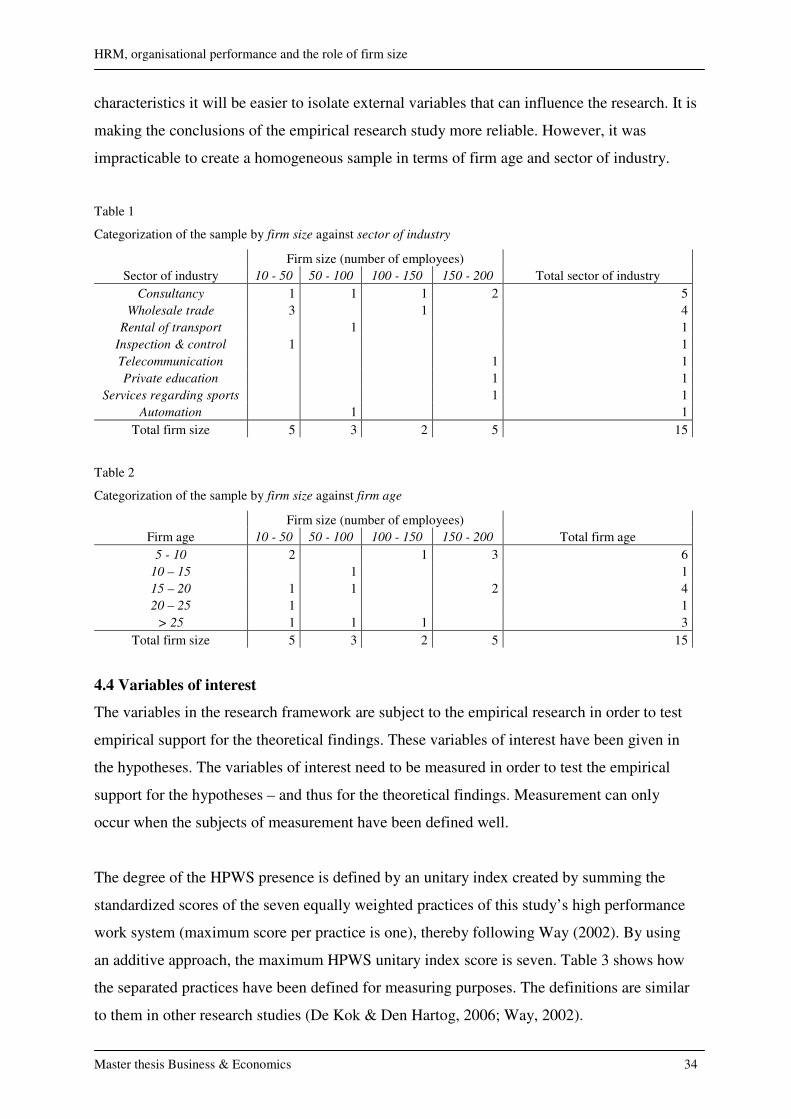
HRM, organisational performance and the role of firm size
Master thesis Business & Economics 34
characteristics it will be easier to isolate external variables that can influence the research. It is
making the conclusions of the empirical research study more reliable. However, it was
impracticable to create a homogeneous sample in terms of firm age and sector of industry.
Table 1
Categorization of the sample by firm size against sector of industry
Firm size (number of employees)
Sector of industry 10 - 50 50 - 100 100 - 150 150 - 200 Total sector of industry
Consultancy 1 1 1 2 5
Wholesale trade 3 1 4
Rental of transport 1 1
Inspection & control 1 1
Telecommunication 1 1
Private education 1 1
Services regarding sports 1 1
Automation 1 1
Total firm size 5 3 2 5 15
Table 2
Categorization of the sample by firm size against firm age
Firm size (number of employees)
Firm age 10 - 50 50 - 100 100 - 150 150 - 200 Total firm age
5 - 10 2 1 3 6
10 – 15 1 1
15 – 20 1 1 2 4
20 – 25 1 1
> 25 1 1 1 3
Total firm size 5 3 2 5 15
4.4 Variables of interest
The variables in the research framework are subject to the empirical research in order to test
empirical support for the theoretical findings. These variables of interest have been given in
the hypotheses. The variables of interest need to be measured in order to test the empirical
support for the hypotheses – and thus for the theoretical findings. Measurement can only
occur when the subjects of measurement have been defined well.
The degree of the HPWS presence is defined by an unitary index created by summing the
standardized scores of the seven equally weighted practices of this study’s high performance
work system (maximum score per practice is one), thereby following Way (2002). By using
an additive approach, the maximum HPWS unitary index score is seven. Table 3 shows how
the separated practices have been defined for measuring purposes. The definitions are similar
to them in other research studies (De Kok & Den Hartog, 2006; Way, 2002).

HRM, organisational performance and the role of firm size
Master thesis Business & Economics 35
Table 3
Variable of interest definitions
Definitions
Components of HPWS
Extensiveness of staffing An additive score of the extent that the four selection
devices are used to evaluate job candidates; each of the
selection devices is on a 5-point scale. Score = (interviews
+ tests + work samples + references from previous
employers) / 20. Maximum score = 1.
Group-based performance pay One or more of the following compensations are offered to
the operational workforce: profit-sharing, bonuses, share
plans, and stock options. Yes = 1; No = 0.
Pay level The level of base salary is compared to the level of base
salary for identical functions in other companies. Below
average = 0; Average = 0.5; Above average = 1.
Job rotation Percent of employees that is involved in job rotation on a 0-
100 point scale. Score = (0-100) / 100. Maximum score = 1.
Self-directed teams Percent of employees that is involved in self-directed
working teams, without direct supervisory, on a 0-100 point
scale. Score = (0-100) / 100. Maximum score = 1.
Formal training Percent of employees who receive formal, out-of-office
training on a 0-100 point scale. Score = (0-100) / 100.
Maximum score = 1.
Involvement in meetings discussing work-related Percent of employees that is involved in regularly
issues scheduled meetings to discuss work-related issues on a 0-
100 point scale. Score = (0-100) / 100. Maximum score = 1.
The measurement of the behavioural outcome variables is based upon broadly-accepted
definitions of these variables in prior research studies. Problem-solving is defined as an
unitary index including six equally weighted items about two indicators of problem-solving,
namely solutions found (3 items) and speed of solving problems (3 items) (Atuahene-Gima,
2003; Sheremata, 2000). The first reflects the ease with which a large number of alternative
problem solutions are identified; the latter refers to the degree of speed associated with
finding and implementing the solution (Atuahene-Gima, 2003). The maximum index score of
problem-solving is six. Three equally weighted items shape the unitary index of knowledge-
transfer. The three items reflect the extent that information about organisational problems and
opportunities is acquired and distributed in the organisation (Goh & Richards, 1997). The

HRM, organisational performance and the role of firm size
Master thesis Business & Economics 36
maximum index score of knowledge-transfer is six. Furthermore, attitudinal and behavioural
commitment are both defined as an unitary index created by three equally weighted items that
respectively reflect the extent that employees identify with their company and the extent that
employees remain with their organisation because of a high personal sacrifice when leaving
(McGee & Ford, 1987; Meyer & Allen, 1984). The maximum score of both indices is six. Job
satisfaction is measured to control for its potential association with organisations’ overall
performances (Buzawa, 1984). Job satisfaction is defined as an unitary index created by six
equally weighted items that represent two indicators of job satisfaction, namely empowerment
(3 items) and compensation (3 items) (Halsted et al., 2000; Wycoff & Skogan, 1994;
Rosenbaum et al., 1994). The maximum index score of job satisfaction is again six. At last,
effort is also defined as an unitary index including five equally weighted items (maximum
index score is six). Two items indicate the time employees commit to their jobs, and the other
three items reflect with what intensity they do their work. Effort is seen as how hard people in
organisations work to achieve goals, and that can be operationalized by the employee
resources time and energy (Patterson et al., 2005; Brown & Leigh, 1996; Blau, 1993). Table 4
summarizes previously discussed in more detail.
The measurement of the operational performance variables is also based upon broadly-
accepted definitions of these variables in prior research studies. The ratio of firm sales to
number of employees defines productivity (Guthrie et al., 2004; Huselid, 1995). Much
criticism has been aimed at the fact that this productivity ratio only considers one production
factor (i.e. labour) and therefore becomes useless in modern manufacturing operations, since
direct labour cost is becoming a smaller fraction of the total manufacturing cost (Tangen,
2003). Nevertheless, labour productivity is thought to be an appropriate performance measure
for firm productivity in services-orientated firms, because these companies have a more
labour-intensive character. Product quality is defined as an unitary index created by three
equally weighted items. These items measure the extent that products (services in this sample)
satisfy the quality and performance requirements of customers (Atuahene-Gima, 2003). The
maximum index score is six. Moreover, quality can be derived from the productivity ratio if
the assumption is made that providing (i.e. producing) services is closely related to selling
services. High quality in a firm’s operations results in no waste in employees’ effort and
working time. It makes that the employees are able to provide more services to the firm’s
customers (i.e. being able to sell more services to the customers). However, it is through the
product quality that customers want to buy the firm’s services.

HRM, organisational performance and the role of firm size
Master thesis Business & Economics 37
Table 4
Variable of interest definitions
Definitions
Components of behavioural outcomes
Problem-solving An additive score of the extent that solutions are found (3
items) and the degree of speed (3 items*); each of the items
is on a 6-point scale. Score = (score item 1 + score item 2 +
score item 3 + score item 4 + score item 5 + score item 6) /
6. Maximum score = 6.
Knowledge-transfer A score of the extent that information about organisational
problems and opportunities is acquired and distributed (3
items); each of the items is on a 6-point scale. Score =
(score item 1 + score item 2 + score item 3) / 3. Maximum
score = 6.
Attitudinal commitment A score of the extent that employees identify with their
organisation (3 items); each of the items is on a 6-point
scale. Score = (score item 1 + score item 2 + score item 3) /
3. Maximum score = 6.
Behavioural commitment A score of the extent that employees remain with their
company because of high personal sacrifice when leaving
(3 items); each of the items is on a 6-point scale. Score =
(score item 1 + score item 2 + score item 3) / 3. Maximum
score = 6.
Job satisfaction An additive score of the extent that employees are
empowered in their jobs (3 items) and that they are satisfied
with their financial compensations (3 items); each of the
items is on a 6-point scale. Score = (score item 1 + score
item 2 + score item 3 + score item 4 + score item 5 + score
item 6) / 6. Maximum score = 6.
Effort An additive score of the extent that employees commit time
to their jobs (2 items) and the degree of intensity with
which they do their work (3 items); each of the items is on a
6-point scale. Score = (score item 1 + score item 2 + score
item 3 + score item 4 + score item 5) / 5. Maximum score =
6.
* The results of these items are reverse-coded (1 = strongly agree; 2 = agree; 3 = sort of agree; 4 = sort of
disagree; 5 = disagree; 6 = strongly disagree).

HRM, organisational performance and the role of firm size
Master thesis Business & Economics 38
Furthermore, innovations are categorized in many different ways. Some scholars typify them
as radical renewals or incremental improvements; others distinguish between innovations in
products or production processes (Tidd et al., 2001; Leifer et al., 2000; Brockhoff et al., 1999;
Damanpour, 1991). This study defines innovation as an unitary index including three equally
weighted items that reflect the extent that incremental improvements occur in an
organisation’s primarily work process (products, customer service, production processes)
(Oke et al., 2007). It is more likely that a high performance work system has impact on
incremental improvements than on radical renewals. The latter is depending on many factors
over a long period of time. The status of incremental improvements can also be derived from
the productivity ratio. Griffin (1997) notices that innovation is associated with firm sales. For
example, improvements in a firm’s production process (e.g. reduced delivery time) can lead to
more provided services by the same number of employees. In addition, improvements in the
products (e.g. new features) will actually make customers want to buy those products. Table 5
summarizes previously discussed in more detail. Unfortunately, not all companies provide a
voluntary turnover rate or, instead, use the same ratio to determine it. It is therefore hard to
measure the voluntary turnover rate (De Kok & Den Hartog, 2006). This study offers a
formula4 to overcome the problem. In brief, the formula defines voluntary turnover as the
ratio of total employees left to total workforce (see appendix A). Finally, the sickness absence
rate is provided by the firms and defined excluding maternity leave (De Kok & Den Hartog,
2006).
At last, accounting standards are used to measure profit as financial performance indicator. A
standardized figure for profit is EBIT (i.e. earnings before interest and tax payments) minus
tax (Brealey & Myers, 2000). It is assumed that firm profits will be driven by productivity,
which can be modelled. In the first place, the net profit margin shows the proportion of sales
that finds its way into profits (Brealey & Myers, 2000). The net profit margin is the ratio of
EBIT minus tax to firm sales. Rebuilding this profitability ratio as follows and dividing by the
number of employees emphasize the link between (labour) productivity and profit:
(EBIT minus tax) / Employees = (Firm sales / Employees) * Net profit margin
4 http://www.bna.com/surveys/index.html

HRM, organisational performance and the role of firm size
Master thesis Business & Economics 39
Given a constant net profit margin, an increase in (labour) productivity will result in an
increase in profits (before interest payments) per employee.
Table 5
Variable of interest definitions
Definitions
Components of operational performance
Productivity A ratio of firm sales to number of employees.
Product quality A score of the extent that products satisfy the quality and
performance requirements of the customer (3 items); each
of the items is on a 6-point scale. Score = (score item 1 +
score item 2 + score item 3) / 3. Maximum score = 6.
Innovation A score of the extent that incremental improvements occur
in an organisation’s primarily work process (3 items); each
of the items is on a 6-point scale. Score = (score item 1 +
score item 2 + score item 3) / 3. Maximum score = 6.
4.5 Procedure
Now the variables of interest have been defined, it is possible to measure them. This section
will describe the procedure behind the measurement of these variables of interest.
4.5.1 Measuring instrument
Two instruments are used to measure the variables of interest. The first is the database
REACH which includes objective data. Objective data contains observable facts not involving
opinion (Tangen, 2003). The measurement of productivity and the financial performance
variables (for profit) is based upon information on certified (financial) statements in the
database.
The second instrument is a questionnaire that will include the – in last section – mentioned
items on the high performance work system, behavioural outcomes and operational
performance. These items are shown in respectively appendices B, C, and D. The selection of
these items is based upon prior research studies done by different scholars (Oke et al., 2007;
De Kok & Den Hartog, 2006; Atuahene-Gima, 2003; Way, 2002; Halsted et al., 2000; Goh &
Richards, 1997; Brown & Leigh, 1996; Meyer & Allen, 1984). A six-point Likert scale will

HRM, organisational performance and the role of firm size
Master thesis Business & Economics 40
be used on the items (1 = strongly disagree; 2 = disagree; 3 = sort of disagree; 4 = sort of
agree; 5 = agree; 6 = strongly agree). The scale on the speed of solving problems is reverse-
coded, because the items have been formulated negatively. Although measuring theories have
suggested that respondents generally do not make a sensible distinction between more than
five different answer categories, this study has chosen for six categories in order to bring
more nuances. In this way, there is more chance to find different answers between the
different respondents.
The questionnaire will obtain subjective information from the participants. Subjective data
contains perceptions or opinions (Tangen, 2003). The use of subjective data for measurements
is often criticized because there is a risk that it includes unrealistic perceptions which cause
measurement errors and biases. However, prior studies have determined that subjective
measures correlate well with objective measures (Fey et al., 2000; Starbuck & Mezias, 1996).
Moreover, perceptual data plays an important role in both research and theories about
behaviour (Starbuck & Mezias, 1996). It is thereby hard to get (even if available) objective
information about a firm’s sickness absence rate and voluntary turnover rate (De Kok & Den
Hartog, 2006). That is also thought for product quality and incremental improvements. The
high performance work system is measured by using subjective data, thereby following prior
studies (Way, 2002; Ichniowski et al., 1997; Huselid, 1995).
4.5.2 Measuring time
The research framework describes a positive relationship between the high performance work
system and financial performance. Hypothesis 1 emphasizes this relationship. The best way to
examine causality is to do a longitudinal study. A longitudinal study is designed to permit
observations of the same phenomena over an extended period (Babbie, 2000). This kind of
study is one of the two options in the design of research to deal with the issue of time. The
other option is a cross-sectional study which involves observations of a sample, or cross
section, of a population or phenomenon that are made at one point in time (Babbie, 2000).
Cross-sectional studies are not suitable as a means to aim at understanding causal processes
that occur over time, because those studies’ conclusions are based on observations made at
only one time (Babbie, 2000). However, practical implications of measuring the different
variables at different points in time make that this study is cross-sectional. First, the most
recent data for measuring the last part of the causal chain – financial performance – is per 31st
of December, year 2006. The financial statements in REACH include additive data over the

HRM, organisational performance and the role of firm size
Master thesis Business & Economics 41
year 2006. Then, the obtained data about the independent variable HPWS and the
intermediate variables (behavioural outcomes and operational performance indicators) should
be from before year 2006. This is not desirable, because it increases the opportunity that
respondents will give useless or incomplete information due to unreliable perceptions they
have about the past. Therefore, the measurement of the variables of interest is at a single time
frame – taking a snap shot, so to speak, of the variables at a particular point in history
(Babbie, 2000). The single time frame is year 2006.
4.5.3 Data collection
As mentioned before, thirty-two companies have been selected at random as sample group in
this research study. These companies were called to ask if they want to participate in the
research. The telephone call tried to persuade them to join by informing what the research
includes, and why it can be advantageous for these companies to be involved in this research
(e.g. to get more knowledge about possible effects of HRM). All thirty-two companies
allowed me to send a standardized e-mail with information about the design of the research
(appendix E), and which included three different questionnaires. This e-mail was in all thirty-
two cases sent to a HR representative. Each of the questionnaires is meant for one target
group of respondents in the selected companies (see respondents questionnaires, page 67).
The choice for three target groups is based upon the questionnaire items from appendices B,
C, and D. Some of these items are namely most appropriate to expose to employees; other
items are more appropriate to expose to the chief executive officer (or a business manager)
and, once again, other items are more appropriate to expose to a HRM specialist (from the HR
department). Thus, the three questionnaires contain the items on the HPWS, behavioural
outcomes and operational performances. Moreover, questions related to the proposed
characteristics of smaller firms have also been processed in the questionnaires. The response
on the e-mail was low, resulting in a telephone follow-up. Next, two more e-mails were sent
in almost three weeks in order to ask (or remember) the selected companies again about if
they want to participate in this empirical research study. Ultimately, fifteen companies agreed
to participate (anonymously) in the research. The other seventeen firms were not interested to
participate or had not completed the questionnaires.
Finally, fifteen companies have completed three different questionnaires. It means that there
are forty-five different observations – the units of observation are three different respondents
per firm (chief executive officer, HRM specialist, and employee). However, (only) one firm

HRM, organisational performance and the role of firm size
Master thesis Business & Economics 42
has supplied completed questionnaires from five employees. Consequently, this study’s total
is forty-nine different observations. These observations are divided over the high performance
work system (fifteen observations of the CEO or HRM specialist), behavioural outcomes
including product quality (nineteen observations of the employees), and the operational
performances excluding product quality and productivity (fifteen observations of the CEO or
HRM specialist).
4.6 Reliability and validity
Important is to keep in mind the quality of the measuring process. The quality is often derived
from two scientific standards: reliability and validity. Babbie (2000) defines reliability as „a
matter of whether a particular technique, applied repeatedly to the same object, yields the
same result each time”. This study’s technique (i.e. questionnaires) gathers information about
the variables of interest, but thereby obtains it from the respondents. Reliability problems can
arise then. It is not unlikely that the respondents will give – at different times – different
answers to the items in the questionnaires. Fortunately, there are several ways to check if
measures are reliable – for example the test-retest method and split-half method (Babbie,
2000). The items, used in this study’s questionnaires to measure the different variables of
interest, have proven their reliability in previous research (Oke et al., 2007; De Kok & Den
Hartog, 2006; Atuahene-Gima, 2003; Way, 2002; Halsted et al., 2000; Goh & Richards, 1997;
Brown & Leigh, 1996; Meyer & Allen, 1984). It is another way to help insure reliability in
getting information from people (Babbie, 2000). These prior studies have also shown that
there is a broad agreement that the particular items adequately reflect the meaning of the
variables of interest. Briefly, the measure items are considered valid. Validity refers „the
extent to which an empirical measure adequately reflects the real meaning of the concept
under consideration” (Babbie, 2000).

HRM, organisational performance and the role of firm size
Master thesis Business & Economics 43
5. Analyses and results
The fact that the different questionnaires have been completed for every firm in the sample
(without missing values) will provide data about the state of the high performance work
system, behavioural outcomes and operational performances in these organisations. Table 6
shows the values of one firm’s item scores on the behavioural outcomes and product quality.
These values are derived from the employee questionnaire that has been completed by five
different employees (i.e. respondents) in this firm 9. The medians of these values are used to
represent the state of the behavioural outcomes and product quality in firm 9. Chosen now for
the median (instead of the mean) is in order to prevent for getting values for firm 9 that cannot
be realized by the other firms in the sample. Tables 7-10 summarize the measured scores on
respectively the HPWS plus the behavioural outcomes, attitudinal commitment, operational
performance and financial performance for all fifteen companies (including firm 9). These
scores are again based upon data from the completed questionnaires – except for the figures
on productivity and the financial performance. Both are derived from information in the
database REACH. Finally, the measured scores have been linked to the data on the firm
characteristics firm size, firm age, and sector of industry.
These measuring results will be analyzed (i.e. quantitative analysis) in order to test the
hypotheses on significance and, ultimately, to help formulating a conclusion on this study’s
problem statement. Before, section 5.1 will be involved in some univariate analyses.
5.1 Univariate analyses
The simplest form of quantitative analysis, univariate analysis, describes a case in terms of a
single variable (Babbie, 2000). The most basic format for presenting univariate data is shown
in the tables i-iv in appendix F. Those include descriptions of the number of times that the
various values of the variables are observed in the sample, called frequency distributions.
Table i shows the frequency distribution of the high performance work system. This
distribution is also graphically described in classes by a histogram in figure i in appendix F.
First to notice is that two values of the variable HPWS have both been measured twice in the
sample (3.00 and 3.20), which means that there are two pairs of firms that have the same
degree of HPWS presence in their organisation. However, it does not mean that their high
performance work systems include the same composition of the seven HR practices. For
example, table 11 summarizes the HPWS composition for the firms that have a 3.00 score.

HRM, organisational performance and the role of firm size
Master thesis Business & Economics 44
Table 6
Median values of firm 9
Behavioural outcome scores Operational performance scores
Respondent Problem-solving Knowledge-transfer Behavioural commitment Job satisfaction Effort Attitudinal commitment Product quality
1 4.00 3.33 3.67 3.50 3.00 1.33 5.00
2 3.50 3.67 1.33 3.83 3.80 3.33 4.33
3 3.83 3.67 3.33 3.33 4.40 2.33 5.00
4 4.33 5.67 1.33 5.17 4.00 5.67 5.67
5 3.33 2.67 2.00 2.50 3.80 3.33 3.67
Median 3.83 3.67 2.00 3.50 3.80 3.33 5.00
Table 7
Measured scores on the HPWS and behavioural outcomes for all companies in the sample
Behavioural outcome scores
Firm Firm size Firm age Sector of industry HPWS score Problem-solving Knowledge-transfer Behavioural commitment Job satisfaction Effort
1 25 7 consultancy 3,00 4,00 4,00 4,00 5,00 4,00
2 32 16 wholesale trade 2,30 3,83 4,67 2,67 3,50 4,00
3 33 9 inspection & control 3,35 4,00 4,33 3,00 3,17 4,00
4 48 22 wholesale trade 3,00 4,83 4,00 2,00 3,50 3,80
5 48 53 wholesale trade 3,85 4,00 4,67 3,67 4,67 4,00
6 68 16 automation services 3,20 4,67 3,67 2,00 4,33 3,80
7 85 32 rental of transport 4,25 3,83 4,67 3,33 4,17 6,00
8 89 12 consultancy 3,15 5,00 5,00 2,33 4,00 3,40
9 119 7 consultancy 2,40 3,83 3,67 2,00 3,50 3,80
10 149 101 wholesale trade 3,05 4,17 3,67 3,33 5,00 4,60
11 152 19 consultancy 3,90 4,00 4,00 4,00 5,17 3,20
12 160 6 consultancy 3,20 4,33 4,33 3,00 4,50 4,60
13 161 9 services regarding sports 2,80 4,67 5,00 3,00 4,83 3,60
14 187 18 private education 3,65 3,83 3,33 2,33 5,17 3,80
15 199 7 telecommunication 4,10 4,50 4,00 3,00 4,00 3,40

HRM, organisational performance and the role of firm size
Master thesis Business & Economics 45
Table 8
Measured scores on the attitudinal commitment for all companies in the sample
Behavioural outcome scores
Firm Firm size Firm age Sector of industry Attitudinal commitment
1 25 7 consultancy 3.00
2 32 16 wholesale trade 3.67
3 33 9 inspection & control 3.67
4 48 22 wholesale trade 3.33
5 48 53 wholesale trade 4.00
6 68 16 automation services 3.00
7 85 32 rental of transport 4.67
8 89 12 consultancy 4.00
9 119 7 consultancy 3.33
10 149 101 wholesale trade 3.00
11 152 19 consultancy 5.00
12 160 6 consultancy 3.67
13 161 9 services regarding sports 4.33
14 187 18 private education 3.33
15 199 7 telecommunication 3.33

HRM, organisational performance and the role of firm size
Master thesis Business & Economics 46
Table 9
Measured scores on the operational performance for all companies in the sample
Operational performance scores
Firm Firm size Firm age Sector of industry HPWS degree Product quality Innovation Sickness absence rate Voluntary turnover rate Productivity
1 25 7 consultancy 3.00 5.00 5.33 less than 2 0.04 € 641,440
2 32 16 wholesale trade 2.30 5.00 4.67 3 - less than 4 0.03 € 180,625
3 33 9 inspection & control 3.35 6.00 4.33 4 - less than 5 0.09 € 100,333
4 48 22 wholesale trade 3.00 4.67 4.67 3 - less than 4 0.04 € 1,482,146
5 48 53 wholesale trade 3.85 6.00 4.33 4 - less than 5 0.10 € 1,478,896
6 68 16 automation services 3.20 3.33 4.33 3 - less than 4 0.16 € 64,338
7 85 32 rental of transport 4.25 5.33 4.33 less than 2 0.06 € 609,459
8 89 12 consultancy 3.15 5.00 5.00 4 - less than 5 0.02 € 117,056
9 119 7 consultancy 2.40 5.00 5.00 4 - less than 5 0.02 € 75,613
10 149 101 wholesale trade 3.05 5.00 4.67 5 - less than 6 0.05 € 309,940
11 152 19 consultancy 3.90 5.00 5.00 2 - less than 3 0.03 € 82,572
12 160 6 consultancy 3.20 4.67 4.67 3 - less than 4 0.06 € 57,231
13 161 9 services regarding
sports 2.80 4.67 4.33 2 - less than 3 0.02 € 108,534
14 187 18 private education 3.65 4.00 5.00 4 - less than 5 0.05 € 59,604
15 199 7 telecommunication 4.10 5.00 4.67 4 - less than 5 0.04 € 388,884

HRM, organisational performance and the role of firm size
Master thesis Business & Economics 47
Table 10
Measured scores on the financial performance for all companies in the sample
Financial performance
Firm Firm size Firm age Sector of industry HPWS degree Net profit margin (EBIT - tax) / employees
1 25 7 consultancy 3.00 0.0197 € 12,640
2 32 16 wholesale trade 2.30 -0.0393 -€ 7,094
3 33 9 inspection & control 3.35 0.0172 € 1,727
4 48 22 wholesale trade 3.00 0.0345 € 51,167
5 48 53 wholesale trade 3.85 0.0719 € 106,292
6 68 16 automation services 3.20 0.0080 € 515
7 85 32 rental of transport 4.25 0.1882 € 114,682
8 89 12 consultancy 3.15 0.0263 € 3,079
9 119 7 consultancy 2.40 0.0445 € 3,368
10 149 101 wholesale trade 3.05 0.0396 € 12,262
11 152 19 consultancy 3.90 0.0800 € 6,605
12 160 6 consultancy 3.20 0.0040 € 231
13 161 9 services regarding sports 2.80 0.0065 € 708
14 187 18 private education 3.65 0.0905 € 5,396
15 199 7 telecommunication 4.10 0.0655 € 25,487
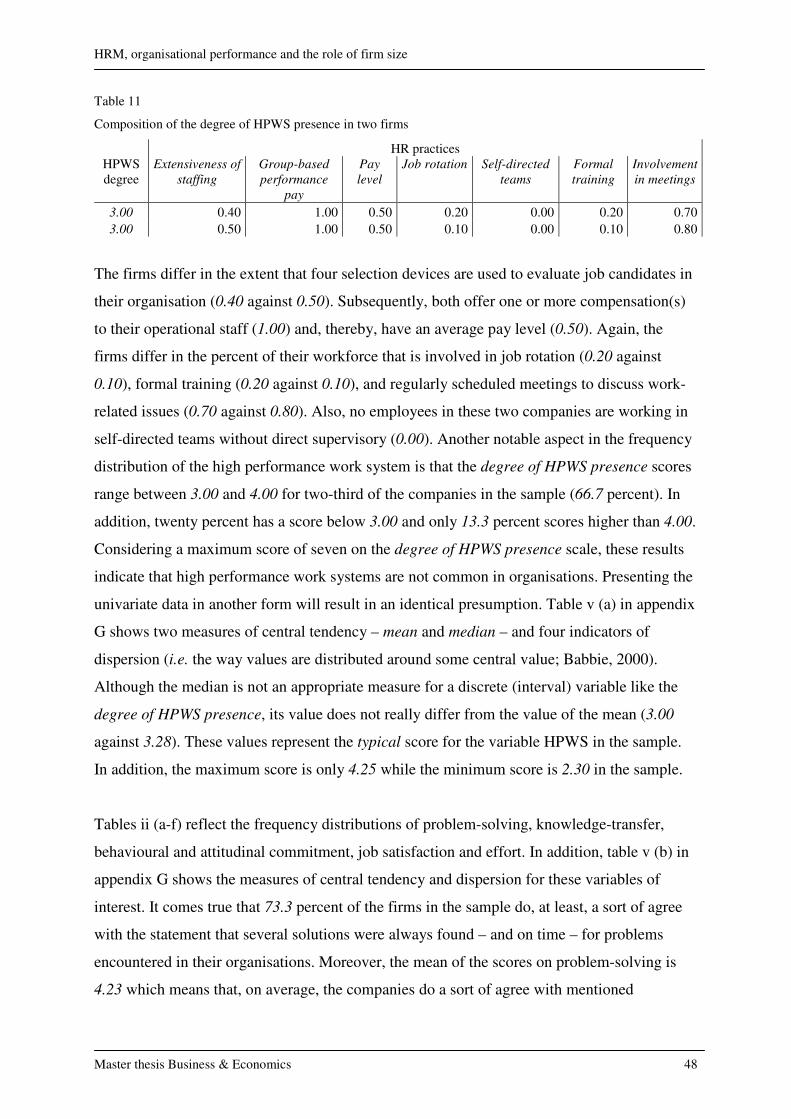
HRM, organisational performance and the role of firm size
Master thesis Business & Economics 48
Table 11
Composition of the degree of HPWS presence in two firms
HR practices
HPWS
degree
Extensiveness of
staffing
Group-based
performance
pay
Pay
level
Job rotation Self-directed
teams
Formal
training
Involvement
in meetings
3.00 0.40 1.00 0.50 0.20 0.00 0.20 0.70
3.00 0.50 1.00 0.50 0.10 0.00 0.10 0.80
The firms differ in the extent that four selection devices are used to evaluate job candidates in
their organisation (0.40 against 0.50). Subsequently, both offer one or more compensation(s)
to their operational staff (1.00) and, thereby, have an average pay level (0.50). Again, the
firms differ in the percent of their workforce that is involved in job rotation (0.20 against
0.10), formal training (0.20 against 0.10), and regularly scheduled meetings to discuss work-
related issues (0.70 against 0.80). Also, no employees in these two companies are working in
self-directed teams without direct supervisory (0.00). Another notable aspect in the frequency
distribution of the high performance work system is that the degree of HPWS presence scores
range between 3.00 and 4.00 for two-third of the companies in the sample (66.7 percent). In
addition, twenty percent has a score below 3.00 and only 13.3 percent scores higher than 4.00.
Considering a maximum score of seven on the degree of HPWS presence scale, these results
indicate that high performance work systems are not common in organisations. Presenting the
univariate data in another form will result in an identical presumption. Table v (a) in appendix
G shows two measures of central tendency – mean and median – and four indicators of
dispersion (i.e. the way values are distributed around some central value; Babbie, 2000).
Although the median is not an appropriate measure for a discrete (interval) variable like the
degree of HPWS presence, its value does not really differ from the value of the mean (3.00
against 3.28). These values represent the typical score for the variable HPWS in the sample.
In addition, the maximum score is only 4.25 while the minimum score is 2.30 in the sample.
Tables ii (a-f) reflect the frequency distributions of problem-solving, knowledge-transfer,
behavioural and attitudinal commitment, job satisfaction and effort. In addition, table v (b) in
appendix G shows the measures of central tendency and dispersion for these variables of
interest. It comes true that 73.3 percent of the firms in the sample do, at least, a sort of agree
with the statement that several solutions were always found – and on time – for problems
encountered in their organisations. Moreover, the mean of the scores on problem-solving is
4.23 which means that, on average, the companies do a sort of agree with mentioned

HRM, organisational performance and the role of firm size
Master thesis Business & Economics 49
statement. Most of these sample scores are also situated close to 4.23 – considering the low
standard deviation. Again, 73.3 percent do, at least, a sort of agree with the statement that
information about organisational problems and opportunities is acquired and distributed in the
organisation. The mean is 4.20 and most of the scores are situated close to 4.20. By these
outcomes it seems that problem-solving behaviour and knowledge-transfer will be present in
most of the companies. Next, twenty percent of the firms in the sample disagree with personal
sacrifice (when leaving) as the reason for their employees to stay with the organisation, and
once more 66.7 percent cannot find, at least, a sort of agreement with this argument to remain
in the organisation. The maximum score on behavioural commitment is just 4.00 while most
of the scores are near 2.91. It does presume that the behavioural commitment is low in the
organisations. Notable is that also 66.7 percent do not, at least, a sort of agree with the
statement that their employees are identifying with the company. The mean of attitudinal
commitment is only 3.69 and most of the scores are between 3.10 and 4.30. The attitudinal
commitment in the companies is low but, however, it seems to be higher than the level of
behavioural commitment. Furthermore, the results indicate that job satisfaction is present in
most of the companies in the sample. A high percent (73.3 percent) do, at least, a sort of agree
with the statement that their employees are satisfied with their empowerment opportunities
and financial compensations. Even 26.7 percent just agree with this statement. Finally, the
firms are divided by their opinions about the statement that their employees commit much
time and energy in their work. More than fifty percent (53.3 percent) do a sort of disagree
with this statement while 47.7 percent do, at least, a sort of agree with. One firm even strongly
agrees with the statement. A high level of effort is not all recognizable for every company,
which is also indicated by a high range (2.80).
Tables iii (a-d) show the frequency distributions of product quality, innovation, sickness
absence rate and voluntary turnover rate. Because all values of productivity are unique
observations, instead of describing a frequency distribution, a histogram will reflect the
number of times that classes of productivity have been observed (figure iii). Table v (c) in
appendix G presents the measures of tendency and dispersion for these variables of interest. In
addition, table v (d) in appendix G shows the measures of tendency and dispersion for the
financial performance. Moreover, figure iv includes a histogram that reflects classes of profit.
It will be meaningful to discuss the variables product quality and innovation in more detail
here. The product quality seems to be adequate in the companies from the sample, because
26.7 percent do a sort of agree with the statement that their products conform the quality and

HRM, organisational performance and the role of firm size
Master thesis Business & Economics 50
performance requirements of their customers. Once more 66.7 percent agree or strongly agree
with this statement. The mean of the scores on product quality is also high (4.91) and,
moreover, most of these scores are between 4.25 and 5.57. At last, innovation seems to be
also present in these companies – although its level, on average, is lower than the level for
product quality (4.69 against 4.91). All firms do, at least, a sort of agree with the statement
that incremental improvements often occur in their primarily work process.
Univariate analyses describe the units of analysis of this study. For example, the percent of
companies that have an adequate product quality is described. Yet, those analyses have to be
showed in the right perspective. In the first place, the descriptive assumptions regarding the
firms in the sample are mostly based upon scores that have been derived from observations of
three different respondents per firm. It makes that the opinions of three employees will
represent the situation in the organisation. Secondly, the descriptive assumptions are related to
year 2006 which means that it is uncertain if those still weigh in the current situation of the
companies. Moreover, it increases the opportunity that the respondents have given less useful
or incomplete information due to less reliable perceptions they have about the past. Both
remarks will also apply for further analyses. Finally, univariate analyses are not aimed at
explanation.
5.2 Correlations
A single variable is involved in univariate analysis, but often two or more variables are
involved in analyses that are aimed at simply descriptive, comparative or explanatory
purposes. What variables will be involved in such analyses depends upon the assumptions
made in the theoretical part. First, this study suggests relationships between the high
performance work system on the one hand, and behavioural outcomes, operational
performances and financial performance on the other hand. These main relationships are
characterized by several intervening relationships between the variables of interest. This
concept has been outlined previously in figure 3. Correlations between these variables of
interest will give a first insight in their relationships. Notice that with that it is assumed that
the relationships are linear. The Pearson product-moment correlations (r) are given in the
correlation-matrix below. Thus, the matrix will show only the correlations between the
variables of interest that are supposed to be related to each other (according to the theoretical
framework). The information is based upon output from the statistical program SPSS.

HRM, organisational performance and the role of firm size
Master thesis Business & Economics 51
Table 12
Correlation-matrix: correlations between the variables of interest
Firm size HPWS Effort Product quality Innovation Vol. turnover rate Sickn. absence rate Productivity
correlation 1 .287 Firm size
valid observations 15 15
correlation .287 1 .221 .187 -.211 .264 -.121 .216 HPWS
valid observations 15 15 15 15 15 15 15 15
correlation .125 Firm age
valid observations 15
correlation -.093 -.348* Problem-solving
valid observations 15 15
correlation -.022 -.367* Knowledge-transfer
valid observations 15 15
correlation .428* -.086 Behav. commitment
valid observations 15 15
correlation .115 -.251 Att. commitment
valid observations 15 15
correlation .320* -.020 -.217 Job satisfaction
valid observations 15 15 15
correlation .216 .150 .352* -.173 .114 -.077 1 Productivity
valid observations 15 15 15 15 15 15 15
correlation .585** .752** Profitability
valid observations 15 15
** Level of significance is α = 0.05
* Level of significance is α = 0.25

HRM, organisational performance and the role of firm size
Master thesis Business & Economics 52
Moreover, the correlations between firm size and firm age on the one hand, and the high
performance work system on the other hand are given in the matrix. In chapter three is namely
suggested that no significant relationship will occur between firm size and any HPWS
presence. Also, no companies operating less than five years have been selected for this
study’s sample group. It is to increase the opportunity that the companies in the sample do
have some of the high performance work system in their organisation. It suggests a
(restricted) relationship between firm age (0 ≤ firm age < 5) and the degree of HPWS
presence. However, the limiting value of five years has been chosen arbitrary. Perhaps there
(also) is a relationship between firm age (≥ 5 years) and the degree of HPWS presence. At
last, the correlation between firm size and attitudinal commitment is shown (hypothesis 2).
5.2.1 Interpretation of results
Two correlations appear to be significant at a significance level of 0.05. The correlation
between the degree of HPWS presence and profitability equals r = 0.585, which indicates a
positive association between both variables (R Square = 0.34; the HPWS “explains” thirty-
four percent of the variance in profit, or vice versa). The other correlation – between
productivity and profitability – equals r = 0.752, which indicates a strong positive association
between both variables. This is not surprisingly if the modelled relationship between EBIT
minus tax and firm sales is considered in chapter four.
On second thoughts, by using a more liberal approach of the significance level because of the
small sample size, more variables of interest might also be somehow related to each other. At
a significance level of 0.25, as expected, a presence of the high performance work system is
positively associated with behavioural commitment (r = 0.428) and job satisfaction (r =
0.320). In addition, product quality is positively associated with productivity. However, more
surprisingly seem the negative associations between problem-solving and product quality (r =
-0.348), and between knowledge-transfer and innovation (r = -0.367).
5.3 Firm size, firm age and HPWS
The correlation outcome already indicates that firm size is not significantly related to the high
performance work system. Any presence of the HPWS will not significantly differ between
smaller and larger companies. This study hypothesizes no relationship between firm size and
the degree of HPWS presence. It is possible to describe the degrees per subgroups smaller
firms (with ten up to 100 employees) and larger firms (with 100 up to 200 employees). The
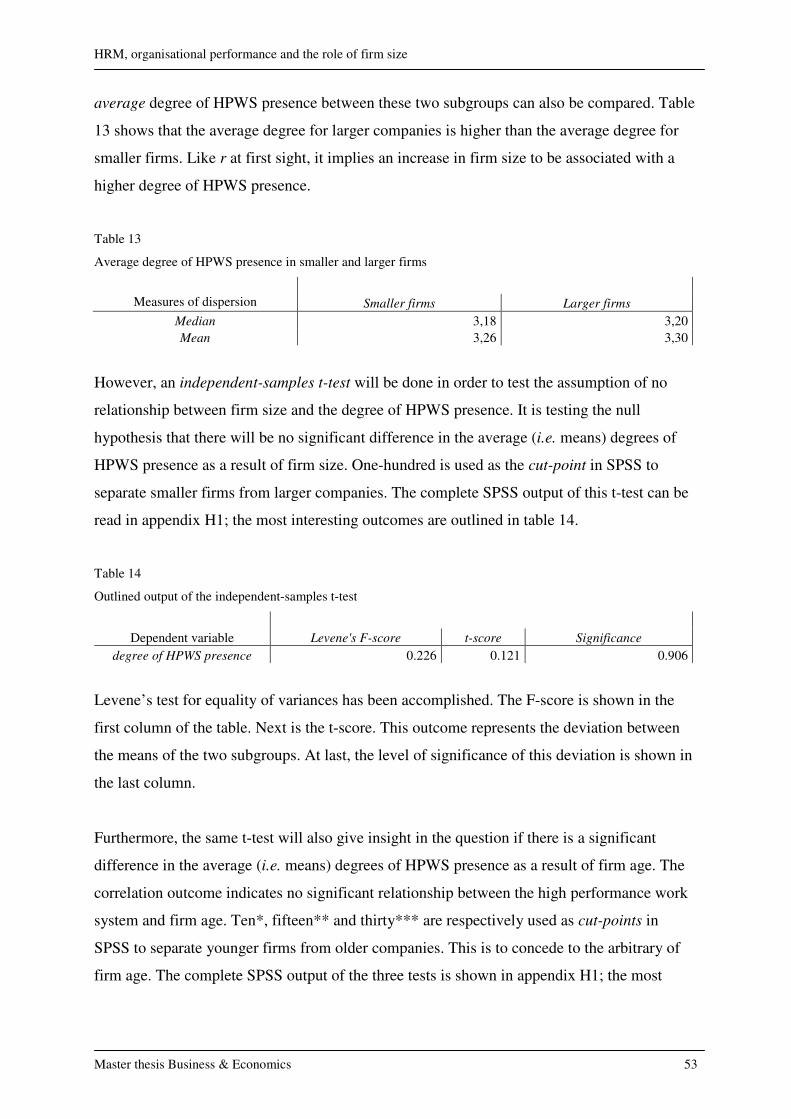
HRM, organisational performance and the role of firm size
Master thesis Business & Economics 53
average degree of HPWS presence between these two subgroups can also be compared. Table
13 shows that the average degree for larger companies is higher than the average degree for
smaller firms. Like r at first sight, it implies an increase in firm size to be associated with a
higher degree of HPWS presence.
Table 13
Average degree of HPWS presence in smaller and larger firms
Measures of dispersion Smaller firms Larger firms
Median 3,18 3,20
Mean 3,26 3,30
However, an independent-samples t-test will be done in order to test the assumption of no
relationship between firm size and the degree of HPWS presence. It is testing the null
hypothesis that there will be no significant difference in the average (i.e. means) degrees of
HPWS presence as a result of firm size. One-hundred is used as the cut-point in SPSS to
separate smaller firms from larger companies. The complete SPSS output of this t-test can be
read in appendix H1; the most interesting outcomes are outlined in table 14.
Table 14
Outlined output of the independent-samples t-test
Dependent variable Levene's F-score t-score Significance
degree of HPWS presence 0.226 0.121 0.906
Levene’s test for equality of variances has been accomplished. The F-score is shown in the
first column of the table. Next is the t-score. This outcome represents the deviation between
the means of the two subgroups. At last, the level of significance of this deviation is shown in
the last column.
Furthermore, the same t-test will also give insight in the question if there is a significant
difference in the average (i.e. means) degrees of HPWS presence as a result of firm age. The
correlation outcome indicates no significant relationship between the high performance work
system and firm age. Ten*, fifteen** and thirty*** are respectively used as cut-points in
SPSS to separate younger firms from older companies. This is to concede to the arbitrary of
firm age. The complete SPSS output of the three tests is shown in appendix H1; the most

HRM, organisational performance and the role of firm size
Master thesis Business & Economics 54
interesting outcomes are outlined in table 15. Levene’s test for equality of variances has been
accomplished again.
Table 15
Outlined output of the independent-samples t-test
Dependent variable Levene's F-score t-score Significance
degree of HPWS presence * 0.173 0.745 0.469
degree of HPWS presence ** 0.868 0.852 0.410
degree of HPWS presence *** 0.050 1.533 0.149*
* Level of significance is α = 0.25
5.3.1 Interpretation of results
In short, any presence of the high performance work system in an organisation will not be
depending upon the size of that organisation. The two-tailed probability p = 0.906 is far more
than the significance levels of 0.05 or 0.25, which means that the null hypothesis will not be
rejected. This study’s previous assumption regarding no significant difference in the degree of
HPWS presence between smaller and larger firms will hold here.
There is some reason to accept that the age of companies (≥ 5 years) could influence the
presence of the high performance work system in organisations. The t-tests show that a
difference in firm age is not leading to a significant difference in the degree of HPWS
presence at a significance level of 0.05 (p-values are 0.469; 0.410; 0.149). However, it is
interesting to notice that the p-values decline when the cut-point is becoming higher.
Considering a significance level of 0.25, this decline suggests that firm age will indeed play a
role in the presence of the HPWS in the long run.
5.4 Analysis of hypotheses
Before starting with the final analyses that combine testing hypotheses 1 and 3 – 6, this
section will first do a path analysis of the research framework. Because of its unique character
hypothesis 2 will be analyzed at last.
5.4.1 Path analysis
Section 5.2 notices several intervening relationships between this study’s variables of interest.
Figure 3 demonstrates paths that reflect those relationships of independent (HPWS),
intermediate (e.g. effort and innovation) and dependent (profitability) variables. According to

HRM, organisational performance and the role of firm size
Master thesis Business & Economics 55
the theory these paths should explain how HRM will influence organisational performance. It
is possible to test the significance of the paths by partial regressions. Partial regressions
measure the extent of effect of one variable on another variable in the path model, thereby
controlling for other prior variables5. It is another way to get an idea of potential stimulating
effects of the variables of interest. Figure 4 presents the path model with its path coefficients
(standardized regression coefficients – betas). Those coefficients reflect the extent of effect of
the relationships in the model.
HPWS
Job satisfaction
Solving problems
Knowledge-transfer
Attit. commitment
Effort
Productivity
Voluntary turnover
Innovation
Product quality
Sickness absence
Profitability
.320* -.006
-.022
-.093
.656**
-.348*
-.020
.212
-.258
-.007
.408
-.367*
-.131
-.217
-.443**
Figure 4: A path analysis of the research framework.
Behav. commitment.428* .018
5.4.1.1 Interpretation of results
Notice that most part of the path analysis is done by bivariate regressions (a dependent
variable and a single exogenous variable). This means that most standardized regression
coefficients (betas) will be the same as the correlations from section 5.2. Yet, it is particularly
interesting for those paths that have more than one exogenous variable:
(Path 1) Voluntaryturnover = β1 * attitudinalcommitment + β2 * behaviouralcommitment
(Path 2) Productivity = β3 * productquality + β4 * innovation + β5 * voluntaryturnover +
Β6 * effort + β7 * sicknessabsence
(Path 3) Profitability = β8 * productivity + β9 * HPWS
The partial regression analysis of path 1 shows there is reason to accept the assumption made
in paragraph 3.3.4 that attitudinal commitment is having more impact on the voluntary
5 http://www2.chass.ncsu.edu/garson/pa765/path.htm

HRM, organisational performance and the role of firm size
Master thesis Business & Economics 56
turnover rate (i.e. lower rate) than behavioural commitment. The beta of attitudinal
commitment indicates a negative relationship between the variable and voluntary turnover
rate. However, the betas are not significant – thus no relationships between behavioural and
attitudinal commitment on the one hand, and voluntary turnover on the other hand. The partial
regression analysis of path 2 also shows no significant relationships between the four
operational performance indicators and effort on the one hand, and productivity on the other
hand. At last, the analysis of path 3 implies both productivity and HPWS to be positively
related to profitability. Their betas – respectively β8 = 0.656 and β9 = 0.443 – are significant at
a significance level of 0.05.
A limitation of path analysis is its sensitivity to model specification, because failure to include
relevant causal variables or inclusion of extraneous variables often substantially affects the
path coefficients6. This limitation needs to be recognized when drawing conclusions based
upon path analyses.
5.4.2 Hypotheses 1 and 3 – 6
Hypothesis 1 explicitly suggests a relationship between the degree of HPWS presence on the
one hand, and the behavioural outcomes, operational performances and financial performance
on the other hand. The following linear function describes that relationship (sample
estimation):
(1) Yi = b0i + b1i * HPWS + ei whereby: Yi = every i dependent variable
b0i = the intercept
b1i = the regression coefficient
ei = the residual
There are eleven (i = 1, 2…11) dependent variables of interest (five behavioural outcomes,
five operational performances, and one financial performance). The model predicts the value
of i dependent variable by knowing the value of the degree of HPWS presence. However, this
model is not sufficient in order to reflect hypotheses 3 – 6. Those hypotheses suggest that firm
size will change – interact – the relationships between the degree of HPWS presence and i
dependent variables of interest. For example, the impact of the high performance work system
6 http://www2.chass.ncsu.edu/garson/pa765/path.htm

HRM, organisational performance and the role of firm size
Master thesis Business & Economics 57
on the behavioural outcomes is expected to be stronger in larger companies than in smaller
firms (hypothesis 3). An interaction term will therefore be added to the model to incorporate
the joint effect of the two variables degree of HPWS presence and firm size on i dependent
variables of interest. The interaction term is a cross-product of standardized variables. The
degree of HPWS presence is considered to be already a standardized variable; firm size is
standardized in SPSS by the syntax command Rank firmsize / percent (Ganzeboom, 2003).
The model is as follows:
(2) Yi = b0i + b1i * HPWS + b2i * firmsize + b3i * HPWS * firmsize + ei
Rebuilding the model yields:
(2a) Yi = b0i + (b1i + b3i * firmsize) * HPWS + b2i * firmsize + ei
Based upon this model (2a) it is possible to do a multiple regression analysis for each of i
dependent variables of interest (i.e. eleven regressions). The output regarding term (b1i + b3i *
firmsize) gives an indication of the effect of the HPWS on respectively the behavioural
outcomes, operational performances and financial performance – which is interesting in
testing hypothesis 1. In addition, parameter b3i indicates the role of firm size in the strength of
the HPWS impact – which is interesting in testing hypotheses 3 up to 6. The regression output
produced by SPSS is outlined in table 16.
Table 16
Outlined output of regression analyses
Regression coefficient
i Dependent variable of interest b1i b2i b3i
1 Problem-solving -.685* -.015* .010*
2 Knowledge-transfer -.292 -.012 .006
3 Behav. commitment 1.799** .032** -.021**
4 Job satisfaction 1.328** .034** -.018*
5 Effort 1.370* .025* -.018*
6 Product quality .924* .011 -.010
7 Innovation -.086 .003 -.001
8 Vol. turnover rate .034 .000 .000
9 Sickn. absence rate -.757 -.003 .006
10 Productivity 349055.7 -3366.52 -618.611
11 Profitability 65654.976* 219.127 -312.494
** Level of significance is α = 0.05
* Level of significance is α = 0.25

HRM, organisational performance and the role of firm size
Master thesis Business & Economics 58
5.4.2.1 Interpretation of results
Hypothesis 1 assumes that a higher (lower) degree of HPWS presence will result in a higher
(lower) level of i dependent variables of interest (the reverse for the sickness absence and
voluntary turnover rates) in both smaller and larger companies. The regression coefficients b1i
and b3i together determine the extent and direction of the HPWS effect on the behavioural
outcomes, operational performances and financial performance. Unfortunately, the regression
analyses show that these parameters are not significant for knowledge-transfer, innovation,
voluntary turnover, sickness absence and productivity. Those analyses will not support any
presumption that the high performance work system is related to these outcomes. However,
the coefficients for product quality and profitability (respectively b16 = 0.924 and b111 =
65,654.976) are significant at a significance level of 0.25. This indicates a positive
relationship between the high performance work system on the one hand, and operational and
financial performance on the other hand. In addition, the coefficients for problem-solving,
behavioural commitment, job satisfaction and effort do suggest a significant relationship
between the high performance work system on the one hand, and the behavioural outcomes on
the other hand. Yet, problem-solving seems to be stimulated by the HPWS only in large
companies while, instead, any presence of the high performance work system is negatively
related to problem-solving in small firms. Finally, the other three behavioural outcomes seems
to be stimulated by the HPWS only in small firms while, instead, any presence of the high
performance work system is negatively related to behavioural commitment, job satisfaction
and effort in large companies. In brief, hypothesis 1 is only supported for product quality and
profitability.
Hypotheses 3 – 6 assume that the impact of the high performance work system on the
behavioural outcomes, operational performances and financial performance will differ as a
result of firm size. As mentioned before, the regression coefficient b3i determines the extent
and direction of the effect that firm size has on the HPWS impact. Hypothesis 3 assumes that
the impact on the behavioural outcomes will be stronger in larger companies for any given
degree of HPWS presence than in smaller firms. This hypothesis is partially supported. It
seems that the HPWS impact on problem-solving is significant higher if the size of the
organisation is growing (although the extent of this increasing impact is not high). However,
it is surprising that the HPWS impact on behavioural commitment, job satisfaction and effort
becomes significantly less strong in larger companies than in smaller firms. In brief,
hypothesis 3 is only supported for problem-solving.

HRM, organisational performance and the role of firm size
Master thesis Business & Economics 59
Hypothesis 4 assumes that the impact on productivity will be stronger in larger companies for
any given degree of HPWS presence than in smaller firms. Moreover, it assesses a stronger
positive impact on the voluntary turnover rate (i.e. a lower rate) in smaller firms than in larger
companies. The coefficient for productivity is b310 = -618.611 which indicates, instead of an
expected stronger impact in larger companies, an impact on productivity that will decrease
when the firm is becoming larger. Yet, this interpretation cannot be accepted at a significance
level of 0.25. Neither it is acceptable to believe that a positive HPWS impact on the voluntary
turnover rate will be significantly stronger in smaller firms than in larger companies. The
parameter for voluntary turnover does not even suggest any interacting firm size effect (b38 =
0.000). In brief, hypothesis 4 is rejected.
Hypothesis 5 assumes that the impact on product quality and innovation will be stronger in
smaller firms for any given degree of HPWS presence than in larger companies. Moreover, it
assesses a stronger positive impact on the sickness absence rate (i.e. a lower rate) in larger
companies than in smaller firms. The coefficients for product quality and innovation are
respectively b36 = -0.010 and b37 = -0.001 which indicate, as expected, an impact on these two
operational performances that will decrease in strength when the firm is becoming larger.
Again, this interpretation cannot be accepted at a significance level of 0.25. Neither it is
acceptable to believe that a positive HPWS impact on the sickness absence rate will be
stronger in larger companies. The parameter for sickness absence (b39 = 0.006) suggests
otherwise but, anyhow, is not significant. In brief, hypothesis 5 is rejected.
Hypothesis 6 assumes that the impact on profitability will be stronger in larger companies for
any given degree of HPWS presence than in smaller firms. The coefficient for profitability is
b311 = -312.494 which indicates, instead of an expected stronger impact in larger companies,
an impact on profitability that will decrease when the firm is becoming larger. Once again,
this interpretation cannot be accepted at a significance level of 0.25. Either ways, hypothesis 6
is rejected.
Finally, there seems to be also a main effect between the independent variable firm size on the
one hand, and several behavioural outcomes on the other hand. The coefficients for
behavioural commitment, job satisfaction and effort (respectively b23 = 0.032; b24 = 0.034; b25
= 0.025) suggest a positive relationship between firm size and these three behavioural
outcomes. The parameters are significant at a significance level of 0.05 (behavioural

HRM, organisational performance and the role of firm size
Master thesis Business & Economics 60
commitment and job satisfaction) or 0.25 (effort). On the other hand, firm size is negatively
associated with problem-solving. Its coefficient (b21 = -0.015) is significant at a significance
level of 0.25.
5.4.3 Firm age and sector of industry in regressions
Several scholars have suggested that factors as sector of industry and firm age could play a
determining role in research results on HRM and organisational performance. The role of both
factors in this research study will be assessed by a change in R Square (R²) when stepwise
entering one of the variables to the regressions each time. R² represents the proportion of
variance in i dependent variables of interest predictable from the independent variable(s)
(Kirkpatrick & Feeney, 2003). Two dummy variables will reflect the sectors of industry that
appear in the sample (dummy1 = 1 if consultancy, 0 if otherwise; dummy2 = 1 if wholesale
trade, 0 if otherwise). There are always at least one fewer dummy variables than there are
categories. Thus, the third category – other sectors of industry – is coded 0 on all the
dummies. Firm age, dummy1 and dummy2 are stepwise entered in the regression analyses.
This method can be modelled:
(3) Yi = b0i + (b1i + b3i * firmsize) * HPWS + b2i * firmsize + b4i * firmage
(4) Yi = b0i + (b1i + b3i * firmsize) * HPWS + b2i * firmsize + b4i * firmage + b4i * dummy1
(5) Yi = b0i + (b1i + b3i * firmsize) * HPWS + b2i * firmsize + b4i * firmage + b4i * dummy1 +
b5i * dummy2
Table 17 presents the outlined regressions output. The columns 1 – 4 reflect the R² of
respectively the original model (2a), that model including firm age (3), that model including
dummy1 (4), and that model including dummy2 (5). The F-test is used to test the significance
of the R Squares.
5.4.3.1 Interpretation of results
Table 17 shows that, by stepwise entering firm age, dummy1 and dummy2 in the regression
model, the R Square for behavioural commitment only slightly increases. It means that those
independent variables do not really have a substantial share in helping to explain the variance
in behavioural commitment. Moreover, the model’s significance is decreasing by stepwise

HRM, organisational performance and the role of firm size
Master thesis Business & Economics 61
entering firm age, dummy1 and dummy2 (appendix H2). That also applies for job satisfaction
and profitability.
Table 17
R Squares of stepwise regressions
incl. firm age incl. dummy1 incl. dummy2
i Dependent variable of interest R² R² R² R²
1 Problem-solving .206 .225 .254 .301
2 Knowledge-transfer .122 .124 .128 .129
3 Behav. commitment .482* .492* .508* .571*
4 Job satisfaction .466* .466* .476* .477
5 Effort .298 .308 .364 .368
6 Product quality .247 .248 .257 .335
7 Innovation .085 .155 .550* .552
8 Vol. turnover rate .240 .248 .353 .415
9 Sickn. absence rate .098 .390* .395 .401
10 Productivity .319* .424* .424 .714*
11 Profitability .541** .597** .604* .665*
** Level of significance is α = 0.05
* Level of significance is α = 0.25
However, the R² for innovation will highly increase when dummy1 is entered in model (3). It
indicates a significant share of this particular sector of industry (i.e. consultancy) in helping to
explain the variance in innovation. Its regression coefficient (b47 = 0.533; significant at a
significance level of 0.05) suggests a positive relationship between the consultancy sector and
innovation (appendix H2). Furthermore, the R² for sickness absence will highly increase when
firm age is entered in model (2). It indicates a significant share of firm age in helping to
explain the variance in the sickness absence rate. Entering firm age makes all regression
coefficients significant at a significance level of 0.25 (appendix H2). Model (3) will be as
follows:
(3) Sicknessabsence = 9.436 + (-2.456 + 0.032 * firmsize) * HPWS – 0.045 * firmsize +
0.031 * firmage
This new model will not change the fact that hypotheses 1 and 5 are rejected. However, a
lower sickness absence rate now seems to be stimulated by the HPWS in small firms, but this
does not apply for large companies. Thus, hypothesis 1 remains rejected for the sickness
absence rate. Also, the coefficient b39 = 0.032 suggests the reverse of what was expected,

HRM, organisational performance and the role of firm size
Master thesis Business & Economics 62
namely a significant stronger impact on the sickness absence rate (i.e. a lower rate) in smaller
firms than in larger companies. Hypothesis 5 still remains rejected.
The R² for productivity will highly increase when dummy2 is entered in model (4). It
indicates a significant share of this particular sector of industry (i.e. wholesale trade) in
helping to explain the variance in productivity. Entering dummy2 makes the regression
coefficients of HPWS, firm age and dummy2 significant at a significance level of respectively
0.25, 0.25 and 0.05 (appendix H2). Model (5) will be as follows:
(5) Productivity = -2,839,812 + 1,061,401 * HPWS - 12,647.50 * firmage +
1,180,260 * dummy2
This new model shows a positive relationship between the high performance work system and
productivity for companies of all sizes. Hypothesis 1 will now be supported for productivity
too. Notable is the significant negative relationship between firm age and productivity.
5.4.4 Hypothesis 2
Hypothesis 2 assumes that the level of attitudinal commitment will be higher in smaller firms
than in larger companies. It is possible to describe the attitudinal commitment scores per
subgroups smaller firms (with ten up to 100 employees) and larger firms (with 100 up to 200
employees). The average scores on attitudinal commitment between these two subgroups can
also be compared. Table 18 shows that the average score for larger companies is higher than
the average score for smaller firms. Like r at first sight, it implies an increase in firm size to
be associated with more attitudinal commitment.
Table 18
Average scores of attitudinal commitment in smaller and larger firms
Measures of dispersion Smaller firms Larger firms
Median 2,84 3,00
Mean 2,88 2,95
However, the independent-samples t-test will give insight in the question if there is a
significant difference in the (average) level of attitudinal commitment as a result of firm size.
One-hundred is used as the cut-point in SPSS to separate smaller firms from larger

HRM, organisational performance and the role of firm size
Master thesis Business & Economics 63
companies. The complete SPSS output of this t-test can be read in appendix H1; the most
interesting outcomes are outlined in table 19.
Table 19
Outlined output of the independent-samples t-test
Dependent variable Levene's F-score t-score Significance
Attitudinal commitment 0.441 0.138 0.892
Levene’s test for equality of variances has been accomplished. The F-score is shown in the
first column of the table. Next is the t-score. At last, the level of significance of this deviation
is shown in the last column.
5.4.4.1 Interpretation of results
A significant higher level of attitudinal commitment was expected in smaller firms but,
instead, it seems at first sight that there will be more attitudinal commitment in larger
companies. Yet, there is no significant prove (at a significance level of 0.25) that the level of
attitudinal commitment will actually differ as a result of firm size (p = 0.892). In brief,
hypothesis 2 is rejected.
5.5 Summary of main results
The main results of last sections, derived from quantitative analyses, can be outlined
graphically in figure 5:
HPWS
Job satisfaction
Solving problems
Knowledge-transfer
Attit. commitment
Effort
Productivity
Voluntary turnover
Innovation
Product quality
Sickness absence
Profitability
+ (small firms)
r = .752
r = -.348
r = -.367
+
Figure 5: The main results after quantitative analyses.
Behav. commitment+ (small firms)
+ (large firms)
+ (small firms)
+
+
r = .352
- (small firms)

HRM, organisational performance and the role of firm size
Master thesis Business & Economics 64
The thick arrows represent relationships between two variables of interest that are not affected
by firm size. The analyses have shown significant positive relationships between the high
performance work system on the one hand, and product quality, productivity and profit on the
other hand. Those hold for both smaller and larger companies. Moreover, there is found no
significant difference in the HPWS impact on these organisational performances as a result of
firm size.
Secondly, the normal (closed) arrows represent relationships between two variables of interest
that are affected by firm size. The analyses have shown that the HPWS impact on respectively
behavioural commitment, job satisfaction and effort is significantly stronger in smaller firms
than in larger companies. More specifically, a positive impact seems to occur in small firms
while, instead, a positive impact on these behavioural outcomes is slowing down in large
companies. The HPWS impact on the sickness absence rate is also significantly stronger (i.e.
lower rate) in smaller firms than in larger companies (i.e. higher rate). Furthermore, the
HPWS impact on problem-solving is significantly stronger in larger companies than in
smaller firms. A positive impact seems to occur in large companies while, instead, a positive
impact on this behavioural outcome is slowing down in small firms.
No significant relationships are found between the high performance work system on the one
hand, and knowledge-transfer, innovation and the voluntary turnover rate on the other hand.
Also, firm size is not significantly related to attitudinal commitment. In the case of voluntary
turnover, more scholars were troubled by a lack of evidence that HRM is related to this
operational performance (Sels et al., 2006). However, others have found evidence (Guthrie et
al., 2004). The stepwise regression analyses do suggest that a company’s level of innovation
is more depending upon the sector of industry wherein that organisation is operating. At last,
no relationship with knowledge-transfer implies that the high performance work system
cannot motivate employees to apply their knowledge. Perhaps, the compositions of the high
performance work system (of the firms in the sample) are not suitable in motivating
knowledge-transfer.
Finally, a significant correlation between product quality and productivity (dotted arrow)
perhaps indicates a relationship between both variables of interest. A positive relationship is
assumed in the theoretical part of this study. That also applies for productivity and profit,
which show a significant high correlation. However, a negative correlation between problem-

HRM, organisational performance and the role of firm size
Master thesis Business & Economics 65
solving and product quality was not expected, and neither between knowledge-transfer and
innovation. A possible explanation is a time lag (any activity of problem-solving and
knowledge-transfer in period 1 will lead to respectively product quality and innovation in
period 2, 3…n).
5.5.1 Discussion
In chapter three, several characteristics have been named that are assumed to be representative
for smaller firms (e.g. limited resources, more informal, no middle-management and many
competitors). Moreover, these characteristics are expected to lead to less effective practices in
the high performance work system of smaller firms, resulting in a lower level of the
behavioural outcomes (compared to larger companies which are expected not to have these
negative characteristics). The questionnaires include questions which answers will indicate if
these characteristics are present in the companies from the sample. That is done in order to
have the opportunity to assess if a potential lower level of behavioural outcomes is associated
with the characteristics. Not only was expected that smaller firms will have lower levels of
behavioural outcomes (given a certain degree of HPWS presence), but also that only those
firms will have the mentioned characteristics. However, the main results have shown that the
high performance work system is perhaps more effective in smaller firms in stimulating some
behavioural outcomes (effort, behavioural commitment and job satisfaction). Now, the
question is if the mentioned characteristics are indeed only present in smaller firms.
Because of their assumed limited resources it was expected that on the question, how many
people are involved into the selection process of job applicants, the average for smaller firms
would be below the average for larger companies. Indeed, the average for smaller firms was
below the average for larger companies. It was also expected that costs are the most important
consideration for smaller firms in adapting a particular formal training. However, none of the
companies gave those as reason. Furthermore, no HR department was expected in smaller
firms because of their more informal character. Yet, the question, was there a HR department
in the organisation, was confirmed by all companies. Another question, do the most jobs
consist of concretely defined work tasks, also indicates the extent of informality. This question
was negatively answered by three companies. It was expected that no well-defined jobs
mostly occur in smaller firms. Indeed, those three companies were all smaller organisations.
Nine companies gave an affirmative answer on the question if a middle-management is
responsible for the daily operations. As expected, mostly larger companies agreed that a
HRM, organisational performance and the role of firm size
Master thesis Business & Economics 66
middle-management is present in the organisation. If not present, it is expected that the owner
is a direct supervisor of the employees (which is considered as negative for the effectiveness
of the high performance work system). On the question, if the owner is a direct supervisor of
the employees, eight companies gave an affirmative answer. As expected, most were smaller
firms. At last, twelve companies agreed on the question if there are many competitors in the
market of the company. Those were both smaller and larger organisations.
In brief, these results could suggest that a lack of middle-management, an informal work
structure and limited resources is more characteristic of smaller firms. It may explain the less
strong HPWS impact on problem-solving in smaller firms. However, there is no significant
evidence for these suggestions. Moreover, if these potential characteristics are present only in
smaller firms it does not explain the stronger HPWS impact on behavioural commitment, job
satisfaction and effort in smaller firms.

HRM, organisational performance and the role of firm size
Master thesis Business & Economics 67
6. Conclusion
Interest in the share of human resource management in organisational performance has risen
sharply over the past decade. In the beginning, most research studies about the effect of
human resource management on organisational performance were done in large companies.
Nowadays, more attention is given to small and medium sized enterprises in examining
effects of HRM on operational and/or financial performance. However, much unclearness
remains in this field of study.
In general, how will HRM stimulate organisational performance? Many studies have agreed a
positive relationship between human resource management and performance, but only few
have addressed how this relationship exactly will occur – thereby including employee
behaviour. Secondly, is the impact of HRM on organisational performance depending on firm
size? It is the central question of this research study. A high performance work system has
been involved in answering this question. There is namely a growing adoption to approach
high performance work systems as essential in HRM. In this way, this research study is an
expansion of prior research about the relationship between high performance work systems
and organisational performance.
The conclusions regarding this study’s goal will be presented first, before recommendations
will be done for future research.
6.1 Conclusions
A stepwise approach (reflected by the research questions) has helped guiding this study to an
answer on the central question. In the first place, organisational performance has been defined
as an objective dominated by the company and created by (aggregated) measurements at an
organisational level. Moreover, it can be divided in the lower-levelled operational
performance and the higher-levelled financial performance.
Secondly, the essence of human resource management has been defined as activities to select,
develop, motivate and retain employees with required characteristics. The high performance
work system includes these activities, also called HR practices. The HR practices together in
the system have been considered as the driving force behind the stimulating effect of HRM on
organisational performance (operational and financial).

HRM, organisational performance and the role of firm size
Master thesis Business & Economics 68
Furthermore, a developed theoretical framework (based upon theories and research done in
large companies) assumes that a positive relationship between HRM and organisational
performance will occur through several intermediate causal relationships. The high
performance work system will stimulate employees’ behavioural outcomes, which in turn
have a positive effect on operational performance. Subsequently, operational performance
will stimulate financial performance.
At last, the following characteristics – limited resources, informal work structure, lack of
middle-management, many direct competitors – have been assumed as characteristic of
smaller firms. These characteristics will distinguish smaller from larger companies and,
therefore, can be used to determine the firm size effect on the impact of HRM on
organisational performance. In theory, the firm size effect has been determined by considering
the influences of those mentioned characteristics on the (intermediate) relationships in the
theoretical framework.
Empirical research has shown that a difference in the impact of human resource management
on organisational performance can occur as a result of firm size. The multiple regression
analysis for sickness absence rate indicates a relationship between the high performance work
system and this operational performance variable. In addition, the analysis also suggests that a
given degree of HPWS presence will result in a lower voluntary turnover rate in smaller firms
than in larger companies.
Other multiple regression analyses have found no further significant firm size effect that will
influence the HPWS impact on other organisational performance indicators. The high
performance work system seems to stimulate the operational performances product quality
and productivity but, however, no difference in this effect has been found between smaller
and larger companies. The high performance work system is also positively related to the
financial performance profit but, again, no evidence of a firm size effect has been found here.
It is not unlikely that HPWS’ stimulating effect on profit is mainly caused by its positive
impact on productivity. Productivity is considered as the main driver behind profit. Empirical
research has shown that productivity is highly associated with profitability in this study (r =
0.752). The path analysis presents a significant positive relationship between the performance
indicators. Moreover, product quality could be an intervening variable in the positive

HRM, organisational performance and the role of firm size
Master thesis Business & Economics 69
relationship between the high performance work system and productivity. A good product
quality is assumed to help achieving a higher productivity by its efficiency outcomes (no
waste of time and effort). The correlation between both organisational performances is
significant (r = 0.352).
It was also expected that the operational performance indicators sickness absence, innovation
and voluntary turnover would act as intervening variables in the positive relationship between
the HPWS and productivity. But, instead, no significant associations have been found
between these two performances and productivity. Neither a significant association was found
between innovation and productivity.
The significant association between knowledge-transfer and innovation might confirm the
presumption that this behavioural outcome is an intervening variable in a relationship between
the high performance work system and innovation. However, a stepwise regression analysis
has found no relationship between the HPWS and innovation but, instead, a company’s level
of innovation seems to be more depending upon the sector of industry wherein the
organisation is operating. Also, a negative correlation (r = -0.367) is not conform the
expectation that knowledge-transfer is stimulating innovation. A time lag could be a possible
explanation for this phenomenon (knowledge-transfer in period 1 will lead to innovation in
period 2, 3…n). It could also be the reason for the negative correlation found between
problem-solving and product quality (r = -0.348). This behavioural outcome perhaps is an
intervening variable in the positive relationship between the HPWS and product quality,
because it requires abilities (identifying problems, generating solutions, quickly solving) that
might increase the product quality in the long run.
The analyses have shown no significant relationships between the other behavioural outcomes
on the one hand, and some operational performances on the other hand. No association was
found between effort and productivity. Furthermore, job satisfaction was expected to
stimulate a low sickness absence rate and, moreover, a high level of effort. Again, no
associations were found here. It also applies for behavioural commitment and attitudinal
commitment, which were expected to stimulate a low voluntary turnover rate. The first should
act as an intervening variable in the positive impact of the high performance work system on
voluntary turnover (i.e. low rate). However, no significant relationship was found between the
HPWS and voluntary turnover.

HRM, organisational performance and the role of firm size
Master thesis Business & Economics 70
The mentioned behavioural outcomes were considered as the intermediate variables in the
relationship between HRM (i.e. HPWS) and organisational performance (i.e. operational and
financial performance). However, the analyses have shown that only for problem-solving such
an intervening role can be suggested. This behavioural outcome is not only significantly
associated with product quality but also with the high performance work system.
The multiple regression analysis indicates a relationship between the high performance work
system and problem-solving. In addition, the impact of a given degree of HPWS presence on
problem-solving seems to be stronger in larger companies than in smaller firms. Although not
proven, this result might indicate the negative influence of the assumed characteristics of
smaller firms on the effectiveness of the HR practices in the high performance work system.
Output from the questionnaires does suggest that limited resources, an informal work
structure and a lack of middle-management are more characteristic of smaller firms. Yet, no
significant prove has been obtained for this suggestion.
A potential presence of those characteristics in smaller firms does not seem to affect the
HPWS impact on behavioural commitment, job satisfaction and effort. The multiple
regression analyses show that firm size is having a determining role in the strength of the
HPWS impact on these behavioural outcomes. However, the impact of a given HPWS
presence is significant stronger in smaller firms than in larger companies (instead of an
expected less strong impact). No significant relationship was found between the HPWS and
knowledge-transfer.
In brief, the firm size effect has been tested for six dependent organisational performance
indicators. This study has found a firm size effect for one (operational) performance indicator,
namely sickness absence. The conclusion is that the impact of HRM on organisational
performance depends to a limited extent on firm size. The firm size effect has also been tested
for five dependent behavioural outcomes. This study has found a firm size effect for four
behavioural outcomes, namely problem-solving, behavioural commitment, job satisfaction
and effort. It can be concluded that the impact of HRM on employee performance (i.e.
behavioural outcomes) depends to a large extent on firm size.

HRM, organisational performance and the role of firm size
Master thesis Business & Economics 71
6.2 Limitations
It is important to notice that the conclusions are based upon an empirical research study with a
sample group of only 15 companies. A large sampling error can occur when using a small
sample size. There is a chance that the measured associations are only due to sampling error
(also because a significance level of 0.25 is used). Therefore, it cannot be said if the measured
results of this study are representative outcomes. Nevertheless, the results do give a first
indication about the relationship between HRM and organisational performance – and the role
of firm size herein.
Secondly, a high performance work system with seven particular HR practices represents
human resource management in this study. The choice for these standardized practices is
based upon prior research studies. However, it is possible that a combination of other
practices will result in other conclusions on the problem statement. The quality (effectiveness)
of those HR practices is perhaps more depending upon firm size, resulting in differences in
the impact of HRM on organisational performance as a result of firm size.
6.3 Future research
It is important that future research studies will give more attention to the question „how will
HRM influence organisational performance?”. Little is known about the paths HRM takes to
become valuable in achieving organisational performance. More research will result in
completing the puzzle of a phenomenon that now is still indicated as a black box. Although
with prudence, this study’s conclusions can be used to solve the black box in future research.
It is important for two reasons. First, insight in the phenomenon can help giving direction to
future HR policy in organisations. Companies will use high performance work systems or HR
practices more effectively for particular performance indicators. Secondly, explanations for
differences in HRM impact on organisational performance as a result of firm size (or other
factors) can only be given if one knows the structure of such impact. Only if the paths
between HRM and organisational performance are known, differences on these paths can be
signalled and, subsequently, linked to factors as firm size.

HRM, organisational performance and the role of firm size
Master thesis Business & Economics 72
Appendices
A) Voluntary turnover formula
Total worker separations *
= …… (Rate)
Number of employees **
* Include all permanent terminations of regular employees, voluntary, that occurred during a
given period. Do not include involuntary terminations (e.g. retirement, discharge, death, job
eliminations). Do also not include departures of temporary staff.
** Include all full- and part-time employees on the active payroll who worked at least 20
hours per week during the given period. Do not include temporary staff and employees on
layoff during the selected period.

HRM, organisational performance and the role of firm size
Master thesis Business & Economics 73
B) Items on HPWS practices
Extensiveness of staffing
To what extent is each of the following four selection devices used in this company to
evaluate job candidates? Please indicate for every selection device on a five-point scale
(1=never; 2=sometimes; 3=average; 4=often; 5=always):
• Interviews 1 2 3 4 5
• Tests 1 2 3 4 5
• Work samples 1 2 3 4 5
• References from previous employers 1 2 3 4 5
Group-based performance pay
Please AGREE or DISAGREE with the following statement: „One or more of the four
benefits below is/are offered to operational staff in this company.”
• Profit-sharing
• Bonuses
• Share plans
• Stock options
The answer is: AGREE / DISAGREE (please blot out what does not apply).
Pay level
Compare the level of base salary offered in this company with the level of base salary for
identical operational jobs in other companies. The base salary offered in this company is
(please mark what does apply):
□ Below average
□ Average
□ Above average

HRM, organisational performance and the role of firm size
Master thesis Business & Economics 74
Job rotation
What percentage of the employees in this company is involved in job rotation (i.e. varying
different jobs and/or tasks within the organisation)?
I assess …… percent (please fill in on a scale from 0 to 100).
Self-directed teams
What percentage of the employees in this company is involved in self-managed teams (i.e. in
working teams without direct supervisory)?
I assess …… percent (please fill in on a scale from 0 to 100).
Formal training
What percentage of the employees in this company receives formal, out-of-firm training?
I assess …… percent (please fill in on a scale from 0 to 100).
Involvement in meetings discussing work-related issues
What percentage of the employees in this company is involved in regularly scheduled
meetings to discuss work-related issues?
I assess …… percent (please fill in on a scale from 0 to 100).

HRM, organisational performance and the role of firm size
Master thesis Business & Economics 75
C) Items on behavioural outcome variables
Problem-solving: solutions found
Focusing on problems that you encountered during your work, to what extent do you AGREE
or DISAGREE with the following statements? Please indicate for every statement on a six-
point scale (1=strongly disagree; 2=disagree; 3=sort of disagree; 4=sort of agree; 5=agree;
6=strongly agree):
• I identified several alternative solutions for each problem encountered.
1 2 3 4 5 6
• I seemed to always come up with solutions to problems encountered.
1 2 3 4 5 6
• It was always easy to identify new solutions to the problems.
1 2 3 4 5 6
Problem-solving: speed of solving problems
Focusing on problems that you encountered during your work, to what extent do you AGREE
or DISAGREE with the following statements? Please indicate for every statement on a six-
point scale (6=strongly disagree; 5=disagree; 4=sort of disagree; 3=sort of agree; 2=agree;
1=strongly agree):
• Solutions found for problems I faced were not timely.
1 2 3 4 5 6
• I was very slow in finding and implementing solutions to the problems I encountered.
1 2 3 4 5 6
• Ideas for solving the problems encountered were discovered rather late to be
implemented successfully.
1 2 3 4 5 6

HRM, organisational performance and the role of firm size
Master thesis Business & Economics 76
Knowledge-transfer
Please indicate to what extent you AGREE or DISAGREE with the following statements on a
six-point scale (1=strongly disagree; 2=disagree; 3=sort of disagree; 4=sort of agree; 5=agree;
6=strongly agree):
• I often have an opportunity to talk to other employees in this organisation about
successful work activities in order to understand why they succeed.
1 2 3 4 5 6
• Failures are almost always constructively discussed in this organisation.
1 2 3 4 5 6
• New work processes that may be useful to the organisation as a whole are usually
shared with all employees.
1 2 3 4 5 6
Behavioural commitment
Consider your working conditions (i.e. compensation, development and independency
opportunities) in this organisation. Please indicate to what extent you AGREE or DISAGREE
with the following statements on a six-point scale (1=strongly disagree; 2=disagree; 3=sort of
disagree; 4=sort of agree; 5=agree; 6=strongly agree):
• One of the major reasons I continue to work for this company is that leaving would
require considerable personal sacrifice – another company may not match the overall
benefits I have now.
1 2 3 4 5 6
• It will be very hard for me to leave this organisation right now, even if I want to.
1 2 3 4 5 6
• Too much in my life will be disrupted if I decide that I want to leave this organisation
now.
1 2 3 4 5 6

HRM, organisational performance and the role of firm size
Master thesis Business & Economics 77
Attitudinal commitment
Please indicate to what extent you AGREE or DISAGREE with the following statements on a
six-point scale (1=strongly disagree; 2=disagree; 3=sort of disagree; 4=sort of agree; 5=agree;
6=strongly agree):
• I do feel “emotionally attached” to this organisation.
1 2 3 4 5 6
• This organization has a great deal of personal meaning to me.
1 2 3 4 5 6
• I do feel like “part of the family” at this organisation.
1 2 3 4 5 6
Job satisfaction: empowerment
Please indicate to what extent you AGREE or DISAGREE with the following statements on a
six-point scale (1=strongly disagree; 2=disagree; 3=sort of disagree; 4=sort of agree; 5=agree;
6=strongly agree):
• My job gives me many chances to use my personal initiative or judgement in carrying
out the work.
1 2 3 4 5 6
• My job gives me considerable opportunity for independence and freedom in how to do
the work.
1 2 3 4 5 6
• My job gives me many opportunities to do a variety of tasks which utilize many of my
skills.
1 2 3 4 5 6

HRM, organisational performance and the role of firm size
Master thesis Business & Economics 78
Job satisfaction: compensation
Please indicate to what extent you AGREE or DISAGREE with the following statements on a
six-point scale (1=strongly disagree; 2=disagree; 3=sort of disagree; 4=sort of agree; 5=agree;
6=strongly agree):
• I feel I am being paid an adequate amount for the work I do.
1 2 3 4 5 6
• I am satisfied with the benefits I receive in my job.
1 2 3 4 5 6
• I feel satisfied with my chances for salary increases.
1 2 3 4 5 6
Effort: time
Consider your work in this organisation. Please indicate to what extent you AGREE or
DISAGREE with the following statements on a six-point scale (1=strongly disagree;
2=disagree; 3=sort of disagree; 4=sort of agree; 5=agree; 6=strongly agree):
• Other people know me by the long hours I keep.
1 2 3 4 5 6
• Few people put in more hours weekly than I do.
1 2 3 4 5 6
Effort: work intensity
Consider your work in this organisation. Please indicate to what extent you AGREE or
DISAGREE with the following statements on a six-point scale (1=strongly disagree;
2=disagree; 3=sort of disagree; 4=sort of agree; 5=agree; 6=strongly agree):
• I work at my full capacity in all my job duties.
1 2 3 4 5 6

HRM, organisational performance and the role of firm size
Master thesis Business & Economics 79
• I strive as hard as I can to be successful in my work.
1 2 3 4 5 6
• When there is a job to be done, I devote all my energy to getting it done.
1 2 3 4 5 6

HRM, organisational performance and the role of firm size
Master thesis Business & Economics 80
D) Items on operational performance variables
Product quality
Please indicate what measure on a six-point scale is related to the following statements
(1=never; 2=sometimes; 3=regular; 4=often; 5=almost always; 6=always):
• This company’s products conform to performance specifications required by its
customers.
1 2 3 4 5 6
• This company’s products performances meet the requirements of its customers.
1 2 3 4 5 6
• The design of this company’s products meets the quality standards expected by its
customers.
1 2 3 4 5 6
Innovation
Please indicate to what extent you AGREE or DISAGREE with the following statements on a
six-point scale (1=strongly disagree; 2=disagree; 3=sort of disagree; 4=sort of agree; 5=agree;
6=strongly agree):
• It often occurs that minor or major improvements are done to the products that this
company offers to its customers.
1 2 3 4 5 6
• It often occurs that minor or major improvements are done in the services this
company offers to its customers.
1 2 3 4 5 6
• It often occurs that minor or major improvements are done in the ways this company
achieves its products.
1 2 3 4 5 6

HRM, organisational performance and the role of firm size
Master thesis Business & Economics 81
Voluntary turnover
Please give the figure of all permanent terminations of regular employees, voluntary, that
occurred during a given period. Do not include involuntary terminations (e.g. retirement,
discharge, death, job eliminations). Do also not include departures of temporary staff.
The figure is: …… employees (please fill in).
Please give the figure of all full- and part-time employees on the active payroll who worked at
least 20 hours per week during the given period. Do not include temporary staff and
employees on layoff during the selected period.
The figure is: …… employees (please fill in).
Sickness absence rate
In which class did the sickness absence rate (excluding maternity leave) of this company fall
(please mark what does apply)?
□ 0 percent
□ Less than 2 percent
□ 2 – less than 3 percent
□ 3 – less than 4 percent
□ 4 – less than 5 percent
□ 5 – less than 6 percent
□ 6 – less than 7 percent
□ 7 percent and more

HRM, organisational performance and the role of firm size
Master thesis Business & Economics 82
E) Content of first e-mail
Dear Sir/Madam,
Referring to our telephone conversation on (DATE), I am sending you three questionnaires
that belong to research on the impact of certain human resource practices on employees’
behaviour and operational performance in companies. The research is on behalf of my final
thesis for the master Business & Economics at the Erasmus University Rotterdam.
I would like to ask your company to participate in this research study by completing the
attached questionnaires. The completion of every questionnaire will take only five to ten
minutes. The questionnaire, called “Respondent CEO”, has to be completed by the company’s
chief executive officer (alternatively: a business manager). The questionnaire, called “HR
department”, has to be completed by an employee from the HR department. If this department
was not present in the firm in year 2006, I would like to ask the chief executive officer also to
complete this questionnaire. The questionnaire, called “Questionnaire employee”, has to be
completed by – preferably – one to three (three to five for larger companies) employees who
have an operational function related to the core business of the firm.
Finally, if desirable you can send the completed questionnaires (in Microsoft Word) directly
to my e-mail address: [email protected]. If otherwise, I can collect the
questionnaires at the time you have completed them.
Hopefully your company will participate in this research study. If there are questions and/or
comments, please do not hesitate to contact me. I would like to thank you in advance for your
cooperation.
Best regards,
Fons Kortekaas
Student Business & Economics
Erasmus University Rotterdam

HRM, organisational performance and the role of firm size
Master thesis Business & Economics 83
F) Frequency distributions
Table i
Frequency distribution of high performance work system
Figure i
Histogram of high performance work system
5.004.003.002.001.00
6
4
2
0
1 = HPWS scores between 2.00 – 2.50
2 = HPWS scores between 2.50 – 3.00
3 = HPWS scores between 3.00 – 3.50
4 = HPWS scores between 3.50 – 4.00
5 = HPWS scores between 4.00 – 4.50
HPWS
Value Frequency Valid percent Cumulative percent
2.30 1 6.7 6.7
2.40 1 6.7 13.3
2.80 1 6.7 20.0
3.00 2 13.3 33.3
3.05 1 6.7 40.0
3.15 1 6.7 46.7
3.20 2 13.3 60.0
3.35 1 6.7 66.7
3.65 1 6.7 73.3
3.85 1 6.7 80.0
3.90 1 6.7 86.7
4.10 1 6.7 93.3
4.25 1 6.7 100.0
Total 15 100.0 100.0

HRM, organisational performance and the role of firm size
Master thesis Business & Economics 84
Table ii (a)
Frequency distribution of problem-solving
Problem-solving
Value Frequency Valid percent Cumulative percent
3.83 4 26.7 26.7
4.00 4 26.7 53.3
4.17 1 6.7 60.0
4.33 1 6.7 66.7
4.50 1 6.7 73.3
4.67 2 13.3 86.7
4.83 1 6.7 93.3
5.00 1 6.7 100.0
Total 15 100.0 100.0
Table ii (b)
Frequency distribution of knowledge-transfer
Knowledge-transfer
Value Frequency Valid percent Cumulative percent
3.33 1 6.7 6.7
3.67 3 20.0 26.7
4.00 4 26.7 53.3
4.33 2 13.3 66.7
4.67 3 20.0 86.7
5.00 2 13.3 100.0
Total 15 100.0 100.0
Table ii (c)
Frequency distribution of behavioural commitment
Behavioural commitment
Value Frequency Valid percent Cumulative percent
2.00 3 20.0 20.0
2.33 2 13.3 33.3
2.67 1 6.7 40.0
3.00 4 26.7 66.7
3.33 2 13.3 80.0
3.67 1 6.7 86.7
4.00 2 13.3 100.0
Total 15 100.0 100.0

HRM, organisational performance and the role of firm size
Master thesis Business & Economics 85
Table ii (d)
Frequency distribution of attitudinal commitment
Attitudinal commitment
Value Frequency Valid percent Cumulative percent
3.00 3 20.0 20.0
3.33 4 26.7 46.7
3.67 3 20.0 66.7
4.00 2 13.3 80.0
4.33 1 6.7 86.7
4.67 1 6.7 93.3
5.00 1 6.7 100.0
Total 15 100.0 100.0
Table ii (e)
Frequency distribution of job satisfaction
Job satisfaction
Value Frequency Valid percent Cumulative percent
3.17 1 6.7 6.7
3.50 3 20.0 26.7
4.00 2 13.3 40.0
4.17 1 6.7 46.7
4.33 1 6.7 53.3
4.50 1 6.7 60.0
4.67 1 6.7 66.7
4.83 1 6.7 73.3
5.00 2 13.3 86.7
5.17 2 13.3 100.0
Total 15 100.0 100.0
Table ii (f)
Frequency distribution of effort
Effort
Value Frequency Valid percent Cumulative percent
3.20 1 6.7 6.7
3.40 2 13.3 20.0
3.60 1 6.7 26.7
3.80 4 26.7 53.3
4.00 4 26.7 80.0
4.60 2 13.3 93.3
6.00 1 6.7 100.0
Total 15 100.0 100.0

HRM, organisational performance and the role of firm size
Master thesis Business & Economics 86
Table iii (a)
Frequency distribution of product quality
Product quality
Value Frequency Valid percent Cumulative percent
3.33 1 6.7 6.7
4.00 1 6.7 13.3
4.67 3 20.0 33.3
5.00 7 46.7 80.0
5.33 1 6.7 86.7
6.00 2 13.3 100.0
Total 15 100.0 100.0
Table iii (b)
Frequency distribution of innovation
Innovation
Value Frequency Valid percent Cumulative percent
4.33 5 33.3 33.3
4.67 5 33.3 66.7
5.00 4 26.7 93.3
5.33 1 6.7 100.0
Total 15 100.0 100.0
Table iii (c)
Frequency distribution of voluntary turnover rate
Voluntary turnover rate
Value Frequency Valid percent Cumulative percent
0.02 3 20.0 20.0
0.03 2 13.3 33.3
0.04 3 20.0 53.3
0.05 2 13.3 66.7
0.06 2 13.3 80.0
0.09 1 6.7 86.7
0.10 1 6.7 93.3
0.16 1 6.7 100.0
Total 15 100.0 100.0
Table iii (d)
Frequency distribution of sickness absence rate
Sickness absence rate
Value Frequency Valid percent Cumulative percent
less than 2 2 13.3 13.3
2 - less than 3 2 13.3 26.7
3 - less than 4 4 26.7 53.3
4 - less than 5 6 40.0 93.3
5 - less than 6 1 6.7 100.0
Total 15 100.0 100.0

HRM, organisational performance and the role of firm size
Master thesis Business & Economics 87
Figure iii
Histogram of productivity
8.004.002.001.00
10
8
6
4
2
0
1 = productivity € 0.00 – € 200,000
2 = productivity € 200,000 – € 400,000
4 = productivity € 600,000 – € 800,000
8 = productivity € 1,400,000 – € 1,600,000
Figure iv
Histogram of profitability
5.004.003.002.001.00
6
5
4
3
2
1
0
1 = (EBIT minus tax) / employees € less than 0.00
2 = (EBIT minus tax) / employees € 0.00 – € 5,000
3 = (EBIT minus tax) / employees € 5,000 – € 10,000
4 = (EBIT minus tax) / employees € 10,000 – € 15,000
5 = (EBIT minus tax) / employees € more than 15,000

HRM, organisational performance and the role of firm size
Master thesis Business & Economics 88
G) Measures of central tendency and dispersion
Table v (a)
Central tendency and dispersion of high performance work system
Descriptive statistics HPWS score
Valid 15 N
Missing 0
Mean 3.28
Median 3.20
Std. deviation 0.57749
Range 1.95
Minimum 2.30
Maximum 4.25
Table v (b)
Central tendency and dispersion of behavioural outcomes
Behavioural outcomes
Descriptive statistics Problem-solving Knowledge-transfer Behavioural commitment Attitudinal commitment Job satisfaction Effort
Valid 15 15 15 15 15 15 N
Missing 0 0 0 0 0 0
Mean 4.23 4.20 2.91 3.69 4.30 4.00
Median 4.00 4.00 3.00 3.67 4.33 3.80
Std. deviation 0.40339 0.51659 0.68419 0.61098 0.67328 0.67612
Range 1.17 1.67 2.00 2.00 2.00 2.80
Minimum 3.83 3.33 2.00 3.00 3.17 3.20
Maximum 5.00 5.00 4.00 5.00 5.17 6.00
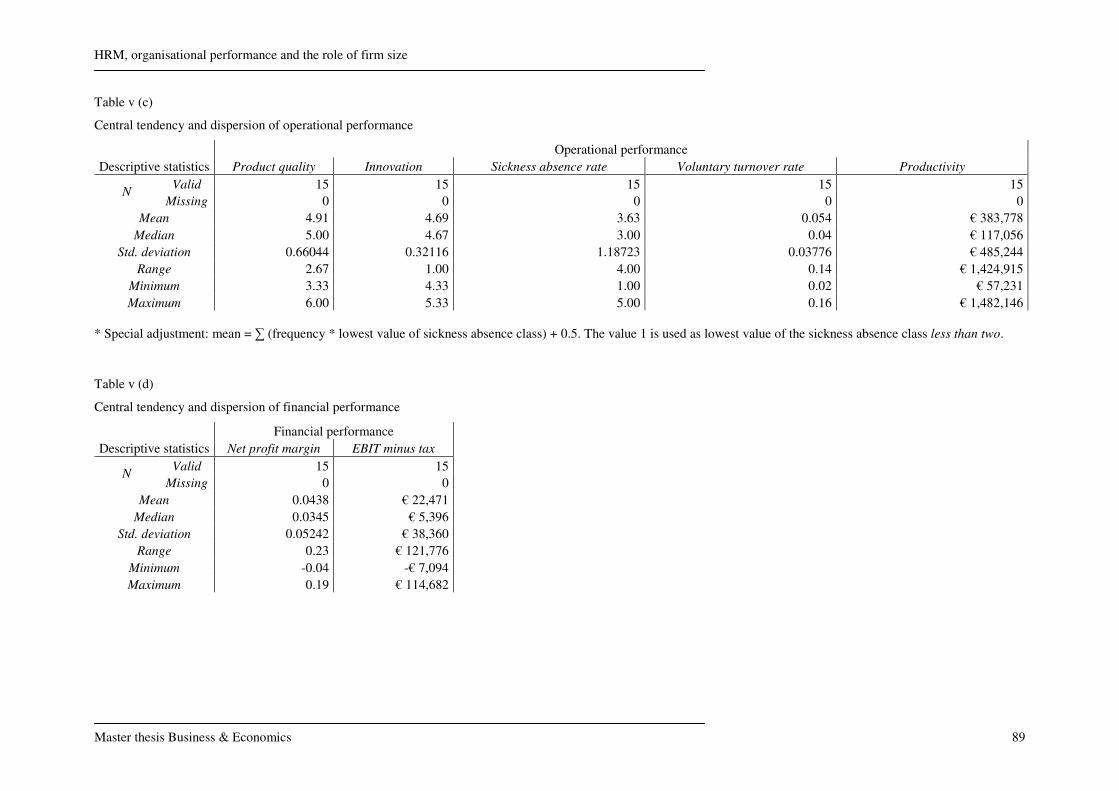
HRM, organisational performance and the role of firm size
Master thesis Business & Economics 89
Table v (c)
Central tendency and dispersion of operational performance
Operational performance
Descriptive statistics Product quality Innovation Sickness absence rate Voluntary turnover rate Productivity
Valid 15 15 15 15 15 N
Missing 0 0 0 0 0
Mean 4.91 4.69 3.63 0.054 € 383,778
Median 5.00 4.67 3.00 0.04 € 117,056
Std. deviation 0.66044 0.32116 1.18723 0.03776 € 485,244
Range 2.67 1.00 4.00 0.14 € 1,424,915
Minimum 3.33 4.33 1.00 0.02 € 57,231
Maximum 6.00 5.33 5.00 0.16 € 1,482,146
* Special adjustment: mean = ∑ (frequency * lowest value of sickness absence class) + 0.5. The value 1 is used as lowest value of the sickness absence class less than two.
Table v (d)
Central tendency and dispersion of financial performance
Financial performance
Descriptive statistics Net profit margin EBIT minus tax
Valid 15 15 N
Missing 0 0
Mean 0.0438 € 22,471
Median 0.0345 € 5,396
Std. deviation 0.05242 € 38,360
Range 0.23 € 121,776
Minimum -0.04 -€ 7,094
Maximum 0.19 € 114,682
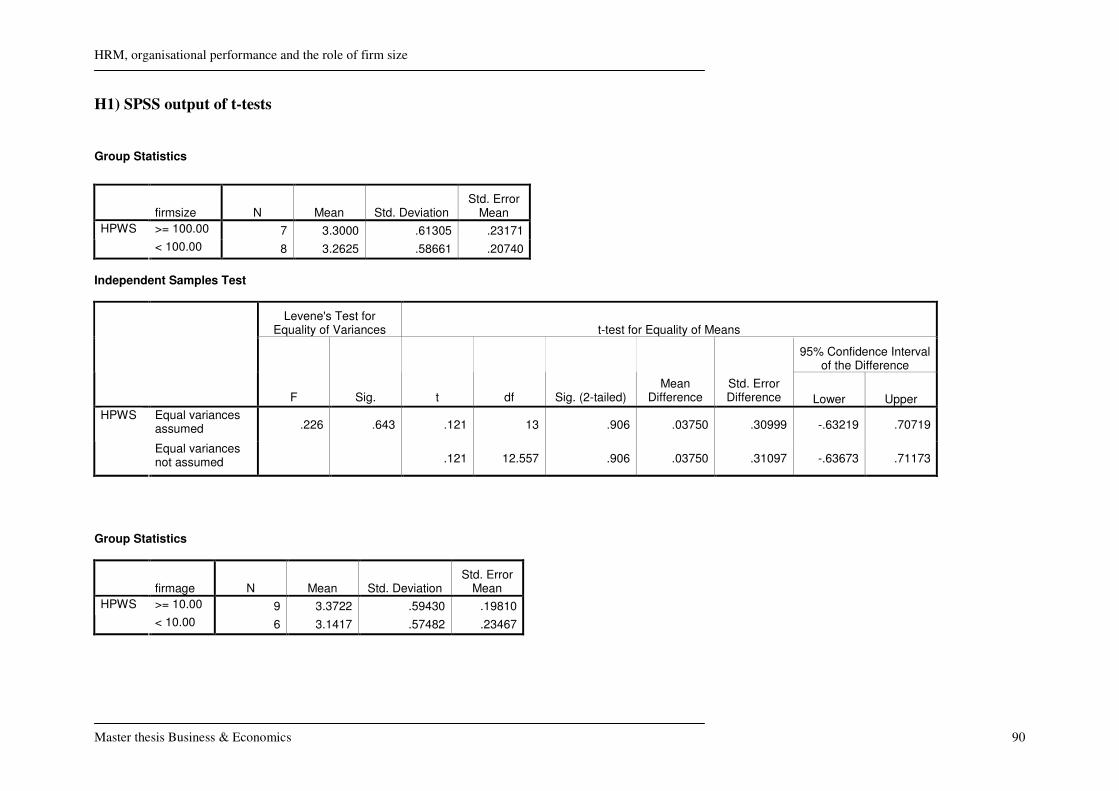
HRM, organisational performance and the role of firm size
Master thesis Business & Economics 90
H1) SPSS output of t-tests
Group Statistics
firmsize N Mean Std. Deviation Std. Error
Mean
>= 100.00 7 3.3000 .61305 .23171 HPWS
< 100.00 8 3.2625 .58661 .20740
Independent Samples Test
Levene's Test for Equality of Variances t-test for Equality of Means
95% Confidence Interval of the Difference
F Sig. t df Sig. (2-tailed) Mean
Difference Std. Error Difference Lower Upper
Equal variances assumed .226 .643 .121 13 .906 .03750 .30999 -.63219 .70719
HPWS
Equal variances not assumed .121 12.557 .906 .03750 .31097 -.63673 .71173
Group Statistics
firmage N Mean Std. Deviation Std. Error
Mean
>= 10.00 9 3.3722 .59430 .19810 HPWS
< 10.00 6 3.1417 .57482 .23467

HRM, organisational performance and the role of firm size
Master thesis Business & Economics 91
Independent Samples Test
Levene's Test for Equality of Variances t-test for Equality of Means
95% Confidence Interval of the Difference
F Sig. t df Sig. (2-tailed) Mean
Difference Std. Error Difference Lower Upper
Equal variances assumed .173 .685 .745 13 .469 .23056 .30932 -.43768 .89879
HPWS
Equal variances not assumed .751 11.132 .468 .23056 .30710 -.44440 .90551
Group Statistics
firmage N Mean Std. Deviation Std. Error
Mean
>= 15.00 8 3.4000 .62906 .22241 HPWS
< 15.00 7 3.1429 .52474 .19833
Independent Samples Test
Levene's Test for Equality of Variances t-test for Equality of Means
95% Confidence Interval of the Difference
F Sig. t df Sig. (2-tailed) Mean
Difference Std. Error Difference Lower Upper
Equal variances assumed .868 .369 .852 13 .410 .25714 .30185 -.39497 .90926
HPWS
Equal variances not assumed .863 12.982 .404 .25714 .29800 -.38673 .90101

HRM, organisational performance and the role of firm size
Master thesis Business & Economics 92
Group Statistics
firmage N Mean Std. Deviation Std. Error
Mean
>= 30.00 3 3.7167 .61101 .35277 HPWS
< 30.00 12 3.1708 .53997 .15588
Independent Samples Test
Levene's Test for Equality of Variances t-test for Equality of Means
95% Confidence Interval of the Difference
F Sig. t df Sig. (2-tailed) Mean
Difference Std. Error Difference Lower Upper
Equal variances assumed .050 .827 1.533 13 .149 .54583 .35599 -.22324 1.31490
HPWS
Equal variances not assumed 1.415 2.838 .257 .54583 .38567 -.72226 1.81393
Group Statistics
firmsize N Mean Std. Deviation Std. Error
Mean
>= 100.00 7 3.7129 .70561 .26670 attitcommit
< 100.00 8 3.6675 .56457 .19960

HRM, organisational performance and the role of firm size
Master thesis Business & Economics 93
Independent Samples Test
Levene's Test for Equality of Variances t-test for Equality of Means
95% Confidence Interval of the Difference
F Sig. t df Sig. (2-tailed) Mean
Difference Std. Error Difference Lower Upper
Equal variances assumed .441 .518 .138 13 .892 .04536 .32791 -.66305 .75376
attitcommit
Equal variances not assumed .136 11.509 .894 .04536 .33312 -.68390 .77461
H2) SPSS output of stepwise regressions
Model Summary
.694a .482 .341 .55546 .482 3.414 3 11 .057
Model1
R R Square
Adjusted
R Square
Std. Error of
the Estimate
R Square
Change F Change df1 df2 Sig. F Change
Change Statistics
Predictors: (Constant), hpwsfirmsize, hpws, firmsizea.
Model Summary
.702a .492 .289 .57683 .492 2.424 4 10 .117
Model1
R R Square
Adjusted
R Square
Std. Error of
the Estimate
R Square
Change F Change df1 df2 Sig. F Change
Change Statistics
Predictors: (Constant), firmage, hpwsfirmsize, hpws, firmsizea.

HRM, organisational performance and the role of firm size
Master thesis Business & Economics 94
Model Summary
.713a .508 .235 .59832 .508 1.861 5 9 .197
Model1
R R Square
Adjusted
R Square
Std. Error of
the Estimate
R Square
Change F Change df1 df2 Sig. F Change
Change Statistics
Predictors: (Constant), dummyconsultancy, hpwsfirmsize, firmage, hpws, firmsizea.
Model Summary
.756a .571 .249 .59296 .571 1.773 6 8 .222
Model1
R R Square
Adjusted
R Square
Std. Error of
the Estimate
R Square
Change F Change df1 df2 Sig. F Change
Change Statistics
Predictors: (Constant), dummywholesale, hpws, firmsize, dummyconsultancy, firmage, hpwsfirmsizea.
Coefficientsa
5.391 1.068 5.050 .001
-.323 .376 -.581 -.861 .412
-.007 .010 -1.241 -.671 .519
.004 .006 1.557 .737 .480
.003 .004 .220 .655 .529
.533 .190 .809 2.809 .020
(Constant)
hpws
firmsize
hpwsfirmsize
firmage
dummyconsultancy
Model1
B Std. Error
Unstandardized
Coefficients
Beta
Standardized
Coefficients
t Sig.
Dependent Variable: innovationa.
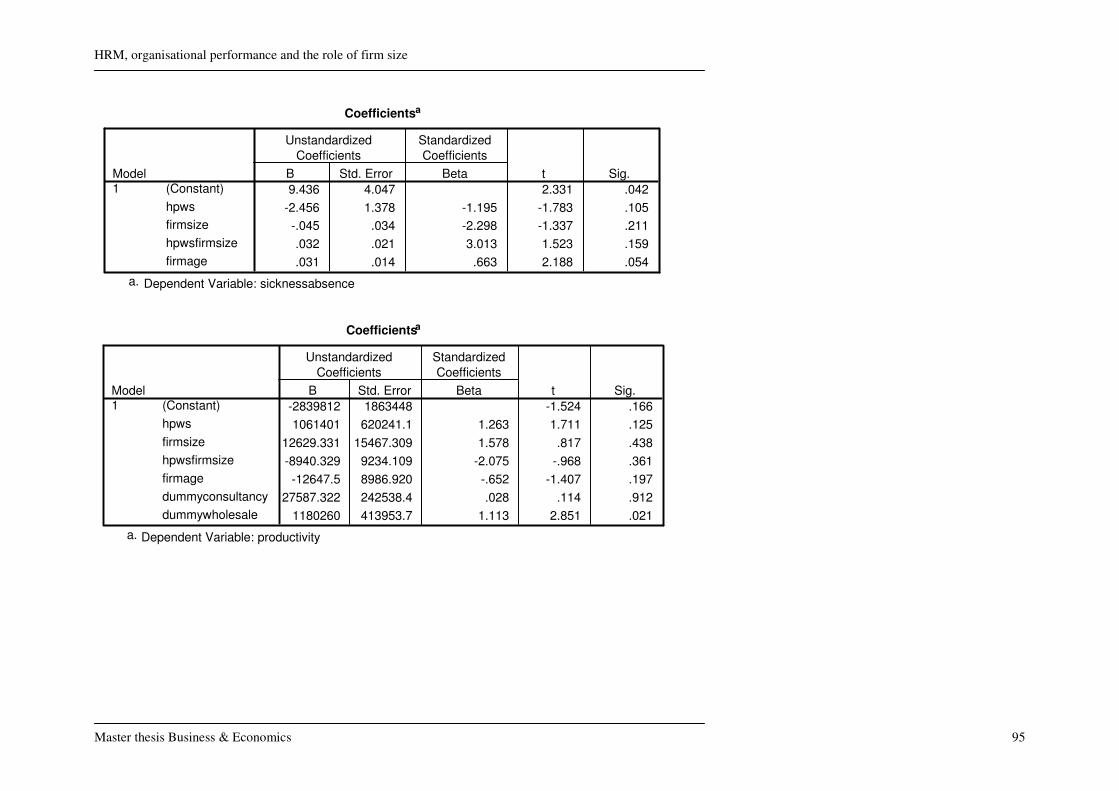
HRM, organisational performance and the role of firm size
Master thesis Business & Economics 95
Coefficientsa
9.436 4.047 2.331 .042
-2.456 1.378 -1.195 -1.783 .105
-.045 .034 -2.298 -1.337 .211
.032 .021 3.013 1.523 .159
.031 .014 .663 2.188 .054
(Constant)
hpws
firmsize
hpwsfirmsize
firmage
Model1
B Std. Error
Unstandardized
Coefficients
Beta
Standardized
Coefficients
t Sig.
Dependent Variable: sicknessabsencea.
Coefficientsa
-2839812 1863448 -1.524 .166
1061401 620241.1 1.263 1.711 .125
12629.331 15467.309 1.578 .817 .438
-8940.329 9234.109 -2.075 -.968 .361
-12647.5 8986.920 -.652 -1.407 .197
27587.322 242538.4 .028 .114 .912
1180260 413953.7 1.113 2.851 .021
(Constant)
hpws
firmsize
hpwsfirmsize
firmage
dummyconsultancy
dummywholesale
Model1
B Std. Error
Unstandardized
Coefficients
Beta
Standardized
Coefficients
t Sig.
Dependent Variable: productivitya.

HRM, organisational performance and the role of firm size
Master thesis Business & Economics 96
Respondents Questionnaires

HRM, organisational performance and the role of firm size
Master thesis Business & Economics 97
I. Questionnaire Chief Executive Officer
Question 1:
Are you the (associate-) owner of this company? YES / NO (please blot out what does not
apply).
Question 2:
Please answer the following question with a YES or NO: „Was a HR department with
specialized HRM employees present in this company in year 2006?”
The answer is: YES / NO (please blot out what does not apply).
If NO, I would like to ask you also to complete the questionnaire called “HR department”
after you have completed this questionnaire.
If there was no HR department, please answer the following question: „Who was/were
responsible for this company’s human resource management in year 2006?”
…………………………………………………………………………………………………
…………………………………………………………………………………………………
(Please fill in)
Question 3:
What percentage of the employees in this company was in year 2006 involved in job rotation
(i.e. varying different jobs and/or tasks within the organisation)?
I assess …… percent (please fill in on a scale from 0 to 100).
Question 4:
Please answer the following statement with an AGREE or DISAGREE: „Most jobs in this
company in year 2006 did consist of concretely defined work tasks such that job descriptions
were easy to make.
The answer is: AGREE / DISAGREE (please blot out what does not apply).

HRM, organisational performance and the role of firm size
Master thesis Business & Economics 98
Question 5:
What percentage of the employees in this company was in year 2006 involved in self-
managed teams (i.e. in working teams without direct supervisory)?
I assess …… percent (please fill in on a scale from 0 to 100).
Question 6:
What percentage of the employees in this company was in year 2006 involved in regularly
scheduled meetings to discuss work-related issues?
I assess …… percent (please fill in on a scale from 0 to 100).
Was an executive member always involved in these meetings? YES / OR (please blot out
what does not apply).
Question 7:
Considering year 2006, please indicate to what extent you AGREE or DISAGREE with the
following statements on a six-point scale (1=strongly disagree; 2=disagree; 3=sort of
disagree; 4=sort of agree; 5=agree; 6=strongly agree):
• It often occurred that minor or major improvements were done to the products that this
company offered to its customers.
1 2 3 4 5 6
• It often occurred that minor or major improvements were done in the services this
company offered to its customers.
1 2 3 4 5 6
• It often occurred that minor or major improvements were done in the ways this
company achieved its products.
1 2 3 4 5 6

HRM, organisational performance and the role of firm size
Master thesis Business & Economics 99
Question 8:
Please answer the following question with a YES or NO: „In year 2006, there was a middle-
management responsible for the daily operations in this company?”
The answer is: YES / NO (please blot out what does not apply).
Question 9:
Please answer the following question with a YES or NO: „In year 2006, there were many
direct competitors in the market wherein this company was operating?”
The answer is: YES / NO (please blot out what does not apply).

HRM, organisational performance and the role of firm size
Master thesis Business & Economics 100
II. Questionnaire HR department
Question 1:
Since when do you work in this company? Since …… years (please fill in).
Question 2:
To what extent was each of the following four selection devices used in year 2006 in this
company to evaluate job candidates? Please indicate for every selection device on a five-point
scale (1=never; 2=sometimes; 3=average; 4=often; 5=always):
• Interviews 1 2 3 4 5
• Tests 1 2 3 4 5
• Work samples 1 2 3 4 5
• References from previous employers 1 2 3 4 5
Question 3:
How many people, on average, were in year 2006 involved into the selection process of job
applicants?
The answer is: …… persons (please fill in).
Question 4:
Compare the level of base salary offered in year 2006 in this company with the level of base
salary for identical operational jobs in other companies. The base salary offered in this
company is (please mark what does apply):
□ Below average
□ Average
□ Above average

HRM, organisational performance and the role of firm size
Master thesis Business & Economics 101
Question 5:
Please AGREE or DISAGREE with the following statement: „One or more of the four
benefits below was/were offered in year 2006 to operational staff in this company.”
• Profit-sharing
• Bonuses
• Share plans
• Stock options
The answer is: AGREE / DISAGREE (please blot out what does not apply).
Question 6:
What percentage of the employees in this company received in year 2006 formal, out-of-firm
training?
I assess …… percent (please fill in on a scale from 0 to 100).
Question 7:
Please give the most important reasons for why this company has chosen in year 2006 for this
particular training (in a decreasing measure of importance, with 1=most important)?
1……………………………………………………………………………………………….....
2………………………………………………………………………………………………….
3………………………………………………………………………………………………….
4………………………………………………………………………………………………….
(Please fill in)
Question 8:
Please give the figure of all permanent terminations of regular employees, voluntary, that
occurred during year 2006. Do not include involuntary terminations (e.g. retirement,
discharge, death, job eliminations). Do also not include departures of temporary staff.
The figure is: …… employees (please fill in).
HRM, organisational performance and the role of firm size
Master thesis Business & Economics 102
Question 9:
Please give the figure of all full- and part-time employees on the active payroll who worked at
least 20 hours per week during year 2006. Do not include temporary staff and employees on
layoff during the selected period.
The figure is: …… employees (please fill in).
Question 10:
In which class did the sickness absence rate (excluding maternity leave) of this company fall
in year 2006 (please mark what does apply)?
□ 0 percent
□ Less than 2 percent
□ 2 – less than 3 percent
□ 3 – less than 4 percent
□ 4 – less than 5 percent
□ 5 – less than 6 percent
□ 6 – less than 7 percent
□ 7 percent and more

HRM, organisational performance and the role of firm size
Master thesis Business & Economics 103
III. Questionnaire Employee
Question 1:
Since when do you work in this company? Since …… years (please fill in).
Question 2:
Focusing on problems that you encountered during your work in year 2006, to what extent do
you AGREE or DISAGREE with the following statements? Please indicate for every
statement on a six-point scale (1=strongly disagree; 2=disagree; 3=sort of disagree; 4=sort of
agree; 5=agree; 6=strongly agree):
• I identified several alternative solutions for each problem encountered.
1 2 3 4 5 6
• I seemed to always come up with solutions to problems encountered.
1 2 3 4 5 6
• It was always easy to identify new solutions to the problems.
1 2 3 4 5 6
Question 3:
Focusing on problems that you encountered during your work in year 2006, to what extent do
you AGREE or DISAGREE with the following statements? Please indicate for every
statement on a six-point scale (6=strongly disagree; 5=disagree; 4=sort of disagree; 3=sort of
agree; 2=agree; 1=strongly agree):
• Solutions found for problems I faced were not timely.
1 2 3 4 5 6
• I was very slow in finding and implementing solutions to the problems I encountered.
1 2 3 4 5 6

HRM, organisational performance and the role of firm size
Master thesis Business & Economics 104
• Ideas for solving the problems encountered were discovered rather late to be
implemented successfully.
1 2 3 4 5 6
Question 4:
Considering year 2006, please indicate to what extent you AGREE or DISAGREE with the
following statements on a six-point scale (1=strongly disagree; 2=disagree; 3=sort of
disagree; 4=sort of agree; 5=agree; 6=strongly agree):
• I often had an opportunity to talk to other employees in this organisation about
successful work activities in order to understand why they succeed.
1 2 3 4 5 6
• Failures were almost always constructively discussed in this organisation.
1 2 3 4 5 6
• New work processes that may be useful to the organisation as a whole were usually
shared with all employees.
1 2 3 4 5 6
Question 5:
Consider your working conditions (i.e. compensation, development and independency
opportunities) in this organisation over year 2006. Please indicate to what extent you AGREE
or DISAGREE with the following statements on a six-point scale (1=strongly disagree;
2=disagree; 3=sort of disagree; 4=sort of agree; 5=agree; 6=strongly agree):
• One of the major reasons I continued to work for this company is that leaving would
have required considerable personal sacrifice – another company may not have
matched the overall benefits I had now.
1 2 3 4 5 6

HRM, organisational performance and the role of firm size
Master thesis Business & Economics 105
• It would have been very hard for me to leave this organisation, even if I wanted to.
1 2 3 4 5 6
• Too much in my life would have been disrupted if I decided that I wanted to leave this
organisation.
1 2 3 4 5 6
Question 6:
Considering year 2006, please indicate to what extent you AGREE or DISAGREE with the
following statements on a six-point scale (1=strongly disagree; 2=disagree; 3=sort of
disagree; 4=sort of agree; 5=agree; 6=strongly agree):
• I did feel “emotionally attached” to this organisation.
1 2 3 4 5 6
• This organization had a great deal of personal meaning to me.
1 2 3 4 5 6
• I did feel like “part of the family” at this organisation.
1 2 3 4 5 6
Question 7:
Considering year 2006, please indicate to what extent you AGREE or DISAGREE with the
following statements on a six-point scale (1=strongly disagree; 2=disagree; 3=sort of
disagree; 4=sort of agree; 5=agree; 6=strongly agree):
• My job gave me many chances to use my personal initiative or judgement in carrying
out the work.
1 2 3 4 5 6
• My job gave me considerable opportunity for independence and freedom in how to do
the work.
1 2 3 4 5 6

HRM, organisational performance and the role of firm size
Master thesis Business & Economics 106
• My job gave me many opportunities to do a variety of tasks which utilize many of my
skills.
1 2 3 4 5 6
Question 8:
Considering year 2006, please indicate to what extent you AGREE or DISAGREE with the
following statements on a six-point scale (1=strongly disagree; 2=disagree; 3=sort of
disagree; 4=sort of agree; 5=agree; 6=strongly agree):
• I felt I was being paid an adequate amount for the work I did.
1 2 3 4 5 6
• I was satisfied with the benefits I received in my job.
1 2 3 4 5 6
• I felt satisfied with my chances for salary increases.
1 2 3 4 5 6
Question 9:
Consider your work in this organisation in year 2006. Please indicate to what extent you
AGREE or DISAGREE with the following statements on a six-point scale (1=strongly
disagree; 2=disagree; 3=sort of disagree; 4=sort of agree; 5=agree; 6=strongly agree):
• Other people knew me by the long hours I kept.
1 2 3 4 5 6
• Few people put in more hours weekly than I did.
1 2 3 4 5 6

HRM, organisational performance and the role of firm size
Master thesis Business & Economics 107
Question 10:
Consider your work in this organisation in year 2006. Please indicate to what extent you
AGREE or DISAGREE with the following statements on a six-point scale (1=strongly
disagree; 2=disagree; 3=sort of disagree; 4=sort of agree; 5=agree; 6=strongly agree):
• I worked at my full capacity in all my job duties.
1 2 3 4 5 6
• I strived as hard as I could to be successful in my work.
1 2 3 4 5 6
• When there was a job to be done, I devoted all my energy to getting it done.
1 2 3 4 5 6
Question 11:
Considering year 2006, please indicate what measure on a six-point scale is related to the
following statements (1=never; 2=sometimes; 3=regular; 4=often; 5=almost always;
6=always):
• This company’s products conformed to performance specifications required by its
customers.
1 2 3 4 5 6
• This company’s products performances met the requirements of its customers.
1 2 3 4 5 6
• The design of this company’s products met the quality standards expected by its
customers.
1 2 3 4 5 6

HRM, organisational performance and the role of firm size
Master thesis Business & Economics 108
Question 12:
Please answer the following question with a YES or NO: „Was/were this company’s owner(s)
a direct supervisor of you and your colleagues in year 2006?”
The answer is: YES / NO (please blot out what does not apply).

HRM, organisational performance and the role of firm size
Master thesis Business & Economics 109
Bibliography
Amabile, T.M., Conti, R., Coon, H., Lazenby, J., Herron, M., 1996, Assessing the work
environment for creativity, Academy of Management Journal, Vol. 39, No. 5 (October): 1154-
1184
Arthurs, J.B., 1994, Effects of human resource management systems on manufacturing
performance and turnover, Academy of Management Journal, Vol. 37, No. 3: 670-687
Atuahene-Gima, K., 2003, The effects of centrifugal and centripetal forces on product
development speed and quality: how does problem solving matter?, Academy of Management
Journal, Vol. 46, No. 3: 359-373
Babbie, E., 2000, The practice of social research (9th
edition), Wadsworth / Thomson
Learning, Belmont, USA
Bacon, N., Ackers, P., Storey, J., Coates, D., 1996, It’s a small world: managing human
resources in small businesses, The International Journal of Human Resource Management,
Vol. 7, No. 1 (February): 82-100
Baer, M., Oldham, G.R., Cummings, A., 2003, Rewarding creativity: when does it really
matter?, The Leadership Quarterly, Vol. 14: 569-586
Barney, J., 1991, Firm resources and sustained competitive advantage, Journal of
Management, Vol. 17, No. 1: 99-120
Batt, R., 2002, Managing customer services: human resource practices, quit rates, and sales
growth, Academy of Management Journal, Vol. 45, No. 3: 587-597
Becker, B.E., Huselid, M.A., Pickus, P.S., Spratt, M.F., 1997, HR as a source of shareholder
value: research and recommendations, Human Resource Management, Vol. 36, No. 1
(Spring): 39-47

HRM, organisational performance and the role of firm size
Master thesis Business & Economics 110
Becker, B., Gerhart, B., 1996, The impact of human resource management on organizational
performance: progress and prospects, The Academy of Management Journal, Vol. 39, No. 4
(August): 779-801
Becker, H.S., 1960, Notes on the concept of commitment, The American Journal of
Sociology, Vol. 66, No. 1 (July): 32-40
Binks, M.R., Ennew, C.T., 1996, Growing firms and the credit constraint, Small Business
Economics, Vol. 8: 17-25
Blau, G., 1993, Operationalizing direction and level of effort and testing their relationships to
individual job performance, Organizational Behavior and Human Decision Processes, Vol.
55: 152-170
Böhringer, A.W.O., 2004, How to stop individuals’ innovation – learning from “losers”,
http://www.handels.gu.se/ifsam/Streams/Poster/poster.htm, Paper 217
Brand, M.J., Bax, E.H., 2002, Strategic HRM for SMEs: implications for firms and policy,
Education and Training, Vol. 44, No. 8/9: 451-463
Brealey, R.A., Myers, S.C., 2000, Principles of corporate finance (6th
edition), McGraw-Hill
Higher Education, USA
Brock, W.A., Evans, D.S., 1989, Small business economics, Small Business Economics, Vol.
1: 7-20
Brockhoff, K., Chakrabarti, A.K., Hauschildt, J., 1999, The dynamics of innovation: strategic
and managerial implications, Springer, Berlin, Germany
Brown, S.P., Leigh, T.W., 1996, A new look at psychological climate and its relationship to
job involvement, effort, and performance, Journal of Applied Psychology, Vol. 81, No. 4:
358-368

HRM, organisational performance and the role of firm size
Master thesis Business & Economics 111
Buzawa, E.S., 1984, Determining patrol officer job satisfaction, Criminology, Vol. 22, No. 1:
61-81
Cappelli, P., Neumark, D., 2001, Do “high-performance” work practices improve
establishment-level outcomes?, Industrial and Labor Relations Review, Vol. 54, No. 4 (July):
737-775
Carroll, M., Marchington, M., Earnshaw, J., Taylor, S., 1999, Recruitment in small firms;
processes, methods and problems, Employee Relations, Vol. 21, No. 3: 236-250
Cassell, C., Nadin, S., Gray, M., Clegg, C., 2002, Exploring human resource management
practices in small and medium sized enterprises, Personnel Review, Vol. 31, No. 5/6: 671-692
Chan, L.L.M., Shaffer, M.A., Snape, E., 2004, In search of sustained competitive advantage:
the impact of organizational culture, competitive strategy and human resource management
practices on firm performance, International Journal of Human Resource Management, Vol.
15, No. 1 (February): 17-35
Chong, V.K., Eggleton, I.R.C., 2007, The impact of reliance on incentive-based compensation
schemes, information asymmetry and organisational commitment on managerial performance,
Management Accounting Research, Vol. 18: 312-342
Clark, M.A., Amundson, S.D., Cardy, R.L., 2002, Cross-functional team decision-making and
learning outcomes: a qualitative illustration, Journal of Business and Management, Vol. 8,
No. 3 (Summer): 217-236
Cohen, S.G., Bailey, D.E., 1997, What makes teams work: group effectiveness research from
the shop floor to the executive suite, Journal of Management, Vol. 23, No. 3: 239-290
Coleman, S., 2006, Scope of work and problem identification: the significant seven, The
Appraisal Journal, Vol. 74, No. 3 (Summer): 232-237

HRM, organisational performance and the role of firm size
Master thesis Business & Economics 112
Compeer, N., Smolders, M., De Kok, J., 2005, Scale effects in HRM research: a discussion of
current HRM research from an SME perspective, Published under the SCALES-initiative as
part of the SMEs and Entrepreneurship programme financed by The Netherlands Ministry of
Economic Affairs (March), Zoetermeer, The Netherlands
Cotton, J.L., Tuttle, J.M., 1986, Employee turnover: a meta-analysis and review with
implications for research, The Academy of Management Review, Vol. 11, No. 1 (January): 55-
70
Damanpour, F., 1991, Organizational innovation: a meta-analysis of effects of determinants
and moderators, Academy of Management Review, Vol. 34, No. 3: 555-590
De Kok, J., Tom, M., 2007, MKB: banenmotor in hoog- en laagconjunctuur,
http://www.ondernemerschap.nl/sys/cftags/assetnow/design/widgets/site/ctm_getFile.cfm?file
=M200701.pdf&perId=0, Paper M200701
De Kok, J.M.P., Den Hartog, D., 2006, Is human resource management profitable for small
firms? The impact of high performance work systems on labour productivity and profit of
small and medium-sized enterprises, Published under the SCALES-initiative as part of the
SMEs and Entrepreneurship programme financed by The Netherlands Ministry of Economic
Affairs (September), Zoetermeer, The Netherlands
De Kok, J., Uhlaner, L.M., 2001, Organization context and human resource management in
the small firm, Small Business Economics, Vol. 17, No. 4: 273-292
Delaney, J.T., Huselid, M.A., 1996, The impact of human resource management practices on
perceptions of organizational performance, Academy of Management Journal, Vol. 39, No. 4
(August): 949-969
Delery, J.E., Shaw, J.D., 2001, The strategic management of people in work organizations:
review, synthesis, and extension, Research in Personnel and Human Resources Management,
Vol. 20: 165-197

HRM, organisational performance and the role of firm size
Master thesis Business & Economics 113
Delery, J.E., 1998, Issues of fit in strategic human resource management: implications for
research, Human Resource Management Review, Vol. 8, No. 3: 289-309
Delery, J.E., Doty, D.H., 1996, Modes of theorizing in strategic human resource management:
tests of universalistic, contingency, and configurational performance predictions, Academy of
Management Journal, Vol. 39, No. 4 (August): 802-835
Deshpande, S.P., Golhar, D.Y., 1994, HRM practices in large and small manufacturing firms:
a comparative study, Journal of Small Business Management, Vol. 32, No. 2 (April): 49-56
Devins, D., Johnson, S., 2003, Training and development activities in SMEs, International
Small Business Journal, Vol. 21, No. 2: 213-228
Drummond, I., Stone, I., 2007, Exploring the potential of high performance work systems in
SMEs, Employee Relations, Vol. 29, No. 2: 192-207
Dyer, L., Reeves, T., 1995, Human resource strategies and firm performance: what do we
know and where do we need to go?, International Journal of Human Resource Management,
Vol. 6, No. 3: 656-670
Faems, D., Sels, L., De Winne, S., Maes, J., 2005, The effect of individual HR domains on
financial performance: evidence from Belgian small businesses, International Journal of
Human Resource Management, Vol. 16, No. 5 (May): 676-700
Fey, C.F., Björkman, I., Pavlovskaya, A., 2000, The effect of human resource management
practices on firm performance in Russia, International Journal of Human Resource
Management, Vol. 11, No. 1 (February): 1-18
Ganzeboom, H.B.G., 2003, Elementaire inleiding SPSS-syntax, Ten behoeve van studenten
Sociale Wetenschappen, Vrije Universiteit, Amsterdam, The Netherlands
Gatewood, R.D., Feild, H.S., 1987, A personnel selection program for small business, Journal
of Small Business Management, Vol. 25, No. 4 (October): 16-24

HRM, organisational performance and the role of firm size
Master thesis Business & Economics 114
Gerhart, B., Wright, P.M., McMahan, G.C., Snell, S.A., 2000, Measurement error in research
on human resources and firm performance: how much error is there and how does it influence
effect size estimates?, Personnel Psychology, Vol. 53, No. 4: 803-834
Goh, S., Richards, G., 1997, Benchmarking the learning capability of organizations, European
Management Journal, Vol. 15, No. 5: 575-583
Golhar, D.Y., Deshpande, S.P., 1997, HRM practices of small and large Canadian
manufacturing firms, Journal of Small Business Management, Vol. 35, No. 3 (July): 30-38
Griffin, A., 1997, PDMA research on new product development practices: updating trends
and benchmarking best practices, Journal of Product Innovation Management, Vol. 14: 429-
458
Guest, D.E., Michie, J., Conway, N., Sheehan, M., 2003, Human resource management and
corporate performance in the UK, British Journal of Industrial Relations, Vol. 41, No. 2
(June): 291-314
Guest, D.E., 2001, Human resource management: when research confronts theory,
International Journal of Human Resource Management, Vol. 12, No. 7 (November): 1092-
1106
Guest, D.E., 1999, Human resource management – the workers’ verdict, Human Resource
Management Journal, Vol. 9, No. 3: 5-25
Guest, D.E., 1997, Human resource management and performance: a review and research
agenda, The International Journal of Human Resource Management, Vol. 8, No. 3 (June):
263-276
Guthrie, J.P., Datta, D.K., Wright, P.M., 2004, Peeling back the onion competitive advantage
through people: test of a causal model, Working Paper Series CAHRS/Cornell University,
Ithaca

HRM, organisational performance and the role of firm size
Master thesis Business & Economics 115
Guthrie, J.P., 2001, High-involvement work practices, turnover, and productivity: evidence
from New Zealand, Academy of Management Journal, Vol. 44, No. 1 (February): 180-190
Halsted, A.J., Bromley, M.L., Cochran, J.K., 2000, The effects of work orientations on job
satisfaction among sheriff’s deputies practicing community-oriented policing, Policing: An
International Journal of Police Strategies & Management, Vol. 23, No. 1: 82-104
Hayton, J.C., 2003, Strategic human capital management in SMEs: an empirical study of
entrepreneurial performance, Human resource management, Vol. 42, No. 4: 375-392
Heneman, R.L., Tansky, J.W., Camp, S.M., 2000, Human resource management practices in
small and medium-sized enterprises: unanswered questions and future research perspectives,
Entrepreneurship Theory and Practice, Vol. 25, No. 1: 11-26
Heneman III, H.G., Berkley, R.A., 1999, Applicant attraction practices and outcomes among
small businesses, Journal of Small Business Management, Vol. 37, No. 1 (January): 53-74
Holmes, S., Gibson, B., 2001, Definition of small business, Final report (April), The
University of Newcastle, Newcastle
Hulshoff, H., 2001, Family business in the Dutch SME sector; definitions and characteristics,
Strategic study as part of the Programmaonderzoek MKB en Ondernemerschap that is
financed by the Dutch Ministry of Economic Affairs (March), Zoetermeer
Huselid, M.A., 1995, The impact of human resource management practices on turnover,
productivity, and corporate financial performance, Academy of Management Journal, Vol. 38,
No. 3: 635-672
Ichniowski, C., Shaw, K., Prennushi, G., 1997, The effects of human resource management
practices on productivity: a study of steel finishing lines, The American Economic Review,
Vol. 87, No. 3 (June): 291-313
Jackson, S.E., Schuler, R.S., 1995, Understanding human resource management in the context
of organizations and their environments, Annual Review of Psychology, Vol. 46: 237-264

HRM, organisational performance and the role of firm size
Master thesis Business & Economics 116
Kanter, R., 1985, Supporting innovation and venture development in established companies,
Journal of Business Venturing, Vol. 1: 47-60
King-Kauanui, S., Dang Ngoc, S., Ashley-Cotleur, C., 2006, Impact of human resource
management: SME performance in Vietnam, Journal of Developmental Entrepreneurship,
Vol. 11, No. 1: 79-95
Kirkpatrick, L.A., Feeney, B.C., 2003, A simple guide to SPSS for Windows, Thomson
Wadsworth, Belmont, USA
Koch, M.J., McGrath, R.T., 1996, Improving labor productivity: human resource management
policies do matter, Strategic Management Journal, Vol. 17, No. 5 (May): 335-354
Kotey, B., Slade, P., 2005, Formal human resource management practices in small growing
firms, Journal of Small Business Management, Vol. 43, No. 1 (January): 16-40
Kotey, B., Sheridan, A., 2004, Changing HRM practices with firm growth, Journal of Small
Business and Enterprise Development, Vol. 11, No. 4: 474-485
Kotey, B., 1999, Human resource management practices of sunshine coast small firms with
reference to the prescribed models, International Journal of Employment Studies, Vol. 7, No.
1: 79-104
Leifer, R., McDermott, C.M., Colarelli O’Connor, G., Peters, L.S., Rice, M.P., Veryzer,
R.W., 2000, Radical innovation: how mature companies can outsmart upstarts, Harvard
Business School Press, Boston, USA
Liouville, J., Bayad, M., 1998, Human resource management and performances: proposition
and test of a causal model, Human Systems Management, Vol. 17: 183-192
MacDuffie, J.P., 1995, Human resource bundles and manufacturing performance:
organizational logic and flexible production systems in the world auto industry, Industrial and
Labor Relations Review, Vol. 48, No. 2: 197-221

HRM, organisational performance and the role of firm size
Master thesis Business & Economics 117
McEvoy, G.M., Cascio, W.F., 1985, Strategies for reducing employee turnover: a meta-
analysis, Journal of Applied Psychology, Vol. 70, No. 2: 342-353
McGee, G.W., Ford, R.C., 1987, Two (or more?) dimensions of organizational commitment:
re-examination of the affective and continuance commitment scales, Journal of Applied
Psychology, Vol. 72, No. 4: 638-642
Meyer, J.P., Allen, N.J., 1984, Testing the “side-bet theory” of organizational commitment:
some methodological considerations, Journal of Applied Psychology, Vol. 69: 372-378
Miller, D., 1987, Strategy making and structure: analysis and implications for performance,
Academy of Management Journal, Vol. 30: 7-32
Mumford, M.D., 2000, Managing creative people: strategies and tactics for innovation,
Human Resource Management Review, Vol. 10, No. 3: 313-351
Muse, L.A., Rutherford, M.W., Oswald, S.L., Raymond, J.E., 2005, Commitment to
employees: does it help or hinder small business performance?, Small Business Economics,
Vol. 24: 97-111
Nooteboom, B., 1993, Firm size effects on transaction costs, Small Business Economics, Vol.
5: 283-295
Oke, A., Burke, G., Myers, A., 2007, Innovation types and performance in growing UK
SMEs, International Journal of Operations & Production Management, Vol. 27, No. 7: 735-
753
Patterson, M.G., West, M.A., Shackleton, V.J., Dawson, J.F., Lawthom, R., Maitlis, S.,
Robinson, D.L., Wallace, A.M., 2005, Validating the organizational climate measure: links to
managerial practices, productivity and innovation, Journal of Organizational Behavior, Vol.
26: 379-408

HRM, organisational performance and the role of firm size
Master thesis Business & Economics 118
Porter, L.W., Steers, R.W., Mowday, R.T., Boulian, P.V., 1974, Organisational commitment,
job satisfaction, and turnover among psychiatric technicians, Journal of Applied Psychology,
Vol. 59: 603-609
Pransky, G., Finkelstein, S., Berndt, E., Kyle, M., Mackell, J., Tortorice, D., 2006, Objective
and self-report work performance measures: a comparative analysis, International Journal of
Productivity and Performance Management, Vol. 55, No. 5 (January): 390-399
Purcell, J., 1999, Best practice and best fit: chimera or cul-de-sac, Human Resource
Management Journal, Vol. 9, No. 3: 26-41
Rosenbaum, D.P., Yeh, S., Wilkinson, D., 1994, Impact of community policing on police
personnel: a quasi-experimental test, Crime & Delinquency, Vol. 40, No. 3: 331-353
Schein, E.H., 1978, Career dynamics: matching individual and organizational needs,
Addison-Wesley, Reading, USA
Sels, L., De Winne, S., Delmotte, J., Maes, J., Faems, D., Forrier, A., 2006, Linking HRM
and small business performance: an examination of the impact of HRM intensity on the
productivity and financial performance of small businesses, Small Business Economics, Vol.
26: 83-101
Sheremata, W.A., 2000, Centrifugal and centripetal forces in radical new product
development under time pressure, Academy of Management Review, Vol. 25, No. 2: 389-406
Shipton, H., Fay, D., West, M., Patterson, M., Birdi, K., 2005, Managing people to promote
innovation, Creativity and Innovation Management, Vol. 14, No. 2: 118-128
Solomon, R.J., 1984, Using the interview in small business, Journal of Small Business
Management, Vol. 22, No. 4 (October): 17-23
Starbuck, W.H., Mezias, J.M., 1996, Opening Pandora’s box: studying the accuracy of
managers’ perceptions, Journal of Organizational Behavior, Vol. 17, No. 2 (March): 99-117

HRM, organisational performance and the role of firm size
Master thesis Business & Economics 119
Tangen, S., 2003, An overview of frequently used performance measures, Work Study, Vol.
52, No. 7: 347-354
Tidd, J., Bessant, J., Pavitt, K., 2001, Managing innovation: integrating technological, market
and organizational change, Wiley, Chichester, UK
Tzafrir, S.S., 2006, An universalistic perspective for explaining the relationship between
HRM practices and firm performance at different points in time, Journal of Managerial
Psychology, Vol. 21, No. 2: 109-130
Way, S.A., 2002, High performance work systems and intermediate indicators of firm
performance within the US small business sector, Journal of Management, Vol. 28, No. 6
(January): 765-785
Westhead, P., Storey, D., 1996, Management training and small firm performance: a critical
review, International Small Business Journal, Vol. 14, No. 4 (July-September): 3-25
Wright, P.M., Gardner, T.M., Moynihan, L.M., Allen, M.R., 2005, The relationship between
HR practices and firm performance: examining causal order, Personnel Psychology, Vol. 58,
No. 2: 409-446
Wright, P.M., Boswell, W.R., 2002, Desegregating HRM: a review and synthesis of micro
and macro human resource management research, Journal of Management, Vol. 28, No. 3:
247-276
Wright, P.M., McMahan, G.C., 1992, Theoretical perspectives for strategic human resource
management, Journal of Management, Vol. 18, No. 2: 295-320
Wycoff, M.A., Skogan, W.G., 1994, The effect of a community policing management style
on officers' attitudes, Crime and Delinquency, Vol. 40, No. 3: 371-383
Youndt, M.A., Snell, S.A., Dean, J.W., Lepak, D.P., 1996, Human resource management,
manufacturing strategy, and firm performance, Academy of Management Journal, Vol. 39,
No. 4: 836-866