Embed Size (px)
Citation preview

HRS Documentation Report
Updates to HRS Sample Weights
Report prepared by
Mary Beth Ofstedal
David R. Weir
Kuang-Tsung (Jack) Chen
James Wagner
Survey Research Center
University of Michigan
Ann Arbor, MI
June 2011
______________________________________________________
DR-013

1
Introduction
This report provides a brief overview of the sample design and sample weight construction for
the Health and Retirement Study. It updates previous reports covering parts of the study
(Heeringa and Connor, 1995; Heeringa, 1995; HRS, 2006; HRS website, 2011a; HRS website,
2011b.) The primary motivation for this update is to document some recent revisions to the HRS
sample weights and evaluate the impact of those revisions on the weights themselves and on
weighted sample distributions for a number of key indicators.
This re-evaluation of HRS sampling weights was initially motivated by reports of errors in the
age distributions in the Census products on which the HRS relies to establish population
benchmarks. HRS uses the Current Population Survey (CPS) and the American Community
Survey (ACS) to post-stratify sampling weights to the US population for a given survey year.
There were errors in the way Census applied age perturbation for disclosure risk avoidance in
several waves of both the CPS and the ACS in the years following the 2000 Census. This
includes the 2004 CPS and the 2006 ACS, which were used for post-stratification of the 2004
and 2006 HRS sample weights, respectively. The Census Bureau released a new version of the
2006 ACS data, necessitating a revision of the 2006 HRS sample weights using the new ACS
data for post-stratification. The ACS correction had little impact on the HRS sample weights, as
discussed later in this report. After careful evaluation, the Census Bureau decided not to release
new versions of the CPS data,1 so it was not possible to redo the post-stratification for the 2004
HRS weights.
Prior to implementing the revision of the 2006 weights we undertook an evaluation of the sample
weights for all waves. That review revealed calculation errors in two prior waves: one in the
post-stratification of the 1995 respondent weights for the AHEAD cohort, and the other in the
sample selection factor for the new cohort EBB baseline weights in the 2004 wave. The 1995
respondent-level weight for the AHEAD cohort was mistakenly post-stratified to the 1993 CPS,
rather than 1995 CPS, and the 2004 baseline weight for the EBB cohort did not account for sub-
sampling of non-minority respondents in minority domains. Because follow-up wave weights
rely on baseline weights for each cohort, the 2004 issue also affects the 2006 and 2008 weights.
Both of these issues are described in detail in later sections of the report.
The analyses later in this report show that these revisions do not substantially alter the weights
and do not significantly affect weighted distributions of key variables. Analyses done with the
earlier versions of sampling weights should not in general require revision. Some possible
exceptions include analyses that present population estimates (counts or percentages) for the
1995 AHEAD cohort or for the EBB non-minority (White/other) sample. Analyses that compare
the EBB non-minority cohort to other subgroups may also be affected by the new weights. Even
for this specific subgroup, however, the impact is likely to be minimal (as shown later in Table
1For details see the report by Alexander, Davern and Stevenson at this link:
http://bpp.wharton.upenn.edu/betseys/papers/Inaccurate%20Age%20and%20Sex%20Data%20in%20Census%20PU
MS%20Files.pdf, ACS Errata Notes No. 47 and 50 at this link:
http://www.census.gov/acs/www/data_documentation/errata/, and the CPS User Note at this link:
http://www.census.gov/cps/user_note_age_estimates.html.

2
B5). Results based on analyses that make use of the full EBB sample or that combine cohorts in
the HRS sample should not be affected by the new weights.
HRS sample weights have been updated for the following waves:
1995: Household weight (DWGTHH) and respondent weight (DWGTR)
2004: Household weight (JWGTHH) and respondent weight (JWGTR)
2006: Household weight (KWGTHH) and respondent weight (KWGTR)
2008: Household weight (LWGTHH) and respondent weight (LWGTR)
In addition, because sample weights for the supplemental studies and components depend on the
core weights, the following supplement weights have also been updated:
2004 physical measures (JPMWGTR)
2004 psychosocial leave-behind (JWGTR_PS)
2004 disability vignette leave-behind (JWGTR_DB)
2005 Prescription Drug Study (PDS) (P1QXWT and P1MEDWT)
2006 physical measures (KPMWGTR)
2006 biomarkers (KBIOWGTR)
2006 psychosocial leave-behind (KLBWGTR)
2008 physical measures (LPMWGTR)
2008 psychosocial leave-behind (LLBWGTR)
An explanation for the updates and analyses of the impact of the changes on the distribution of
the weights are presented in this report.
With the exception of the 2005 PDS sample weight, which is provided on the PDS sample file,
all of the revised core and supplement weights are available on Early 2010 Version 1.0 of the
Cross-Wave Tracker File. The original weights have been replaced with the revised weights on
this file. Researchers who need access to earlier versions of sampling weights can request them
Overview of Sample Design and Sample Weights
The HRS began in 1992 as a longitudinal study of a pre-retirement cohort of individuals born in
1931-1941, and their spouses of any age. This birth cohort is referred to as the original HRS
cohort. It was joined in 1993 by a companion study, the Study of Asset and Health Dynamics of
the Oldest Old (AHEAD), comprised of a cohort of persons born before 1924 and their spouses
of any age (the AHEAD cohort). In 1998, the study design was modified to convert the HRS
sample from a set of specific cohorts into a steady state sample that represents the community-
dwelling U.S. population over age 50. This was achieved by adding new cohorts in 1998 to fill
in the age range over 50 (the CODA cohort consisting of persons born between 1925 and 1930
and the War Baby cohort born between 1942 and 1947) and by adding a new six-year cohort of
persons entering their 50s every six years thereafter. The Early Baby Boom cohort (born 1948-

3
1953) was added in 2004 and the Mid Baby Boom cohort (born 1954-1959) is being added in
2010.
The HRS sample is based on a multi-stage, area-clustered, stratified sample design. Two
household screening efforts were conducted in 1992 and in 2004; these served as the sources for
most of the HRS sample. The 1992 household screen was used to identify the original HRS
cohort, most of the AHEAD cohort, and the War Baby cohort (added in 1998). The 2004 screen
was used to identify the Early Baby Boom cohort and part of the Mid Baby Boom cohort. The
CODA cohort and the remainder of the AHEAD cohort were drawn from a list of Medicare
enrollees obtained from the Health Care Financing Administration (now the Center for Medicare
and Medicaid Studies). For the HRS, AHEAD, EBB and MBB cohorts, Black and Hispanic
respondents were oversampled at a rate of about 2 to 1. To achieve these oversamples,
geographic areas (segments) with higher than average concentrations of minority population
(10+% Black, 10+% Hispanic, or 10+% Black and 10+% Hispanic) were selected at higher
sampling rates. In addition, in those areas, all Black and Hispanic age-eligible sample members
(and their spouses) were selected into the sample, whereas non-minority sample members were
subsampled at a rate of about 50%. The original 1992 screen that generated the HRS, AHEAD
and War Baby cohorts contained an oversample of Florida residents. (See Heeringa and Connor,
1995 for a detailed description of the sample design for the original HRS cohort; and Heeringa,
1995 for a description of the sample design for the AHEAD cohort.)
The implication of the multi-stage, stratified design is that different sample units (both
households and individuals) had differential probabilities of being selected into the sample. The
sample weights account for these differential selection probabilities.
HRS provides both household and respondent-level sample weights for each wave of the survey.
The sample weights are constructed in a way to make the HRS weighted sample representative
of all US households containing at least one person in the age-eligible range (in the case of
household weights) or of all non-institutionalized individuals in the US population in the age-
eligible range.
The baseline sample weight is a composite of two factors. The first factor is the inverse of the
probability of selection for the housing unit (for household weights), and for the individual (for
respondent weights). The second factor is a post-stratification factor that adjusts for differential
non-response to the baseline HRS survey. The post-stratification is based on the age of the
respondent and his/her spouse or partner (if coupled), gender, and race/ethnicity (Hispanic, Black
non-Hispanic, other non-Hispanic). The baseline sample weights are also adjusted for
geographic differences in baseline non-response (based on the Primary Sampling Unit or PSU).
Sample weights for followup waves are the product of the baseline sample weight and a non-
response adjustment factor that is based on post-stratification of the sample to the Current
Population Survey or American Community Survey for the survey year. Whereas the baseline
post-stratification adjusts for survey non-participation, the post-stratification adjustment in
followup waves adjusts for wave-specific non-response among those who participated at baseline.
For waves 1992-2004, the Current Population Survey (CPS) was used as reference survey for the

4
post-stratification. For the 2006 and subsequent waves, the American Community Survey (ACS)
has served as the basis for post-stratification.
Changes to the HRS Sample Weights
A. 1995 Respondent Weight
Our review of the full series of sample weights revealed a problem with the 1995 respondent
weight (for the AHEAD cohort). The weighted sample size for the 1995 AHEAD sample (born
in 1923 or earlier) was larger than the published population estimates based on the Current
Population Survey (see Table A1), and it was also out of line relative to the weighted sample
sizes for the 1993 and 1998 waves. We would expect some decline in the weighted sample size
in each subsequent wave due to mortality; however, as shown in Table A2, the 1995 weighted
sample was very close in size to the 1993 weighted sample. In contrast, as shown in Table A3,
the sum of the household weights showed the expected pattern of decline over the waves and the
1995 weighted HRS count matches the 1995 weighted CPS count very closely.
A detailed investigation of the 1995 sample weights revealed that the household weights were
calculated correctly. However the respondent weights were post-stratified to the 1993 CPS,
rather than to the 1995 CPS. As a result, the population counts used to adjust the HRS
respondent sample were too high, resulting in erroneously large sample weights.
The 1995 respondent sample weights have now been adjusted using the 1995 CPS as the post-
stratification source. The weighted counts and distributions for the old and new respondent
weights are given in Table A4. The original 1995 respondent weights overstated the size of the
community-dwelling population born in 1923 and earlier by 16%, and overstated the mean age
of that population by 0.07 years (78.90 vs. 78.83).
The original sample weights were too large for each of the four birth ranges as shown in the
ratios in the far right column, however the differential is most pronounced for the oldest two
birth cohorts, for which mortality is highest. Thus, the oldest-old (born in 1913 or earlier) will
be slightly overrepresented relative to those born between 1914 and 1923 in analyses based on
the original 1995 sample weights. The impact of this error in the original weights is likely to be
minimal for multivariate analyses that adjust for age; however, it could be more significant for
descriptive analyses, e.g., prevalence estimates for health conditions, that are not age-adjusted.
Also, analyses that present estimates of population counts for the AHEAD cohort based on 1995
data (e.g., the number of persons age 72 or over living with diabetes) will be over-estimated.
In revising the 1995 weights, we made use of the most recent information available on birth year
and other eligibility indicators for the HRS sample. This resulted in some changes in respondent
and household eligibility. The most significant change is that 55 respondents who had non-zero
values on the original respondent weights are not cohort eligible (they were born in 1924 or later)
and are, thus, assigned zero values on the revised respondent weights. Conversely, three
respondents who were assigned zero weights originally are now determined to be eligible and
have non-zero values on the revised weights. At the household level, five households changed

5
from eligible on the original weights to non-eligible (deceased) on the revised weights, and one
household changed from non-eligible to eligible.
B. 2004 Household and Respondent Weights
As noted in the sample design overview, Black and Hispanic households were oversampled in
the HRS, AHEAD, EBB, and MBB cohorts. These oversamples are achieved by oversampling
high density minority segments and subsampling (i.e., selecting only a random subset of) non-
minority households within those segments. The weights are designed to account for the
oversampling of minority respondents, along with other factors that lead to differential selection
probabilities.
Our review of the sample weights revealed that the original baseline sample weights for the EBB
cohort had not been adjusted to account for the subsampling of non-minority respondents in high
density minority areas—non-minority respondents were treated as if their selection probabilities
had been the same as minority respondents in those areas, whereas in fact they had only half the
probability of being included. The 2004 weights have now been corrected to account for this.
As expected, the main impact occurred for non-minority respondents in the EBB cohort. For
some of this subgroup (those living in areas of high minority densities) the original weights were
too small. Because the sample weights are generated for the entire sample concurrently, the
weights for other respondents also changed slightly. Correlations between the original and
revised weights, as well as comparisons on several key parameters are presented in Tables B1-
B4. Figures B1 and B2 plot the original and revised weights at the household and respondent-
level, respectively.
The corrections resulted in minor overall changes to the weights. The correction resulted in a
difference of less than 1 percent in the household weight for 63% of households and less than 5
percent for 83% of households. At the respondent level, the difference in the weights was less
than 1 percent for 65% of respondents and less than 5 percent for 86% of respondents.
We used the latest, most accurate information available on birth date and coupleness status to
generate the revised weights. As a result, eligibility changed for a small number of households
and respondents. Eight people in six HHs that were determined to be eligible when the original
2004 weights were calculated are now ineligible. At the respondent level, ten respondents that
were originally determined to be eligible are now known to be ineligible. The net result is six
fewer eligible households and ten fewer eligible respondents for the revised versus original
weights.
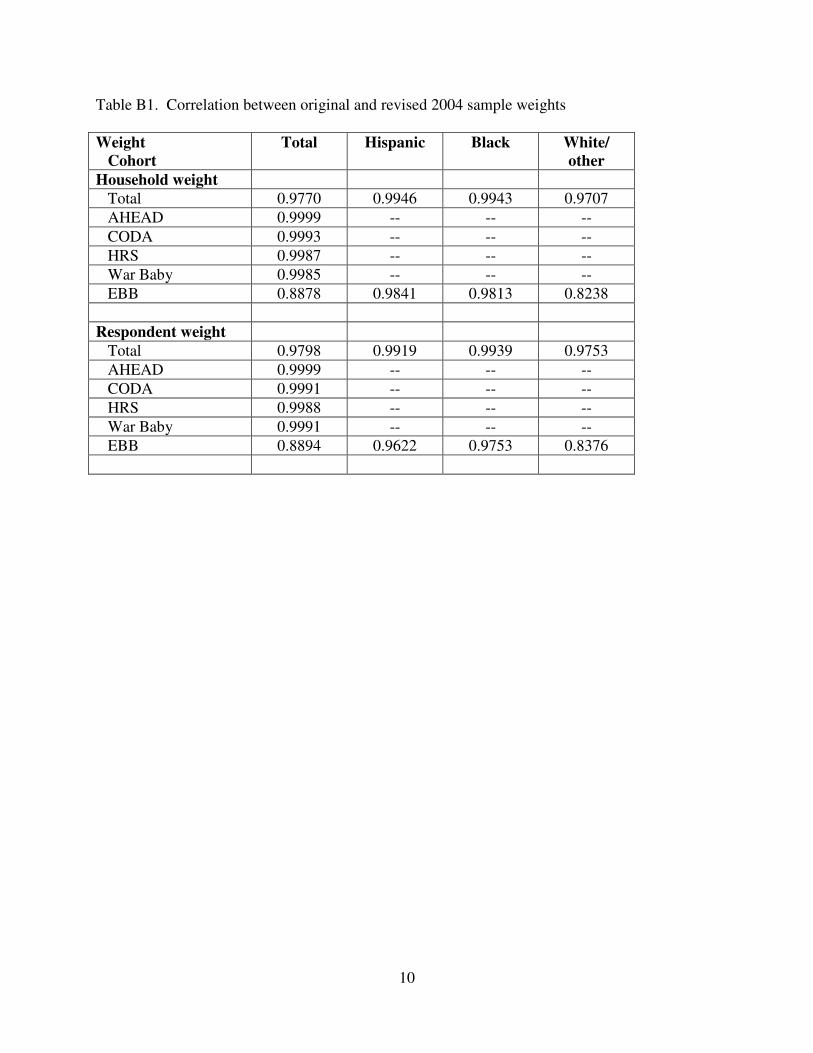
As shown in Table B1, the correlations between the original and revised weights are extremely
high. The lowest correlation is found for the EBB cohort, particularly those in the White/other
race/ethnicity group.
Tables B2 and B3 show the sample size, mean, median, variance, and coefficient of variation for
the original and revised weights, separately for the household weights (Table B2) and the
respondent weights (Table B3). These statistics are shown in total, by cohort and, for the EBB
cohort, by race and ethnicity.

6
There is very little shift in the distribution of the weights for all cohorts except the EBB cohort.
Even for the EBBs, the shift is fairly modest. The mean and median shift upwards slightly, and
the variance is reduced. Again, the distributional shift is more pronounced for the White/other
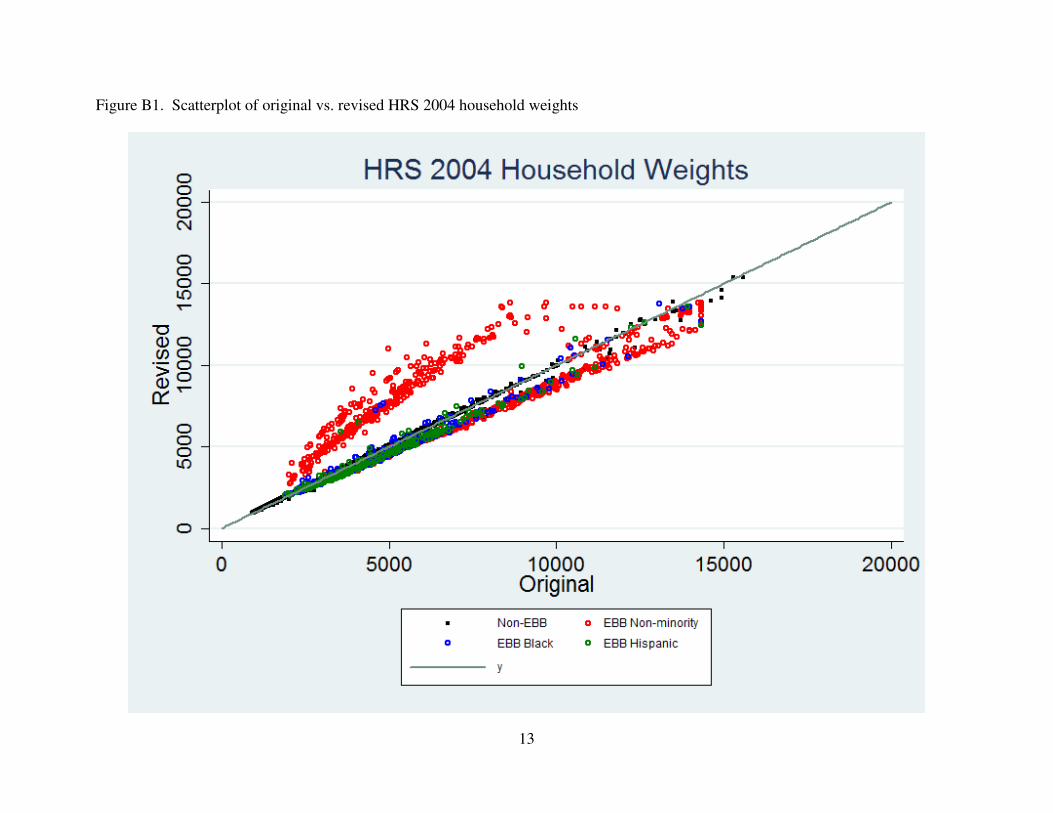
group in the EBB cohort. These patterns are further illustrated in Figures B1 and B2, which plot
the original weight against the revised weight at the household and individual level separately for
Black, Hispanic and non-minority EBBs and for non-EBBs. Black and Hispanic EBBs and non-
EBBs tend to cluster around the diagonal, indicating that the original and revised weights are
very close. It is only non-minority EBBs for which the cluster departs from the diagonal, and for
most of those cases, the revised weight is larger than the original weight. Even for this group,
however, the correlations between the original and revised household and respondent weights are
very high, as shown in Table B1.
A major concern for users will be what impact these changes have on the results of substantive
analyses that were based on the original weights. Tables B4-B5 provide some insight into this
issue. Table B4 presents weighted distributions and standard errors for key demographic, health,
and economic indicators for both the total 2004 sample and the EBB cohort, for which the
correction resulted in the largest change in weights.
As shown here, the distributions and standard errors based on the original and revised weights
are extremely close. The primary difference is found for the respondent-level race/ethnic
distribution for the EBB cohort, for which the weighted percent is slightly higher for the
White/other group and slightly lower for the two minority groups using the revised weight. This
difference is not statistically significant. Where the standard errors differ between the original
and revised weights, they tend to be slightly lower based on the revised weights.
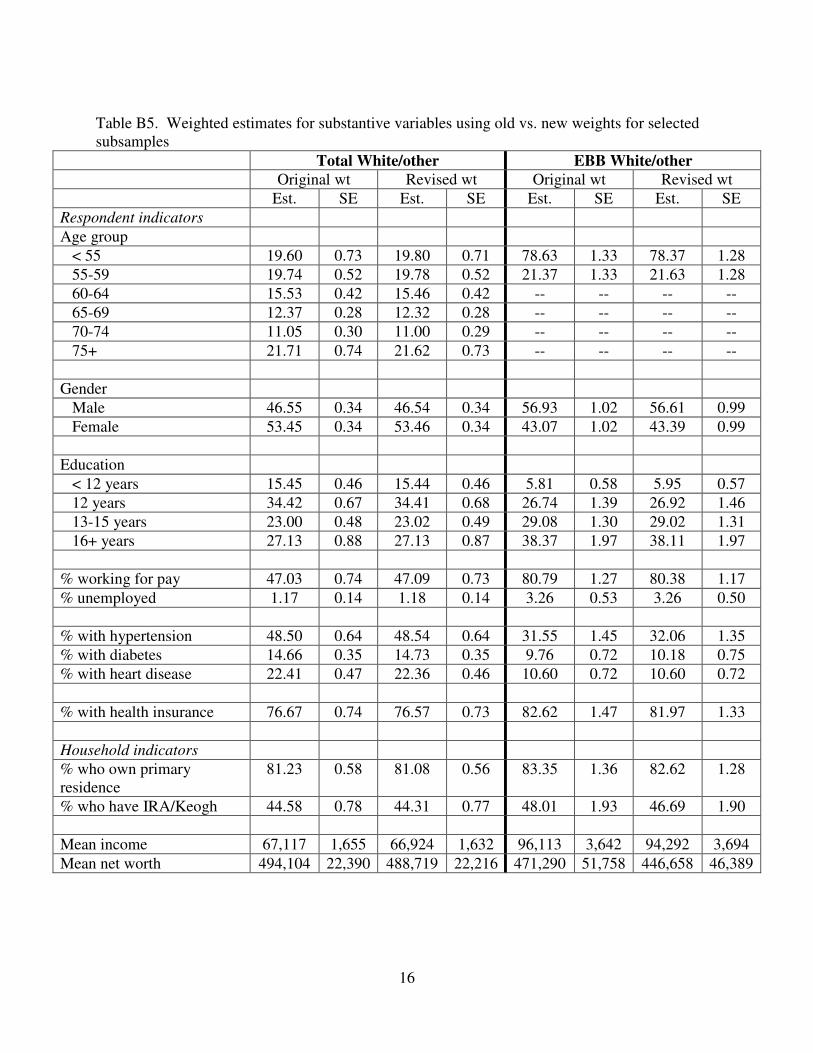
Table B5 presents distributions and standard errors for the same set of indicators for two
additional subgroups—first the total White/other sample and second for the EBB White/other
sample. The latter group is the group for which we would expect to see the largest differences.
For the total White/other sample in 2004, the distributions and means for all of the indicators are
very close. The same is true for most indicators for the White/other sample in the EBB cohort.
The percentages with health insurance coverage, home ownership and IRA/Keogh accounts and
the estimates of mean income and net worth are slightly lower based on the revised weight
compared to the original weight, but none of these differences are statistically significant. For
other indicators, the distributions are essentially identical.
Additional comparisons of research findings using the original versus revised weights based on
replications of published and unpublished studies are presented in Section F.
C. 2006 and 2008 Household and Respondent Weights
Because the baseline household weight is used as the starting point for generating sample
weights in each subsequent wave, the 2006 and 2008 weights were also affected by the error in
the 2004 EBB weights. We have updated and replaced all of these weights on the tracker file.

7
The impact on the 2006 and 2008 weights was even smaller than that for the 2004 weights.
Table C1 presents correlations between the original and revised weights. Correlations for the
total sample are 0.995 or higher for both waves, and within subgroups, the lowest correlation is
0.946. Correlations between the original and revised weights are high for the EBB cohort in
both waves.
As with the 2004 weights, eligibility changed for a small number of households and respondents
in 2006 and 2008.
D. 2006 ACS Revision and Impact on HRS Weights
As noted above, the Census Bureau determined that the way in which the age perturbation was
handled for several years of the Current Population Survey (CPS) and American Community
Survey (ACS) was incorrect and it led to a distortion in the sex ratios particularly at the older
ages. The Census Bureau has since released a new version of the 2006 ACS, which corrects for
the error. The Census Bureau determined that the error in the 2004 CPS data had minimal
impact on the data, however, and they opted not to release a new version of the 2004 CPS. The
new ACS data was used in the revision of the 2006 HRS weights. Analyses comparing the
sample weights based on the old and new ACS data showed that the change had very little
impact on the HRS weights. As shown in Table D1, the correlations between the weights using
the old and new ACS data are extremely high for all age and sex groups.
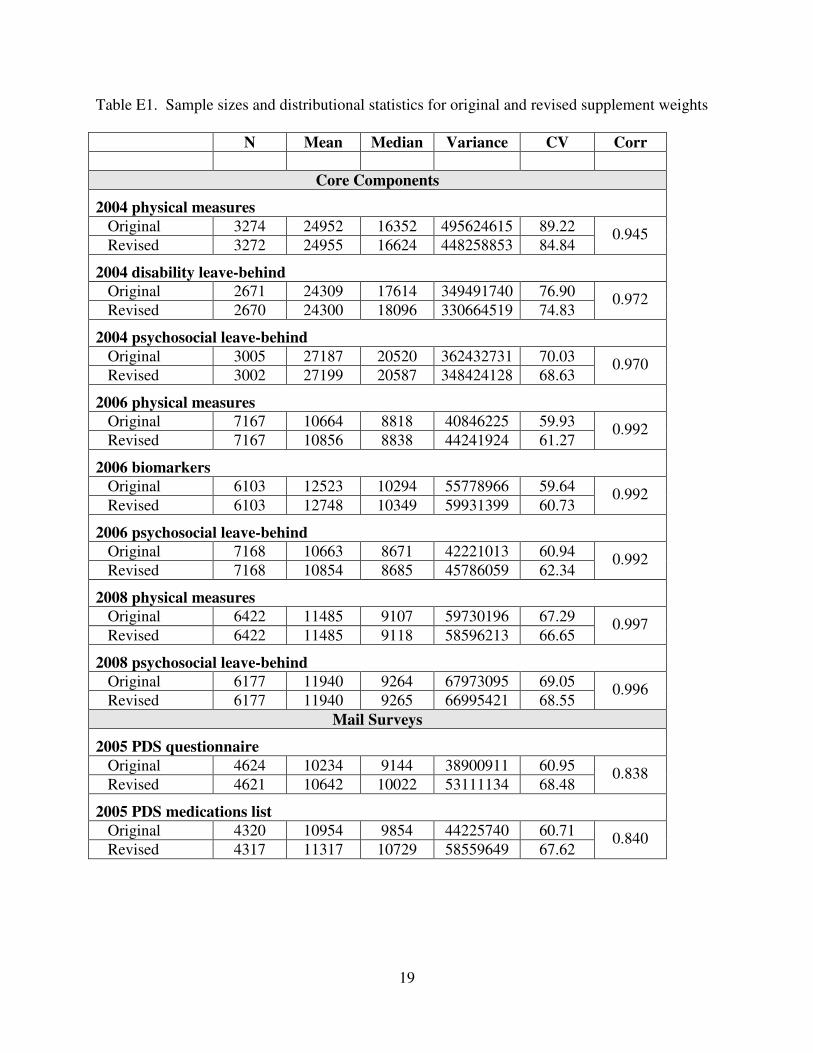
E. Revisions to Supplement Weights
Sample weights for the supplemental studies (mail and Internet surveys) and components of the
core survey (physical measures, biomarkers, leave-behind questionnaires) are based on the core
sample weights. As a result, any supplement weights that relied on core weights from 2004,
2006 and 2008 had to be revised. The revisions were made by first multiplying the original
supplement weight by the ratio of the revised to original core sample weight. This initial
adjustment scaled the supplement weight appropriately. The supplement weights were then post-
stratified to the weighted core sample (based on the revised core weights) from the prior core
wave. The post-stratification adjustment was based on age, gender and race/ethnicity.
The revisions to the supplement weights resulted in minor changes in the weights for most
respondents. Table E1 provides distributional statistics for the original and revised supplement
weights, along with correlations between the two weights.
F. Replication of Published and Unpublished Analyses
To further evaluate the impact of revisions to the sample weights, we are attempting to replicate
analyses that have been conducted by other researchers. Results from one replication of analyses
presented in a paper by Zivin et al. (2010) are provided in Tables F1 and F2. The paper is based
on respondents who participated in the 2005 Prescription Drug Study, a mail survey of a
subsample of HRS respondents. The analysis focused on medication non-adherence in this
sample (n=3,071). Tables F1 and F2 present odds-ratios and confidence intervals for regression
analyses based on the original and revised 2005 PDS weights. There are marginal changes in

8
significance around the p < .05 level for a few odds-ratios (in bold), but the revised weights do
not result in any changes to the substantive findings of the study.
A second replication is based on unpublished analyses of total assets conducted by Gretchen Lay
at the Univerisity of Michigan. Table F3 provides a comparison of mean assets by asset
percentile for the 2004, 2006 and 2008 waves based on the original and revised weights. The
impact of the revised weights on total assets is small overall, but there is some variation across
waves. The impact is larger for the 2004 asset distribution than for 2006 or 2008. In addition,
for 2004 the revised weights lead to slightly lower percentile estimations, whereas in 2006 and
2008 they lead to slightly higher percentile estimations.
Results from other replications will be added to this report as they become available. We
welcome any contributions from researchers who wish to replicate their own work.
References
Heeringa, Steven G., Technical Description of the Asset and Health Dynamics Among the Oldest
Old (AHEAD) Study Sample Design, [1995]
(http://hrsonline.isr.umich.edu/sitedocs/userg/AHDSAMP.pdf)
Heeringa, Steven G.; Connor, Judith, Technical Description of the Health and Retirement Study
Sample Design, [1995] (http://hrsonline.isr.umich.edu/sitedocs/userg/HRSSAMP.pdf)
Health and Retirement Study. 2006. “Getting Started with the Health and Retirement Study”
Version 1.0, C. Leacock (Ed.). Survey Research Center, University of Michigan.
(http://hrsonline.isr.umich.edu/sitedocs/dmgt/IntroUserGuide.pdf)
HRS website. 2011a. Sampling Weights: Revised for Tracker 2.0 and Beyond.
http://hrsonline.isr.umich.edu/sitedocs/wghtdoc.pdf (accessed April 25, 2011).
HRS website. 2011b. HRS Sample Evolution: 1992-1998.
http://hrsonline.isr.umich.edu/sitedocs/surveydesign.pdf (accessed April 25, 2011).
Zivin, K.; Ratliff, S.; Heisler, M. M.; Langa, K. M.; Piette, J. D. 2010 "Factors influencing cost-
related nonadherence to medication in older adults: A conceptually based approach," Value in
Health, 13:4, p338-345 [2010]

9
Table A1. Weighted samples sizes for persons born in 1923 or earlier: 1995 HRS vs. 1995 CPS
1995 HRS 1995 CPS
Birth range Weighted N Percent Weighted N Percent
Ratio HRS/
CPS
<=1923 22,248,170 100.0 19,219,159 100.0 1.16
<1909 2,510,034 11.3 2,149,321 11.2 1.17
1909-13 4,687,751 21.1 3,377,709 17.6 1.39
1914-18 6,197,476 27.8 5,542,565 28.8 1.12
1919-23 8,852,909 39.8 8,149,564 42.4 1.09
Table A2. Weighted sample sizes for the AHEAD cohort, 1993-2000
Weighted respondent counts
Birth range 1993 1995 1998 2000
<=1923 22,264,875 22,248,170 15,250,770 12,674,325
<1909 2,866,302 2,510,034 1,001,384 559,657
1909-13 4,433,396 4,687,751 2,378,348 1,850,112
1914-18 6,348,496 6,197,476 4,670,702 3,847,808
1919-23 8,616,681 8,852,909 7,200,336 6,416,748
Table A3. Weighted household sample for the AHEAD cohort: 1993-2000
Weighted household counts
Birth range 1993 1995 HRS 1998 2000 1995 CPS
<=1923 17,534,877 15,588,700 11,929,586 9,926,973 15,635,192
Table A4. Weighted respondent sample sizes and distributions for the AHEAD cohort based on
original vs. revised respondent sample weights.
Original weights Revised weights
Birth range Weighted N Percent Weighted N Percent
Ratio revised/
original
<=1923 22,248,170 100.0 19,220,715 100.0 0.86
<1909 2,510,034 11.3 1,961,110 10.2 0.78
1909-13 4,687,751 21.1 3,572,708 18.6 0.76
1914-18 6,197,476 27.8 5,642,589 29.4 0.91
1919-23 8,852,909 39.8 8,044,308 41.8 0.91
10
Table B1. Correlation between original and revised 2004 sample weights
Weight
Cohort
Total Hispanic Black White/
other
Household weight
Total 0.9770 0.9946 0.9943 0.9707
AHEAD 0.9999 -- -- --
CODA 0.9993 -- -- --
HRS 0.9987 -- -- --
War Baby 0.9985 -- -- --
EBB 0.8878 0.9841 0.9813 0.8238
Respondent weight
Total 0.9798 0.9919 0.9939 0.9753
AHEAD 0.9999 -- -- --
CODA 0.9991 -- -- --
HRS 0.9988 -- -- --
War Baby 0.9991 -- -- --
EBB 0.8894 0.9622 0.9753 0.8376

11
Table B2. Sample sizes and distributional statistics for original and revised 2004 household weights
N Mean Median Variance
Coeff var
(%)
Sum of
weights N Mean Median Variance
Coeff var
(%)
Sum of
weights
Original weights Revised weights
Total 13078 4406 3742 7517029 62.22 57624655 13072 4408 3751 7225680 60.98 57618170
Cohort
AHEAD 2440 3466 3557 2621457 46.71 8458145 2439 3466 3549 2570806 46.26 8454337
CODA 1236 4263 3745 2218608 34.94 5269396 1236 4262 3732 2162158 34.5 5267335
HRS 5854 3030 3083 1922313 45.75 17739325 5852 3022 3074 1837189 44.85 17685014
War Baby 1393 8685 8107 6339178 28.99 12098273 1393 8667 8076 5978524 28.21 12072636
EBB 2155 6524 5771 9590624 47.47 14059516 2152 6570 6112 8221210 43.64 14138848
Race/ethnicity
Hispanic 1353 3393 2483 6052941 72.51 4590776 1352 3385 2455 5982617 72.27 4576022
Black 2121 2993 2059 4662038 72.14 6348225 2118 2978 2099 4452711 70.86 6307637
Other 9604 4861 4012 7562370 56.57 46685654 9602 4867 4047 7204166 55.15 46734511
EBB sample
Hispanic 357 4603 3848 4841110 47.8 1643155 356 4434 3639 4747154 49.14 1578341
Black 424 4711 4339 4538559 45.22 1997353 422 4448 3966 4207025 46.11 1877101
Other 1374 7583 7329 9295103 40.21 10419008 1374 7775 7469 6340882 32.39 10683406

12
Table B3. Sample sizes and distributional statistics for original and revised 2004 respondent weights
N Mean Median Variance
Coeff var
(%)
Sum of
weights N Mean Median Variance
Coeff var
(%)
Sum of
weights
Original weights Revised weights
Total 18588 4395 3720 7542620 62.49 81691803 18578 4395 3739 7290354 61.43 81651345
Cohort
AHEAD 3006 3533 3614 2742186 46.87 10620486 3005 3534 3608 2701630 46.51 10618693
CODA 1722 3963 3057 2084519 36.43 6824051 1722 3961 3048 2038052 36.04 6820770
HRS 9012 3067 3169 18885430 44.77 27638321 9010 3060 3160 1812419 43.99 27572918
War Baby 2158 8647 8188 6345286 29.13 18659331 2156 8641 8162 6139088 28.67 18629891
EBB 2690 6673 5932 9771235 46.85 17949614 2685 6707 6239 8353964 43.09 18009073
Race/ethnicity
Hispanic 1724 3274 2328 5678564 72.77 5645161 1720 3256 2372 5591495 72.63 5599941
Black 2668 2941 2009 4418588 71.47 7846984 2664 2928 2048 4233431 70.28 7799452
Other 14193 4804 3966 7638467 57.53 68199658 14191 4809 3988 7337058 56.33 68251952
EBB sample
Hispanic 394 4571 3912 4465792 46.24 1800783 391 4366 3577 4350000 47.77 1707101
Black 475 4717 4442 3895929 41.85 2240344 473 4442 4026 3615657 42.81 2101099
Other 1821 7638 7530 9570377 40.50 13908487 1821 7798 7431 6747597 33.31 14200873
13
Figure B1. Scatterplot of original vs. revised HRS 2004 household weights

14
Figure B2. Scatterplot of original vs. revised HRS 2004 respondent weights

15
Table B4. Weighted estimates for substantive variables using old vs. new weights for total
sample and EBB cohort
Total sample EBB cohort
Original wt Revised wt Original wt Revised wt
Est. SE Est. SE Est. SE Est. SE
Respondent indicators
Age group
< 55 20.88 0.59 20.81 0.59 78.57 1.10 78.33 1.09
55-59 20.17 0.46 20.22 0.46 21.43 1.10 21.67 1.09
60-64 15.59 0.36 15.59 0.36 -- -- -- --
65-69 12.19 0.25 12.19 0.25 -- -- -- --
70-74 10.66 0.25 10.66 0.25 -- -- -- --
75+ 20.51 0.62 20.52 0.62 -- -- -- --
Gender
Male 45.92 0.31 45.93 0.31 55.39 0.88 55.29 0.86
Female 54.08 0.31 54.07 0.31 44.61 0.88 44.71 0.86
Race/ethnicity
Hispanic 6.90 0.82 6.84 0.81 9.94 2.02 9.39 1.84
Black 9.55 0.51 9.50 0.50 12.39 1.10 11.58 1.00
White/other 83.55 0.90 83.66 0.88 77.67 2.16 79.03 1.95
Education
< 12 years 20.12 0.73 20.12 0.72 11.36 1.39 11.09 1.29
12 years 32.89 0.56 32.89 0.56 26.08 1.13 26.24 1.19
13-15 years 22.31 0.45 22.31 0.46 28.69 1.13 28.71 1.14
16+ years 24.68 0.79 24.68 0.78 33.86 1.73 33.96 1.75
% working for pay 46.77 0.63 46.73 0.62 78.13 1.13 78.02 1.03
% unemployed 1.38 0.13 1.38 0.12 3.95 0.49 3.90 0.46
% with hypertension 50.07 0.53 50.13 0.53 34.77 1.13 34.92 1.08
% with diabetes 16.37 0.33 16.45 0.33 11.39 0.63 11.64 0.68
% with heart disease 72.02 0.83 21.66 0.41 10.61 0.61 10.58 0.61
% with health insurance 72.02 0.83 71.99 0.80 76.21 1.75 76.24 1.58
Household indicators
% who own primary
residence
77.43 0.60 77.40 0.59 76.75 1.30 76.76 1.28
% who have IRA/Keogh 39.28 0.79 39.10 0.78 40.22 1.76 39.75 1.73
Mean income 61,777 1,480 61,658 1,435 84,667 3,293 84,202 3,151
Mean net worth 427,145 19,422 423,379 19,210 386,357 40,793 373,560 37,289
16
Table B5. Weighted estimates for substantive variables using old vs. new weights for selected
subsamples
Total White/other EBB White/other
Original wt Revised wt Original wt Revised wt
Est. SE Est. SE Est. SE Est. SE
Respondent indicators
Age group
< 55 19.60 0.73 19.80 0.71 78.63 1.33 78.37 1.28
55-59 19.74 0.52 19.78 0.52 21.37 1.33 21.63 1.28
60-64 15.53 0.42 15.46 0.42 -- -- -- --
65-69 12.37 0.28 12.32 0.28 -- -- -- --
70-74 11.05 0.30 11.00 0.29 -- -- -- --
75+ 21.71 0.74 21.62 0.73 -- -- -- --
Gender
Male 46.55 0.34 46.54 0.34 56.93 1.02 56.61 0.99
Female 53.45 0.34 53.46 0.34 43.07 1.02 43.39 0.99
Education
< 12 years 15.45 0.46 15.44 0.46 5.81 0.58 5.95 0.57
12 years 34.42 0.67 34.41 0.68 26.74 1.39 26.92 1.46
13-15 years 23.00 0.48 23.02 0.49 29.08 1.30 29.02 1.31
16+ years 27.13 0.88 27.13 0.87 38.37 1.97 38.11 1.97
% working for pay 47.03 0.74 47.09 0.73 80.79 1.27 80.38 1.17
% unemployed 1.17 0.14 1.18 0.14 3.26 0.53 3.26 0.50
% with hypertension 48.50 0.64 48.54 0.64 31.55 1.45 32.06 1.35
% with diabetes 14.66 0.35 14.73 0.35 9.76 0.72 10.18 0.75
% with heart disease 22.41 0.47 22.36 0.46 10.60 0.72 10.60 0.72
% with health insurance 76.67 0.74 76.57 0.73 82.62 1.47 81.97 1.33
Household indicators
% who own primary
residence
81.23 0.58 81.08 0.56 83.35 1.36 82.62 1.28
% who have IRA/Keogh 44.58 0.78 44.31 0.77 48.01 1.93 46.69 1.90
Mean income 67,117 1,655 66,924 1,632 96,113 3,642 94,292 3,694
Mean net worth 494,104 22,390 488,719 22,216 471,290 51,758 446,658 46,389

17
Table C1. Correlation between original and revised 2006 and 2008 sample weights
Weight
Cohort
2006 2008
Household weight
Total sample 0.9958 0.9967
Cohort
AHEAD 0.9974 0.9983
CODA 0.9753 0.9878
HRS 0.9952 0.9974
War Baby 0.9679 0.9703
EBB 0.9996 0.9999
EBB cohort
Hispanic 0.9955 0.9999
Black 0.9996 0.9996
White/other 0.9999 1.0000
Respondent weight
Total sample 0.9910 0.9949
Cohort
AHEAD 0.9967 0.9982
CODA 0.9725 0.9903
HRS 0.9913 0.9960
War Baby 0.9461 0.9598
EBB 0.9923 0.9993
EBB cohort
Hispanic 0.9882 0.9996
Black 0.9907 0.9995
White/other 0.9901 0.9990

18
Table D1. Correlation between original and updated 2006 HRS sample weights
(update based on new 2006 ACS data)
Respondent
Age group
Household
Male Female
< 55 0.9999 0.9998 0.9999
55-59 0.9999 0.9999 0.9999
60-64 0.9999 0.9998 0.9999
65-69 0.9996 0.9995 0.9995
70-74 0.9990 0.9990 0.9990
75-79 0.9965 0.9975 0.9965
80-84 0.9982 0.9986 0.9982
85+ 0.9989 0.9995 0.9990
Total 0.9998 0.9968 0.9970
19
Table E1. Sample sizes and distributional statistics for original and revised supplement weights
N Mean Median Variance CV Corr
Core Components
2004 physical measures
Original 3274 24952 16352 495624615 89.22
Revised 3272 24955 16624 448258853 84.84 0.945
2004 disability leave-behind
Original 2671 24309 17614 349491740 76.90
Revised 2670 24300 18096 330664519 74.83 0.972
2004 psychosocial leave-behind
Original 3005 27187 20520 362432731 70.03
Revised 3002 27199 20587 348424128 68.63 0.970
2006 physical measures
Original 7167 10664 8818 40846225 59.93
Revised 7167 10856 8838 44241924 61.27 0.992
2006 biomarkers
Original 6103 12523 10294 55778966 59.64
Revised 6103 12748 10349 59931399 60.73 0.992
2006 psychosocial leave-behind
Original 7168 10663 8671 42221013 60.94
Revised 7168 10854 8685 45786059 62.34 0.992
2008 physical measures
Original 6422 11485 9107 59730196 67.29
Revised 6422 11485 9118 58596213 66.65 0.997
2008 psychosocial leave-behind
Original 6177 11940 9264 67973095 69.05
Revised 6177 11940 9265 66995421 68.55 0.996
Mail Surveys
2005 PDS questionnaire
Original 4624 10234 9144 38900911 60.95
Revised 4621 10642 10022 53111134 68.48 0.838
2005 PDS medications list
Original 4320 10954 9854 44225740 60.71
Revised 4317 11317 10729 58559649 67.62 0.840

20
Table F1. Cost-related medication nonadherence regression analyses with original and revised 2005 PDS questionnaire weights –
Model selection
Unadjusted models Full model Final model
Original Revised Original Revised Original Revised
OR 95% CI OR 95% CI OR 95% CI OR 95% CI OR 95% CI OR 95% CI
Financial characteristics
$20.01-$50.00 1.45 1.07-1.96 1.58 1.15-2.16 1.56 1.12-2.17 1.71 1.20-2.43 1.61 1.16-2.22 1.74 1.23-2.44
OOP Rx cost per month (ref $0.00-
$20.00) $50.01-$110.00 2.28 1.57-3.30 2.59 1.73-3.87 2.29 1.42-3.70 2.50 1.49-4.21 2.40 1.61-3.58 2.63 1.68-4.13
≥$110.01 4.13 3.09-5.53 4.65 3.40-6.36 4.38 2.95-6.50 4.83 3.22-7.24 4.74 3.56-6.30 5.04 3.62-7.01
$580.01-$1,792.50 1.04 0.77-1.39 1.02 0.73-1.41 1.07 0.74-1.55 1.05 0.68-1.63
Other OOP medical costs (ref $0.00-
$580.00) $1792.51-$4,570.00 1.27 0.97-1.67 1.33 0.99-1.79 1.05 0.74-1.50 1.12 0.74-1.68
≥$4,570.01 2.03 1.50-2.75 2.12 1.55-2.89 1.16 0.75-1.80 1.15 0.75-1.79
Net worth (ref ≤ $38,000.00) $38,000.01-$154,500.00 0.89 0.67-1.18 0.87 0.63-1.20 0.88 0.64-1.21 0.85 0.58-1.25 0.80 0.58-1.09 0.81 0.56-1.16
$154,500.01-$425,000.00 0.56 0.43-0.73 0.56 0.42-0.74 0.60 0.42-0.88 0.60 0.40-0.90 0.52 0.37-0.72 0.55 0.38-0.79
≥$425,000.01 0.30 0.21-0.43 0.30 0.21-0.45 0.40 0.26-0.59 0.39 0.24-0.63 0.28 0.18-0.43 0.31 0.19-0.50
$14,042.12-$25,660.00 0.97 0.73-1.28 0.95 0.71-1.26 0.97 0.67-1.40 0.93 0.62-1.40
Total household income (ref $0.00-
$14,042.11) $25,660.01-$48,384.00 0.69 0.52-0.90 0.66 0.49-0.87 0.92 0.63-1.33 0.87 0.58-1.31
≥$48,384.01 0.42 0.28-0.62 0.42 0.28-0.64 0.65 0.40-1.06 0.64 0.38-1.08
Any drug coverage (ref no) Yes 0.59 0.44-0.79 0.59 0.43-0.81 0.77 0.54-1.09 0.75 0.51-1.11
Demographic characteristics
Age (ref 65-74) 75-84 0.80 0.61-1.04 0.82 0.61-1.10 0.69 0.51-0.94 0.69 0.50-0.96 0.71 0.54-0.94 0.75 0.56-1.01
≥85 0.52 0.35-0.77 0.55 0.36-0.84 0.36 0.21-0.63 0.37 0.21-0.68 0.38 0.25-0.58 0.41 0.25-0.67
Gender (ref male) Female 1.86 1.50-2.30 1.89 1.50-2.37 1.47 1.12-1.94 1.41 1.05-1.90 1.51 1.16-1.96 1.60 1.20-2.12
Education (ref high school grad or less) At least some college 0.59 0.49-0.71 0.61 0.51-0.73 0.86 0.67-1.12 0.90 0.67-1.19
Job status (ref working) Not working 1.10 0.72-1.69 1.14 0.74-1.76
Retired 1.06 0.74-1.51 1.05 0.73-1.49
Marital status (ref married) Never married 1.68 1.00-2.82 1.58 0.88-2.84 1.80 0.97-3.36 1.84 0.88-3.82
Separated/divorced 1.37 1.05-1.78 1.38 1.05-1.82 1.16 0.66-2.03 1.17 0.66-2.08
Widowed 1.37 1.07-1.76 1.44 1.12-1.87 1.07 0.73-1.58 1.13 0.73-1.75
Race (ref white) Black 1.71 1.24-2.36 1.63 1.17-2.29 1.15 0.76-1.73 1.19 0.72-1.95
Hispanic 1.78 0.79-4.01 1.68 0.71-3.95 0.67 0.17-2.60 0.66 0.16-2.62
Other 0.50 0.22-1.14 0.53 0.22-1.26 0.53 0.23-1.22 0.56 0.23-1.33
Lives alone (ref no) Yes 1.19 0.96-1.47 1.25 1.01-1.56 0.83 0.56-1.23 0.83 0.54-1.27
Child lives within 10 miles (ref no) Yes 1.24 1.00-1.54 1.26 1.02-1.56 1.06 0.83-1.35 1.07 0.84-1.38
Disease characteristics
Ever had high blood pressure (ref no) Yes 1.18 0.93-1.50 1.09 0.83-1.44 0.73 0.55-0.98 0.67 0.49-0.91 0.75 0.57-0.98 0.68 0.50-0.91
Ever had lung disease (ref no) Yes 2.03 1.50-2.74 2.29 1.67-3.14 1.51 1.08-2.12 1.67 1.14-2.44 1.48 1.10-1.98 1.67 1.21-2.31
Ever had stroke (ref no) Yes 0.86 0.63-1.18 0.79 0.56-1.12
Ever had arthritis (ref no) Yes 1.67 1.33-2.11 1.79 1.42-2.26 1.91 0.85-1.68 1.27 0.89-1.80
Ever had a psych disorder (ref no) Yes 2.03 1.59-2.59 2.20 1.69-2.85 1.10 0.78-1.53 1.24 0.88-1.74

21
Unadjusted models Full model Final model
Original Revised Original Revised Original Revised
OR 95% CI OR 95% CI OR 95% CI OR 95% CI OR 95% CI OR 95% CI
Ever had heart problems (ref no) Yes 1.01 0.83-1.23 1.02 0.84-1.25
Ever had diabetes (ref no) Yes 1.13 0.91-1.40 1.05 0.82-1.34
Ever had cancer (ref no) Yes 0.93 0.70-1.25 0.89 0.66-1.21
Self-rated health (ref poor) Excellent 0.31 0.18-0.53 0.30 0.17-0.53 1.28 0.58-2.82 1.32 0.56-3.10
Very good 0.37 0.26-0.54 0.36 0.24-0.52 1.08 0.63-1.84 1.15 0.64-2.06
Good 0.52 0.37-0.74 0.50 0.36-0.72 1.08 0.65-1.77 1.11 0.64-1.94
Fair 0.79 0.55-1.14 0.71 0.48-1.05 1.18 0.71-1.96 1.15 0.65-2.05
ADLs (ref 0) ≥1 1.58 1.29-1.93 1.53 1.22-1.92 0.96 0.65-1.42 0.94 0.60-1.46
IADLs (ref 0) ≥1 1.46 1.11-1.92 1.41 1.05-1.89 1.01 0.71-1.44 0.95 0.64-1.41
CES-D score (ref 0) 1-3 1.81 1.38-2.38 1.71 1.30-2.33 1.53 1.13-2.07 1.51 1.08-2.12 1.64 1.25-2.14 1.54 1.14-2.09
≥4 2.96 2.28-3.84 2.89 2.17-3.87 2.09 1.38-3.17 2.04 1.28-3.27 2.25 1.59-3.20 2.13 1.41-3.23
Cognitive impairment (ref no) Yes 1.15 0.72-1.84 1.09 0.68-1.77
Regimen complexity
# of monthly prescriptions (ref 0-2) 3-4 1.49 1.13-1.97 1.57 1.16-2.12 1.06 0.73-1.54 1.11 0.75-1.64
5-6 1.60 1.07-2.40 1.65 1.07-2.52 0.85 0.51-1.40 0.86 0.51-1.44
≥7 1.91 1.34-2.71 2.00 1.36-2.94 0.83 0.53-1.30 0.88 0.54-1.42
Medication characteristics
Adverse events (ref no) Yes 2.19 1.77-2.71 2.19 1.75-2.74 1.87 1.43-2.45 1.80 1.35-2.40 1.75 1.36-2.24 1.74 1.32-2.29
Clinician characteristics
Family/friend 1.44 1.11-1.86 1.30 0.98-1.73 1.37 0.99-1.91 1.29 0.91-1.81
Trust for insurance decisions (ref no
one) Professional 1.21 0.80-1.83 1.02 0.66-1.59 1.41 0.89-2.24 1.25 0.75-2.07
Source: Table 2
Zivin, K.; Ratliff, S.; Heisler, M. M.; Langa, K. M.; Piette, J. D., "Factors influencing cost-related nonadherence to medication in
older adults: A conceptually based approach," Value in Health, 13:4, p338-345 [2010]

22
Table F2. Cost-related medication nonadherence regression analyses with original and revised 2005 PDS questionnaire weights –
Individual items
Not fill Stop taking Skip doses
Previous Revised Previous Revised Previous Revised
OR 95% CI OR 95% CI OR 95% CI OR 95% CI OR 95% CI OR 95% CI
Financial characteristics
$20.01-$50.00 1.34 0.87-2.05 1.41 0.92-2.16 1.30 0.80-2.12 1.22 0.70-2.14 2.70 1.75-4.16 2.73 1.72-4.32
OOP Rx cost per month (ref $0.00-
$20.00) $50.01-$110.00 1.92 1.20-3.07 2.04 1.22-3.41 2.48 1.50-4.11 2.46 1.39-4.34 3.05 1.89-4.93 3.08 1.80-5.27
≥$110.01 3.06 2.03-4.62 3.41 2.24-5.21 3.55 2.26-5.59 3.53 2.10-5.93 8.37 5.38-13.04 7.96 4.94-12.8
Net worth (ref ≤ $38,000.00) $38,000.01-$154,500.00 0.82 0.60-1.14 0.78 0.53-1.15 0.86 0.55-1.35 0.83 0.48-1.42 0.73 0.51-1.05 0.68 0.46-1.01
$154,500.01-$425,000.00 0.54 0.37-0.80 0.54 0.36-0.83 0.51 0.34-0.77 0.51 0.31-0.82 0.46 0.30-0.71 0.47 0.29-0.75
≥$425,000.01 0.26 0.15-0.45 0.30 0.16-0.55 0.29 0.15-0.56 0.33 0.16-0.68 0.45 0.29-0.70 0.44 0.28-0.71
$14,042.12-$25,660.00 1.18 0.79-1.76 1.08 0.68-1.70
Total household income (ref $0.00-
$14,042.11) $25,660.01-$48,384.00 0.78 0.51-1.19 0.77 0.49-1.22
≥$48,384.01 0.51 0.30-0.88 0.48 0.27-0.86
Any drug coverage (ref no) Yes 0.64 0.48-0.85 0.69 0.51-0.94 0.55 0.39-0.78 0.59 0.41-0.86
Demographic characteristics
Age (ref 65-74) 75-84 0.69 0.51-0.94 0.74 0.52-1.06 0.63 0.45-0.87 0.64 0.45-0.90 0.67 0.51-0.89 0.73 0.55-0.98
≥85 0.38 0.25-0.58 0.42 0.27-0.65 0.48 0.31-0.74 0.54 0.34-0.86 0.35 0.20-0.59 0.39 0.21-0.71
Gender (ref male) Female 1.44 1.08-1.93 1.47 1.06-2.03
Disease characteristics
Ever had high blood pressure (ref no) Yes
Ever had lung disease (ref no) Yes 1.56 1.10-2.22 1.71 1.16-2.51
Ever had cancer (ref no) Yes 0.59 0.39-0.90 0.60 0.38-0.94
CES-D score (ref 0) 1-3 2.31 1.78-3.00 2.23 1.66-2.99 2.19 1.48-3.26 2.10 1.35-3.25 1.59 1.14-2.21 1.54 1.06-2.24
≥4 3.21 2.29-4.49 2.96 2.01-4.35 2.79 1.85-4.20 2.56 1.63-4.04 2.27 1.49-3.48 2.23 1.38-3.60
Medication characteristics
Adverse events (ref no) Yes 2.27 1.75-2.94 2.22 1.66-2.97 2.96 2.10-4.17 2.97 2.01-4.38
Source: Table 3
Zivin, K.; Ratliff, S.; Heisler, M. M.; Langa, K. M.; Piette, J. D., "Factors influencing cost-related nonadherence to medication in
older adults: A conceptually based approach," Value in Health, 13:4, p338-345 [2010]

23
Table F3. Mean total assets (including primary residence) by asset percentile: HRS 2004, 2006, 2008
2004 (51 and older) 2006 (53 and older) 2008 (55 and older)
Percentile Original Revised
Difference
(rev-orig) Original Revised
Difference
(rev-orig) Original Revised
Difference
(rev-orig)
1% -23,700 -23,000 700 -25,418 -25,000 418 -37,670 -37,670 0
5% 0 0 0 0 0 0 -350 -300 50
10% 1,000 1,000 0 613 700 87 500 500 0
25% 39,000 38,950 -50 40,100 40,250 150 40,300 41,000 700
50% 157,300 156,000 -1,300 188,000 188,000 0 187,000 187,000 0
75% 435,285 431,000 -4,285 509,000 511,679 2,679 527,000 530,000 3,000
90% 937,000 930,000 -7,000 1,118,000 1,123,700 5,700 1,107,000 1,108,000 1,000
95% 1,447,700 1,440,000 -7,700 1,736,000 1,739,000 3,000 1,757,645 1,759,212 1,567
99% 3,707,339 3,645,000 -62,339 4,753,000 4,871,365 118,365 4,700,000 4,708,000 8,000
Total 434,109 429,857 -4,252 547,922 548,713 791 513,005 514,089 1,084


![Dangc Pds 71 Pds Ngc Model700[1]](https://img.pdfslide.net/doc/110x75/577cc1111a28aba71192272d/dangc-pds-71-pds-ngc-model7001.jpg)