Embed Size (px)
Citation preview

Food Sci. Technol, Campinas, 37(2): 250-260, Apr.-June 2017250
ISSN 0101-2061 Food Science and Technology
DI:D http://dx.doi.org/10.1590/1678-457X.20916
1 IntroductionTropical and subtropical fruits usually possess strong and
pleasant aroma. Several studies have reported the analysis of volatile constituents of soursop fruit pulp (MacLeod & Pieris, 1981; Franco & Rodriguez-Amaya, 1983; Iwaoka et al., 1993; Wong & Khoo, 1993; Pelissier et al., 1994; Jirovetz et al., 1998; Augusto et al., 2000; Cheong et al., 2010, 2011; Cardozo et al., 2011, 2013). Solid-phase microextraction (SPME) technique was employed to capture volatile components from custard apple (Annona reticulata L.) pulp by Augusto et al. (2000) and they reported the presence of 21 volatile compounds mostly being esters.
Cheong et al. (2010) detected 118 volatile compounds in soursop using the CAR/PDMS fiber among which only 35 compounds were identified. In a later work, Cheong et al. (2011) reported the presence of 135 volatile compounds using the same coating of CAR/PDMS, however, only 37 compounds were identified from soursop. The main compounds detected in these studies were: methyl butanoate, methyl hexanoate, methyl (E)-2-butenoate and methyl (E)-2-hexenoate (Cheong et al., 2011).
Cardozo et al. (2011) evaluated the performance on capture of volatile compounds from soursop in two types of columns: the RTX-5 (non-polar column) in which they could
identify 21 volatile compounds while in FFAP (polar column), 27 compounds were identified with the use DVB/CAR/PDMS fiber. In a later work (Cardozo et al., 2013) undertaken with the use of RTX-5 column, the authors reported the presence of 28 volatile compounds in soursop in which the main compounds were ethyl acetate, 2-methy-4-pentanal and 3-hexenol.
SPME analysis allows a fast and very attractive extraction technique being easy to perform and it has an added advantage of direct application of analyte on to the GC column through thermal desorption whereby sample injection remains free of solvents and contaminants (Koziel & Novak, 2002; Vesely et al., 2003; Deng et al., 2014). Additionally, SPME provides speed and practicality on the analysis of authentic chemical constituents of fruit flavor (Kataoka et al., 2000).
It could be concluded from the published articles on soursop that there is very little work done in identifying the volatile compounds obtained from SPME of soursop fruit pulp. Thus, this study was designed to perform various experiments varying the extraction parameters such as use of different coatings of fiber, adsorption temperature, ionic strength and concentration of the pulp sample in order to obtain a large number of volatile compounds in extracts as well as to evaluate their effects on
HS-SPME optimization and extraction of volatile compounds from soursop (Annona muricata L.) pulp with emphasis on their characteristic impact compounds
Karen Leticia de SANTANA1, Mercia de Sousa GALVÃD1, Monica Silva de JESUS1, Juliete Pedreira NDGUEIRA1, Narendra NARAIN1*
a
Received 03 Aug., 2016 Accepted 01 Oct., 20161 Laboratory of Flavor and Chromatographic Analysis, Programa de Pós-graduação em Ciência e Tecnologia de Alimentos – PROCTA, Universidade Federal de Sergipe – UFS, São Cristóvão, SE, Brazil
*Corresponding author: [email protected]
AbstractAroma and taste are decisive factors in the selection of any food. The aim of this study was to extract the volatile compounds present in soursop (Annona muricata L.) pulp by Solid-phase microextraction (SPME) technique using 3 different fibers (DVB/CAR/ PDMS, CAR/PDMS and PDMS/DVB). An experimental design was set up to evaluate the best extraction conditions wherein the variables were adsorption temperature, ionic strength and pulp concentration. The separation of volatiles was performed in chromatographic columns of different polarity (polar and non-polar) while volatile compounds were identified by analysis in high resolution gas chromatography system coupled with mass spectrometry. The results obtained using 3 different fibers revealed the capture of about 40 compounds. The CAR/PDMS fiber was more efficient for the capture of esters and DVB/CAR/PDMS fiber for terpenes. The optimum conditions for capture of higher number of volatiles for polar column were 45 °C for extraction, 15% of ionic strength and 50% of pulp concentration which resulted in separation of 87 compounds. Among the principal character impact compounds from soursop are (E)-2-hexenoate, methyl hexenoate and linalool.
Keywords: Annona muricata; flavor; SPME; tropical fruits; volatile compounds.
Practical Application: The innovative nature of this work is that we have optimized the SPME conditions so as to capture a higher number of volatile compounds present in soursop pulp. There is no published work as yet on optimization of SPME conditions for soursop pulp. Thus if we need to monitor the aroma quality of soursop pulp, this work suggests the best conditions which should be followed for determination of volatile profile of this fruit.
Santana et al.
Food Sci. Technol, Campinas, 37(2): 250-260, Apr.-June 2017 251
capture of volatile compounds from soursop pulp so that the analytical conditions could be optimized for volatile constituents determination in soursop fruit pulp, having an emphasis of character impact compounds.
2 Materials and methods2.1 Fruit and chemical standards
Soursop (Annona muricata L.) fruits were purchased from the Central Market, situated in the city of Aracaju in the northeast region of Brazil. At the laboratory, the fruits were washed with chlorinated water (10 ppm of available chlorine), followed by washing in running water and later only ripe fruits were selected for this study. The pulp was extracted in a blender (Waring 70115, Model WF2211214) and stored in airtight containers at -18 °C and thawed at room temperature (28 ± 3 °C) before analysis.
The organic standard compounds positively identified in this study were purchased from Sigma/Aldrich (St. Louis, USA) (such as ethyl acetate, 3-hexen-1-ol, methyl butanoate, methyl 2-butenoate, methyl hexanoate, ethyl hexanoate, methyl octanoate, δ-limonene, linalool, 3-hexen-1-ol, pentanol, β-myrcene, β-caryophyllene, octanal, benzaldehyde and these were of pure grade (purity 99.9%) while the solvents utilized in this study were purchased from Merck (Brazil).
2.2 Sample preparation and SPME
The volatile components present in the pulp of ripe soursop fruit pulp were captured by SPME technique and separated by high resolution gas chromatography. Initially three different fibers - 85µM carboxen/polydimethylsiloxane (CAR/PDMS), 50/30µM divinyl benzene/carboxen/polydimethylsiloxane (DVB/CAR/PDMS)
and 65 µM polydimethylsiloxane/divinylbenzene (PDMS/DVB), were tested to analyze their performance in capturing volatiles from soursop pulp.
The extraction conditions used for the selection of fiber were according to Cheong et al. (2011). Before each extraction the vial was placed in a water bath (40 °C) under magnetic stirring for 10 min (equilibrium time). Later the SPME fiber was inserted in the headspace of the solution for adsorption of volatiles for 30 minutes. After this exposure, the fiber was removed and later introduced into the injector of gas chromatograph (Varian, Model 4000) for thermal desorption of volatiles for 7 minutes. The pH was not altered as it was the natural pH (4.1) of the fruit.
Based on the results, the fiber was selected based on a factorial design of 23 including 6 axial points and six repetitions at the central point amounting to a total of 20 experiments were performed. Table 1 presents the central composite design matrix which shows the coded and real values of different variables. The influence of adsorption temperature (minimum 28 °C, maximum 62 °C), amount of salt ionic strength (minimum 0, maximum 30.0%) and the concentration of the pulp (min 1, max 99.0%) on volatiles capture was evaluated .
2.3 GC-MS conditions
The separation was performed using a gas chromatography system (Varian Inc. Walnut Creek, California, USA) equipped with mass spectrometry (Model 4000). The chromatographic conditions were according to the methodology described earlier by Galvão (2011). Initial study on the selection of the fiber was conducted by using a non-polar column (VF-5ms). After optimization of analytical conditions, separations were performed
Table 1. Coded independent variables and their real values in the experimental design.
ExperimentNumber
Coded variables Real values
X1 X2 X3 Adsorption temperature (°C)
NaCl(%)
Pulp concentration (%)
1 –1 –1 –1 35 6 212 +1 –1 –1 55 6 213 –1 +1 –1 35 24 214 +1 +1 –1 55 24 215 –1 –1 +1 35 6 796 +1 –1 +1 55 6 797 –1 +1 +1 35 24 798 +1 +1 +1 55 24 799 –1.68 0 0 28 15 50
10 +1.68 0 0 62 15 5011 0 –1.68 0 45 0 5012 0 +1.68 0 45 30 5013 0 0 –1.68 45 15 114 0 0 +1.68 45 15 9915 0 0 0 45 15 5016 0 0 0 45 15 5017 0 0 0 45 15 5018 0 0 0 45 15 5019 0 0 0 45 15 5020 0 0 0 45 15 50
Volatiles compounds of soursop fruit
Food Sci. Technol, Campinas, 37(2): 250-260, Apr.-June 2017252
on two different columns: a Varian Factor Four Capillary VF-5ms analytical column (30 m x 0.25 mm i.d. x 0.25 mm film thickness; component: 5% diphenyl and 95% dimethylpolysiloxane) and CP-Wax52CB (30m x 0,25mm i.d. x 0,25μm film thickness; polyethylene glycol). The injector temperature was held at 220 °C. Helium (99.9999%) was used as a carrier gas at a flow rate of 1.0 mL/min. The mass spectrometer was operated in the electron ionization mode with an electrical energy of 70 eV and an ion source temperature of 250 °C. The mass spectrum was scanned between 33 and 550 amu at 0.3 s interval.
2.4 Compounds identification
The linear retention index (RI) values for unknowns were determined based on retention time data obtained by analyzing a series of normal alkanes (C8-C21). Volatile components were positively identified by matching their RI values and mass spectra with those of standards, also run under identical chromatographic conditions in the laboratory.
The identification was also based on matching an unknown mass spectrum with spectra available on the NIST (National Institute of Standards and Technology, USA) database, mass spectral data system or from the literature (Jennings & Shibamoto, 1980; Adams, 1995; Kondjoyan & Berdagué, 1996).
3 Results and discussion3.1 Fiber selection – preliminary study
Initial tests were conducted using 3 different fibers (50/30 μm DVB/CAR/PDMS, 85 μm CAR/PDMS and 65 μm PDMS/DVB) in SPME of soursop pulp so as to evaluate the performance and effectiveness of each fiber coating material on the headspace extraction efficiency of volatile flavor compounds. As shown in Figure 1, semi-polar fiber coatings (CAR/PDMS and DVB/CAR/PDMS) appeared to be more efficient in extracting the soursop volatile compounds compared to bipolar fiber coating (PDMS/DVB). In the present study, CAR/PDMS was chosen due to its higher extraction efficiency for priority class of esters present in soursop pulp. About 90% of compounds
captured by the fiber CAR/PDMS were esters, while the fibers DVB/CAR/PDMS and PDMS/DVB captured only 83 and 80% of this class, respectively. Roberts et al. (2000) reported CAR/PDMS fiber to be the most appropriate fiber coating to extract small molecules and acids. As soursop flavor is composed mainly of esters, the sensitivity of CAR/PDMS for smaller molecules, acids and non-polar compounds could enable the extraction of a wide range of volatile flavor compounds.
The use of 65 µM PDMS/DVB fiber permitted the extraction of only 35 volatile compounds when compared to that of 85 µM CAR/PDMS fiber in which 40 compounds were separated. This decrease could be expected as the amount of the coating of PDMS/DVB fiber results in a lower volume available for absorption of the analytes. Augusto et al. (2000) tested 4 different coatings (PDMS, CW/DVB, CAR/PDMS and PA) in fibers and reported that the most efficient fiber was PDMS which captured 16 compounds from soursop pulp while CAR/PDMS captured only 11 compounds. However, they also reported that the largest extraction capacity in area count and capture of lighter compounds such as ethyl acetate, 3-hexen-1-ol, ethyl butanoate, 1-butanol from soursop pulp was obtained by using CAR/PDMS fiber. Dur data in this work corroborates this conclusion. However, the fruit used in their work was custard apple (Anona reticulata L.) while this study was done with soursop (Annona muricata L.). Cheong et al. (2011) also recommended the CAR/PDMS fiber based on their extraction of esters and their signal intensity in work with soursop.
Soares et al. (2015) suggested the CAR/PDMS fiber, in general, for extraction of highly volatile compounds when compared to other coatings such as PDMS/DVB and DVB/CAR/PDMS.
All the work published on soursop volatile compounds reports the predominant class being esters followed by terpenes (MacLeod & Pieris, 1981; Franco & Rodriguez-Amaya, 1983; Iwaoka et al., 1993; Wong & Khoo, 1993; Jirovetz et al., 1998; Augusto et al., 2000; Cheong et al., 2010, 2011; Cardozo et al., 2011, 2013), except for Pelissier et al. (1994) who analyzed essential oil of soursop. CAR/PDMS fiber was the most efficient for capturing esters (90% area) which represent major class of volatile compounds present in soursop pulp and hence this fiber was selected to conduct further experiments.
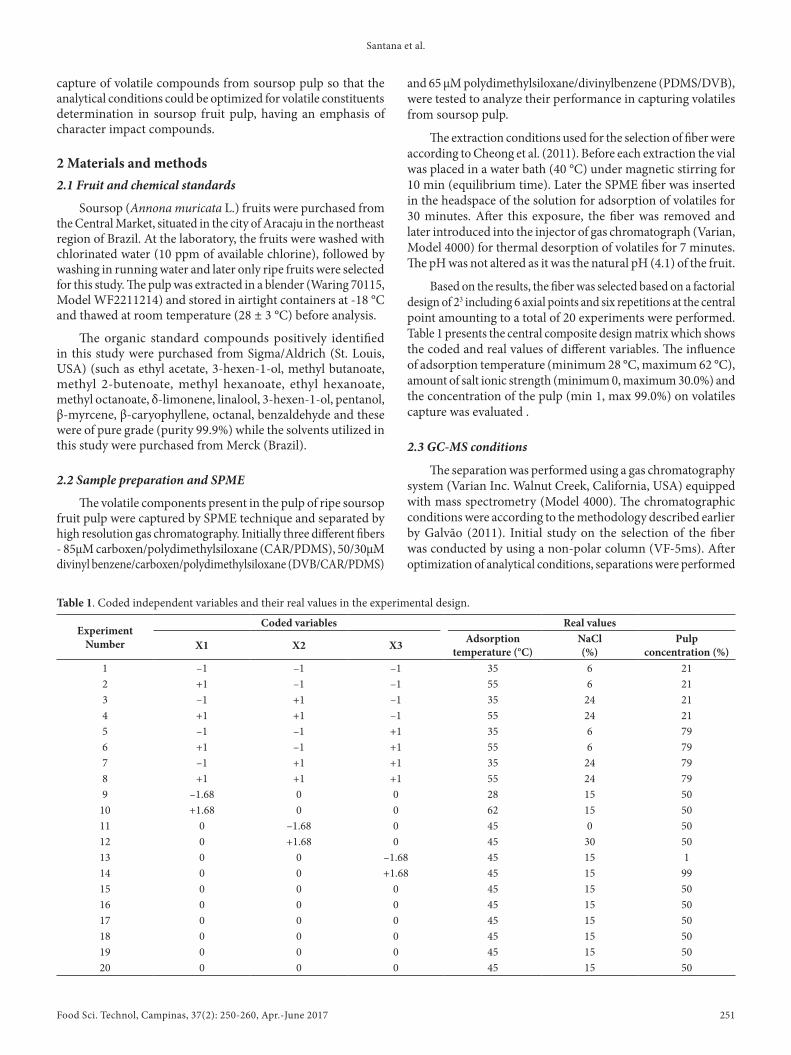
Table 2 presents data on volatile compounds identified in soursop pulp using SPME with different fibers while Figure 2 evaluates efficiency of different coatings on quantitative representation of several classes of organic compounds. Figure 3 shows the area obtained on volatiles capture using different fibers in SPME. The fibers DVB/CAR/PDMS, CAR/PDMS and PDMS/DVB captured 40, 40 and 35 compounds, respectively. The major classes of compounds were esters and terpenes. CAR/PDMS fiber was the most efficient fiber which resulted in higher total counts in the chromatogram as compared to the performance by other fibers (DVB/CAR/PDMS and PDMS/DVB) and hence this fiber was selected to conduct further experiments.
The identified compounds represent an area of more than 98% of the total area of the chromatogram which leads to conclude that most of the compounds present in soursop pulp could be separated and identified in this work. Figure 4 shows the profile
Figure 1. Effect of the SPME fiber coating on the extraction of the volatile compounds from soursop fruits.

Santana et al.
Food Sci. Technol, Campinas, 37(2): 250-260, Apr.-June 2017 253
Table 2. Volatiles compounds identified in soursop pulp captured by use of different fibers in SPME and separated by GC on non-polar column.
Compounds IRNon-polar
50/30 µm DVB/CAR/PDMS 85 µm CAR/PDMS 65 µm PDMS/DVB
Odor9
IR Area (%)* IR Area (%) IR Area (%)Alcohol(Z)-3-hexen-1-ol1,2,3,4,5,6,7,8 836 830 1.25 ± 0.19 830 0.75 ± 0.19 grassperillol 1289 1299 0.01 ± 0.00 1299 0.04 ± 0.00Sub-total 1.26 0.79Aldehydesacetaldehyde 400 <600 0.08 ± 0.013-hexenal3 771 778 0.57 ±0.09 781 1.06 ± 0.12 781 0.70 ± 0.08 leaf, greenSub-total 0.57 1.15 0.70Estersethyl acetate2,3,4,5 625 605 0.12 ± 0.06 587 0.07 ± 0.03 pineapplemethyl butanoate1,2,3,4,5,6,7,8 728 733 7.44 ± 1.28 733 7.97 ± 0.91 733 6.19 ± 0.05 ether, fruity,
sweetmethyl 2-butenoate3,4,5,6,7,8 755 758 7.75 ± 0.48 758 15.57 ± 0.61methyl pentanoate 806 799 0.34 ± 0.12 800 0.29 ± 0.12methyl (E)-2-pentenoate4 NE 844 0.80 ± 0.25 843 0.34 ± 0.01 844 0.37 ± 0.26methyl hexanoate1,2,3,4,5,6,7,8 905 899 32.28 ± 2.83 899 28.03 ± 3.26 899 33.27 ± 1.01 fruity, fresh,
sweetmethyl (Z)-3-hexenoate1,3,4,5,7 916 907 0.69 ± 0.20 907 1.01 ± 0.02 907 0.37 ± 0.05 grassmethyl (E)-2-hexenoate2,3,4,5,6,7,8 939 940 31.05 ± 0.79 940 30.17 ± 1.41 940 32.56 ± 0.50 ester, fruitymethyl 2-hexenoate1 949 955 0.55 ± 0.07 955 1.83 ± 0.25ethyl hexanoate1,2,3,4,5,6,7 980 973 0.59 ± 0.05 fruitymethyl 2-heptenoate NE 1039 0.07 ± 0.00 1039 0.12 ± 0.07 1039 0.04 ± 0.01methyl octanoate1,3,4,5,7 1105 1098 0.69 ± 0.08 1097 0.82 ± 0.04 1098 1.67 ± 0.27 orangemethyl (E)-2-octenoate1,2,3,4,5,6,7 1150 1141 2.01 ± 0.18 1141 1.98 ± 0.15 1141 4.84 ±0.59cis-3-hexenyl butanoate 1166 1158 0.04 ± 0.00 1158 0.04 ± 0.01 1158 0.09 ± 0.01ethyl benzoate 1185 1178 0.02 ± 0.01 1178 0.04 ± 0.01methyl cinnamate4 1365 1357 0.11 ± 0.02 1357 0.07 ± 0.01 1357 0.23 ± 0.03 strawberrySub-total 83.62 89.86 79.97Terpenesβ-myrcene 966 966 0.41 ± 0.16 balsamic,
must, spiceδ-limonene2,4,6,7 1002 1003 0.89 ± 0.13 1002 0.83 ± 0.32 1002 0.24 ± 0.01 citrus, mintcis-β-ocimene 1013 1010 0.17 ± 0.03 1010 0.18 ± 0.04 1010 0.04 ± 0.01α-ocimene 1023 1019 0.19 ± 0.04 1019 0.26 ± 0.19 1019 0.04 ± 0.01linalool2,3,4,5,6,7,8 1079 1071 8.70 ± 0.63 1070 4.35 ± 0.72 1071 11.90 ± 1.45 flower,
lavendercis-allo-ocimene 1115 1114 0.06 ± 0.01 1113 0.02 ± 0.01 1113 0.04 ± 0.02α-terpineol7 1195 1164 0.03 ± 0.00 1163 0.02 ± 0.00 1163 0.05 ± 0.02isocaryophyllene 1395 1395 0.05 ± 0.03 1395 0.03 ± 0.00 woodβ-selinene 1496 1497 0.02 ± 0.01 herb, spiceSub-total 10.53 5.72 12.35Othersstyrene1 863 865 0.11 ± 0.01 864 0.15 ± 0.13 balsamic,
gasolinep-dichlorobenzene 988 986 3.04 ± 0.03 986 2.49 ± 0.29 986 5.03 ± 0.93γ-hexalactone 1159 1060 0.05 ± 0.02 oil, anise,
mintbenzenepropanoic acid 1245 1249 0.02 ± 0.01Total 3.10 2.63 5.19*Values expressed as Means ± Standard Deviation; 1MacLeod & Pieris (1981) relates to Simultaneous Distillation and Extraction; 2Augusto et al. (2000) relates to SPME (CAR/PDMS); 3Cardozo et al. (2011) relates to SPME (DVB/CAR/PDMS); 4Cheong et al. (2011)relates to SPME (CAR/PDMS); 5Cardozo et al. (2013) relates to SPME (DVB/CAR/PDMS); 6Cheong et al. (2010) relates to SPME (CAR/PDMS); 7Jirovetz et al. (1998) relates to SDE; 8Iwaoka et al. (1993) relates to liquid-liquid extraction; 9Acree & Arn (2016) relates to characteristic odor of compounds.
Volatiles compounds of soursop fruit
Food Sci. Technol, Campinas, 37(2): 250-260, Apr.-June 2017254
of principal volatile compounds viz., methyl butanoate, methyl 2-butenoate, methyl hexanoate, methyl 2-hexenoate, methyl (E)-2-hexenoate, ethyl hexanoate, methyl octanoate, methyl (E)-2-octenoate present in soursop pulp. The presence of these compounds has been reported in earlier work on soursop in spite of the extraction technique being different than of SPME. Most of these compounds characterize fruity odor note and thus demonstrate their importance in character impact compounds for soursop.
3.2 Experimental design
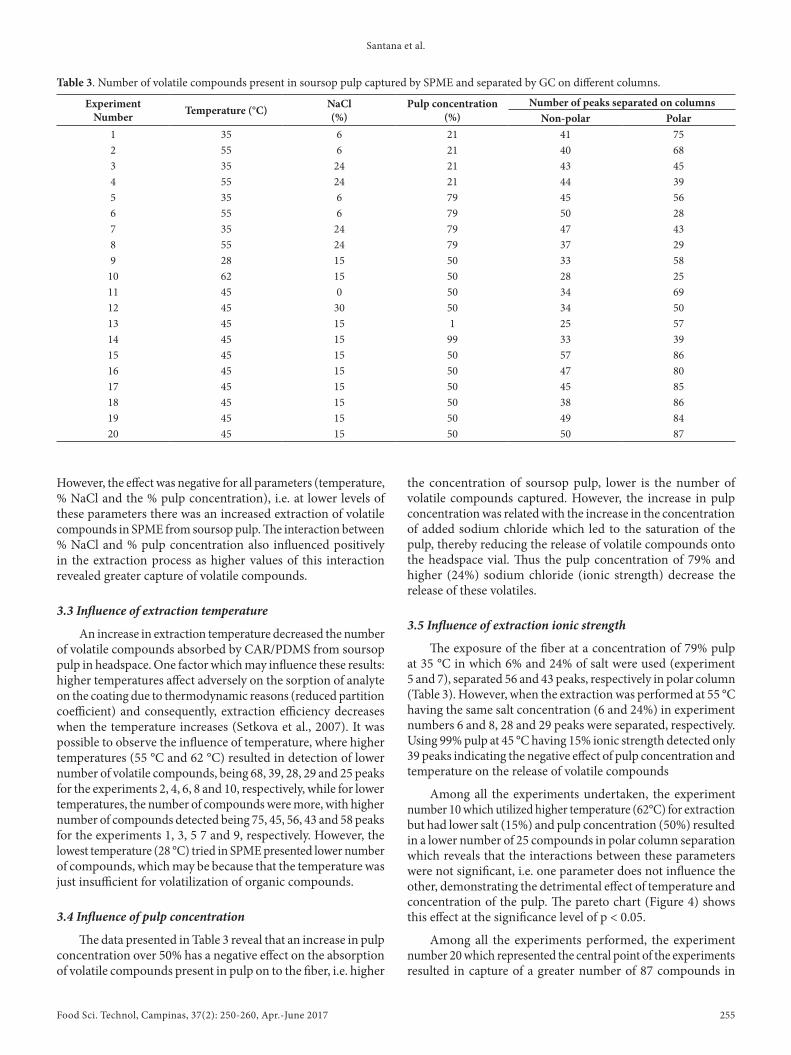
According to the experimental design (Table 1) which varied the key operational parameters (extraction temperature, % ionic strength and pulp concentration) in SPME, the data obtained on the number of peaks using the two columns (polar and non-polar) are assembled in Table 3.
After the selection of the CAR/PDMS fiber, a new experimental design was applied which focused on evaluation of the influence
of pulp concentration in the volatile composition of soursop pulp. In these experiments on soursop pulp, more number of peaks were observed under the same extraction conditions (45 °C, 15% NaCl and 50% of pulp concentration) for both the columns (polar and non-polar). However, large number of peaks was found in the experiment number 15 for the non-polar column (57 compounds) and in experiment number 20 for polar column (87 compounds), both these points being the central points of the planned experiments.
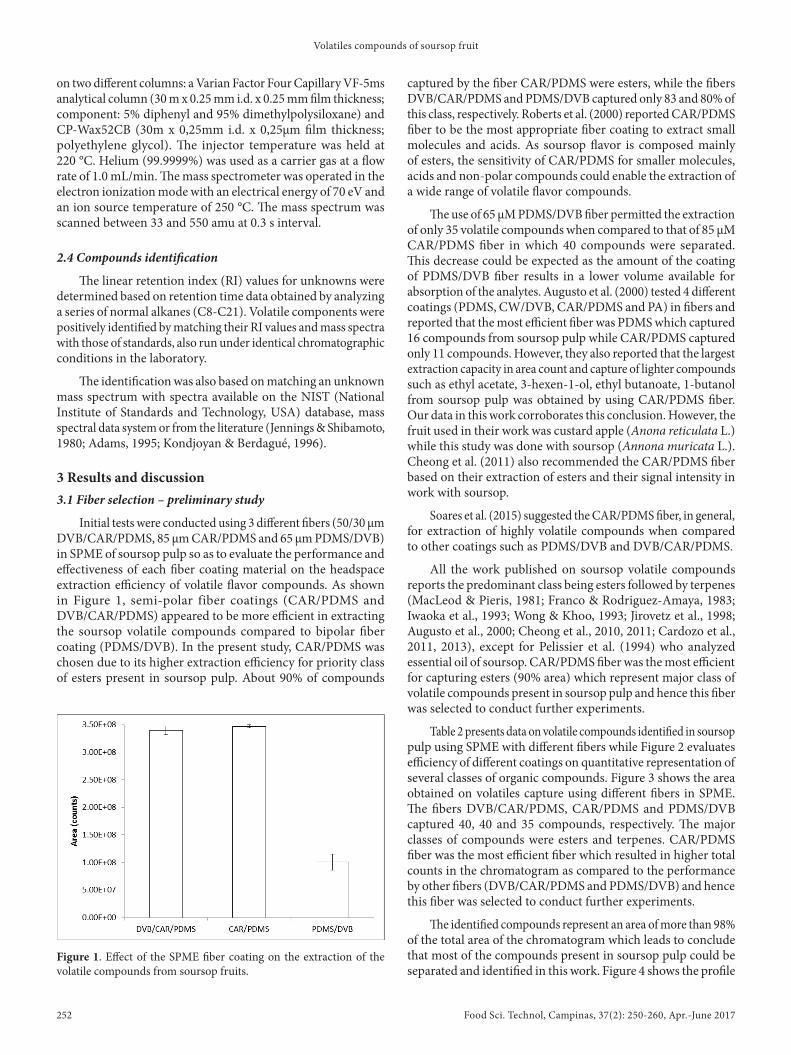
According to the results presented in Table 3, it is clear that for each column the results were quite different. For non-polar column the design did not differ significantly at the level of p < 0.05 and the results are independent of its variables and thus no significant effect arose for their responses, revealing the data in the experiment number 15 with the largest number of peaks (57). This observation could also be confirmed through the data processing by STATISTIC 6.0 program, wherein the values for the main effects and interactions area are shown (Figure 5).
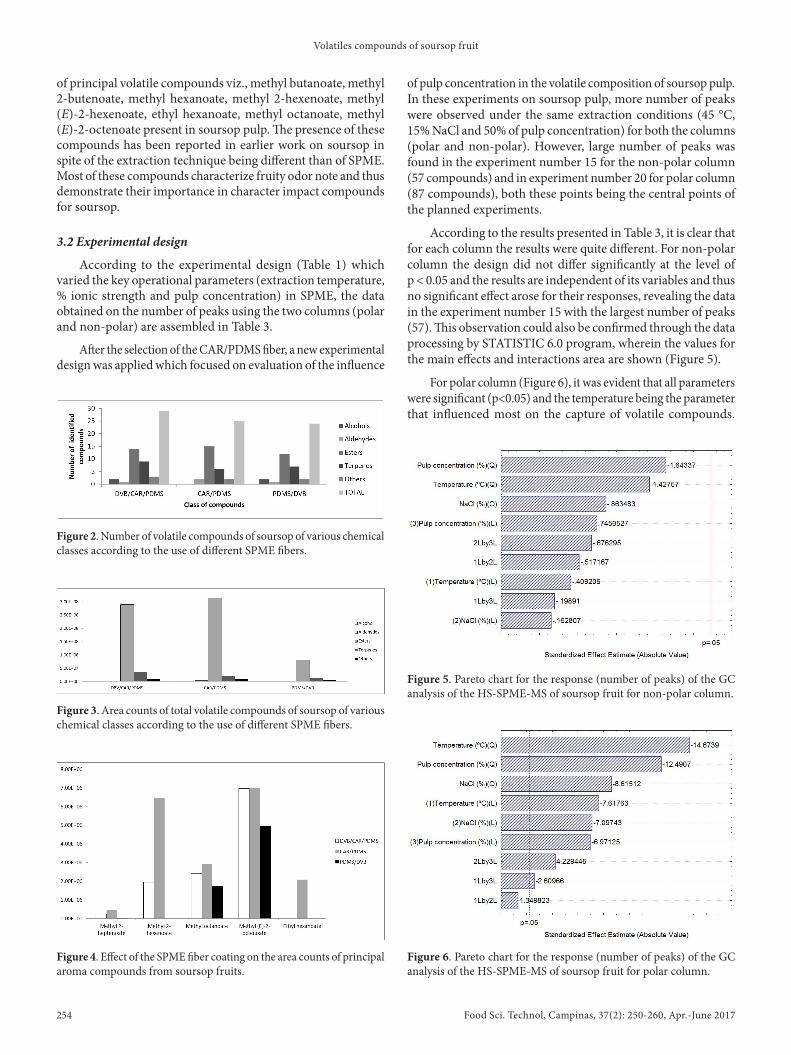
For polar column (Figure 6), it was evident that all parameters were significant (p<0.05) and the temperature being the parameter that influenced most on the capture of volatile compounds.
Figure 2. Number of volatile compounds of soursop of various chemical classes according to the use of different SPME fibers.
Figure 3. Area counts of total volatile compounds of soursop of various chemical classes according to the use of different SPME fibers.
Figure 4. Effect of the SPME fiber coating on the area counts of principal aroma compounds from soursop fruits.
Figure 5. Pareto chart for the response (number of peaks) of the GC analysis of the HS-SPME-MS of soursop fruit for non-polar column.
Figure 6. Pareto chart for the response (number of peaks) of the GC analysis of the HS-SPME-MS of soursop fruit for polar column.
Santana et al.
Food Sci. Technol, Campinas, 37(2): 250-260, Apr.-June 2017 255
However, the effect was negative for all parameters (temperature, % NaCl and the % pulp concentration), i.e. at lower levels of these parameters there was an increased extraction of volatile compounds in SPME from soursop pulp. The interaction between % NaCl and % pulp concentration also influenced positively in the extraction process as higher values of this interaction revealed greater capture of volatile compounds.
3.3 Influence of extraction temperature
An increase in extraction temperature decreased the number of volatile compounds absorbed by CAR/PDMS from soursop pulp in headspace. Dne factor which may influence these results: higher temperatures affect adversely on the sorption of analyte on the coating due to thermodynamic reasons (reduced partition coefficient) and consequently, extraction efficiency decreases when the temperature increases (Setkova et al., 2007). It was possible to observe the influence of temperature, where higher temperatures (55 °C and 62 °C) resulted in detection of lower number of volatile compounds, being 68, 39, 28, 29 and 25 peaks for the experiments 2, 4, 6, 8 and 10, respectively, while for lower temperatures, the number of compounds were more, with higher number of compounds detected being 75, 45, 56, 43 and 58 peaks for the experiments 1, 3, 5 7 and 9, respectively. However, the lowest temperature (28 °C) tried in SPME presented lower number of compounds, which may be because that the temperature was just insufficient for volatilization of organic compounds.
3.4 Influence of pulp concentration
The data presented in Table 3 reveal that an increase in pulp concentration over 50% has a negative effect on the absorption of volatile compounds present in pulp on to the fiber, i.e. higher
the concentration of soursop pulp, lower is the number of volatile compounds captured. However, the increase in pulp concentration was related with the increase in the concentration of added sodium chloride which led to the saturation of the pulp, thereby reducing the release of volatile compounds onto the headspace vial. Thus the pulp concentration of 79% and higher (24%) sodium chloride (ionic strength) decrease the release of these volatiles.
3.5 Influence of extraction ionic strength
The exposure of the fiber at a concentration of 79% pulp at 35 °C in which 6% and 24% of salt were used (experiment 5 and 7), separated 56 and 43 peaks, respectively in polar column (Table 3). However, when the extraction was performed at 55 °C having the same salt concentration (6 and 24%) in experiment numbers 6 and 8, 28 and 29 peaks were separated, respectively. Using 99% pulp at 45 °C having 15% ionic strength detected only 39 peaks indicating the negative effect of pulp concentration and temperature on the release of volatile compounds
Among all the experiments undertaken, the experiment number 10 which utilized higher temperature (62°C) for extraction but had lower salt (15%) and pulp concentration (50%) resulted in a lower number of 25 compounds in polar column separation which reveals that the interactions between these parameters were not significant, i.e. one parameter does not influence the other, demonstrating the detrimental effect of temperature and concentration of the pulp. The pareto chart (Figure 4) shows this effect at the significance level of p < 0.05.
Among all the experiments performed, the experiment number 20 which represented the central point of the experiments resulted in capture of a greater number of 87 compounds in
Table 3. Number of volatile compounds present in soursop pulp captured by SPME and separated by GC on different columns.
ExperimentNumber Temperature (°C) NaCl
(%)Pulp concentration
(%)Number of peaks separated on columns
Non-polar Polar1 35 6 21 41 752 55 6 21 40 683 35 24 21 43 454 55 24 21 44 395 35 6 79 45 566 55 6 79 50 287 35 24 79 47 438 55 24 79 37 299 28 15 50 33 58
10 62 15 50 28 2511 45 0 50 34 6912 45 30 50 34 5013 45 15 1 25 5714 45 15 99 33 3915 45 15 50 57 8616 45 15 50 47 8017 45 15 50 45 8518 45 15 50 38 8619 45 15 50 49 8420 45 15 50 50 87

Volatiles compounds of soursop fruit
Food Sci. Technol, Campinas, 37(2): 250-260, Apr.-June 2017256
polar column separation. Thus the best conditions (50% pulp; 15% NaCl; Temp. 45°C) for SPME technique, proven through this experimental design, were defined as the conditions of this experiment which had the maximum number of volatile compounds separated in gas chromatography system coupled to high resolution mass spectrometry.
The exposure time of the fiber in injector of gas chromatograph for desorption of analytes is also an important factor. This would be another variable worth analyzing, although, it is known that desorption occurs in a very short period of time. The fiber exposure time in the injector for all experiments was 7 min, which is much higher than required for desorption. In addition, interspersing between the chromatographic analysis, fiber inserts were held in GC injector in order to check the “memory effect” of the fiber, i.e., if a small amount of analyte was not desorbed and still retained which may interfere in the subsequent analyses. This phenomenon was not observed in any of the tests performed, concluding that the 7 min exposure time was good enough for complete desorption.
Thus the optimized SPME conditions in soursop pulp were: use of 50% pulp, addition of 15% sodium chloride and volatiles capture realized in vial containing 10 mL aliquot at 45 °C for 30 min using CAR/PDMS fiber and separation performed in GC using polar column.
3.6 Volatile compounds identification in different columns
The volatile compounds were considered positively identified when the retention index and the spectra were similar to those of the standard run under identical analytical conditions as well as matching of spectra reported in the literature (Kondjoyan &
Berdagué, 1996; Adams, 2001) or with data from the database (National Institute of Standards and Technology, 2016). It is worth noting that the variation in the retention index for identification purposes was limited to an average of ± 4 units.
Table 4 lists the volatile compounds captured from soursop pulp by SPME technique using the conditions of experiment number 15 and GC analysis done on non-polar column along with the results obtained from experiment number 20 wherein GC separation was done using a polar column. In addition to the data of retention index and area (%) of each compound presented in Table 4, the information also includes their respective organic classes. Moreover the superscript numbers used in the name of the compounds substantiate whether the presence of the compound had been reported earlier in soursop pulp or identification is being reported for the first time in this study. Figures 7 and 8 present the total ion chromatograms of volatiles from soursop pulp under SPME in experiments numbers 15 and 20 for GC separation on non-polar and polar column, respectively.
A total of 57 and 87 compounds from SPME of soursop pulp were separated on GC analysis using non-polar and polar column, respectively. Among the 57 compounds separated by using non-polar column, 46 were identified by comparing the spectrum and linear retention index data based on literature (Kondjoyan & Berdagué, 1996; Acree & Arn, 2016) while 11 compounds could not be identified although 6 of these had a very high retention index which characterize lower volatility. However, when a polar column was used in GC separation, 87 compounds were detected and 53 of these were identified by comparing their spectra and linear retention indices while 34 compounds could not be identified.
Figure 7. Total ion chromatogram of soursop fruit pulp by HS-SPME using non-polar column.

Santana et al.
Food Sci. Technol, Campinas, 37(2): 250-260, Apr.-June 2017 257
Among the identified compounds based on usage of non-polar column in GC separation, the main classes of compounds were esters which constituted 20 compounds representing 84.18% of total area, 15 terpenes (10.63%), 8 alcohols (3.18%) and 1 aldehyde (0.58%). In the case of polar column used for separation, the major compounds identified were 24 esters (79.11%), 15 terpenes (16.55%), 10 alcohols (2.31%) and 1 aldehyde (0.11%). The major organic compounds identified in soursop pulp using this column were methyl hexanoate (fruity, fresh, sweet odor) and methyl (E)-2-hexenoate (fruity odor), which represented about 60% area. The main difference in columns performance was that usage of polar column revealed a large number of esters and terpenes, which are very important in soursoap flavor fruits. Based on this comparison the decision to use a specific column for the analysis of soursop pulp should be made giving emphasis on characteristic impact compounds of soursop pulp.
The major compounds in relation to the area % in total ion chromatogram were the methyl (E)-2-hexenoate (31.45%), methyl hexanoate (30.56%), linalool (7.63%), methyl 2-butenoate (26.7%), methyl butanoate (7.14%) for separation in non-polar column, while for the polar column, the major compounds were methyl (E)-2-hexenoate (48.14%), methyl hexanoate (20.63%), α-copaene (6.19%), linalool (5.54%), ethyl acetate (3.12%), methyl cinnamate (2.14%). Ten compounds viz. pentyl butanoate, ethyl dodecanoate, isopropyl benzoate, phenyl butanoate, 3-hexenyl salicylate, dodecanol, tetradecanol, β-pinene, benzaldehyde and β-ionone were detected just in the analysis employing polar column, while only 4 compounds viz. methyl octadecanoate, γ-elemene, 3-hexenal and 3-hexadecanone were detected when separation was performed in non-polar column.
This study indicated that esters were the most abundant compounds in soursop pulp (Table 4). This observation is in agreement with previous studies on soursop pulp (MacLeod & Pieris, 1981; Iwaoka et al., 1993; Wong & Khoo, 1993; Pelissier et al., 1994; Jirovetz et al., 1998; Augusto et al., 2000; Cheong et al., 2010, 2011; Cardozo et al., 2011, 2013).
Wong & Khoo (1993) determined the volatile compounds present in soursop and identified compounds such as linalool, 1-hexanol and 2-pentanone to be of great importance from characteristic flavor point of view. Cardozo et al. (2011) reported the presence of (Z)-3-hexenol in ripe soursop pulp. The (Z)-3-hexenol possesses the characteristic odor of green note along with methyl hexanoate and methyl (E)-2-hexenoate which are main volatile compounds in ripe fruit while compounds such as ethyl acetate and methyl butanoate, may be characterized as responsible indicators for initiation of the fermentation and thus loss in sensory quality of the fresh fruit. It is worth noting that all these compounds were identified in our study.
The volatile chemical composition reported here is consistent with the data reported by others. MacLeod & Pieris (1981) found 80% of TIC area belonging to esters, and the main esters were methyl hexanoate (31%) and methyl 2-hexenoate (27%) from fruits harvested in Sri Lanka. Iwaoka et al. (1993) working with unripe soursop fruits grown in Hawaii found only 12 volatile compounds and reported high amount of (Z)-3-hexen-1-ol, whereas more ripe fruits had high levels of esters such as methyl (E)-2-hexenoate, methyl butanoate and methyl hexanoate.
Cheong et al. (2011) reported that compounds such as methyl butanoate, methyl hexanoate, methyl (E)-2-butenoate and methyl (E)-2-hexenoate were four main compounds responsible for taste
Figure 8. Total ion chromatogram of soursop fruit pulp by HS-SPME using polar column.

Volatiles compounds of soursop fruit
Food Sci. Technol, Campinas, 37(2): 250-260, Apr.-June 2017258
Table 4. Volatile compounds captured by SPME from soursop pulp and analyzed in GC-MS system using polar and non-polar columns.
CompoundsNon-polar Polar
Odor9
IR Area (%)* IR Área (%)*Estersethyl acetate2,3,4,5 604 0.12 ± 0.06 905 3.12 ± 0.16 pineapple-likemethyl butanoate1,2, 3, 4,5,6,7,8 733 7.14 ±1.28 978 1.17 ± 0.09 ether, fruity, sweetmethyl 2-butenoate3,4,5,6,7,8 758 7.26 ± 0.48 1100 0.29 ± 0.05 -methyl hexanoate1,2,3,4,5,6,7,8 899 30.56 ± 2.83 1190 20.63 ± 1.31 fruity, fresh, sweetmethyl (Z)-3-hexenoate1,3,4,5,7 907 0.70 ± 0.20 1284 0.13 ± 0.06 grassmethyl (E)-2-hexenoate2,3,4,5,6,7,8 940 31.45 ± 3.29 1302 48.14 ± 4.01 ester, fruityethyl hexanoate1,2,3,4,5,6,7 986 3.08 ± 0.03 1229 0.14 ± 0.03 fruitybutyl isobutanoate 990 0.13 ± 0.01 1150 1.13 ± 0.21 fresh, sweet, fruityIsopropyl hexanoate 1039 0.07 ± 0.01 1230 0.10 ± 0.02 freshmethyl octanoate1,3,4,5,7 1098 0.70 ± 0.08 1389 0.47 ± 0.08 orangemethyl (E)-2-octenoate1,2,3,4,5,6,7 1141 2.03 ± 0.18 1440 0.07 ± 0.03 -ethyl benzoate 1178 0.02 ± 0.01 1597 0.36 ± 0.02 chamomile, flower,
celery, fruitybutyl hexanoate 1249 0.02 ± 0.01 1544 0.06 ± 0.01 fruitymethyl cinnamate4 1357 0.11 ± 0.02 2011 2.14 ± 0.08 strawberryethyl decanoate 1395 0.05 ± 0.03 1675 0.10 ± 0.04 grapeethyl cinnamate 1420 0.12 ± 0.01 2084 0.07 ± 0.03 flower, honeymethyl tetradecanoate 1650 0.23 ± 0.01 1987 0.23 ± 0.09 orrisethyl tetradecanoate 1700 0.01 ± 0.01 2052 0.04 ± 0.02methyl hexadecanoate 1920 0.21 ± 0.01 2200 0.03 ± 0.01 waxymethyl octadecanoate 2049 0.17 ± 0.01 fatpentyl butanoate 1345 0.14 ± 0.09 pineapple-likeethyl dodecanoate 1823 0.24 ± 0.06isopropyl benzoate 1921 0.13 ± 0.02phenyl butanoate 1938 0.12 ± 0.013-hexenyl salicylate 2226 0.06 ± 0.02Alcohols1-pentanol 766 0.19 ± 0.02 1170 0.38 ± 0.06 fruity(Z)-3-hexen-1-ol1,2,3,4,5,6,7,8 830 1.27 ± 0.19 1392 0.83 ± 0.06 grass2-hexenol4,6 844 0.81 ± 0.25 1212 0.19 ± 0.01 leaf, green, wine,
fruit2-heptanol4,6 984 0.56 ± 0.07 1316 0.06 ± 0.022-ethyl-1-hexanol 1035 0.06 ± 0.01 1487 0.26 ± 0.05 rose, green1-octanol 1079 0.24 ± 0.01 1452 0.09 ± 0.04 moss, nut,
mushroomisopulegol 1158 0.04 ± 0.01 1570 0.29 ± 0.02perillol 1299 0.01 ± 0.01 2003 0.05 ± 0.02 -dodecanol 2016 0.10 ± 0.04 soapy, waxytetradecanol 2149 0.06 ± 0.02 coconutTerpenesβ-myrcene2 966 0.42 ± 0.16 1159 0.85 ± 0.06 balsamic, must,
spiceδ-limonene2,4,6,7 1003 0.90 ± 0.13 1176 0.36 ± 0.01 citrus, mintcis-β-ocimene 1010 0.17 ± 0.03 1223 0.87 ± 0.12 sweet, herbα-ocimene 1019 0.19 ± 0.04 1255 0.16 ± 0.01 fruity, wet clothlinalool2,3,4,5,6,7,8 1071 7.63 ± 0.63 1506 5.54 ± 0.02 flower, lavendercis-allo-ocimene 1114 0.06 ± 0.01 1350 0.84 ± 0.05 herbα-terpineol7 1164 0.03 ± 0.00 1794 0.24 ± 0.06 -α-copaene 1379 0.04 ± 0.01 1462 6.19 ± 0.14 woody, spiceα-gurjunene 1409 0.12 ± 0.01 1741 0.03 ± 0.01 woody, balsamicβ-caryophyllene3,4,6,7 1419 0.17 ± 0.01 1594 0.10 ± 0.06 woody, spiceZ-β-farnesene1 1444 0.31 ± 0.01 1654 0.23 ± 0.01 citrus, green*Values expressed as Means ± Standard Deviation; 1MacLeod & Pieris (1981) relates to Simultaneous Distillation and Extraction; 2Augusto et al. (2000) relates to SPME (CAR/PDMS); 3Cardozo et al. (2011) relates to SPME (DVB/CAR/PDMS); 4Cheong et al. (2011) relates to SPME (CAR/PDMS); 5Cardozo et al. (2013) relates to SPME (DVB/CAR/PDMS); 6Cheong et al. (2010) relates to SPME (CAR/PDMS); 7Jirovetz et al. (1998) relates to SDE; 8Iwaoka et al. (1993) relates to liquid-liquid extraction; 9Acree & Arn (2016) relates to characteristic odor of compounds.

Santana et al.
Food Sci. Technol, Campinas, 37(2): 250-260, Apr.-June 2017 259
and aroma of soursop, and that in our study all these compounds were identified except that the compound methyl (E)-2-butenoate which could not be identified. Df the 21 volatile compounds identified by Augusto et al. (2000) working with custard apple (Annona reticulata L.) pulp reported the presence of esters such as ethyl acetate, butyl acetate and methyl 2-hexenoate which correlated well in our present study using soursop (Annona muricata, L.) pulp.
Jirovetz et al. (1998) reported the presence of compounds such as caryophyllene, limonene and linalool, which were also found in this study. Furfural and 2-dimethyl furfural identified in soursop pulp may have been formed by Amadori rearrangement of the reaction, the first involving carbonyl, usually reducing sugars and free amino groups (Yamaguchi et al., 1983).
4 ConclusionsAmong several fibers used in SPME, the results reveal that
the CAR/PDMS fiber was most efficient for the capture of esters from soursop pulp. The optimum SPME conditions were 45 °C for extraction, 15% of ionic strength and 50% of pulp concentration which resulted in a separation of 87 compounds on using polar column and 57 compounds when a non-polar column was used. The main compounds found in soursop fruit pulp were methyl (E)-2-hexenoate, methyl hexenoate and linalool. This detailed study optimizes the final extraction conditions of SPME on identification of a large number of volatile compounds from soursop fruit pulp.
AcknowledgementsAll authors gratefully acknowledge financial support received
from CNPq, Brazil vide research project Instituto Nacional de Ciência e Tecnologia de Frutos Tropicais in developing this work. Authors (K.L.S., M.S.G., J.P.N.) acknowledge and thank CAPES, Brazil for their fellowships.
ReferencesAcree, T. E., & Arn, H. (2016). Flavornet and human odor space. Retrieved
from http://www.flavornet.org/index.htmlAdams, R. P. (1995). Identification of essential oil components by gas
chromatography/mass spectrometry. Chicago: Allured Publishing Corporation.
Adams, R. P. (2001). Identification of essential oil components by gas chromatography/mass spectrometry (4th ed.). Chicago: Allured Publishing Corporation.
Augusto, F., Valente, A. L. P., Tada, E. S., & Rivellino, S. R. (2000). Screening of Brazilian fruit aromas using solid-phase microextraction–gas chromatography–mass spectrometry. Journal of Chromatography. A, 873(1), 117-127. PMid:10757290. http://dx.doi.org/10.1016/S0021-9673(99)01282-0.
Cardozo, C. J. M., Jimenez, A. M., Dsorio, C., & Cartagena, V. J. R. (2011). Volatile compounds during the ripening of colombian soursop (Annona muricata L. Cv. Elita). Vitae, 18, 245-250.
Cardozo, C. J. M., Valenzuela, J. R. C., & Londoño, G. A. C. (2013). Determination of soursop (Annona muricata L. cv. Elita) fruit volatiles during ripening by electronic nose and gas chromatography coupled to mass spectroscopy. Revista Facultad Nacional de Agronomía, 66, 7117-7128.
Cheong, K. W., Tan, C. P., Mirhosseini, H., Chin, S. T., & Man, C. (2011). Dptimization of equilibrium headspace analysis of volatile flavor compounds of Malaysian soursop (Annona muricata): Comprehensive two-dimensional gas chromatography time-of-flight mass spectrometry (GC×GC-TDFMS). Food Chemistry, 125(4), 1481-1489. http://dx.doi.org/10.1016/j.foodchem.2010.10.067.
Cheong, K. W., Tan, C. P., Mirhosseini, H., Hamid, N. S. A., Dsman, A., & Basri, M. (2010). Equilibrium headspace analysis of volatile flavor compounds extracted from soursop (Annona muricata) using solid-phase microextraction. Food Research International, 43(5), 1267-1276. http://dx.doi.org/10.1016/j.foodres.2010.03.001.
Deng, J., Yang, Y., Wang, X., & Luan, T. (2014). Strategies for coupling solid-phase microextraction with mass spectrometry, TrAC. Trends in Analytical Chemistry, 55, 55-67. http://dx.doi.org/10.1016/j.trac.2013.12.004.
Table 4. Continued...
CompoundsNon-polar Polar
Odor9
IR Area (%)* IR Área (%)*α-humulene 1456 0.34 ± 0.01 1611 0.37 ± 0.08 woodyγ-elemene7 1466 0.12 ± 0.01 green, woody, oilyα-guaiene 1471 0.11 ± 0.01 1810 0.57 ± 0.13 woody, balsamicβ-selinene 1497 0.02 ± 0.01 1719 0.15 ± 0.06 herb, spiceβ-pinene7 1039 0.05 ± 0.02 pine, resin,
turpentineAldehydes3-hexenal3 778 0.58 ± 0.12 leaf, greenbenzaldehyde 1518 0.61 ± 0.21 almond, burnt sugarSub-totalOthersγ-hexalactone 1060 0.05 ± 0.02 1887 0.04 ± 0.01 oily, anise, mint3-hexadecanona 1316 0.16 ± 0.01 -β-ionone 1905 0.07 ± 0.01 seaweed, violet,
flower, raspberry*Values expressed as Means ± Standard Deviation; 1MacLeod & Pieris (1981) relates to Simultaneous Distillation and Extraction; 2Augusto et al. (2000) relates to SPME (CAR/PDMS); 3Cardozo et al. (2011) relates to SPME (DVB/CAR/PDMS); 4Cheong et al. (2011) relates to SPME (CAR/PDMS); 5Cardozo et al. (2013) relates to SPME (DVB/CAR/PDMS); 6Cheong et al. (2010) relates to SPME (CAR/PDMS); 7Jirovetz et al. (1998) relates to SDE; 8Iwaoka et al. (1993) relates to liquid-liquid extraction; 9Acree & Arn (2016) relates to characteristic odor of compounds.

Volatiles compounds of soursop fruit
Food Sci. Technol, Campinas, 37(2): 250-260, Apr.-June 2017260
National Institute of Standards and Technology – NIST. (2016). NIST livro de química na Web. Retrieved from http://webbook.nist.gov/chemistry/
Pelissier, Y., Marion, C., Kone, D., Lamaty, G., Menut, C., & Bessiere, J. M. (1994). Volatile components of Annona muricata L. Journal of Essential Oil Research, 6(4), 411-414. http://dx.doi.org/10.1080/10412905.1994.9698410.
Roberts, D. D., Pollien, P., & Milo, C. (2000). Solid-phase microextraction method development for headspace analysis of volatile flavor compounds. Journal of Agricultural and Food Chemistry, 48(6), 2430-2437. PMid:10888563. http://dx.doi.org/10.1021/jf991116l.
Setkova, L., Risticevic, S., & Pawliszyn, J. (2007). Rapid headspace solid-phase microextraction-gas chromatographic-time-of-flight mass spectrometric method for qualitative profiling of ice wine volatile fraction I. Method development and optimization. Journal of Chromatography A, 1147(2), 213-223. PMid:17359985. http://dx.doi.org/10.1016/j.chroma.2007.02.058.
Soares, R. D., Welke, J. E., Nicolli, K. P., Zanus, M., Caramão, E. B., Manfroi, V., & Zini, C. A. (2015). Monitoring the evolution of volatile compounds using gas chromatography during the stages of production of Moscatel sparkling wine. Food Chemistry, 183, 291-304. PMid:25863638. http://dx.doi.org/10.1016/j.foodchem.2015.03.013.
Vesely, P., Lusk, L., Basarova, G., Seabrooks, J., & Ryder, D. (2003). Analysis of aldehydes in beer using solid-phase microextraction with on fiber derivatization and gas chromatography/mass spectrometry. Journal of Agricultural and Food Chemistry, 51(24), 6941-6944. PMid:14611150. http://dx.doi.org/10.1021/jf034410t.
Wong, K. C., & Khoo, K. H. (1993). Volatile components of Malaysian Annona fruits. Flavour and Fragrance Journal, 8(1), 5-10. http://dx.doi.org/10.1002/ffj.2730080103.
Yamaguchi, K., Nishimura, D., Toda, H., Mihara, S., & Shibamoto, T. (1983). Chemical studies on tropical fruits. In G. Charalambous & G. Inglett (Eds.), Instrumental analysis of foods: recent progress (Vol. 2, pp. 93-117). New York: Academic Press.
Franco, M. R. B., & Rodriguez-Amaya, D. B. (1983). Trapping of soursop (Annona muricata) juice volatiles on Porapak Q by suction. Journal of the Science of Food and Agriculture, 34(3), 293-299. http://dx.doi.org/10.1002/jsfa.2740340313.
Galvão, M. S. (2011). Volatile compounds and descriptive odor attributes in umbu (Spondias tuberosa) fruits during maturation. Food Research International, 44(7), 1919-1926. http://dx.doi.org/10.1016/j.foodres.2011.01.020.
Iwaoka, W. T., Zhang, X., Hamilton, R. A., Chia, C. L., & Tang, C. S. (1993). Identifying volatiles in soursop and comparing their changing profiles during ripening. HortScience, 28, 817-819.
Jennings, W. G., & Shibamoto, T. (1980). Qualitative analysis of flavor and fragrance volatiles by glass capillary gas chromatography. New York: Academic Press.
Jirovetz, L., Buchbauer, G., & Ngassoum, M. B. (1998). Essential oil compounds of the Annona muricata fresh fruit pulp from Cameroon. Journal of Agricultural and Food Chemistry, 46(9), 3719-3720. http://dx.doi.org/10.1021/jf980204n.
Kataoka, H., Lord, H., & Pawliszyn, J. (2000). Applications of solid-phase microextraction in food analysis. Journal of Chromatography A, 880(1-2), 35-62. PMid:10890509. http://dx.doi.org/10.1016/S0021-9673(00)00309-5.
Kondjoyan, N., & Berdagué, J. L. (1996). A compilation of relative retentive indices for analysis of aromatic compounds. Champanelle: Laboratóire Flaveur.
Koziel, A., & Novak, I. (2002). Sampling and sample-preparation strategies based on solid- phase microextraction for analysis of indoor air. TrAC Trends Analytical Chemistry, 21(12), 840-850. http://dx.doi.org/10.1016/S0165-9936(02)01204-9.
MacLeod, A. J., & Pieris, N. M. (1981). Volatile flavor components of soursop (Annona muricata). Journal of Agricultural and Food Chemistry, 29(3), 488-490. http://dx.doi.org/10.1021/jf00105a012.