Embed Size (px)
Citation preview

HSBC Bank Malta p.l.c. Annual Report and Accounts 2012

HSBC Bank Malta p.l.c. is a member of the HSBC Group, whose ultimate parent company is HSBC Holdings plc. Headquartered in London, HSBC Holdings plc is one of the largest banking and financial services organisations in the world. The HSBC Group’s international network comprises around 6,600 offices in 81 countries and territories in Europe, the Asia-Pacific region, the Americas, the Middle East and Africa.
The HSBC Group
HSBC Bank Malta p.l.c.Registered in Malta: number C3177Registered Office and Head Office: 116 Archbishop StreetValletta VLT 1444Malta Telephone: 356 2597 0000Customer Service: 356 2380 2380Facsimile: 356 2380 4923www.hsbc.com.mt
HSBC Holdings plcRegistered Office and Group Management Office:8 Canada SquareLondon E14 5HQUnited KingdomTelephone: 44 020 7991 8888Facsimile: 44 020 7992 4880www.hsbc.com

1
H S B C B A N K M A L T A P . L . C .
Contents
1
2 Chairman’s Statement
8 Chief Executive Officer’s Review
16 Board of Directors
18 Financial Review
20 Report of the Directors
24 Statement of Compliance with the Code of Principles of Good Corporate Governance
31 Remuneration Report
34 Directors’ Responsibilities Statement
35 Income Statements
36 Statements of Comprehensive Income
37 Statements of Financial Position
38 Statements of Changes in Equity
40 Statements of Cash Flows
41 Notes on the Financial Statements
102 Independent Auditors’ Report to the Members of HSBC Bank Malta p.l.c.
104 Group Income Statements and Statements of Comprehensive Income: Five-Year Comparison
105 Group Statements of Financial Position: Five-Year Comparison
106 Group Statements of Cash Flows: Five-Year Comparison
107 Group Accounting Ratios: Five-Year Comparison
108 Group Financial Highlights in US dollars
109 Branches and Offices

2
H S B C B A N K M A L T A P . L . C .
Chairman’s Statement
2
I am pleased to advise that 2012 was a good year for HSBC Bank Malta. The bank delivered a positive performance despite the challenges of the surrounding economic environment.
Results
Profit before taxation was §95m, an increase of 8% over prior year. All business lines contributed positively to the performance.
Profit attributable to shareholders increased by 7% to §62m. On the basis of these results, the Board is recommending a final gross ordinary dividend of 7.9 cent per share. Together with the interim gross dividend of 10.0 cent per share paid in August 2012, the total dividend for the year is 17.9 cent per share (11.6 cent net of tax).
The Board would like to thank the shareholders for their support during the year.
HSBC Bank Malta p.l.c. is a subsidiary of London-based HSBC Holdings plc, one of the world’s leading financial services organisations, and is the largest listed company on the Malta Stock Exchange with a market capitalisation of around §800m.
Strategy
In spite of the difficult external environment in 2012, the bank remained on course to deliver another phase of its four year strategic plan. The focus of the business is clear and revolves around assisting our customers and Malta to access broader global markets with faster growth, simplifying our business, improving the customer experience and driving greater organisational efficiency.
Bi pjaçir in˙abbar li s-sena 2012 kienet sena tajba ghal HSBC Bank Malta. Il-bank kiseb riΩultati poΩittivi minkejja l-isfidi li s-sitwazzjoni ekonomika ta’ madwarna ©abet mag˙ha.
RiΩultati
Il-profitt qabel it-taxxa kien ta’ §95m, Ωieda ta’ 8% fuq is-sena ta’ qabel. Il-linji kollha tan-negozju kkontribwew b’mod poΩittiv g˙al dan ir-riΩultat.
Il-qlig˙ tal-azzjonisti Ωdied b’7% g˙al §62m. IbbaΩat fuq dawn ir-riΩultati, il-Bord qieg˙ed jirrakkomanda dividend gross finali ta’ 7.9 çenteΩmi g˙al kull sehem. Flimkien mal-interim gross dividend ta’ 10.0 çenteΩmi g˙al kull sehem li t˙allas f’Awwissu 2012, id-dividend totali g˙as-sena huwa ta’ 17.9 çenteΩmu kull sehem (11.6 çenteΩmu wara li tnaqqas it-taxxa).
Il-Bord jixtieq jirringrazzja lill-azzjonisti g˙all-appo©© tag˙hom matul is-sena.
L-HSBC Bank Malta p.l.c. hija kumpanija sussidjarja tal-HSBC Holdings plc, li g˙andha l-baΩi tag˙ha Londra u li hija wa˙da mill-organizzazzjonijiet ewlenin ta’ servizzi finanzjarji fid-dinja. Hija wkoll l-akbar kumpanija kkwotata fil-BorΩa ta’ Malta, b’valur fis-suq ta’ madwar §800m.
Strate©ija
Minkejja d-diffikultajiet globali li kellna fl-2012, il-bank kompla miexi fid-direzzjoni li kellu biex iwettaq faΩi o˙ra fil-pjan strate©iku tieg˙u ta’ erba’ snin. Dan il-pjan g˙andu mira çara u jikkonçentra fuq l-assistenza li nag˙tu lill-klijenti u lil Malta biex jil˙qu swieq internazzjonali b’potenzjal akbar, u fuq il-˙tie©a li nissimplifikaw ix-xog˙ol tag˙na, noffru lill-klijent esperjenza aqwa, u na˙dmu g˙al aktar effiçjenza fl-organizzazzjoni tag˙na.

Over 70 HSBC employees participated in the annual HSBC Staff Triathlon to raise funds in aid of L-Istrina.
3
Our investment programme remains on target, with a comprehensive ATM renewal, branch refurbishment and systems upgrade initiative underway. The investments will allow the bank to build a state-of-the-art service proposition for our customers.
Values
While the world is a challenging place today and the financial services sector is subject to significant pressures and change, values are a key part of how we do business. A bank-wide values initiative has been rolled out throughout the organisation that members of the board, including myself, have attended. The trust of our customers, staff and regulators are of paramount importance. It is worth quoting Stuart Gulliver, the HSBC Group CEO, who recently said:
“Values are essential in the execution of our strategy. It’s important that we drive the profit and drive the share price, but we need to do so in an ethically and morally appropriate way”.
Corporate Sustainability
Corporate sustainability remains a core value for HSBC and one which is close to our hearts. As an organisation we firmly believe that our future prosperity and sustainability is dependent on the well-being of society in general. That is why during the year we have once again been very active in this area through the HSBC
Il-programm ta’ investiment tag˙na miexi kif ippjanat, b’xog˙ol g˙addej biex inda˙˙lu ATMs ©odda, ir-rinnovament tal-ferg˙at, u investimenti biex ikollna sistemi mill-a˙jar. B’dawn l-investimenti l-bank ikun jista’ jwassal lill-klijenti tieg˙u servizz tassew mill-aqwa.
Valuri
Id-dinja tal-lum tippreΩentalna çerti sfidi, u s-settur tas-servizzi finanzjarji huwa so©©ett g˙al pressjoni u ˙afna tibdil. F’dan l-ambjent il-valuri huma fattur ewlieni tal-mod kif a˙na mmexxu n-negozju tag˙na. Mal-bank kollu ©iet imnedija inizjattiva ta’ valuri, li g˙aliha attendew il-membri tal-bord, inkluΩ jien. G˙alina l-fiduçja tal-klijenti, tal-impjegati u tar-regolaturi hija ta’ importanza kbira. Ta’ min jikkwota dak li qal dan l-a˙˙ar is-CEO tal-Grupp HSBC Stuart Gulliver:
“Il-valuri huma essenzjali fl-eΩekuzzjoni tal-istrate©ija tag˙na. Huwa importanti li a˙na nkabbru l-profitt, u nΩidu l-prezz tal-ishma, imma dan irridu nag˙mluh b’mod li huwa etikament u moralment xieraq”.
Is-Sostenibilità Korporattiva
Is-sostenibilità korporattiva hija valur çentrali g˙all-HSBC, valur li hu verament g˙al qalbna. B˙ala organizzazzjoni nemmnu tassew li l-prosperità u s-sostenibilità tag˙na fil-futur jiddependu fuq il-©id
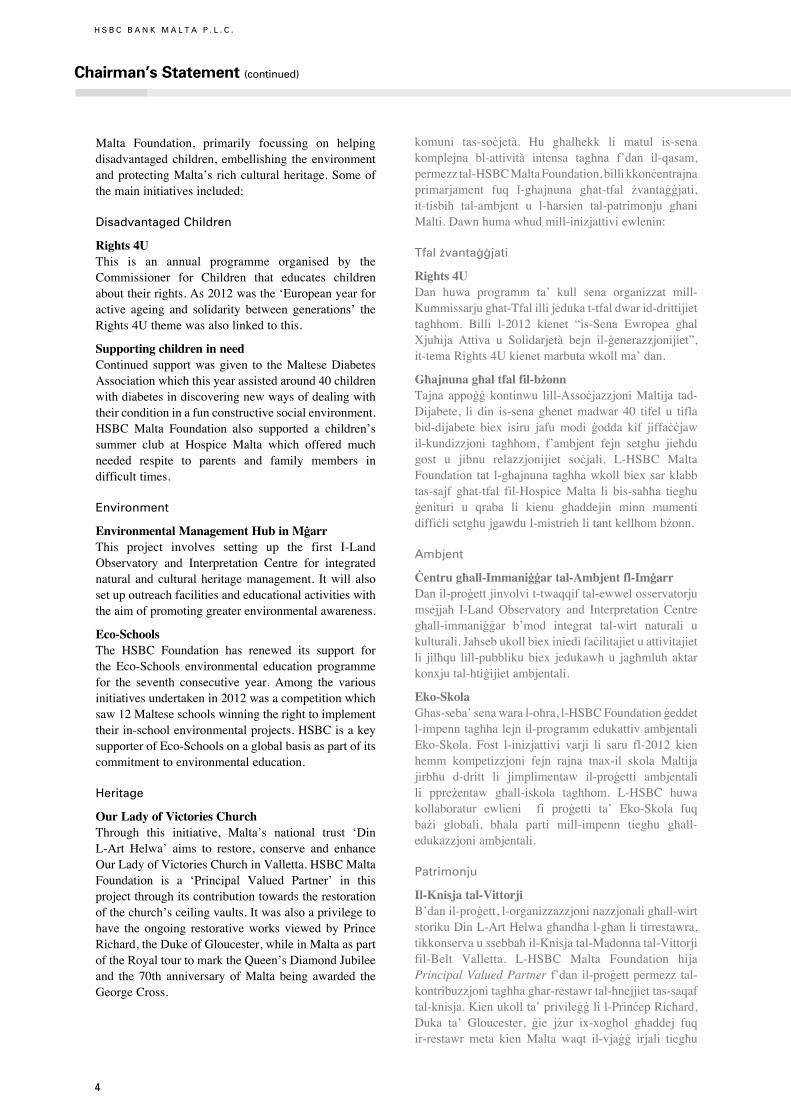
Malta Foundation, primarily focussing on helping disadvantaged children, embellishing the environment and protecting Malta’s rich cultural heritage. Some of the main initiatives included:
Disadvantaged Children
Rights 4UThis is an annual programme organised by the Commissioner for Children that educates children about their rights. As 2012 was the ‘European year for active ageing and solidarity between generations’ the Rights 4U theme was also linked to this.
Supporting children in needContinued support was given to the Maltese Diabetes Association which this year assisted around 40 children with diabetes in discovering new ways of dealing with their condition in a fun constructive social environment. HSBC Malta Foundation also supported a children’s summer club at Hospice Malta which offered much needed respite to parents and family members in difficult times.
Environment
Environmental Management Hub in M©arrThis project involves setting up the first I-Land Observatory and Interpretation Centre for integrated natural and cultural heritage management. It will also set up outreach facilities and educational activities with the aim of promoting greater environmental awareness.
Eco-SchoolsThe HSBC Foundation has renewed its support for the Eco-Schools environmental education programme for the seventh consecutive year. Among the various initiatives undertaken in 2012 was a competition which saw 12 Maltese schools winning the right to implement their in-school environmental projects. HSBC is a key supporter of Eco-Schools on a global basis as part of its commitment to environmental education.
Heritage
Our Lady of Victories ChurchThrough this initiative, Malta’s national trust ‘Din L-Art Óelwa’ aims to restore, conserve and enhance Our Lady of Victories Church in Valletta. HSBC Malta Foundation is a ‘Principal Valued Partner’ in this project through its contribution towards the restoration of the church’s ceiling vaults. It was also a privilege to have the ongoing restorative works viewed by Prince Richard, the Duke of Gloucester, while in Malta as part of the Royal tour to mark the Queen’s Diamond Jubilee and the 70th anniversary of Malta being awarded the George Cross.
Chairman’s Statement (continued)
4
H S B C B A N K M A L T A P . L . C .
komuni tas-soçjetà. Hu g˙alhekk li matul is-sena komplejna bl-attività intensa tag˙na f’dan il-qasam, permezz tal-HSBC Malta Foundation, billi kkonçentrajna primarjament fuq l-g˙ajnuna g˙at-tfal Ωvanta©©jati, it-tisbi˙ tal-ambjent u l-˙arsien tal-patrimonju g˙ani Malti. Dawn huma w˙ud mill-inizjattivi ewlenin:
Tfal Ωvanta©©jati
Rights 4UDan huwa programm ta’ kull sena organizzat mill-Kummissarju g˙at-Tfal illi jeduka t-tfal dwar id-drittijiet tag˙hom. Billi l-2012 kienet “is-Sena Ewropea g˙al Xju˙ija Attiva u Solidarjetà bejn il-©enerazzjonijiet”, it-tema Rights 4U kienet marbuta wkoll ma’ dan.
G˙ajnuna g˙al tfal fil-bΩonnTajna appo©© kontinwu lill-Assoçjazzjoni Maltija tad-Dijabete, li din is-sena g˙enet madwar 40 tifel u tifla bid-dijabete biex isiru jafu modi ©odda kif jiffaççjaw il-kundizzjoni tag˙hom, f’ambjent fejn setg˙u jie˙du gost u jibnu relazzjonijiet soçjali. L-HSBC Malta Foundation tat l-g˙ajnuna tag˙ha wkoll biex sar klabb tas-sajf g˙at-tfal fil-Hospice Malta li bis-sa˙˙a tieg˙u ©enituri u qraba li kienu g˙addejin minn mumenti diffiçli setg˙u jgawdu l-mistrie˙ li tant kellhom bΩonn.
Ambjent
Çentru g˙all-Immani©©ar tal-Ambjent fl-Im©arrDan il-pro©ett jinvolvi t-twaqqif tal-ewwel osservatorju msejja˙ I-Land Observatory and Interpretation Centre g˙all-immani©©ar b’mod integrat tal-wirt naturali u kulturali. Ja˙seb ukoll biex iniedi façilitajiet u attivitajiet li jil˙qu lill-pubbliku biex jedukawh u jag˙mluh aktar konxju tal-˙ti©ijiet ambjentali.
Eko-SkolaG˙as-seba’ sena wara l-o˙ra, l-HSBC Foundation ©eddet l-impenn tag˙ha lejn il-programm edukattiv ambjentali Eko-Skola. Fost l-inizjattivi varji li saru fl-2012 kien hemm kompetizzjoni fejn rajna tnax-il skola Maltija jirb˙u d-dritt li jimplimentaw il-pro©etti ambjentali li ppreΩentaw g˙all-iskola tag˙hom. L-HSBC huwa kollaboratur ewlieni fi pro©etti ta’ Eko-Skola fuq baΩi globali, b˙ala parti mill-impenn tieg˙u g˙all-edukazzjoni ambjentali.
Patrimonju
Il-Knisja tal-VittorjiB’dan il-pro©ett, l-organizzazzjoni nazzjonali g˙all-wirt storiku Din L-Art Óelwa g˙andha l-g˙an li tirrestawra, tikkonserva u ssebba˙ il-Knisja tal-Madonna tal-Vittorji fil-Belt Valletta. L-HSBC Malta Foundation hija Principal Valued Partner f’dan il-pro©ett permezz tal-kontribuzzjoni tag˙ha g˙ar-restawr tal-˙nejjiet tas-saqaf tal-knisja. Kien ukoll ta’ privile©© li l-Prinçep Richard, Duka ta’ Gloucester, ©ie jΩur ix-xog˙ol g˙addej fuq ir-restawr meta kien Malta waqt il-vja©© irjali tieg˙u

5
HSBC Malta is also proud to be associated with the global HSBC Water Programme. This five year US $100m community investment, will see HSBC working closely with WWF, WaterAid and Earthwatch to tackle the global water challenge through social and environmental projects that deliver water provision, water quality protection and education. It is anticipated that HSBC Malta employees will volunteer and actively participate in this worthwhile project.
HSBC Malta Foundation also continued to support The Malta Community Chest Fund and contributed towards its annual Rockestra concert and national ‘L-Istrina’ fund raising activity.
Board
During 2012 there was one change to the Board of Directors from the majority shareholder. Mr Philip Farrugia retired from the bank following a career spanning 42 years, where he worked in virtually every area of the organisation and ended as Chief Technology and Services Officer overseeing a number of key transformation projects. While I wish Mr Farrugia a very happy retirement, I also welcome Mr Ranjit Gokarn who will now be fulfilling this executive role as he joins HSBC Bank Malta as Chief Operating Officer. Mr Gokarn has been an HSBC executive for the past 24 years and has worked in India, Singapore, Japan, the United Arab Emirates, United Kingdom and more recently France, where he served as Senior Executive,
biex iffakkar il-Ìublew tad-Djamanti tar-Re©ina u s-70 anniversarju mill-g˙oti tal-George Cross lil Malta.
L-HSBC Malta hija wkoll kburija bis-sehem tag˙ha fil-Programm globali tal-HSBC g˙all-Ilma. B’dan l-investiment ta’ US $100m g˙all-komunità, mifrux fuq ˙ames snin, l-HSBC ja˙dem fil-qrib mal-WWF, WaterAid u Earthwatch biex jeg˙lbu l-isfida globali g˙all-ilma bi pro©etti soçjali u ambjentali bil-g˙an li jkun hemm provvista tal-ilma fejn me˙tie©, tit˙ares il-kwalità tal-ilma, u ting˙ata edukazzjoni fuq is-su©©ett. Qeg˙din nantiçipaw li l-impjegati tal-HSBC Malta jag˙tu sehem attiv u volontarju f’dan il-pro©ett siewi.
L-HSBC Malta Foundation baqg˙et ukoll tg˙in lill-Malta Community Chest Fund u tat fondi favur il-kunçert annwali Rockestra u l-maratona nazzjonali ta’ ©bir tal-Istrina.
Il-Bord
Matul l-2012 l-azzjonista ma©oritarju g˙amel bidla wa˙da fil-Bord tad-Diretturi. Is-Sur Philip Farrugia irtira mill-bank wara karriera ta’ 42 sena, li fihom ˙adem kwaΩi f’kull qasam tal-organizzazzjoni u spiçça b˙ala Uffiçjal Ewlieni g˙at-Teknolo©ija u s-Servizzi, fejn kien responsabbli g˙al g˙add ta’ pro©etti importanti ta’ trasformazzjoni. Waqt li nawgura futur hieni lis-Sur Farrugia, nilqa’ mag˙na lis-Sur Ranjit Gokarn li issa se jimla dan il-post eΩekuttiv hekk kif jing˙aqad mal-HSBC Bank Malta b˙ala Kap Operattiv. Is-Sur
Prince Richard, the Duke of Gloucester viewing the restorative work during his visit to the Church of Our Lady of Victories, Valletta together with Monsignor Anton Galea, HSBC Malta CEO Mark Watkinson, Maria Grazia Cassar, and Din L-Art Óelwa President Simone Mizzi.

6
H S B C B A N K M A L T A P . L . C .
Chairman’s Statement (continued)
Continental Europe. He brings to the bank’s operations in Malta a well-diversified portfolio of international experiences, as well as a business and customer focus.
I am privileged to be the Chairman of a Board whose members have a wealth of knowledge and experience at both a local and international level. Collectively we have managed to guide this organisation through challenging times and have not been afraid to take some very difficult decisions to ensure a better and more sustainable future for the benefit of all stakeholders.
The Board comprises myself as Chairman, two expatriate Executive Directors who are also Chief Executive Officer and Chief Operating Officer of the bank, five Maltese Non-Executive Directors and one overseas-based Director who was CEO for HSBC Continental Europe and has recently been appointed as Chief Executive Officer of Global Private Banking in Geneva.
I am confident that together with this strong team of Directors, we can continue to provide the necessary stewardship for our organisation and achieve further success.
International Recognition
For the second consecutive year, HSBC Bank has been named Bank of the Year in Malta by the prestigious Financial Times publication, The Banker.
Considered the ‘Oscar’ of the international banking industry, this award was given to HSBC Malta in recognition for its achievements, best overall performance and continued investment in the business and the community.
The Banker Award is a well-deserved honour for the HSBC team in Malta and reflects positively on its credentials as Malta’s leading international bank.
Gokarn ilu uffiçjal eΩekuttiv mal-HSBC g˙al dawn l-a˙˙ar 24 sena u ˙adem l-Indja, Singapore, il-Ìappun, l-Emirati G˙arab Mag˙quda, ir-Renju Unit u f’dan l-a˙˙ar Ωmien Franza, fejn serva b˙ala EΩekuttiv g˙oli g˙all-Ewropa Kontinentali. Huwa j©ib mieg˙u f’Malta diversi esperjenzi internazzjonali, kif ukoll attenzjoni partikolari g˙an-negozju u l-klijent.
Jien g˙andi l-privile©© li nkun Chairman ta’ Bord li l-membri tieg˙u g˙andhom g˙erf u esperjenza estensiva sew fuq livell lokali kemm fuq dak internazzjonali. Kollettivament irnexxielna mmexxu ‘l din l-organizzazzjoni fi Ωminijiet ta’ sfida u ma bΩajniex nie˙du deçiΩjonijiet diffiçli biex nassiguraw futur a˙jar u aktar sostenibbli g˙all-©id tal-partijiet kollha interessati.
Il-Bord jikkonsisti minni b˙ala Chairman, Ωew© Diretturi EΩekuttivi barranin li huma wkoll il-Kap EΩekuttiv u l-Kap Operattiv tal-Bank, ˙ames Diretturi mhux eΩekuttivi Maltin u Direttur ie˙or ibbaΩat barra minn Malta li hu Kap EΩekuttiv tal-HSBC g˙all-Ewropa Kontinentali u dan l-a˙˙ar ©ie appuntat Chief Executive Officer tal-Global Private Banking f’Ìinevra.
Jiena fiduçjuΩ li flimkien ma’ dan it-tim sod ta’ Diretturi nistg˙u nkomplu naqdu l-organizzazzjoni tag˙na kif me˙tie© u niksbu aktar suççess.
Rikonoxximent Internazzjonali
G˙at tieni sena wara l-o˙ra l-pubblikazzjoni presti©juΩa tal-Financial Times The Banker innominat lill-HSBC Bank b˙ala l-Bank tas-Sena f’Malta.
Dan il-premju, meqjus b˙ala l-‘Oscar’ tal-industrija bankarja internazzjonali, intreba˙ mill-HSBC Malta b’rikonoxximent g˙all-kisbiet tieg˙u, l-a˙jar prestazzjoni kumplessivament, u l-investiment kontinwu fin-negozju u fil-komunità.
Dan il-premju huwa unur mist˙oqq g˙at-tim tal-HSBC f’Malta u jirrifletti b’mod poΩittiv fuq il-kredenzjali tieg˙u b˙ala l-aqwa bank internazzjonali f’Malta.
HSBC Bank Malta has for the second year running been named Bank of the Year in Malta by the prestigious Financial Times publication, The Banker.

7
Outlook
Acknowledging that the economic climate and market conditions remain challenging, I firmly believe that by upholding the HSBC Group values, adhering to sound banking principles of retaining strong capital and liquidity positions, taking a prudent stance to risk management, and investing in our people and systems, we can thrive in the future.
The changing regulatory landscape is also something we are monitoring closely and preparing for due to its direct impact on our business. Financial services organisations are becoming increasingly more regulated and this is the new reality.
My gratitude and appreciation goes to the Board of Directors, management and staff of the bank for their continuous hard work, commitment and outstanding contributions. I also thank our shareholders and our customers for placing their trust in our organisation.
I am confident that we are well positioned to continue to lead this organisation to even more successes in the future.
Albert Mizzi, Chairman 4 March 2013
Prospetti g˙all-futur
Waqt li nirrikonoxxi li l-ekonomija u l-kundizzjonijiet tas-suq g˙adhom diffiçli, nemmen bis-serjetà illi jekk nibqg˙u n˙addnu l-valuri tal-Grupp HSBC, insostnu l-prinçipji bankarji sodi ta’ kapital u likwidità b’sa˙˙ithom, nie˙du ˙sieb ir-riskji b’mod g˙aqli u ninvestu fin-nies u fis-sistemi tag˙na, nistg˙u nkomplu nirnexxu fil-futur.
A˙na qed insegwu mill-qrib ukoll it-tibdil fil-qasam regolatorju, u n˙ejju ru˙na g˙alih g˙aliex dan g˙andu impatt dirett fuq ix-xog˙ol tag˙na. L-organizzazzjonijiet tas-servizzi finanzjarji qed ikun so©©etti g˙al aktar u aktar regoli, u din hija r-realtà l-©dida.
Nesprimi l-gratitudni u l-apprezzament tieg˙i lill-Bord tad-Diretturi, lill-Management u lill-˙addiema tal-bank g˙ax-xog˙ol kontinwu u dedikat, l-impenn u l-kontribut straordinarju tag˙hom. Nirringrazzja wkoll lill-azzjonisti u l-klijenti tal-fiduçja li wrew f’din l-organizzazzjoni.
Jiena fiduçjuΩ li, mill-poΩizzjoni li qeg˙din fiha llum, a˙na nistg˙u nkomplu mmexxu ‘l din l-organizzazzjoni lejn aktar suççessi fis-snin li ©ejjin.

8
H S B C B A N K M A L T A P . L . C .
Chief Executive Officer’s Review
After my first full year of heading HSBC Bank Malta, I am pleased to announce that we have delivered a strong set of results with pre-tax profit up by 8% and a return on equity of 15.4%.
This positive performance was achieved in spite of the continuing challenges of the eurozone.
During the year we executed on a significant transformation programme to simplify the organisation. This was part of a global HSBC Group initiative. We are already starting to see the benefits of the changes in our business as we focus on long-term sustainability.
Despite the global economic difficulties, all our main customer groups contributed positively to the bank’s strong performance.
Performance
Profit before taxation for 2012 amounted to §95m, an increase of 8% over prior year. The main factors driving the improvement in profit before tax were a strong performance from the life insurance company reflecting a recovery in investment returns, effective balance sheet management, good cost control and available-for-sale gains as a result of the repositioning of the bond portfolio.
In 2012, net operating income increased by §3m or 1% when compared to prior year. This was the result of a 3% increase in net interest income reflecting growth in mortgage lending and improved balance sheet management returns.
Net fee and commission income decreased by §3m to §30m. Underlying growth however was positive with good trade services, dealing income, payments and cash management fees and insurance sales. These were offset by lower card fees (approximately §3m) resulting from the sale of the merchant acquiring business in December 2011.
Wara l-ewwel sena tieg˙i fit-tmexxija ta’ HSBC Bank Malta, b’sodisfazzjon in˙abbar riΩultat poΩittiv bi qlig˙ qabel it-taxxa li Ωdied bi 8% b’ritorn fuq il-kapital (return on equity) ta’ 15.4%.
Dan ir-riΩultat poΩittiv inkiseb minkejja l-isfidi kontinwi taΩ-Ωona ewro.
Matul is-sena ˙dimna fuq programm estensiv ta’ trasformazzjoni biex nissimplifikaw l-organizzazzjoni. Dan kien parti minn inizjattiva globali tal-Grupp HSBC. Di©à bdejna naraw il-benefiççju ta’ dan it-tibdil f’xog˙olna, hekk kif nimmiraw g˙al sostenibilità fit-tul.
Minkejja l-isfidi ekonomiçi globali, kull qasam tas-servizz bankarju kkontribwixxa g˙ar-riΩultati tajbin tal-bank.
RiΩultati
Il-profitt qabel it-taxxa g˙all-2012 tela’ g˙al §95m, Ωieda ta’ 8% fuq is-sena ta’ qabel. Il-fatturi ewlenin li ©abu dan it-titjib fil-profitt qabel it-taxxa kienu l-prestazzjoni tajba tal-kumpanija tal-assigurazzjoni fuq il-˙ajja, li gawdiet mill-irkupru fil-valur tal-investimenti, amministrazzjoni effettiva tal-investimenti li tejbet il-qlig˙ mill-interessi, kontroll tajjeb tal-ispejjeΩ u qlig˙ minn bejg˙ ta’ investimenti min˙abba li biddilna l-maturità tal-portafoll tal-bonds.
Fl-2012, id-d˙ul nett mill-operat Ωdied bi §3m jew 1% meta mqabbel mas-sena ta’ qabel. Dan kien riΩultat ta’ Ωieda ta’ 3% fid-d˙ul nett mill-img˙ax, li tirrifletti t-tkabbir fis-self g˙ad-djar u titjib fid-d˙ul mill-investimenti.
Id-d˙ul nett minn tariffi u kummissjoni niΩel bi §3m g˙al §30m. B’danakollu kien hemm servizzi li wrew tkabbir poΩittiv b˙al servizzi kummerçjali, d˙ul mill-kambju, payments and cash management, u bejg˙ tal-assigurazzjoni. Min-na˙a l-o˙ra kien hemm tnaqqis fid-drittijiet min-negozju tal-kards (madwar §3m), wara

9
During 2012 a greater emphasis was placed on delivering Global Banking and Markets products to our Commercial Banking clients. As a result, foreign exchange revenues were up 11% on the prior year.
Through effective balance sheet management, a net gain of §4m was reported on the disposal of available-for-sale securities compared to a net loss of §2m in 2011.
Costs were well controlled during the year with operating expenses at §96m, §2m lower than 2011. This was achieved in spite of provisions taken to fund an employee early voluntary retirement scheme. The overall cost efficiency ratio improved to 48.7% (2011: 50.4%) as a result of revenue growth and the realisation of sustainable cost savings.
At a consolidated level as a result of prudent risk management policies, net impairments reduced from §8m to §6m in 2012. Following the Greek sovereign debt restructuring programme during 2012, the Life Company sold its Greek debt exposure and neither the bank nor the Life company hold any Southern European country government debt.
At a bank level net impairment increased from §4m to §6m. Non-performing loans however remain stable at 5% of gross loans and this is in line with the market in Malta. Overall asset quality is generally good.
The bank has seen growth on both sides of the balance sheet in 2012. Total assets increased to §5,886m which includes a §10m increase in net loans and advances to customers that now stands at §3,354m. Our share of the mortgage market remained stable. The bank has seen a softening in loan demand due to slower market activity. However, gross new lending to customers amounted to §507m which reflects the bank’s continued support to our customers and the local economy.
Liabilities increased by §27m during the year and stand at §5,486m. Customer deposits rose by §114m to §4,517m reflecting an increase in corporate and institutional deposits. The level of retail deposits was marginally up despite significant competitive pressure for deposits.
The bank’s available-for-sale investments portfolio remains well diversified and conservative.
The bank’s liquidity position is strong with a very prudent advances-to-deposits ratio of 74%, compared with 76% at end 2011.
During the year, the bank strengthened its total capital ratio by 80 basis points to 12.4%. This exceeds the 8% minimum regulatory requirement. The bank intends to maintain a conservative approach to capital and will continue to grow its reserves where appropriate.
li f’Diçembru 2011 inbieg˙et is-sezzjoni tal-merchant acquiring.
Matul l-2012 kien hemm enfasi akbar biex inbieg˙u prodotti tal-Global Banking and Markets lill-klijenti tas-settur kummerçjali. Dan irriΩulta fi d˙ul mill-kambju ta’ 11% aktar fuq dak tas-sena ta’ qabel.
Permezz ta’ amministrazzjoni aktar attiva tal-portafoll tal-bonds, il-qlig˙ nett irrapportat fuq il-bejg˙ ta’ w˙ud minn dawn l-investimenti kien ta’ §4m, imqabbel ma’ telf nett ta’ §2m fl-2011.
Kien hemm kontroll tajjeb fuq l-ispejjeΩ matul is-sena. L-ispejjeΩ tal-operat kienu ta’ §96m, §2m anqas mill-2011. Dan ir-riΩultat inkiseb minkejja l-provvediment li g˙amilna biex niffinanzjaw skema volontarja tal-irtirar kmieni tal-impjegati. Ir-ratio tal-ispejjeΩ kontra d-d˙ul niΩel g˙al 48.7% (2011: 50.4%) min˙abba tkabbir fid-d˙ul u ffrankar sostenibbli mill-ispejjeΩ.
Fuq livell konsolidat, b˙ala riΩultat tal-prudenza li biha ˙adna ˙sieb ir-riskji, fl-2012 l-impairment nett niΩel minn §8m g˙al §6m. Wara l-programm tal-2012 ta’ ristrutturar tad-dejn sovran tal-Greçja, l-HSBC Life bieg˙et l-investimenti li kellha fil-Greçja biex issa la l-bank u lanqas il-kumpanija tal-assigurazzjoni m’g˙andhom bonds ta’ xi gvern minn pajjiΩ tal-Ewropa t’Isfel.
Fuq livell ta’ bank, l-impairment Ωdied minn §4m g˙al §6m. Madankollu s-self li mar ˙aΩin baqa’ fuq l-istess livell tas-sena l-o˙ra, ji©ifieri 5% tas-self gross, u dan huwa konsistenti mas-suq f’Malta. Il-kwalità ©enerali tal-assi hija tajba.
Il-bank kellu tkabbir fuq iΩ-Ωew© na˙at tal-karta tal-bilanç fl-2012. L-assi totali Ωdiedu g˙al §5,886m, li jinkludu §10m Ωieda fis-self nett lill-klijenti li issa la˙aq §3,354m. Is-sehem tag˙na fis-suq tas-self g˙ad-djar baqa’ stabbli. Il-bank ra d-domanda g˙as-self titbaxxa min˙abba l-kuntest ekonomiku attwali xejn favorevoli. Madankollu s-self ©did gross lill-klijenti kien ta’ §507m, li juri l-appo©© kontinwu tal-bank lill-klijenti u l-ekonomija lokali.
L-obbligazzjonijiet Ωdiedu b’§27m matul is-sena u telg˙u g˙al §5,486m. Id-depoΩiti tal-klijenti g˙olew b’§114m g˙al §4,517m min˙abba Ωieda fid-depoΩiti ta’ kumpaniji u istituzzjonijiet. Il-livell tad-depoΩiti personali tela’ bi ftit minkejja l-kompetizzjoni qawwija li kien hawn g˙ad-depoΩiti.
Il-portafoll tal-investimenti available-for-sale tal-bank g˙adu diversifikat sew u konservattiv.
Il-likwidità tal-bank hija f’poΩizzjoni soda, u r-relazzjoni tas-self mad-depoΩiti hija f’livell prudenti sew ta’ 74%, imqabbel ma’ 76% fl-a˙˙ar tal-2011.
10
H S B C B A N K M A L T A P . L . C .
Chief Executive Officer’s Review (continued)
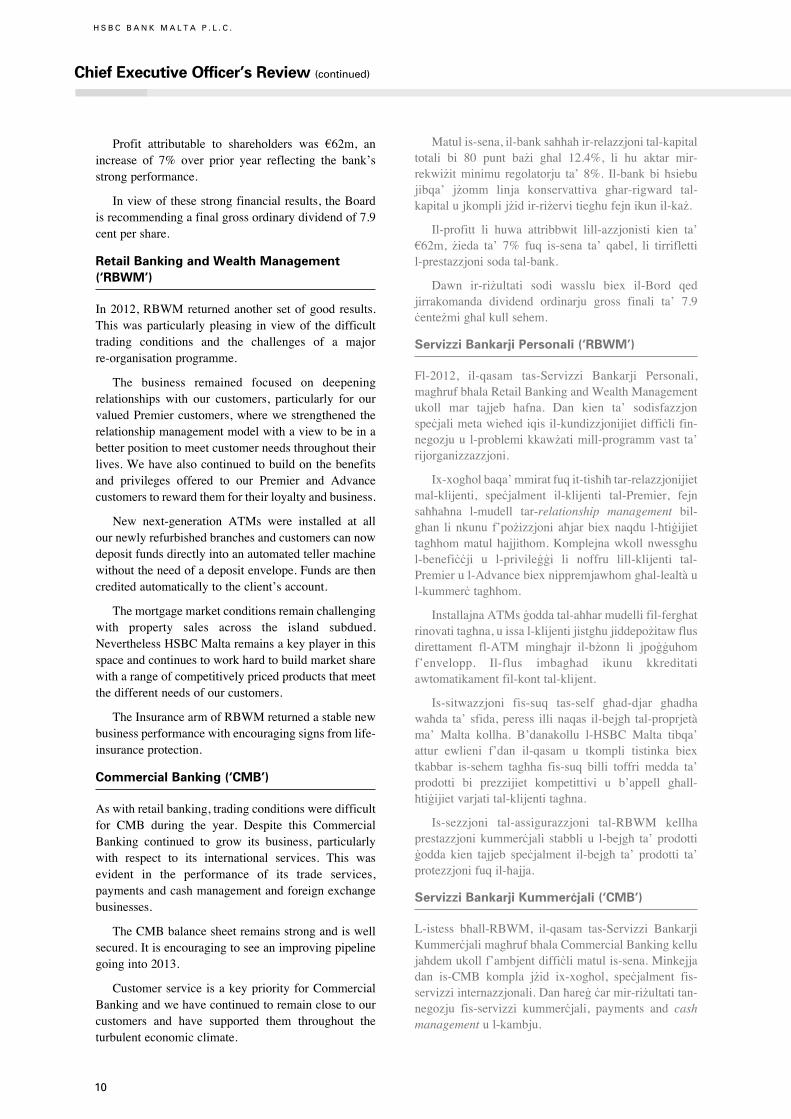
Profit attributable to shareholders was §62m, an increase of 7% over prior year reflecting the bank’s strong performance.
In view of these strong financial results, the Board is recommending a final gross ordinary dividend of 7.9 cent per share.
Retail Banking and Wealth Management (‘RBWM’)
In 2012, RBWM returned another set of good results. This was particularly pleasing in view of the difficult trading conditions and the challenges of a major re-organisation programme.
The business remained focused on deepening relationships with our customers, particularly for our valued Premier customers, where we strengthened the relationship management model with a view to be in a better position to meet customer needs throughout their lives. We have also continued to build on the benefits and privileges offered to our Premier and Advance customers to reward them for their loyalty and business.
New next-generation ATMs were installed at all our newly refurbished branches and customers can now deposit funds directly into an automated teller machine without the need of a deposit envelope. Funds are then credited automatically to the client’s account.
The mortgage market conditions remain challenging with property sales across the island subdued. Nevertheless HSBC Malta remains a key player in this space and continues to work hard to build market share with a range of competitively priced products that meet the different needs of our customers.
The Insurance arm of RBWM returned a stable new business performance with encouraging signs from life-insurance protection.
Commercial Banking (‘CMB’)
As with retail banking, trading conditions were difficult for CMB during the year. Despite this Commercial Banking continued to grow its business, particularly with respect to its international services. This was evident in the performance of its trade services, payments and cash management and foreign exchange businesses.
The CMB balance sheet remains strong and is well secured. It is encouraging to see an improving pipeline going into 2013.
Customer service is a key priority for Commercial Banking and we have continued to remain close to our customers and have supported them throughout the turbulent economic climate.
Matul is-sena, il-bank sa˙˙a˙ ir-relazzjoni tal-kapital totali bi 80 punt baΩi g˙al 12.4%, li hu aktar mir-rekwiΩit minimu regolatorju ta’ 8%. Il-bank bi ˙siebu jibqa’ jΩomm linja konservattiva g˙ar-rigward tal-kapital u jkompli jΩid ir-riΩervi tieg˙u fejn ikun il-kaΩ.
Il-profitt li huwa attribbwit lill-azzjonisti kien ta’ §62m, Ωieda ta’ 7% fuq is-sena ta’ qabel, li tirrifletti l-prestazzjoni soda tal-bank.
Dawn ir-riΩultati sodi wasslu biex il-Bord qed jirrakomanda dividend ordinarju gross finali ta’ 7.9 çenteΩmi g˙al kull sehem.
Servizzi Bankarji Personali (‘RBWM’)
Fl-2012, il-qasam tas-Servizzi Bankarji Personali, mag˙ruf b˙ala Retail Banking and Wealth Management ukoll mar tajjeb ˙afna. Dan kien ta’ sodisfazzjon speçjali meta wie˙ed iqis il-kundizzjonijiet diffiçli fin-negozju u l-problemi kkawΩati mill-programm vast ta’ rijorganizzazzjoni.
Ix-xog˙ol baqa’ mmirat fuq it-tis˙i˙ tar-relazzjonijiet mal-klijenti, speçjalment il-klijenti tal-Premier, fejn sa˙˙a˙na l-mudell tar-relationship management bil-g˙an li nkunu f’poΩizzjoni a˙jar biex naqdu l-˙ti©ijiet tag˙hom matul ˙ajjithom. Komplejna wkoll nwessg˙u l-benefiççji u l-privile©©i li noffru lill-klijenti tal-Premier u l-Advance biex nippremjawhom g˙al-lealtà u l-kummerç tag˙hom.
Installajna ATMs ©odda tal-a˙˙ar mudelli fil-ferg˙at rinovati tag˙na, u issa l-klijenti jistg˙u jiddepoΩitaw flus direttament fl-ATM ming˙ajr il-bΩonn li jpo©©uhom f’envelopp. Il-flus imbag˙ad ikunu kkreditati awtomatikament fil-kont tal-klijent.
Is-sitwazzjoni fis-suq tas-self g˙ad-djar g˙adha wa˙da ta’ sfida, peress illi naqas il-bejg˙ tal-proprjetà ma’ Malta kollha. B’danakollu l-HSBC Malta tibqa’ attur ewlieni f’dan il-qasam u tkompli tistinka biex tkabbar is-sehem tag˙ha fis-suq billi toffri medda ta’ prodotti bi prezzijiet kompetittivi u b’appell g˙all-˙ti©ijiet varjati tal-klijenti tag˙na.
Is-sezzjoni tal-assigurazzjoni tal-RBWM kellha prestazzjoni kummerçjali stabbli u l-bejg˙ ta’ prodotti ©odda kien tajjeb speçjalment il-bejg˙ ta’ prodotti ta’ protezzjoni fuq il-˙ajja.
Servizzi Bankarji Kummerçjali (‘CMB’)
L-istess b˙all-RBWM, il-qasam tas-Servizzi Bankarji Kummerçjali mag˙ruf b˙ala Commercial Banking kellu ja˙dem ukoll f’ambjent diffiçli matul is-sena. Minkejja dan is-CMB kompla jΩid ix-xog˙ol, speçjalment fis-servizzi internazzjonali. Dan ˙are© çar mir-riΩultati tan-negozju fis-servizzi kummerçjali, payments and cash management u l-kambju.
11
The focus during the year was on the international differentiation that HSBC offers. HSBC has a unique global reach that can help customers find new markets and source raw materials and components from around the world. Examples of this reach include two HSBC international business conferences that were held in Brazil and China and attended by local customers. Such events provide vital networking opportunities and open up new markets for businesses in Malta.
In addition, in our drive to promote both Malta and our local customers on the world stage, we teamed up with Malta Enterprise on a Trade Mission to Hong Kong and Shanghai where we hosted a networking reception and our colleagues in China successfully introduced a number of their customer to ours.
In respect of technology, we have invested in new functionality including HSBCnet mobile and internet trade services which provide customers with greater flexibility and convenience in addition to 24x7 access.
To assist our customers in the corporate real estate sector we have set up a specialised unit to handle all of our real estate business that is staffed by seasoned relationship managers who have extensive experience in this sector. This has been well received by our customers who now have access to specific industry expertise.
During the year under review we hosted a number of Thought Leadership seminars which included presentations by HSBC’s Karen Ward and David Bloom, a prominent HSBC economist and a foreign exchange expert respectively. We also co-hosted events with the Malta Chinese Chamber of Commerce, Ernst & Young, Malta Association of Credit Management and Malta Institute of Management.
Global Banking and Markets (‘GB&M’)
The year under review saw the eurozone crisis further deteriorate with mounting pressures at the start of the year due to the heightened fears of sovereign default by Greece, Italy and Spain. All of these countries had to undertake significant debt re-financing exercises during 2012. Greece restructured its debt amid significant ‘haircuts’ for investors of up to 65%, whilst Italy and Spain also re-financed their borrowings during the early stages of 2012 at a significant cost. Yields continued to rise until the European Central Bank declared its support for the euro half way through the year, at which point yield began to ease back.
It is against this backdrop that Global Banking and Markets continued to increase its contribution to the bank’s results during 2012. The prudent measures that were taken in the preceding financial period to manage the investment portfolio and market risks were maintained. These measures, together with continued
Il-balance sheet tas-CMB hija soda u assigurata tajjeb. Huwa ta’ kura©© li wie˙ed jara sinjali poΩittivi g˙all-2013.
G˙as-CMB is-servizz lejn il-klijenti huwa importanti ˙afna, u a˙na bqajna qrib tal-klijenti tag˙na u tajniehom l-assistenza kollha matul dan iΩ-Ωmien diffiçli.
Matul is-sena iffokajna fuq l-opportunitajiet internazzjonali li joffri l-HSBC. L-HSBC g˙andu firxa globali unika li tista’ tg˙in lill-klijenti jsibu swieq ©odda u jfittxu materja prima u komponenti minn madwar id-dinja. B˙ala eΩempji ta’ din il-firxa kien hemm Ωew© konferenzi internazzjonali tal-HSBC li saru wa˙da fil-BraΩil u l-o˙ra fiç-Çina u li g˙alihom attendew klijenti minn Malta. Avvenimenti b˙al dawn joffru opportunità imprezzabbli ta’ komunikazzjoni u jift˙u swieq ©odda g˙an-negozji Maltin.
Barra minn dan, fl-isforzi tag˙na biex inressqu lil Malta kif ukoll lill-klijenti tag˙na lejn ix-xena dinjija, ing˙aqadna mal-Malta Enterprise f’missjoni kummerçjali f’Hong Kong u Shanghai fejn ospitajna riçeviment li fih il-kollegi tag˙na fiç-Çina rnexxielhom ilaqqg˙u b’suççess g˙add ta’ klijenti minn tag˙hom ma’ dawk tag˙na.
Fejn tid˙ol it-teknolo©ija, g˙amilna investiment li ©ab funzjonalità ©dida. Dan kien jinkludi s-servizzi kummerçjali bil-mobile u bl-internet fuq l-HSBCnet, li bihom il-klijenti g˙andhom flessibilità u konvenjenza akbar, apparti l-aççess 24 sieg˙a kuljum.
Biex ng˙inu lill-klijenti fis-settur tal-kumpaniji tal-proprjetà, waqqafna sezzjoni speçjalizzata biex tie˙u ˙sieb ix-xog˙ol kollu marbut ma dan is-settur, fejn g˙andna relationship managers li ilhom fix-xog˙ol u li g˙andhom esperjenza vasta f’dan il-qasam. Dan il-pass intlaqa’ tajjeb mill-klijenti li issa g˙andhom aççess g˙al tag˙rif espert u speçifiku fl-industrija tag˙hom.
Matul l-2012 organizzajna g˙add ta’ seminars ta’ Thought Leadership. Dawn kienu jinkludu preΩentazzjonijiet minn Karen Ward u David Bloom tal-HSBC, tal-ewwel ekonomista prominenti u tat-tieni espert fil-kambju. Tellajna wkoll diversi avvenimenti f’kollaborazzjoni mal-Malta Chinese Chamber of Commerce, Ernst & Young, il-Malta Association of Credit Management u l-Malta Institute of Management.
Servizzi Bankarji u Swieq Globali (‘GB&M’)
Fis-sena li g˙addiet il-kriΩi fiΩ-Ωona tal-ewro marret g˙all-ag˙ar. Il-pressjoni fil-bidu tas-sena Ωdiedet min˙abba li kiber il-biΩa’ ta’ falliment mill-gvernijiet tal-Greçja, l-Italja u Spanja. Dawn il-pajjiΩi kollha kellhom jg˙addu minn eΩerçizzju s˙i˙ biex jiffinanzjaw mill-©did id-djun tag˙hom. Il-Greçja irristrutturat id-dejn u l-investituri raw il-kapital tag˙hom jonqos b’sa 65%. L-Italja u Spanja wkoll irran©aw il-finanzjament

12
H S B C B A N K M A L T A P . L . C .
David Bloom, Global Head of FX Strategy HSBC Group, addressing business delegates and traders during a business event entitled ‘A new era for FX’.
Chief Executive Officer’s Review (continued)
emphasis on improving cost efficiencies and the continued focus on driving the business, saw Global Banking and Markets register record levels of segment revenues and profitability.
Foreign exchange activity by the Global Markets unit was again well up year-on-year with volumes registering an increase of nearly 45%, as the team continued to leverage on the HSBC Group’s global network. HSBC Stockbrokers retained the highest market share for broking activity on the Malta Stock Exchange.
The financial institutions team that was set up in 2011 to support the growth of the financial services sector in Malta also registered positive results during 2012, with segment revenues recording double digit growth. Leveraging HSBC’s global reach we believe that there are positive opportunities for growth in this sector over the next few years.
HSBC Technology and Services (‘HTS’)
The core purpose of the HTS function is to enable the success of the businesses that serve our customers. The HTS is jointly accountable for the day-to-day management, efficiency and risk control of the operations of the bank and for managing the total cost base. As the engine room of HSBC Bank Malta, HTS plays a key role in improving the efficiency of processes and systems throughout the bank. In 2012, we continued doing this successfully by implementing
tas-self fl-ewwel xhur tal-2012, ukoll b’telf sostanzjali. Il-yields komplew jog˙lew sakemm il-Bank Çentrali Ewropew iddikjara f’nofs is-sena li kien se jappo©©a l-ewro, u mbag˙ad il-yields re©g˙u bdew jonqsu.
Huwa f’dan ix-xenarju li l-qasam tas-Servizzi Bankarji u Swieq Globali mag˙ruf b˙ala Global Banking and Markets kompla jΩid il-kontribuzzjoni tieg˙u g˙ar-riΩultati tal-bank fl-2012. Komplejna nibnu fuq il-miΩuri kawti li kienu ttie˙du fil-perijodu finanzjarju ta’ qabel fl-amministrazzjoni tal-portafoll tal-investimenti u komplejna nikkontrollaw ir-riskji tas-suq fuq il-portafoll. Dawk il-miΩuri, flimkien ma’ enfasi kontinwa g˙al aktar effiçjenza fl-ispejjeΩ u l-mira fissa biex in-negozju jimxi ‘l quddiem, wasslu lill-GB&M biex jirre©istra livelli rekord ta’ d˙ul u profitti.
L-attività li dan il-qasam kellu fil-kambju re©g˙et Ωdiedet sew paragun mas-sena ta’ qabel, bil-volum jiΩdiet bi kwaΩi 45%, hekk kif GB&M kompla jivvanta©©ja ru˙u mill-kuntatti globali tal-Grupp HSBC. L-HSBC Stockbrokers Ωammet is-sehem tag˙ha fis-suq g˙all-attività ta’ broking fil-BorΩa ta’ Malta.
It-tim tal-istituzzjonijiet finanzjarji li twaqqaf fl-2011 biex isostni t-tkabbir tas-settur tas-servizzi finanzjarji f’Malta wkoll kellu riΩultati poΩittivi fl-2012, bid-d˙ul tag˙hom juri tkabbir b’çifri doppji. Bil-benefiççju tal-firxa globali tal-HSBC na˙sbu li hemm opportunità tajba biex dan is-settur ikompli jikber fis-snin li ©ejjin.

13
various innovative projects that enhanced the quality of service provided to our customers.
The bank in Malta has continued the initiative to upgrade and increase our ATM network across the island. A total of 38 next-generation Wincor ATMs were installed in various localities in Malta offering instant value for deposits. The number of deposit machines has also been increased, with the aim of giving our customers more choice in how they interact with their branch. As part of our ongoing branch upgrade programme, another two branches have been refurbished during the year, bringing the number of fully renovated branches to eleven. These branches are in line with the highest HSBC Group standards worldwide and reflect the changing behaviour pattern of our customers.
A key feature of this change is that customers are becoming more familiar with the use of online banking and call centres. In order to encourage customers to migrate from manual to automated payment channels, we have extended the cut-off time for payments effected via HSBCnet during the course of the year. This has reduced manual payments volumes by 60%, another best-in-class achievement for HSBC Bank Malta. We are pursuing further improvements and developments in Internet Banking to further enhance the customer experience.
HTS embeds sustainability into our business approach to create long-term consumer and employee value by not only creating a ‘green’ strategy aimed towards protecting the natural environment, but also taking into consideration every dimension of how a
Teknolo©ija u Servizzi (‘HTS’)
L-g˙an çentrali tal-qasam tat-Teknolo©ija u Servizzi mag˙ruf b˙ala HSBC Technology and Services hu li jg˙in lill-operazzjonijiet li jaqdu l-klijenti jag˙mlu dan b’suççess. L-istrate©ija tal-HTS hija mmirata biex til˙aq dan il-g˙an çentrali u l-HTS g˙andha responsabbiltà kon©unta g˙at-tmexxija ta’ kuljum, l-effiçjenza, u l-kontroll tar-riskju tal-operazzjonijiet tal-bank u g˙all-amministrazzjoni tal-ispejjeΩ kollha. B˙ala l-post fejn jinsab il-mutur tal-HSBC Bank Malta, l-HTS g˙andu sehem ewlieni x’jaqdi fit-titjib tal-effiçjenza tal-proçessi u s-sistemi fil-bank. Fl-2012, dan komplejna nag˙mluh b’suççess billi implimentajna numru ta’ pro©etti innovattivi li g˙ollew il-kwalità tas-servizz mog˙ti lill-klijenti.
Il-bank kompla bl-inizjattiva tieg˙u li jtejjeb il-livell u jΩid in-numru tal-ATMs f’Malta u G˙awdex. Total ta’ 38 ATM Wincor tal-a˙˙ar mudell ©ew installati f’diversi lokalitajiet, li jag˙tu valur immedjat g˙ad-depoΩiti. Anke n-numru tal-magni tad-depoΩitu Ωdied, bil-g˙an li nag˙tu lill-klijenti g˙aΩla akbar ta’ kif jinqdew mill-ferg˙a. B˙ala parti mit-ti©did kontinwu tal-ferg˙at, irrinnovajna Ωew© ferg˙at o˙ra matul is-sena, biex in-numru ta’ ferg˙at li ©ew totalment rinovati issa huwa ta’ ˙dax. Dawn il-ferg˙at jikkonformaw mal-og˙la standards tal-Grupp HSBC madwar id-dinja u jirriflettu x-xejriet ©odda tal-eΩi©enzi tal-klijenti.
Karatteristika ewlenija ta’ dan it-tibdil hija li l-klijenti qed jidraw iΩjed l-uΩu tas-servizzi bankarji online u tal-call centres. Bil-g˙an li n˙ajru l-klijenti jaqilbu minn mezzi ta’ ˙las manwali g˙al dawk awtomatiçi, matul is-sena estendejna l-˙in g˙all-pagamenti mag˙mula
HSBC’s new ATMs use the latest technology to provide increased functionality, quicker self-service transactions, and a more straightforward user experience.

14
H S B C B A N K M A L T A P . L . C .
Chief Executive Officer’s Review (continued)
business operates in the social, cultural, and economic context. We have introduced class leading technologies in our lighting and air-conditioning systems and despite growing demands, we effectively reduced our energy usage by 3% over the previous year. The use of sustainable practices remains very high on the agenda for HSBC and our commitment to improve the environment was rewarded when our energy and sustainability manager was awarded the Malta Worker of the Year award.
We will continue to invest in our systems and people to enable the success of the businesses that we serve.
People
We are proud of our professional workforce as it is through their dedication, commitment and hard work that we continue to be able to deliver positive results.
In 2012 we implemented the global HSBC People and Structure strategy to align businesses with international blue prints. This resulted in a major re-organisation of our business and allowed the bank to offer a significant number of new career advancement opportunities. By the end of the year 70% of our branch managers and all our assistant branch managers were new to their role. We now have one of the most dynamic, motivated and exciting branch teams in place, quite possibly in our history.
During 2012 we reviewed our talent management strategy and agreed to undertake a number of initiatives. These included the summer Internship Programme which provided the basis for a selection pool of University graduates in 2013 and a robust review of our talent and local succession plans.
bl-HSBCnet. Dan ©ab tnaqqis ta’ 60% fil-volum ta’ pagamenti manwali – kisba o˙ra best-in-class g˙all-HSBC Bank Malta. Qeg˙din nist˙arr©u titjib u Ωviluppi o˙ra fl-Internet Banking biex noffru lill-klijent esperjenza dejjem aqwa.
L-HTS tara li tin˙oloq sostenibbiltà fil-mod kif nag˙mlu n-negozju biex b’hekk to˙loq valur fit-tul g˙all-klijenti u g˙all-impjegati. Dan tag˙mlu mhux biss billi to˙loq strate©ija ambjentali mmirata biex t˙ares l-ambjent naturali, imma wkoll billi tqis kull aspett ta’ kif in-negozju jopera fil-kuntest soçjali, kulturali u ekonomiku. Da˙˙alna teknolo©iji moderni fis-sistemi tad-dawl u tal-arja kondizzjonata, u minkejja li d-domanda Ωdiedet irnexxilna nnaqqsu l-uΩu tal-ener©ija bi 3% fuq is-sena ta’ qabel. L-uΩu ta’ prattiçi sostenibbli jibqa’ jΩomm post g˙oli fl-a©enda tal-HSBC, u l-impenn tag˙na li ntejbu l-ambjent kien rikonoxxut meta l-manager tag˙na responsabbli mill-ener©ija u s-sostenibilità reba˙ il-premju Óaddiem tas-Sena.
A˙na nibqg˙u ninvestu fis-sistemi u l-˙addiema tag˙na biex niΩguraw li l-oqsma kollha tal-bank ikunu ta’ suççess.
Il-Óaddiema
A˙na kburin bil-˙addiema professjonali tag˙na, g˙ax huwa bid-dedikazzjoni, l-impenn u x-xog˙ol tag˙hom li nistg˙u nkomplu niksbu riΩultati poΩittivi.
Fl-2012 da˙˙alna l-istrate©ija globali HSBC People and Structure biex l-operazzjonijiet jikkonformaw mal-mudelli internazzjonali. Ir-rijorganizzazzjoni li dan ©ab fix-xog˙ol tag˙na kienet wa˙da kbira u din tat iç-çans lill-bank li joffri numru ©mielu ta’ opportunitajiet ©odda biex l-impjegati javvanzaw fil-karriera. Sal-a˙˙ar tas-sena 70% tal-managers u l-assistenti tag˙hom fil-ferg˙at kollha kienu ©odda. Issa g˙andna tim imexxi l-ferg˙at li hu fost l-aktar dinamiçi, motivati u eççitanti li qatt kien hemm, x’aktarx fl-istorja kollha tag˙na.
Fl-2012 irrevedejna l-istrate©ija ta’ kif nittrattaw it-talent, u qbilna li nniedu g˙add ta’ inizjattivi. Fost dawn kien hemm l-Internship Programme tas-sajf, li tana l-baΩi biex inkunu nistg˙u nag˙Ωlu gradwati universitarji fl-2013 u g˙al reviΩjoni soda tal-pjani tat-talent u s-suççessjoni lokali.
Fl-2012 komplejna noffru opportunitajiet biex u˙ud mill-impjegati jkunu sekondati barra minn Malta, apparti t-ta˙ri© u l-iΩvilupp kontinwu lokali. Dwar dan tal-a˙˙ar ta’ min jg˙id ukoll li l-membri tal-Bord u l-managers kollha fis-saffi g˙oljin u tan-nofs tal-organizzazzjoni ˙adu sehem fi programm komprensiv ta’ tmexxija imsejjes fuq il-valuri. Il-messa©©i ewlenin ta’ dan il-programm imbag˙ad in©arru fuq il-post tax-xog˙ol fejn twasslu lill-impjegati kollha.
Victor Friggieri, HSBC’s Manager for Energy and Sustainability and winner of the 2012 Worker of the Year Award, demonstrates HSBC Malta’s Building Management System which significantly reduces energy consumption in HSBC Malta’s buildings and branches.

15
In 2012 we continued offering overseas secondment opportunities to some employees over and above the ongoing training and development. In connection with the latter, it is worth highlighting that the Board members and all senior and middle managers of the organisation underwent a comprehensive values based leadership programme. The key messages from this programme were then taken back to the workplace and cascaded to all other members of staff.
It is through such initiatives that we continue to sustain our superior professional standards, high quality work ethic and focus on doing the right thing.
Outlook
Looking ahead, 2013 is expected to be another challenging year. The Maltese economy continues to show its resilience in the current subdued economic environment as confirmed by GDP growth forecasts which remain positive and well above the EU and eurozone averages. In spite of this, certain pressure points remain. Malta’s open economy is not immune to the travails of the euro market and remains susceptible to external shocks in the broader global economy.
Despite all the difficulties, we have a clear strategy in place and will continue transforming the business focusing on the international opportunity, simplifying our business, improving the customer experience and driving greater organisational efficiency.
I would like to thank the Board, the management team, all our staff, our customers and shareholders for their support in 2012. It is a privilege to work in HSBC Bank Malta.
Mark Watkinson, Chief Executive Officer4 March 2013
Huwa permezz ta’ inizjattivi b˙al dawn li nkomplu nsostnu standards professjonali superjuri, etika ta’ xog˙ol ta’ kwalità, u attenzjoni mmirata biex nag˙mlu dak li hu sew.
Prospetti g˙all-futur
Jekk nag˙tu daqqa t’g˙ajn ‘il quddiem, nistennew aktar sfidi quddiemna g˙all-2013. L-ekonomija Maltija g˙adha turi li tista’ ΩΩomm soda fl-ambjent ekonomiku kemmxejn imraΩΩan ta’ b˙alissa, u dan jikkonfermah it-tbassir g˙at-tkabbir tal-GDP li g˙adu poΩittiv u og˙la sew mill-medja tal-UE u taΩ-Ωona ewro. Xorta wa˙da, iΩda, hemm elementi li jibqg˙u j©arrbu pressjoni. L-ekonomija miftu˙a ta’ Malta mhijiex ˙ielsa mit-taqlib fis-suq tal-ewro u tibqa’ vulnerabbli g˙ax-xokkijiet esterni tal-ekonomija globali.
Minkejja d-diffikultajiet kollha, g˙andna quddiemna strate©ija çara u se nkomplu nittrasformaw in-negozju tag˙na billi niffokaw fuq l-opportunità internazzjonali, nissimplifikaw ix-xog˙ol, intejbu l-esperjenza tal-klijent, u na˙dmu g˙al aktar effiçjenza fl-organizzazzjoni.
Nixtieq nirringrazzja lill-Bord, lill-management kollu, lill-impjegati, il-klijenti u l-azzjonisti kollha g˙all-appo©© tag˙hom fl-2012. Huwa ta’ privile©© li na˙dem mal-HSBC Bank Malta.

16
H S B C B A N K M A L T A P . L . C .
Board of Directors
16
Albert Mizzi, NON-EXECUTIVE CHAIRMAN
Non-Executive Chairman of HSBC Bank Malta p.l.c. since June 1999. In 1946, joined family business Alf. Mizzi & Sons Ltd and was Chairman for several years. In the 1960s he was heavily involved in private banking and appointed director of Medport. Established a number of Malta’s important parastatal businesses: Air Malta, Sea Malta, Medserv, Mediterranean Insurance Brokers and Middle Sea Insurance. Following the setting up of Air Malta in 1973, he served as its Chairman for 19 years.
Ranjit Gokarn, DIRECTOR AND CHIEF OPERATING OFFICER
Appointed Director on 28 June 2012. Mr Gokarn has been an HSBC Group International Manager for over 22 years. Over this period, he has worked in India, Singapore, Japan, the United Arab Emirates, United Kingdom and France. Prior to taking up his appointment in Malta, Mr Gokarn was Senior Executive, Continental Europe based in Paris and continues to serve as a Director of HSBC Bank Armenia. Earlier senior roles include Chief Risk Officer India & Singapore and significant appointments within the Global Risk and Commercial Banking businesses in the UK.
Peter William Boyles, EXECUTIVE DIRECTOR
Executive Director since 6 May 2010. Mr Boyles has been recently appointed as Chief Executive Officer of Global Private Banking and is now based in Geneva. Mr Boyles commenced his career with HSBC as an International Manager in1975 and has worked in Asia, the Middle East and Europe. He was appointed Group General Manager in 2006. Mr Boyles had been based in Paris since 2007 where he was Chief Executive Officer of HSBC France and subsequently Chief Executive Officer Continental Europe and Head of Commercial Banking Europe.
Mark Watkinson, DIRECTOR AND CHIEF EXECUTIVE OFFICER
Appointed Chief Executive Officer on 1 January 2012 and Director on 14 February 2012. Prior to taking up his appointment in Malta, he was Head of Commercial Banking for North America based in New York. He has been with HSBC for 27 years. He has worked in New York, Toronto as Head of Commercial Banking for HSBC Canada and as President and Chief Executive Officer for HSBC Bank in the Philippines.
Philip Farrugia, DIRECTOR AND CHIEF TECHNOLOGY AND SERVICES OFFICER
Chief Technology and Services Officer from January 2011 and Director on 15 February 2011 until June 2012. Joined the bank in 1969 and has occupied a number of senior posts in both branches and Head Office departments. In 1980, he was seconded to the home loans company (Lohombus), rising to lead the company as Deputy General Manager and Company Secretary. In 2005 he was appointed Head of Service Delivery for the bank, and was a member of the executive team for six years. Retired from the bank and resigned from the post of Director in June 2012.
Philip Farrugia Randon, NON-EXECUTIVE DIRECTOR
Director of HSBC Bank Malta p.l.c. since June 2004. Graduated LL.D. in 1973 and joined the bank in 1974 as a legal adviser. Held the post of Company Secretary and the post of Head of Group Legal Department of the bank for several years. Retired from the bank in May 2008.

17
Charles John Farrugia, NON-EXECUTIVE DIRECTOR
Director of HSBC Bank Malta p.l.c. since November 2004. Joined the bank in 1975. Was appointed Chief Dealer in 1995, Group Senior Treasury Manager in 1999 and Managing Director of HSBC Stockbrokers (Malta) Limited in 2001. Held the post of Head of Global Banking and Markets of HSBC Bank Malta p.l.c. for several years. Retired from the bank in January 2010.
Saviour sive Sonny Portelli, NON-EXECUTIVE DIRECTOR
Appointed Director of HSBC Bank Malta p.l.c. on 9 October 2006. Mr Portelli is a senior Maltese businessman who is currently the Chairman of The Malta Council for Economic and Social Development. Mr Portelli had an early career in the Malta Civil Service which he left to join the Tourist Sector. Besides being a Marketing Specialist he sits as non-executive director on the boards of various Maltese companies.
George Brancaleone, COMPANY SECRETARY AND HEAD OF CORPORATE GOVERNANCE
Company Secretary of HSBC Bank Malta p.l.c. since June 2004. Joined the bank in 1980 and graduated LL.D. in 1988. Company Secretary of various HSBC subsidiaries in Malta since 2001. Presently holds the post of Senior Manager at the Company Secretary Office of HSBC Bank Malta p.l.c.
Peter Paul Testaferrata Moroni Viani, NON-EXECUTIVE DIRECTOR
Non-Executive Director of HSBC Bank Malta p.l.c. since March 2001. Holds various executive positions and directorships within the Testaferrata Group of companies.
James Dunbar Cousin, NON-EXECUTIVE DIRECTOR
Appointed Director of the Bank on 1 April 2009. Joined Barclays Bank D.C.O. in 1968. Occupied various managerial roles within the branch network of Mid-Med Bank p.l.c. Subsequently, he occupied the roles of Executive Manager and later Head of Commercial Banking of the bank. Mr Dunbar Cousin retired from the bank at the end of 2008.

18
H S B C B A N K M A L T A P . L . C .
Financial Review
Summary of Financial Performance
Group profitHSBC Bank Malta p.l.c. delivered a positive performance for the year ended 31 December 2012. Reported profit before tax of §95m increased by 8%, or §7m compared to 2011. The main factors driving the improvement in profit before tax were a strong performance from the life insurance company reflecting a recovery in investment returns, effective balance sheet management, good cost control and available-for-sale gains as a result of the repositioning of the bond portfolio.
Profit attributable to shareholders was §62m, an increase of §4m over prior year figures.
Net operating income of §198m increased by §3m compared with §195m in 2011. Net interest income increased by §4m to §133m.
Operating expenses were §96m, a reduction of §2m over prior year. Employee compensation and benefits include §6m restructuring costs against a net provision of §8m reported in 2011.
The group’s cost efficiency ratio improved from 50.4% to 48.7% in 2012.
Shareholder ratiosEarnings per share of 21.1 cent compared with 19.7 cent for the same period in 2011, with the pre-tax return on shareholders’ funds at 23.8% compared with 24.1% in 2011.
The Directors propose a final gross dividend of 7.9 cent per share. This follows on the gross interim dividend of 10.0 cent paid in August 2012.
Net interest incomeNet interest income increased by 3% to §133m compared with §129m in 2011. The increase reflected growth in mortgage lending and improved balance sheet management returns.
Non-interest incomeNon-interest income of §65m was broadly in line with prior year. On a like-for-like basis, excluding non-recurring items, non-interest income increased by §13m or 27% over prior year’s revenue.
Net fee and commission income fell to §30m in 2012 compared with §34m in 2011. Growth in fee income from payments and cash management was more than offset by lower card fees following the sale of the merchant card acquiring business in December 2011.
During 2012 a greater emphasis was made on the connectivity between GB&M and CMB and as a result of greater focus and client calling activity foreign exchange revenues were up §1m or 11% year-on-year.
A net gain of §4m was reported on the disposal of available-for-sale securities compared to a net loss of §2m in 2011.
HSBC Life Insurance (Malta) Ltd reported a profit before tax of §18m compared with §11m in 2011 reflecting a recovery in investment returns. Underlying new business performance generation, particularly with respect to life-insurance protection was encouraging.
During 2011 non-interest income was affected by the sale of the card acquiring business (§10m), net loss on disposals of available-for-sale securities (§2m) and the non-recurring gain in the life insurance subsidiary relating to a methodology change (§7m) which were not repeated in 2012.
Operating expensesOperating expenses of §96m were §2m or 2% lower than the previous year. Expenses fell despite a §2m rise in amortisation costs relating to the implementation of an IT system in 2011 and an early voluntary retirement provision of §6m taken during the year against a net provision of §8m in 2011. The bank has continued its transformation programme to simplify and de-layer the organisation and the positive benefits of this global HSBC initiative are evident.
General and administrative expenses increased marginally by §2m to §35m principally as a result of an increase in the bank’s contribution towards the Depositor Guarantee Scheme and increase in IT processing costs.
The cost efficiency ratio improved from 50.4% in the prior year to 48.7% in 2012.
Net impairment At a consolidated level, net impairments reduced from §8m to §6m in 2012. This was principally due to a §4m impairment taken on Greek government bonds held by the life insurance subsidiary in the available-for-sale bond portfolio in 2011. Following the Greek bonds restructuring programme during 2012, the life insurance subsidiary sold its Greek debt exposure and now holds no other Southern European country government debt.
In this very challenging economic environment loan impairments increased marginally to §5m (14 basis points of the overall loan book) compared with §4m in 2011. At a bank level, non-performing loans remained stable at 5% of gross loans and asset quality remains good.
19
Impairment reversals contributed §4m to profitability. New impairment allowances of §7m were raised and bad debt write-offs of §1m were reported.
TaxationThe 2012 effective rate of tax was 35.4% per cent. Tax expense for 2012 amounted to §34m.
AssetsTotal assets amounted to §5,886m, 1% higher than at 31 December 2011. The main increases were reported in investments and loans and advances to banks as part of the bank’s liquidity management.
Balances with Central Bank of Malta, Treasury Bills and cash holdings reduced from a prior year end level of §233m to a year end level of §107m as a result of a reduction in Central Bank of Malta reserve requirement from 2% to 1% in January 2012 and a reduction of treasury bills in favour of an increase in medium tenor Government of Malta securities.
In the current environment, as borrowers looked to reduce debt levels, net loans and advances to customers increased by §10m to §3,354m. Mortgage market share remained stable. Gross new lending to customers amounted to §507m which reflects the bank’s continued support to the local economy.
The bank’s liquidity position remains strong with advances to deposit ratio of 74% compared with 76% at 31 December 2011. This is well within our maximum benchmark ratio of 90% and highlights further room for lending growth.
The available-for-sale investment portfolio increased by net §51m to §987m. During 2012 Global Banking and Markets sold longer dated Government of Malta securities and repositioned the portfolio in shorter durations to align the investment book with the bank’s liability profile. The available-for-sale investments portfolio remains well diversified and conservative. A fair value gain of §11m was reported during the year. The mark-up was credited to revaluation reserve, net of tax.
Life assurance business assets, are primarily designated as financial assets at fair value through profit or loss. This portfolio increased by §85m to §455m from a prior year end level of §370m.
LiabilitiesTotal liabilities increased marginally by §27m to §5,486m.
Customer deposits rose by §114m during the year and stood at §4,517m at the year end reflecting an increase in corporate and institutional deposits. The levels of retail deposits were marginally up despite a rise in competitive pressure for deposits.
Funds under management by the group reached a year end closing level of §764m.
Liabilities under insurance contracts issued increased by §57m during the year to reach a year end level of §493m.
Shareholders’ fundsEquity totaled §401m at year end following dividend payments of §33m during 2012.
The number of shareholders as at 31 December 2012 stood at 10,204.
The bank continued to strengthen its capital ratio to 12.4%. This exceeds the 8.0% minimum regulatory requirement. The bank intends to maintain a conservative approach to capital and will continue to build capital where appropriate.

20
H S B C B A N K M A L T A P . L . C .
Report of the Directors
Results for 2012
The group reported a profit on ordinary activities before tax of §95m for the year under review. The group’s profit attributable to shareholders of the bank was §62m.
A gross interim ordinary dividend of 10.0 cent per share was paid on 22 August 2012. The Directors have proposed a gross final dividend of 7.9 cent per ordinary share. The final dividend will be payable to shareholders on the bank’s register as at 19 March 2013.
Further information about the results is provided in the group income statement and the statement of comprehensive income on pages 35 and 36.
Principal activities
Principal activities of parent companyThe bank is authorised to carry on the business of banking, under the Banking Act, 1994 as a credit institution. It is also a licensed financial intermediary in terms of the Financial Markets Act, 1990. The bank also holds Category 3 and Category 4 Investment Services licenses issued by the Malta Financial Services Authority in terms of the Investment Services Act, 1994. These licenses authorise the bank to provide both investment services to third parties and trustee or custodian services for collective investment schemes.
The bank provides a comprehensive range of banking and financial related services.
The group had the following subsidiaries at 31 December 2012: HSBC Life Assurance (Malta) Ltd, HSBC Global Asset Management (Malta) Limited, HSBC Securities Services (Malta) Limited, HSBC Stockbrokers (Malta) Limited and HSBC Insurance Management Services (Europe) Limited.
Principal activities of subsidiariesHSBC Life Assurance (Malta) Ltd is authorised by the Malta Financial Services Authority to carry on business of insurance in Malta under the Insurance Business Act, 1998. It offers a range of protection and investment life assurance products distributed mainly through HSBC Bank Malta p.l.c. which is enrolled as a tied insurance intermediary for HSBC Life Assurance (Malta) Ltd under the Insurance Intermediaries Act 2006.
HSBC Insurance Management Services (Europe) Limited is authorised by the Malta Financial Services Authority to act as an insurance manager. It provides operational support to HSBC Life Assurance (Malta) Ltd and HSBC Life (Europe) Ltd based in Dublin.
HSBC Global Asset Management (Malta) Limited is the investment solutions provider of the HSBC Group in Malta. It manages an array of funds which have exposure to both Maltese and international financial markets. HSBC Global Asset Management (Malta) Limited specialises in the provision of tailor-made discretionary portfolio management services for institutions and family offices.
HSBC Securities Services (Malta) Limited is licensed under the Investment Services Act, 1994 and its main business activity is the provision of fund administration services to proprietary and third party investment funds. It also provides back office support to HSBC Bank Malta p.l.c. in the distribution of third party investment funds through the bank network.
HSBC Stockbrokers (Malta) Limited is a member of the Malta Stock Exchange and is regulated under the Investment Services Act, 1994 by the Malta Financial Services Authority. The company is engaged in providing stockbroking services to HSBC Bank Malta p.l.c. clients seeking to transact in securities that are listed on the Malta Stock Exchange. It also arranges/supports the listing of stocks and shares on the Exchange.
Business review
A review of the business of the bank and its subsidiaries during the year under review and an indication of likely future developments are given in the ‘Chief Executive Officer’s Review’ on pages 8 to 15.

21
Transactions in own shares
During the year the bank disposed of all units held in a mutual fund which invests in the bank’s shares.
Shareholder Register Information pursuant to Listing Rule 5.64
HSBC Bank Malta p.l.c. (the ‘bank’) authorised share capital is §141,000,000. The issued and fully paid up capital is §87,552,000 divided into 291,840,000 Ordinary Shares of a nominal value of 30 cent each. The issued share capital consists of one class of ordinary shares with equal voting rights attached and freely transferable.
HSBC Europe B.V. holds 70.03% of the bank’s shares.
The largest single shareholder of the bank, provided it holds at least thirty three per cent (33%) of the ordinary issued share capital of the bank, shall be entitled to appoint the Chairman from amongst the Directors appointed or elected to the Board.
Every shareholder owning eleven per cent (11%) of the ordinary issued share capital, shall be entitled to appoint one Director for each and every eleven per cent (11%) of the ordinary issued share capital of the bank owned by such shareholder. Any fractional shareholding not so utilised in the appointment of Director(s) shall be entitled to participate in the voting for the election of further Directors.
There is a Restricted Shares scheme in existence whereby senior executives, to deliver sustainable long-term business performance, can be awarded shares in HSBC Holdings plc, depending on their performance. Due to the staggered vesting profile of these share awards, the employee becomes entitled to a portion of the award at the end of each year during the vesting period. During the 3-year period the employee has no voting rights whatsoever.
The rules governing the appointment of Board members are contained in Articles 77 to 80 of the bank’s Articles of Association. An extraordinary resolution approved by the shareholders in the general meeting is required to amend the Articles of Association.
The powers of the Directors are outlined in Articles 73, 74 and 85 of the bank’s Articles of Association. In terms of Article 12 of the said Articles of Association, the bank may, subject to the provisions of the Companies Act 1995, acquire or hold any of its shares.
The Collective Agreement regulates redundancies, early retirement, resignation or termination of employment of employees. There are no contracts between the bank and the Directors on the bank’s Board.
It is hereby declared that, as at 31 December 2012, the requirements pursuant to Listing Rules 5.64.7 and 5.64.10 did not apply to the bank.
Shareholder Register Information
Directors’ interest in the share capital of the company or in related companies at 31 December 2012:
Albert Mizzi 8,000 sharesPhilip Farrugia Randon 6,400 sharesSaviour sive Sonny Portelli 4,700 shares
Mr Charles John Farrugia has a non-beneficial interest of 7,511,587 ordinary shares in HSBC Bank Malta p.l.c. through the shareholding held by Amalgamated Investments Sicav p.l.c.
Mr Peter Paul Testaferrata Moroni Viani has a beneficial interest of 58,800 ordinary shares in HSBC Bank Malta p.l.c. through the shareholding of Testaferrata Moroni Viani (Holdings) Limited, 40,000 ordinary shares through the shareholding of Testaferrata Moroni Viani Limited, 40,000 ordinary shares through the shareholding of Viani Limited and 5,000 ordinary shares through the shareholding of Sales and Letting Limited.
He also has a non-beneficial interest of 150,000 ordinary shares in HSBC Bank Malta p.l.c. through the shareholding of Santumas Shareholdings p.l.c. under custodianship of HSBC Bank Malta p.l.c.

Report of the Directors (continued)
22
H S B C B A N K M A L T A P . L . C .
There was a change in Directors’ interest from 31 December 2012 to 31 January 2013. An increase of 700 shares from 149,300 to 150,000 in the shares of Santumas Shareholdings p.l.c. under custodianship of HSBC Bank Malta p.l.c. in which Mr Peter Paul Testaferrata Moroni Viani has a non-beneficial interest.
Shareholders holding five per cent (5%) or more of the equity capital at 31 January 2013:
HSBC Europe B.V. 70.03%
Number of shareholders at 31 January 2013:
One class of shares 10,200 shareholders(All shares have equal voting rights)
Number of shareholders analysed by range 16 Fe31 January 2013 2009 ___________________________________________
Range of shareholding Total shareholders Shares
1 – 500 2,111 648,427501 – 1,000 1,584 1,281,2641,001 – 5,000 4,100 10,315,0065,001 and over 2,405 279,595,303 ___________________________________________
Total Shareholding 10,200 291,840,000 Standard licence conditions
In accordance with SLC 7.35 of the Investment Services Rules For Investment Services Providers regulated by the Malta Financial Services Authority, license holders are required to include in the Report of the Directors breaches of standard license conditions. Accordingly, the Directors confirm that no breaches of the standard licence conditions and no other breach of regulatory requirements, which were subject to administrative penalty or regulatory sanction were reported.
Board of Directors
The Directors who served during the year and after year end are as follows:
Albert Mizzi (Chairman) Philip Farrugia RandonAlan Richards (resigned on 1 January 2012) Charles John FarrugiaMark Watkinson (appointed on 14 February 2012) Peter Paul Testaferrata Moroni VianiPhilip Farrugia (resigned on 28 June 2012) Saviour sive Sonny PortelliRanjit Gokarn (appointed on 28 June 2012) James Dunbar CousinPeter William Boyles
Senior management
As at 31 December 2012, the Executive Committee of the Bank was made up of the following people:
Mark Watkinson Chief Executive OfficerRanjit Gokarn Chief Operating OfficerChris Bond Head of Global Banking and MarketsMichel Cordina Head of Commercial BankingPaul Steel Head of Retail Banking and Wealth ManagementJosephine Magri Chief Financial OfficerStewart Luscott-Evans Chief Risk OfficerMark Sims Head of Human ResourcesJohn Sammut Head of Audit and Compliance

23
Auditors
KPMG have expressed their willingness to continue in office. A resolution proposing the reappointment of KPMG as auditors of the bank will be submitted at the forthcoming Annual General Meeting.
Going Concern
As required by Listing Rule 5.62, upon due consideration of the bank’s profitability and statement of financial position, capital adequacy and solvency, the Directors confirm the bank’s ability to continue operating as a going concern for the foreseeable future.
Statement by the Directors pursuant to Listing Rule 5.70.1
Pursuant to Listing Rule 5.70.1 there were no material contracts to which the bank, or anyone of its subsidiary undertakings, was party to and in which anyone of the Directors was directly or indirectly interested.
Statement by the Directors pursuant to Listing Rule 5.68
We, the undersigned declare that to be the best of our knowledge, the financial statements prepared in accordance with the requirements of International Financial Reporting Standards as adopted by the EU give a true and fair view of the assets, liabilities, financial position and profit or loss of the bank and its subsidiaries included in the consolidation taken as a whole and that this report includes a fair review of the development and performance of the business and the position of the bank and its subsidiaries included in the consolidation taken as a whole, together with a description of the principle risks and uncertainties that they face.
Signed on behalf of the Board on 4 March 2013 by:
Albert Mizzi, Chairman Mark Watkinson, Chief Executive Officer

24
H S B C B A N K M A L T A P . L . C .
Pursuant to the Malta Financial Services Authority Listing Rules, HSBC Bank Malta p.l.c. (the ‘bank’) as a company whose equity securities are listed on a regulated market endeavours to adopt the Code of Principles of Good Corporate Governance (the ‘Principles’) embodied in Appendix 5.1 to Chapter 5 of the Listing Rules. The bank is obliged in terms of Listing Rule 5.94 to prepare a report explaining how it has complied with the provisions of the said Code. The bank hereby includes a Statement divided in two sections: the first part detailing the effective measures adopted by the bank to ensure compliance with the Principles and the second part explaining the reasons behind instances of non-compliance.
As the Board of Directors (the ‘Board’) is committed to high standards of corporate governance, it believes in the adoption of the Principles and has endorsed them except where there exist particular circumstances that warrant non-adherence thereto. The Board believes that adherence to the Principles has been and will remain a top priority for the bank and considers it to be a responsibility which starts with the Board and permeates down throughout the bank. The Board is proud of the fact that the bank has a good corporate governance framework that ensures that Directors work collectively through an effective Board, oversee the management of the business, set the tone from the top, ensure the integrity of financial reporting, set a risk management framework for the bank and communicate with shareholders. The Board firmly believes that adherence to the Principles is crucial to ensure more transparent governance structures, increased accountability and improved relations within the market which should enhance market integrity and confidence.
Compliance with the Code
Principle 1: The BoardThe bank is headed by an effective Board which leads and controls the bank. All the Directors, individually and collectively, are of the appropriate calibre, with the necessary skills and experience to assist them in providing leadership, integrity and judgement in directing the bank.
Board members are accountable for their performance and that of their delegates. Besides having a broad knowledge of the bank’s business they are also conversant with the statutory and regulatory requirements regulating this business. They are stewards of the bank’s assets and endeavour to enhance shareholders’ value.
The Board determines the bank’s strategic aims and organisational structures and regularly reviews management performance. It ensures that the bank has the appropriate financial and human resources to meet its objectives. Moreover, it exercises prudent and effective controls which enable risk to be assessed and managed in order to achieve the short and long-term sustainability of the business.
The Board delegates specific responsibilities to a number of committees, notably the Audit and Risk Committee, the Remuneration Committee, the Executive Committee, the Asset and Liability Management Committee and the Risk Management Committee.
Further detail in relation to the Committees and the responsibilities of their respective boards can be found under Principle 8 of this Statement.
Principle 2: Chairman and Chief Executive OfficerThe position of the Chairman and that of the Chief Executive Officer are occupied by different individuals. There is a clear division of responsibilities between the running of the board and the Chief Executive Officer’s responsibility in managing the bank’s business. This separation of roles of the Chairman and Chief Executive Officer avoids concentration of authority and power in one individual and differentiates leadership of the board from the running of the business.
The Chairman exercises independent judgement even though he is appointed by the majority shareholder. He leads the Board, sets the agenda and ensures that the directors receive precise, timely and objective information and at the same time ensures effective communication with shareholders. During Board meetings, he leads the Board and encourages active engagement by all Board members for the discussion of complex and contentious issues and stimulates constructive challenge of senior management.
On the other hand, the Chief Executive Officer is Chairman of most of the Board Committees and subsidiary companies. His main role and responsibility is to execute agreed strategy and manage the business. He is also responsible for the recruitment and appointment of senior management.
Statement of Compliance with the Code of Principles of Good Corporate Governance

25
Principle 3: Composition of the Board The Board considers that experience has shown that the size of the Board is the most appropriate to ensure an effective management and oversight over the bank’s operations.
The Board is composed of individuals who have a range of skills, competence, knowledge and experience that enable them to fulfil their roles diligently and are capable of understanding and fully appreciating the business risk issues and key performance indicators.
In line with Principle 3, the Board is composed of a non-executive Chairman, three executive Directors, and five independent non-executive Directors. These non-executive Directors bring an external perspective, constructively challenge and help develop proposals on strategy, scrutinise the performance of management and monitor the risk profile and the reporting of performance.
The independent non-executive Directors are the following:
Sonny Portelli
Philip Farrugia Randon
Peter Paul Testaferrata Moroni Viani
James Dunbar Cousin
Charles John Farrugia
In determining the independence or otherwise of its directors, the Board has considered, inter alia, the principles relating to independence embodied in the code, the Group’s own practice as well as general good practice principles.
The Board considers that the fact that one of the non-executive Directors was a former employee of the bank in the last three years does not undermine the said Director’s ability to exercise independent judgement when considering the issues brought before the Board.
In terms of Principle 3.4 each non-executive Director has confirmed in writing to the Board that he undertook:
a) to maintain in all circumstances his independence of analysis, decision and action;
b) not to seek or accept any unreasonable advantages that could be considered as compromising his independence; and
c) to clearly express his opposition in the event that he finds that a decision of the Board may harm the bank.
Principle 4: The Responsibilities of the BoardThe Board concentrates primarily on strategy, policy setting, business plans and financial information. It reviews and evaluates corporate strategy, major operational and functional plans, risk policy and financial performance objectives. It also monitors implementation of such objectives and corporate performance within the parameters of all relevant laws, regulations and codes of best practice. The board ensures that a balance is maintained between enterprise and control.
The Board’s informed assessment of management’s performance results from a clear internal and external reporting system. The Board continuously assesses and monitors the bank’s present and future operations, opportunities, threats and risks in the external environment and current and future strengths and weaknesses. The evaluation of the management’s implementation of corporate strategy and financial obligations is based on the use of key performance indicators enabling the bank to adopt expedient corrective measures. These key business risk and performance indicators are benchmarked against industry norms so as to ensure that the bank’s performance is effectively evaluated.
The Board ensures that the bank has appropriate policies and procedures in place that guarantee that the bank and its employees maintain the highest standards of corporate conduct and compliance with the applicable laws, regulations, business and ethical standards.

26
H S B C B A N K M A L T A P . L . C .
Principle 5: Board MeetingsThe Board meets on a quarterly basis, unless further meetings are required to discharge its duties effectively.
The Chairman ensures that all relevant issues are on the agenda, supported by all the available information. The agenda strikes a balance between long-term strategic objectives and shorter-term performance issues. Notice of the dates of Board meetings together with supporting materials are circulated to the Directors well in advance of the meetings.
Minutes are prepared during Board meetings that record faithfully attendance, discussed matters and decisions. These minutes are subsequently circulated to all the Directors as soon as practicable after the meeting.
During the period under review the Board held five meetings. Besides Board meetings directors participate in strategy sessions and seminars on financial matters. They also attend other bank functions like the Let’s Lead Conference and meetings with the bank’s Talent Pool. All the directors dedicate the necessary time and attention to their duties as directors of the bank.
Directors’ attendance at Board Meetings:
Members Attended
Albert Mizzi 5
Mark Watkinson 5
Peter W. Boyles 4 (out of 5)
Philip Farrugia* 2 (out of 2)
Ranjit Gokarn* 3 (out of 3)
Charles John Farrugia 4 (out of 5)
Philip Farrugia Randon 4 (out of 5)
Peter Paul Testaferrata Moroni Viani 5
Saviour sive Sonny Portelli 5
James Dunbar Cousin 5
*Mr Philip Farrugia resigned from the post of Director and Chief Technology and Services Officer of the bank, with effect from 28 June 2012. Mr Ranjit Gokarn was appointed Chief Operating Officer with effect from 22 May 2012 and Director with effect from 28 June 2012.
Principle 6: Information and Professional DevelopmentThe Board appoints the Chief Executive Officer of the bank upon guidance and recommendation from the HSBC Group. This enables the bank to avail itself of the vast wealth of competence, talent and experience found across the Group.
Full, formal and tailored induction programmes, with particular emphasis on the systems of risk management and internal controls are arranged for newly appointed Directors. The programmes consist of a series of meetings with senior executives to enable new Directors to familiarise themselves with the bank’s strategy, risk appetite, operations and internal controls. Directors also receive comprehensive guidance on Directors’ duties and liabilities.
Directors also have access to the advice and services of the Company Secretary who is responsible for adherence to Board procedures as well as effective information flows within the Board, its Committees and with senior management. The Company Secretary also coordinates a development programme based on the Director’s individual needs.
Directors are given opportunities to update and develop their skills and knowledge, through briefings by senior executives and externally run seminars throughout their directorship. Moreover, Directors have access to independent professional advice, at the bank’s expense.
The Chairman of the Board and the Chairman of the Audit and Risk Committee attended on an annual basis the Group Chairman’s Non-Executive Directors’ Forum and the Audit Committee Chairmen Forum where they are updated on the latest Group’s strategy and global financial and economic developments.
As part of succession planning and talent management the Board and the Chief Executive Officer ensure that the bank implements appropriate schemes to recruit, retain and motivate high quality executive officers, to encourage members of management to move to the higher ranks within the organisation and to maintain high morale amongst the bank’s staff.
Statement of Compliance with the Code of Principles of Good Corporate Governance (continued)

27
Principle 7: Evaluation of the Board PerformanceThe Board undertook an evaluation of its own performance, the Chairman’s performance and that of its Committees. The evaluation exercise was conducted through a Board Effectiveness Questionnaire modelled on a Questionnaire used by the HSBC Group.
No material changes were required from an analysis of the responses to the Effectiveness Questionnaire.
Principle 8: CommitteesThe Board delegates specific responsibilities to Committees, which operate under their respective formal terms of reference. The Board has established the following Committees:
Audit and Risk CommitteeThe Audit and Risk Committee (previously known as the Audit Committee) met six times during 2012. Its Terms of Reference were originally modelled mainly on the recommendations in the Cadbury Report, the UK Walker Review and are complaint with the Listing Rules.
The primary purpose of this Committee is to protect the interests of the bank’s shareholders and assist the Directors in conducting their role effectively so that the bank’s decision-making capability and the accuracy of its reporting and financial results are maintained at a high level at all times.
The Audit and Risk Committee also scrutinizes and approves related party transactions. It considers the materiality and the nature of the related party transactions carried out by the bank to ensure that the arm’s length principle is adhered to at all times.
The members of the Audit and Risk Committee are Mr Saviour sive Sonny Portelli (Chairman), Dr Philip Farrugia Randon LL.D. and Mr Peter Paul Testaferrata Moroni Viani who are independent non-executive directors. Senior Managers of the bank are invited to attend as directed by the committee. The Chief Executive Officer, the Chief Operating Officer, the Chief Risk Officer and a representative of the external auditors attend the meetings. In line with Listing Rule 5.131, the Head of Internal Audit is always present for the meetings and has a right of direct access to the Chairman of the Committee at all times.
Mr Portelli was appointed by the Board to chair the Committee. Mr Portelli is an independent director and competent in accounting and/or auditing in terms of Listing Rule 5.117 on the basis that he has a long and distinguished career in both public companies and private enterprise. Presently, Mr Portelli is also Chairman of the Malta Council for Economic and Social Development. Mr Portelli has served on the bank’s Board of Directors since October 2006 where his contributions have demonstrated that he is highly competent in accounting and au courant with accounting standards and practices and that he also possesses the qualities and experience required to discharge his duties as Chairman of this Committee.
As Chairman of the Audit and Risk Committee Mr Portelli attends the Group’s annual Audit and Risk Committee Chairmen’s Forum. This provides the Chairman with the latest updates on key considerations, priorities and challenges facing the Committee.
In terms of Listing Rule 5.127.7, the Audit and Risk Committee is responsible for developing and implementing a policy on the engagement of the external auditor to supply non-audit services. Since HSBC Holdings plc is a Securities Exchange Commission (SEC) registered company, non-audit services provided by the external auditor are regulated in terms of the SEC rules.
Remuneration Committee (REMCO)The Remuneration Committee is dealt with under the Remuneration Report, which also includes the Remuneration Statement in terms of Code Provisions 8.A.3 and 8.A.4.
Executive Committee (EXCO)The Executive Committee meets on a monthly basis to oversee the overall day-to-day management of the bank in accordance with such policies and directions as the Board may from time to time determine. The Chief Executive Officer chairs this committee which is composed of the Chief Operating Officer together with the senior management of the bank.
Risk Management CommitteeThis Committee (previously split into the Credit Risk Management Committee and the Group Risk Management Committee) meets on a monthly basis and is chaired by the Chief Executive Officer, with the Chief Risk Officer acting as Deputy Chairman. Membership also includes the Chief Operating Officer, the Chief Financial Officer, the Heads of

28
H S B C B A N K M A L T A P . L . C .
Statement of Compliance with the Code of Principles of Good Corporate Governance (continued)
Business from Retail Banking and Wealth Management, Commercial Banking and Global Banking and Markets, the Head of Wholesale and Markets Risk, the Head of Credit Risk Management Analytics and Systems, the Head of Audit and Compliance and the Head of Security and Fraud Risk.
This Committee is responsible for all risks in all businesses, functions and subsidiaries under the ownership of HSBC Bank Malta p.l.c. including inter alia Credit Risk, Market Risk, Operational Risk, Concentration Risk, Legal and Regulatory Risk, Security and Fraud Risk and Reputational Risk, the setting and monitoring of a Risk Appetite Framework for EXCO/Board approval, sign off on material credit risk models, consideration of top and emerging risks, risk map and scenario analysis. Individual risk acceptance and approval is not within the terms of reference of the Committee, and continues to be approved under existing delegated authorities within the management structure of the bank.
Asset and Liability Management Committee (ALCO)This management Committee reviews the financial risks of the group in Malta and ensures their prudent management: interest rate risk, liquidity and funding risk, foreign exchange risk, capital solvency, market sector risk and country risk. Furthermore, ALCO monitors the external environment and measures the impact on profitability of factors such as interest rate volatility, market liquidity, exchange rate volatility, monetary and fiscal policies and competitor banks activity.
The Chief Executive Officer has primary responsibility for ensuring efficient development of asset and liability management. Membership consists of senior executives with responsibility for the following functions: corporate banking, retail banking, treasury, financial control, marketing, and credit. The ALCO, which is chaired by the Chief Executive Officer and deputised by the Chief Operating Officer, meets once a month.
Principles 9 and 10: Relations with Shareholders and with the Market, and Institutional ShareholdersThe bank maintains ongoing communication with its shareholders and the market on its strategy and performance in order to enhance trust and confidence in the bank. During the period under review the bank has issued various company announcements and media releases to explain ongoing corporate developments and material events and transactions which have taken place and their impact on the financial position of the bank.
The principal contact with shareholders takes place through the Annual General Meeting (further detail is provided under the section regarding General Meetings) and Extraordinary General Meetings when necessary. Furthermore, communication with shareholders takes place through the Annual Report and Accounts being sent to every shareholder, which are physically delivered to the shareholders and which can be accessed by shareholders through the bank’s website, primarily the Investor Relations’ section, and a specific periodical shareholder publication entitled “l-Azzjonist”.
The bank also holds meetings for stockbrokers, financial intermediaries and the media to explain the salient features of the interim and annual financial results.
The bank maintains an open channel of communication with its shareholders through the Office of the Company Secretary and through the Head of Communications.
The Chairman ensures that the views of shareholders are communicated to the board as a whole. Moreover, the Chairman arranges for all Directors to attend the Annual General Meeting and for the Chairmen of the Audit and Risk Committee and the Remuneration Committee to be available to answer questions. The conduct of the meeting is conducive to valid discussion and appropriate decision making.
In terms of the bank’s Articles of Association the Directors shall on the requisition of members of the company holding not less than one-tenth of the paid up share capital proceed duly to convene an Extraordinary General Meeting of the bank. Minority shareholders are not prohibited from formally presenting an issue to the Board of Directors.
Principle 11: Conflicts of InterestsDirectors are aware that their primary responsibility is always to act in the interest of the bank and its shareholders as a whole irrespective of who appointed them to the board. This entails that they avoid conflicts of interest at all times and that their personal interests never take precedence over those of the bank and its shareholders.
In line with HSBC Group best practice the Board has during this year approved a Conflicts Policy. In terms of this policy a Director is to avoid situations in which he has, or could have, a direct or indirect interest that conflicts, or possibly may conflict, with the interest of the bank.

29
By virtue of the bank’s Articles of Association a Director is bound not to vote at a Board meeting on any contract or arrangement or any other proposal in which he has a material interest, either directly or indirectly.
On joining the Board and regularly thereafter, Directors are informed and reminded of their obligations on dealing in securities of the bank within the parameters of law and the Listing Rules. A proper procedure of reporting advance notices to the Chairman by a Director who intends to deal in the bank’s shares has been endorsed by the Board in line with the Principles, the Listing Rules and the internal code of dealing.
Principle 12: Corporate Social ResponsibilityHSBC’s Corporate Social Responsibility (‘CSR’) activities take place within the context of the Group wide strategy. In Malta the bank fulfils the Group’s CSR strategy primarily through the HSBC Malta Foundation.
Sustainability is core to the way we operate at HSBC and it is recognised that the bank has a responsibility that spreads far wider. The three pillars of the HSBC Malta Foundation aim to improve the quality of life and education for children, especially those disadvantaged, to promote and work towards a more sustainable environment and to preserve Malta’s rich and unique historical heritage.
Voluntary work is highly encouraged and pride is taken in HSBC staff who contribute to the charities and causes that they feel passionate about and are encouraged to take an active role in initiatives supported by the Foundation with an extra day’s leave granted for voluntary work. Other companies are encouraged to join in with the Foundation in various activities and projects to further strengthen its support to the community.
The Foundation works with the wider Group to make the most of the resources and capabilities of a global bank for the benefit of the local Maltese community with various signature projects having a significant impact on a large number of people thus showing the bank’s strong commitment towards the community.
Non-Compliance with the Code
Principle 4 (Code Provision 4.2.7)Code Provision 4.2.7. recommends “the development of a succession policy for the future composition of the Board of Directors and particularly the executive component thereof, for which the Chairman should hold key responsibility”.
In view of the fact that appointment of Directors is a matter reserved exclusively to the bank’s shareholders (except where the need arises to fill a casual vacancy) the bank does not consider it appropriate to adopt such a succession policy. However, as explained under Principle 6 the bank continues to pursue an active succession policy for senior executive positions, especially by seeking to post local senior staff members abroad within the Group in order to enhance their international banking experience.
Principle 8B (Nomination Committee)The Memorandum of Association of the bank specifically regulates the appointment of Directors. The Board consists of not more than nine Directors who are appointed/elected by the shareholders. Unless appointed for a shorter or longer period but not exceeding three years, a Director shall hold office from the end of one Annual General Meeting to the end of the next. Every shareholder owning 11% of the ordinary share capital is entitled to appoint one Director for each 11% shareholding. The majority shareholder therefore has the right to appoint six Directors. Furthermore, any excess fractional shareholding not so utilised may be used to participate in the voting for the election of further Directors. Shareholders who own less than 11% of the ordinary share capital participate in the election of the remaining three Directors.
The largest single shareholder (subject to a minimum 33% holding of the ordinary issued share capital of the bank), is entitled to appoint a Chairman from amongst the Directors appointed or elected to the Board. Every poll for the election of Directors is overseen by the bank’s external auditors.
Within this context, the Board does not deem it necessary to appoint a Nomination’s Committee.
Principle 9 (Code Provision 9.2)This Code Provisions recommends the bank to have in place a mechanism to resolve conflicts between minority shareholders and controlling shareholders. Although the bank does not have such mechanism in place there is ongoing open dialogue between the bank’s senior management and the non-executive directors to ensure that no such conflicts arise.

30
H S B C B A N K M A L T A P . L . C .
Statement of Compliance with the Code of Principles of Good Corporate Governance (continued)
Listing Rule 5.97.4
Internal Control
The Board is ultimately responsible for the bank’s system of internal control and for reviewing its effectiveness. Such procedures are designed to manage rather than to eliminate the risk of failure, to achieve business objectives and can only provide reasonable and not absolute assurance against material error, losses or fraud.
The bank has delegated specific, clear and unequivocal authority to the Chief Executive Officer to manage the activities of the bank within the limits set by it. Functional, operating and financial reporting standards are applicable within all entities of the HSBC Group. These are supplemented by operating standards set by the bank’s management, as required.
Systems and procedures are in place in the bank to identify, control and to report on the major risks including credit, market, liquidity, operational error and fraud. Exposure to these risks is monitored by the Executive Committee, the Asset and Liability Management Committee and the Risk Management Committee.
Comprehensive annual financial plans are prepared, reviewed and approved by the Board. Results are monitored and reports on progress compared with plan are prepared monthly. Financial accounting and reporting and certain management reporting standards have been established. Centralised functional control is exercised over all computer system developments and operations. Common systems are employed where possible for similar business processes.
Responsibilities for financial performance against plans and for capital expenditure, credit exposures and market risk exposures are delegated with limits to line management. In addition, functional management in the bank has been given the responsibility to implement HSBC policies, procedures and standards in the areas of finance; legal and regulatory compliance; internal audit; human resources; credit risk; market risk; operational risk; computer systems and operations; property management; and for certain HSBC Group business and product lines.
The Chief Risk Officer is responsible for the management of specific risks within the bank including credit risk in the wholesale and retail portfolios, markets risk and operational risk. Risks are monitored via regular Risk Management Committee meetings and through reporting to the Executive Committee and to the Board.
The internal audit function monitors compliance with policies and standards and the effectiveness of internal control structures within the bank and its subsidiaries. The work of the internal audit function focuses on areas of greatest risk as determined by a risk management approach.
The bank’s Compliance Department ensures that HSBC Bank Malta Group and its employees maintain the highest standards of corporate conduct including compliance with all the local and international regulatory obligations and HSBC Group ethical standards and regulations.
Through the Audit and Risk Committee, the Board reviews the processes and procedures to ensure the effectiveness of the system of internal control of the bank and its subsidiaries, which are monitored by internal audit.
Listing Rule 5.97.5The information required by this Listing Rule is found in the Report of the Directors.
General Meetings
The General Meeting is the highest decision making body of the bank. A General Meeting is called by twenty-one days’ notice and it is conducted in accordance with the Articles of Association of the bank.
The Annual General Meeting deals with what is termed as “ordinary business”, namely the receiving or adoption of the annual financial statements, the declaration of a dividend, the appointment of the Board (which may or may not involve an election), the appointment of the external auditors and the granting of the authority to the Board to fix the external auditors’ emoluments. Other business which may be transacted at a General Meeting will be dealt with as Special Business.
All shareholders registered in the shareholders’ Register on the record date as defined in the Listing Rules, have the right to attend, participate and vote in the General Meeting. A shareholder or shareholders holding not less than 5% in nominal value of all the shares entitled to vote at the General Meeting, may request the bank to include items on the agenda of a General Meeting and/or table draft resolutions for items included in the agenda of a General Meeting. Such requests are to be received by the bank at least forty six days before the date set for the relative General Meeting.
A shareholder who cannot participate in the General Meeting can appoint a proxy by written or electronic notification to the bank. Every shareholder represented in person or by proxy is entitled to ask questions which are pertinent and related to items on the agenda of the General Meeting and to have such questions answered by the Director or such persons as the Directors may delegate for that purpose.
31
H S B C B A N K M A L T A P . L . C .
Remuneration Report
1. Terms of Reference and Membership
The Remuneration Committee (the Committee) is primarily responsible to make recommendations on the reward policy, on fixed and variable pay and for ensuring their implementation.
The Committee’s membership consists of an independent Chairman and two independent non-executive Directors. During the period under review the Committee was composed of Mr Sonny Portelli as Chairman and Dr Philip Farrugia Randon and Mr Peter Paul Testaferrata Moroni Viani as members who are non-executive Directors.
The Committee is authorised to obtain such legal, remuneration or other professional advice as it deems appropriate.
2. Meetings
Two meetings were held by the Committee during 2012 and attendance was as follows:
Saviour sive Sonny Portelli (Chairman) (2 out of 2) Philip Farrugia Randon (2 out of 2) Peter Paul Testaferrata Moroni Viani (2 out of 2)
Mr Mark Watkinson, CEO, Mr Ranjit Gokarn, COO and Mr Mark Sims, Head of HR were in attendance at the two meetings. The CEO and COO abstained from participating in the discussion regarding their own remuneration.
3. Activities
The Committee considered various matters including the following:-
• Remuneration Report for Financial Year 2012• Total Variable Pay spend for Performance Year 2012• Fixed and Variable Pay for Senior Management (i.e. Business Functional Heads)• Fixed and Variable Pay for Middle Management• Fixed and Variable Pay for Junior Managers and Clerical employees• Variable Pay for Global Markets• Retention of key senior employees by devising appropriate remuneration packages• The Committee’s Terms of Reference • The Remuneration Policy of HSBC Life Assurance (Malta) Ltd
In determining remuneration levels for performance year 2012 the Committee applied HSBC Group’s (the ‘Group’) remuneration strategy and policy, taking into account the interests of the shareholders and the broader external context.
4. Remuneration Statement
4.1 Reward Policy The reward policy which formalised the bank’s current practice and policies was approved by the Board of the bank in 2011. There were no significant changes to this policy during 2012 and none are being envisaged for 2013.
The bank’s reward policy was formulated in accordance with the Banking Rule BR/12, the Capital Requirements Directive and the Group’s reward strategy. This strategy provides a reward framework for the bank aimed at supporting sustainable performance over the long-term. Performance is judged not only on what is achieved over the short and medium term, but also on how it is achieved, as the latter contributes to the sustainability of the bank. This reward framework includes the following key elements:
a. an assessment of reward with reference to clear annual and long-term objectives summarised in performance scorecards and to adherence to the HSBC Group Values of being ‘open, connected and dependable’ and acting with ‘courageous integrity’;
b. a focus on total compensation (fixed pay, variable pay and the value of long-term incentives) with variable pay (namely bonus and the value of long-term incentives) differentiated by company and individual performance. Variable pay is also shaped by risk considerations in that performance is assessed taking risk into account; and
c. a total remuneration package (salary, bonus, long-term incentive awards and other benefits) which is competitive in relation to comparable organisations in the local market, and where appropriate in line with HSBC Groups international secondment approach.

32
H S B C B A N K M A L T A P . L . C .
Remuneration Report (continued)
In order to ensure clarity over remuneration, there are four elements of remuneration, with the first three being performance related:
1. Fixed Pay
2. Bonus (Variable Pay)
3. HSBC Share Awards
4. Benefits
The Committee considers the total variable pay spend relative to the bank’s performance with the key driver being Profit before Tax. Other key measures are taken into account such as Efficiency Ratio, Cost Target, Revenue Target and Return on Risk Weighted Assets.
In order to incentivise senior executives to deliver sustainable long-term business performance, where appropriate, a portion of the variable pay is subject to deferral and is awarded in the form of HSBC Shares under the Group’s discretionary incentive plan.
Senior and Middle Management are eligible for an annual fixed pay review and variable pay award. A Fixed pay pool is determined by the Committee based on a percentage of the total salary costs of the Senior and Middle Managers. The variable pay is also established by the Committee and determined by company and individual performance of the Senior and Middle Managers against objectives which are aligned with the Group’s strategy.
For clerical employees and junior managers fixed pay is determined by a Collective Agreement and awards are differentiated by individual performance and grade. The Committee considers the allocation of variable pay to this part of the workforce collectively taking account of company profitability and key measures mentioned above. Individual awards are based on the achievement of both financial and non-financial objectives.
The determination of the variable pay spend for Global Markets takes account of the local performance of the business as well as the overall profitability of the Global Markets business across the world.
The Chief Executive Officer’s reward package is also reviewed and approved by the HSBC Group Remuneration Committee.
4.2 Code Provision 8.A.5
Emoluments of Senior Executives
Fixed Remuneration Variable Remuneration Share Options Others
§317,554 §380,351 §49,886 §512,368
Reference to “Senior Executives” shall mean the Chief Executive and the Chief Operating Officer (appointed May 2012) and the Chief Technology and Services Officer (retired June 2012) who are also executive Directors.
Emoluments of Directors
Fixed Remuneration Variable Remuneration Share Options Others
§169,200 None None None
Details of Directors’ fees for the financial year under review were as follows:
§
Albert Mizzi 36,000Saviour sive Sonny Portelli 39,600Peter Paul Testaferrata Moroni Viani 28,800Philip Farrugia Randon 28,800James Dunbar Cousin 18,000Charles John Farrugia 18,000 ____________
Total 169,200 _______

33
Fees payable to Directors or Committee members who are not employees of the bank are set by reference to market practice, taking into account the time commitment and complexity of the work undertaken and relative fees paid throughout the HSBC Group.
The Directors’ fees are approved in aggregate by the shareholders at the Annual General Meeting. Those Directors who are employed with the bank are not paid any fees for their directorship.
5. Policy of Senior Executive Contracts
Standard contracts for Senior Executives employed locally would generally be indefinite. Normal retirement from the bank would be in line with local legislation. A three month notice period is required for Senior Executives, who would similarly be entitled to a notice of a minimum of three months in the event that the bank terminates the employment on grounds of redundancy.
International assignees appointed to Senior Executive positions are covered by the standard Group contracts policy. The period of notice required to be given to terminate by either party can be up to six months.

34
H S B C B A N K M A L T A P . L . C .
Directors’ Responsibilities Statement
The Companies Act, 1995 requires the Directors of HSBC Bank Malta p.l.c. (the ‘bank’) to prepare financial statements for each financial period which give a true and fair view of the financial position of the bank and the group as at the end of the financial period and of the profit or loss of the bank and the group for that period in accordance with the requirements of International Financial Reporting Standards as adopted by the EU.
The Directors are responsible for keeping proper accounting records which disclose with reasonable accuracy, at any time, the financial position of the bank and the group and to enable them to ensure that the financial statements have been properly prepared in accordance with the provisions of the Companies Act, 1995 and the Banking Act, 1994.
The Directors are also responsible for safeguarding the assets of the group and hence for taking reasonable steps for the prevention and detection of fraud and other irregularities.
The Directors, through oversight of management, are responsible to ensure that the bank establishes and maintains internal control to provide reasonable assurance with regard to reliability of financial reporting, effectiveness and efficiency of operations and compliance with applicable laws and regulations.
Management is responsible, with oversight from the Directors, to establish a control environment and maintain policies and procedures to assist in achieving the objective of ensuring, as far as possible, the orderly and efficient conduct of the group’s business. This responsibility includes establishing and maintaining controls pertaining to the bank’s objective of preparing financial statements as required by the Companies Act, 1995 and managing risks that may give rise to material misstatements in those financial statements. In determining which controls to implement to prevent and detect fraud, management considers the risks that the financial statements may be materially misstated as a result of fraud.
Signed on behalf of the Board of Directors by:
Albert Mizzi, Chairman Mark Watkinson, Chief Executive Officer

35
H S B C B A N K M A L T A P . L . C .
Income Statements for the year 1 January 2012 to 31 December 2012
Group Bank ________________________________ ________________________________ 2012 2011 2012 2011 ______________ ______________ ______________ ______________
Note §000 §000 §000 §000Interest and similar income– on loans and advances, balances with Central Bank of Malta, Treasury Bills and other instruments 6 151,261 153,397 151,232 153,399– on debt and other fixed income instruments 6 23,376 22,565 21,715 19,208Interest expense 7 (41,537) (46,703) (41,897) (47,053) ______________ ______________ ______________ ______________
Net interest income 133,100 129,259 131,050 125,554
Fee and commission income 32,572 36,597 28,610 32,653Fee and commission expense (2,081) (3,047) (1,819) (2,814) ______________ ______________ ______________ ______________
Net fee and commission income 8 30,491 33,550 26,791 29,839
Dividend income 9 – 1 20,896 24,987Trading profits 10 9,316 8,306 9,316 8,306Net income/(expense) from insurance financial instruments designated at fair value 12 42,917 (6,455) – – Net gains/(losses) on sale of available-for-sale financial investments 11 4,049 (2,107) 3,344 (2,113)Net earned insurance premiums 12 67,284 64,459 – – Net other operating income 12 3,489 23,575 677 10,057 ______________ ______________ ______________ ______________
Total operating income 290,646 250,588 192,074 196,630
Net insurance claims incurred and movement in policyholders’ liabilities 12 (92,970) (55,723) – – ______________ ______________ ______________ ______________
Net operating income 197,676 194,865 192,074 196,630
Employee compensation and benefits 13 (54,680) (58,807) (51,344) (55,910)General and administrative expenses (34,951) (33,333) (32,855) (31,011)Depreciation (4,059) (5,200) (4,052) (5,196)Amortisation (2,566) (860) (2,541) (815) ______________ ______________ ______________ ______________
Net operating income before impairment charges and provisions 101,420 96,665 101,282 103,698
Net impairment 14 (5,638) (8,250) (5,638) (4,103)Net provisions for liabilities and other charges (447) (110) (446) (96) ______________ ______________ ______________ ______________
Profit before tax 15 95,335 88,305 95,198 99,499Tax expense 16 (33,733) (30,738) (33,642) (32,940) ______________ ______________ ______________ _____________
Profit for the year 61,602 57,567 61,556 66,559 _________ _________ _________ _________Profit attributable to shareholders 61,602 57,567 61,556 66,559 _________ _________ _________ _________Earnings per share 17 21.1c 19.7c 21.1c 22.8c _________ _________ _________ _________The notes on pages 41 to 101 are an integral part of these financial statements.

36
H S B C B A N K M A L T A P . L . C .
Statements of Comprehensive Income for the year 1 January 2012 to 31 December 2012
Group Bank ________________________________ ________________________________ 2012 2011 2012 2011 ______________ ______________ ______________ ______________
§000 §000 §000 §000
Profit attributable to shareholders 61,602 57,567 61,556 66,559 _________ _________ _________ _________Other comprehensive income/(expense) Available-for-sale investments: – fair value gains 16,671 1,193 16,136 4,778– fair value (gains)/losses transferred to profit or loss on disposal (4,049) 2,107 (3,344) 2,113– amounts transferred to profit or loss on impairment – 4,179 – –– income taxes (4,418) (2,580) (4,477) (2,374)Properties: – revaluation (4,022) – (4,022) –– income taxes 583 – 583 – ______________ ______________ ______________ ______________
Other comprehensive income for the year, net of tax 4,765 4,899 4,876 4,517 _________ _________ _________ _________Total comprehensive income for the year, net of tax 66,367 62,466 66,432 71,076 _________ _________ _________ _________The notes on pages 41 to 101 are an integral part of these financial statements.

37
H S B C B A N K M A L T A P . L . C .
Statements of Financial Position at 31 December 2012
Group Bank ________________________________ ________________________________ 2012 2011 2012 2011 ______________ ______________ ______________ ______________
Note §000 §000 §000 §000AssetsBalances with Central Bank of Malta, Treasury Bills and cash 18 106,991 233,388 106,990 233,387Cheques in course of collection 7,211 22,685 7,211 22,685Derivatives 19 17,615 17,136 17,615 17,856Financial assets designated at fair value 20 454,591 370,080 – – Financial investments 21 987,471 936,830 962,721 883,747Loans and advances to banks 22 681,352 637,956 678,765 637,903Loans and advances to customers 23 3,354,413 3,344,290 3,354,413 3,344,290Shares in subsidiary companies 24 – – 35,707 35,707Intangible assets 25 91,210 89,011 11,943 12,497Property, plant and equipment 26 54,872 60,113 54,953 60,195Investment property 27 14,471 14,598 11,660 11,663Non-current assets held for sale 28 11,240 12,978 11,240 12,978Current tax assets 6,134 – 2,727 –Deferred tax assets 33 11,273 14,158 11,253 13,897Other assets 29 46,509 31,209 8,982 8,606Prepayments and accrued income 30 41,121 40,629 35,699 35,527 ______________ ______________ ______________ ______________
Total assets 5,886,474 5,825,061 5,311,879 5,330,938 _________ _________ _________ _________LiabilitiesDerivatives 19 17,857 17,810 18,172 17,810Deposits by banks 31 258,611 389,170 258,611 389,170Customer accounts 32 4,516,999 4,402,975 4,537,127 4,440,646Current tax liabilities 24 4,287 – 3,351 Deferred tax liabilities 33 24,363 18,113 – –Liabilities to customers under investment contracts 34 17,254 16,920 – –Liabilities under insurance contracts issued 35 493,254 436,672 – –Other liabilities 36 29,222 38,145 24,395 33,925Accruals and deferred income 37 33,559 36,045 32,143 35,218Provisions for liabilities and other charges 38 7,493 11,251 7,423 11,031Subordinated liabilities 39 87,240 87,208 87,987 87,933 ______________ ______________ ______________ ______________
Total liabilities 5,485,876 5,458,596 4,965,858 5,019,084 ______________ ______________ ______________ ______________
EquityCalled up share capital 40 87,552 87,552 87,552 87,552Revaluation reserve 41 37,637 32,872 36,975 32,099Retained earnings 41 275,409 246,041 221,494 192,203 ______________ ______________ ______________ ______________
Total equity 400,598 366,465 346,021 311,854 ______________ ______________ ______________ ______________
Total liabilities and equity 5,886,474 5,825,061 5,311,879 5,330,938 _________ _________ _________ _________Memorandum itemsContingent liabilities 42 104,569 130,763 106,272 132,466 _________ _________ _________ _________Commitments 43 1,073,831 1,118,779 1,081,194 1,118,779 _________ _________ _________ _________The notes on pages 41 to 101 are an integral part of these financial statements.
The financial statements on pages 35 to 101 were approved and authorised for issue by the Board of Directors on 4 March 2013 and signed on its behalf by:
Albert Mizzi, Chairman Mark Watkinson, Chief Executive Officer
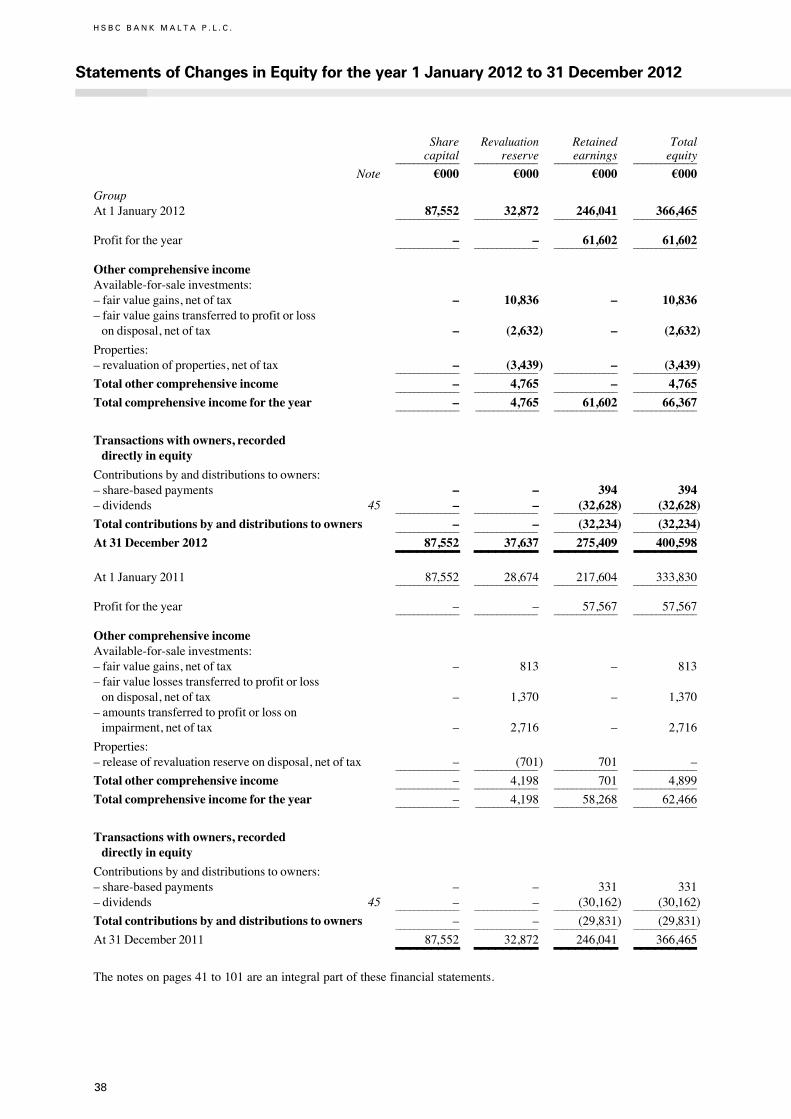
38
H S B C B A N K M A L T A P . L . C .
Statements of Changes in Equity for the year 1 January 2012 to 31 December 2012
Share Revaluation Retained Total capital reserve earnings equity ______________ ______________ ______________ ______________
Note §000 §000 §000 §000
GroupAt 1 January 2012 87,552 32,872 246,041 366,465 ______________ ______________ ______________ ______________
Profit for the year – – 61,602 61,602 ______________ ______________ ______________ ______________
Other comprehensive income Available-for-sale investments: – fair value gains, net of tax – 10,836 – 10,836– fair value gains transferred to profit or loss on disposal, net of tax – (2,632) – (2,632)
Properties: – revaluation of properties, net of tax – (3,439) – (3,439) ______________ ______________ ______________ ______________
Total other comprehensive income – 4,765 – 4,765 ______________ ______________ ______________ ______________
Total comprehensive income for the year – 4,765 61,602 66,367 ______________ ______________ ______________ ______________
Transactions with owners, recorded directly in equity
Contributions by and distributions to owners: – share-based payments – – 394 394 – dividends 45 – – (32,628) (32,628) ______________ ______________ ______________ ______________
Total contributions by and distributions to owners – – (32,234) (32,234) ______________ ______________ ______________ ______________
At 31 December 2012 87,552 37,637 275,409 400,598 _________ _________ _________ _________At 1 January 2011 87,552 28,674 217,604 333,830 ______________ ______________ ______________ ______________
Profit for the year – – 57,567 57,567 ______________ ______________ ______________ ______________
Other comprehensive income Available-for-sale investments: – fair value gains, net of tax – 813 – 813– fair value losses transferred to profit or loss on disposal, net of tax – 1,370 – 1,370– amounts transferred to profit or loss on impairment, net of tax – 2,716 – 2,716
Properties: – release of revaluation reserve on disposal, net of tax – (701) 701 – ______________ ______________ ______________ ______________
Total other comprehensive income – 4,198 701 4,899 ______________ ______________ ______________ ______________
Total comprehensive income for the year – 4,198 58,268 62,466 ______________ ______________ ______________ ______________
Transactions with owners, recorded directly in equity
Contributions by and distributions to owners: – share-based payments – – 331 331 – dividends 45 – – (30,162) (30,162) ______________ ______________ ______________ ______________
Total contributions by and distributions to owners – – (29,831) (29,831) ______________ ______________ ______________ ______________
At 31 December 2011 87,552 32,872 246,041 366,465 _________ _________ _________ _________The notes on pages 41 to 101 are an integral part of these financial statements.
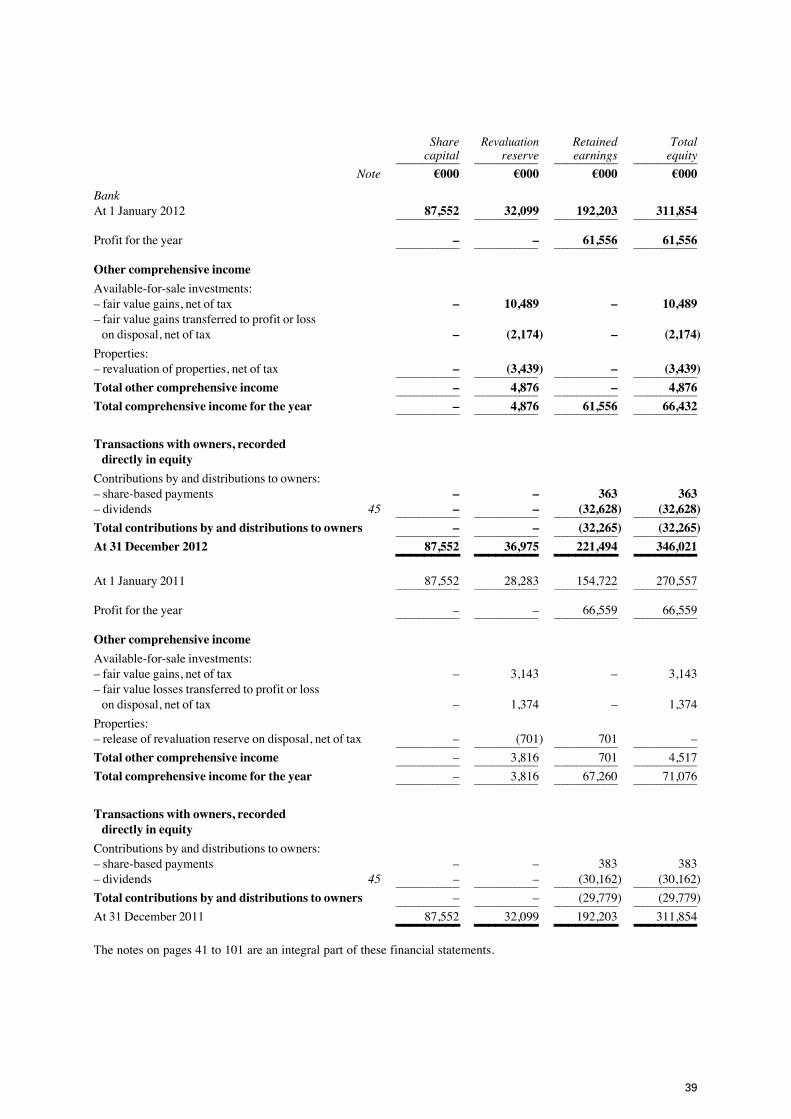
39
Share Revaluation Retained Total capital reserve earnings equity ______________ ______________ ______________ ______________
Note §000 §000 §000 §000
BankAt 1 January 2012 87,552 32,099 192,203 311,854 ______________ ______________ ______________ ______________
Profit for the year – – 61,556 61,556 ______________ ______________ ______________ ______________
Other comprehensive income
Available-for-sale investments: – fair value gains, net of tax – 10,489 – 10,489– fair value gains transferred to profit or loss on disposal, net of tax – (2,174) – (2,174)
Properties: – revaluation of properties, net of tax – (3,439) – (3,439) ______________ ______________ ______________ ______________
Total other comprehensive income – 4,876 – 4,876 ______________ ______________ ______________ ______________
Total comprehensive income for the year – 4,876 61,556 66,432 ______________ ______________ ______________ ______________
Transactions with owners, recorded directly in equity
Contributions by and distributions to owners: – share-based payments – – 363 363 – dividends 45 – – (32,628) (32,628) ______________ ______________ ______________ ______________
Total contributions by and distributions to owners – – (32,265) (32,265) ______________ ______________ ______________ ______________
At 31 December 2012 87,552 36,975 221,494 346,021 _________ _________ _________ _________At 1 January 2011 87,552 28,283 154,722 270,557 ______________ ______________ ______________ ______________
Profit for the year – – 66,559 66,559 ______________ ______________ ______________ ______________
Other comprehensive income
Available-for-sale investments: – fair value gains, net of tax – 3,143 – 3,143– fair value losses transferred to profit or loss on disposal, net of tax – 1,374 – 1,374
Properties: – release of revaluation reserve on disposal, net of tax – (701) 701 – ______________ ______________ ______________ ______________
Total other comprehensive income – 3,816 701 4,517 ______________ ______________ ______________ ______________
Total comprehensive income for the year – 3,816 67,260 71,076 ______________ ______________ ______________ ______________
Transactions with owners, recorded directly in equity
Contributions by and distributions to owners: – share-based payments – – 383 383 – dividends 45 – – (30,162) (30,162) ______________ ______________ ______________ ______________
Total contributions by and distributions to owners – – (29,779) (29,779) ______________ ______________ ______________ ______________
At 31 December 2011 87,552 32,099 192,203 311,854 _________ _________ _________ _________The notes on pages 41 to 101 are an integral part of these financial statements.

40
H S B C B A N K M A L T A P . L . C .
Statements of Cash Flows for the year 1 January 2012 to 31 December 2012
Group Bank ________________________________ ________________________________ 2012 2011 2012 2011 ______________ ______________ ______________ ______________
Note §000 §000 §000 §000Cash flows from/(used in) operating activities Interest, commission and premium receipts 264,547 266,521 188,640 196,076Interest, commission and claims payments (91,318) (76,988) (45,336) (49,450)Payments to employees and suppliers (94,419) (83,774) (88,953) (77,701) ______________ ______________ ______________ ______________
Operating profit before changes in operating assets/liabilities 78,810 105,759 54,351 68,925
(Increase)/decrease in operating assets:Financial assets designated at fair value (51,728) (76,592) – –Reserve deposit with Central Bank of Malta 43,305 (956) 43,305 (956)Loans and advances to customers and banks 19,009 (63,014) 18,943 (63,013)Treasury Bills 98,179 167,308 98,179 170,555Other receivables 98 (13,582) 15,022 (15,965)
(Decrease)/increase in operating liabilities:Customer accounts and deposits by banks 112,221 (59,710) 95,951 (76,971)Other payables (2,464) 3,212 (9,455) 7,325 ______________ ______________ ______________ ______________
Net cash from operating activities before tax 297,430 62,425 316,296 89,900Tax paid (39,076) (32,653) (33,736) (25,597) ______________ ______________ ______________ ______________
Net cash from operating activities 258,354 29,772 282,560 64,303 ______________ ______________ ______________ ______________
Cash flows from/(used in) investing activitiesDividends received 26 785 13,600 17,950Interest received from financial investments 41,356 34,624 29,775 24,403Purchase of financial investments (375,638) (599,079) (375,638) (599,079)Proceeds from sale and maturity of financial investments 335,059 344,079 306,239 302,557Purchase of property, plant and equipment, investment property and intangible assets (6,133) (9,031) (6,046) (8,986)Proceeds on sale of property, plant and equipment and intangible assets 502 2,094 502 2,094Proceeds on disposal of card acquiring business – 11,075 – 11,075 ______________ ______________ ______________ ______________
Net cash flows used in investing activities (4,828) (215,453) (31,568) (249,986) ______________ ______________ ______________ ______________
Cash flows used in financing activitiesDividends paid (32,628) (30,162) (32,628) (30,162) ______________ ______________ ______________ ______________
Cash used in financing activities (32,628) (30,162) (32,628) (30,162) ______________ ______________ ______________ ______________
Increase/(decrease) in cash and cash equivalents 220,898 (215,843) 218,364 (215,845) _________ _________ _________ _________Effect of exchange rate changes on cash and cash equivalents (583) 17,485 (583) 17,485Net increase/(decrease) in cash and cash equivalents 221,481 (233,328) 218,947 (233,330) ______________ ______________ ______________ ______________
220,898 (215,843) 218,364 (215,845)Cash and cash equivalents at beginning of year 207,763 423,606 207,709 423,554 ______________ ______________ ______________ ______________
Cash and cash equivalents at end of year 46 428,661 207,763 426,073 207,709 _________ _________ _________ _________ The notes on pages 41 to 101 are an integral part of these financial statements.

41
H S B C B A N K M A L T A P . L . C .
Notes on the Financial Statements
1 Reporting entity
HSBC Bank Malta p.l.c. (the ‘bank’) is a limited liability company domiciled and incorporated in Malta.
The consolidated financial statements of the bank as at and for the year ended 31 December 2012 comprise the bank and its subsidiaries (together referred to as the ‘group’ and individually as ‘group entities’).
2 Basis of preparation
a Statement of compliance
These financial statements have been prepared and presented in accordance with International Financial Reporting Standards as adopted by the EU (‘the applicable framework’).
All references in these financial statements to IAS, IFRS or SIC/IFRIC interpretations refer to those adopted by the EU.
These financial statements have also been drawn up in accordance with the provisions of the Banking Act, 1994 and the Companies Act, 1995, enacted in Malta.
b Basis of measurement
Assets and liabilities are measured at historical cost except for certain intangible assets measured at the present value of in-force long-term insurance business, and the following that are measured at fair value:
– Derivatives;
– Financial instruments designated at fair value through profit or loss;
– Available-for-sale financial investments;
– Property; and
– Liabilities to customers under investment contracts.
c Functional and presentation currency
The financial statements are presented in euro (§), which is the group’s functional currency.
d Use of estimates and assumptions
The preparation of financial statements in conformity with IFRSs requires the use of estimates and assumptions about future conditions. The use of available information and the application of judgement are inherent in the formation of estimates, actual results in the future may differ from estimates upon which financial information is prepared.
Estimates and underlying assumptions are reviewed on an ongoing basis. Revisions to accounting estimates are recognised in the period in which the estimate is revised and in any future periods affected.
Information about significant areas of estimation, uncertainty and critical judgments in applying accounting policies that have the most significant effect on the amount recognised in the financial statements are described in notes 4, 25 and 52.

Notes on the Financial Statements (continued)
42
H S B C B A N K M A L T A P . L . C .
3 Significant accounting policies
The accounting policies set out below have been applied consistently to all periods presented in these financial statements, and have been applied consistently by group entities.
a Basis of consolidation
i Subsidiaries
Subsidiaries are entities controlled by the bank. The financial statements of subsidiaries are included in the consolidated financial statements from the date that control commences until the date that control ceases.
The acquisition method of accounting is used when subsidiaries are acquired by the bank. The cost of an acquisition is measured at the fair value of the consideration, including contingent consideration, given at the date of exchange. Acquisition-related costs are recognised as an expense in profit or loss in the period in which they are incurred. The acquired identifiable assets, liabilities and contingent liabilities are generally measured at their fair values at the date of acquisition. Goodwill is measured as the excess of the aggregate of the consideration transferred, the amount of non-controlling interest and the fair value of HSBC’s previously held equity interest, if any, over the net of the amounts of the identifiable assets acquired and the liabilities assumed. The amount of non-controlling interest is measured either at fair value or at the non-controlling interest’s proportionate share of the acquiree’s identifiable net assets. In a business combination achieved in stages, the previously held equity interest is remeasured at the acquisition-date fair value with the resulting gain or loss recognised in the profit or loss. In the event that the amount of net assets acquired is in excess of the aggregate of the consideration transferred, the amount of non-controlling interest and the fair value of HSBC’s previously held equity interest, the difference is recognised immediately in profit or loss. Changes in a parent’s ownership interest in a subsidiary that do not result in a loss of control are treated as transactions between equity holders and are reported in equity.
ii Transactions eliminated on consolidation
Intra-group balances and income and expenses arising from intra-group transactions, are eliminated in preparing the consolidated financial statements. Unrealised losses are eliminated in the same way as unrealised gains, but only to the extent that there is no evidence of impairment.
b Financial instruments
i Non-derivative financial instruments
Non-derivative financial instruments are recognised on trade date when the group enters into contractual arrangements with counterparties. These financial instruments are recognised initially at fair value adjusted with, for instruments not at fair value through profit or loss, any directly attributable transaction costs. Subsequent to initial recognition non-derivative financial instruments are measured as described below:
Cash and cash equivalents
Cash and cash equivalents comprise cash balances, highly liquid investments and deposits with contractual maturity of less than three months. Loans and advances to banks and Amounts owed to banks that are repayable on demand or have a contractual maturity of three months or less and which form an integral part of the group’s cash management are included as a component of cash and cash equivalents for the purpose of the Statement of Cash Flows. Subsequent to initial recognition cash and cash equivalents are measured at amortised cost.
Trading assets and trading liabilities
Treasury Bills, debt securities, equity shares and short positions in securities are classified as held for trading if they have been acquired or incurred principally for the purpose of selling or repurchasing in the near term, or they form part of a portfolio of identified financial instruments that are managed together and for which there is evidence of a recent pattern of short-term profit-taking. Subsequent to initial recognition, their fair values are remeasured, and all gains and losses from changes therein are recognised in profit or loss in Trading profits as they arise.
Financial instruments designated at fair value through profit or loss
Financial instruments, other than those held for trading, are classified in this category if they meet one or more of the criteria set out below, and are so designated by management. The group designates financial instruments at fair value when the designation:

43
3 Significant accounting policies (continued)
b Financial instruments (continued)
i Non-derivative financial instruments (continued)
Financial instruments designated at fair value through profit or loss (continued)
– eliminates or significantly reduces valuation or recognition inconsistencies that would otherwise arise from measuring financial assets or financial liabilities, or recognising gains and losses on them, on different basis. Under this criterion, the only class of financial instruments designated by the group is financial assets and financial liabilities under investment contracts.
Liabilities to customers under linked contracts are determined based on the fair value of the assets held in the linked funds, with changes recognised in profit or loss. Liabilities to customers under other types of investment contracts would be measured at amortised cost. If no designation was made for the assets relating to the customer liabilities they would be classified as available-for-sale and the changes in fair value would be recorded directly in other comprehensive income. These financial instruments are managed on a fair value basis and management information is also prepared on this basis. Designation at fair value of the financial assets and liabilities under investment contracts allows the changes in fair values to be recorded in profit or loss and presented in the same line.
– applies to groups of financial assets, financial liabilities or combinations thereof that are managed, and their performance evaluated, on a fair value basis in accordance with a documented risk management or investment strategy, and where information about the groups of financial instruments is reported to management on that basis. Under this criterion, certain financial assets held to meet liabilities under insurance contracts are the main class of financial instruments so designated. The group has documented risk management and investment strategies designed to manage such assets at fair value, taking into consideration the relationship of assets to liabilities in a way that mitigates market risks. Reports are provided to management on the fair value of the assets.
The fair value designation, once made, is irrevocable. Subsequent to initial recognition, the fair values are remeasured, and gains and losses from changes therein are recognised in Net income/(expense) from insurance financial instruments designated at fair value.
Available-for-sale
Treasury Bills, debt securities and equity shares intended to be held on a continuing basis, other than those designated at fair value, are classified as available-for-sale.
Available-for-sale financial investments are subsequently remeasured at fair value, and changes therein are recognised in other comprehensive income until the financial assets are either sold or become impaired. When available-for-sale financial investments are sold, cumulative gains or losses previously recognised in other comprehensive income are recognised in profit or loss as Net (losses)/gains on sale of available-for-sale financial investments.
Unquoted equity securities the fair value of which cannot be reliably measured are carried at cost less impairment.
Loans and advances to banks and customers
Loans and advances to banks and customers are non-derivative financial assets with fixed or determinable payments that are not quoted in an active market and that the group does not intend to sell immediately or in the near term. Loans and advances are recognised when the cash is advanced to the borrowers. They are subsequently measured at amortised cost using the effective interest method, less impairment losses.
Loans and advances to banks and customers are classified as loans and receivables.
Subordinated liabilities, deposits by banks and amounts owed to customers
Financial liabilities are recognised when the group enters into the contractual provisions of the arrangements with counterparties, which is generally on trade date, and initially measured at fair value, which is normally the consideration received, net of directly attributable transaction costs incurred. Subsequent measurement of financial liabilities, other than those measured at fair value through profit or loss and financial guarantees, is at amortised cost, using the effective interest rate method to amortise the difference between proceeds received, net of directly attributable transaction costs incurred, and the redemption amount over the expected life of the instrument.

Notes on the Financial Statements (continued)
44
H S B C B A N K M A L T A P . L . C .
3 Significant accounting policies (continued)
b Financial instruments (continued)
ii Derivative financial instruments
Derivatives are recognised initially and are subsequently remeasured at fair value. Fair values of exchange traded derivatives are obtained from quoted market prices. Fair value of over-the-counter derivatives are obtained using valuation techniques, including discounted cash flow models and option pricing models. All derivatives are classified as assets when their fair value is positive or as liabilities when their fair value is negative.
Derivatives may be embedded in other financial instruments. Embedded derivatives are treated as separate derivatives when their economic characteristics and risks are not clearly and closely related to those of the host contract; the terms of the embedded derivative would meet the definition of a stand-alone derivative if they were contained in a separate contract; and the combined contract is not held for trading or designated at fair value. These embedded derivatives are measured at fair value with changes therein recognised in profit or loss.
The method of recognising fair value gains and losses depends on whether derivatives are held for trading or are designated as hedging instruments, and if the latter, the nature of the risks being hedged.
Derivatives that do not qualify for hedge accounting
All gains and losses from changes in the fair values of derivatives that do not qualify for hedge accounting are recognised immediately in profit or loss. These gains and losses are reported in Trading profits, except where derivatives are managed in conjunction with financial instruments designated at fair value in which case gains and losses are reported in Net income/(expense) from insurance financial instruments designated at fair value. Derivatives that do not qualify for hedge accounting include non-qualifying hedges entered into as part of documented interest rate management strategies for which hedge accounting was not, or could not be applied.
Hedge accounting
When derivatives are designated as hedges, the group classifies them as either:
– hedges of the change in fair value of recognised assets or liabilities or firm commitments (‘fair value hedges’); or
– hedges of the variability in highly probable future cash flows attributable to a recognised asset or liability, or a forecast transaction (‘cash flow hedges’).
Hedge accounting is applied to derivatives designated as hedging instruments in a fair value or cash flow hedge provided certain criteria are met.
At the inception of a hedging relationship, the group documents the relationship between the hedging instruments and the hedged items, its risk management objective and its strategy for undertaking the hedge. The group also requires a documented assessment, both at hedge inception and on an ongoing basis, of whether or not the hedging instruments, primarily derivatives, that are used in hedging transactions are highly effective in offsetting the changes attributable to the hedging risks in the fair value or cash flows of the hedged items. Interest on designated qualifying hedges is included in Net interest income.
Fair value hedge
Changes in the fair value of derivatives that are designated and qualify as fair value hedging instruments are recorded in profit or loss, along with changes in the fair value of the hedged items or group thereof that are attributable to the hedged risk.
If a hedging relationship no longer meets the criteria for hedge accounting, the cumulative adjustment to the carrying amount of the hedged item is amortised to profit or loss based on a recalculated effective interest rate over the residual period to maturity, unless the hedged item has been derecognised, in which case, it is released to profit or loss immediately.
Cash flow hedge
The effective portion of changes in the fair value of derivatives that are designated and qualify as cash flow hedges is recognised in other comprehensive income. Any gain or loss in fair value relating to an ineffective portion is recognised immediately in profit or loss.

45
3 Significant accounting policies (continued)
b Financial instruments (continued)
ii Derivative financial instruments (continued)
Cash flow hedge (continued)
The accumulated gains and losses recognised in other comprehensive income are reclassified to profit or loss in the periods in which the hedged item will affect profit or loss. However, when the forecast transaction that is hedged results in the recognition of a non-financial asset or a non-financial liability, the gains or losses previously recognised in other comprehensive income are removed from equity and included in the initial measurement of the cost of the asset or liability.
When a hedging instrument expires or is sold, or when a hedge no longer meets the criteria for hedge accounting, any cumulative gain or loss recognised in other comprehensive income at that time remains in equity until the forecast transaction is eventually recognised in profit or loss. When a forecast transaction is no longer expected to occur, the cumulative gain or loss that was recognised in other comprehensive income is immediately reclassified to profit or loss.
Hedge effectiveness testing
To qualify for hedge accounting, the bank requires that at the inception of the hedge and throughout its life, each hedge must be expected to be highly effective (prospective effectiveness), and demonstrate actual effectiveness (retrospective effectiveness) on an ongoing basis.
The documentation of each hedging relationship sets out how the effectiveness of the hedge is assessed. The method adopted by the group to assess hedge effectiveness will depend on its risk management strategy.
For prospective effectiveness, the hedging instrument must be expected to be highly effective in offsetting changes in fair value or cash flows attributable to the hedged risk during the period for which the hedge is designated. For actual effectiveness to be achieved, the changes in fair value or cash flows must offset each other in the range of 80% to 125%.
Hedge ineffectiveness is recognised in profit or loss in Trading profits.
iii Derecognition of financial assets and liabilities
Financial assets are derecognised when the right to receive cash flows from the assets has expired or when the group has transferred its contractual right to receive the cash flows of the financial assets, and either
– substantially all the risks and rewards of ownership have been transferred; or
– substantially all the risks and rewards have neither been retained nor transferred but control is not retained.
Financial liabilities are derecognised when they are extinguished, that is when the obligation is discharged, cancelled or expires.
iv Offsetting financial assets and financial liabilities
Financial assets and financial liabilities are offset and the net amount reported in the statement of financial position when there is a legally enforceable right to offset the recognised amounts and there is an intention to settle on a net basis, or realise the asset and settle the liability simultaneously.
v Repurchase transactions
The group enters into purchases of investments under agreement to resell substantially identical investments at a certain date in the future at a fixed price. Investments purchased subject to commitments to resell at future dates are not recognised. The amounts paid are recognised in loans and advances to either banks or customers. The receivables are shown as collateralised by the underlying security. Investments sold under repurchase agreements continue to be recognised in the statement of financial position and are measured in accordance with the accounting policy for either assets held for trading or available-for-sale as appropriate. The proceeds from sale of the investments are reported as liabilities to either banks or customers.
The difference between the sale and repurchase consideration is recognised using the effective interest method over the period of the transactions and is included in interest.
c Investment in subsidiaries
Investment in subsidiaries is shown in the separate statement of financial position at cost less any impairment losses. Dividend income is recognised in profit or loss on the date that the bank’s right to receive payment is established.

Notes on the Financial Statements (continued)
46
H S B C B A N K M A L T A P . L . C .
3 Significant accounting policies (continued)
d Intangible assets
Intangible assets include software and the present value of in-force long-term insurance business.
Software acquired by the group is initially measured at cost and subsequently stated net of accumulated amortisation and any impairment losses. Subsequent expenditure is capitalised only when it increases the future economic benefits embodied in the specific asset to which it relates. All other expenditure is recognised in profit or loss as incurred.
Amortisation is recognised in profit or loss on a straight-line basis over the estimated useful life of software, from the date it is available for use. Estimated useful life is the lower of legal duration and expected useful life. The estimated useful life of software ranges between 3 – 5 years.
For the accounting policy governing the present value of in-force long-term insurance business see note 3i (iv).
e Property, plant and equipment
i Owned assets
Property, plant and equipment are initially measured at cost. Freehold and long leasehold properties are remeasured to fair value on the basis of their existing use. Revaluations are performed by a professionally qualified architect with sufficient regularity such that the carrying amount does not differ materially from that which would be determined using fair values at the reporting date. Any surpluses arising on revaluation are credited to a revaluation reserve, net of deferred tax. Any deficiencies resulting from decreases in value are deducted from this reserve to the extent that it is sufficient to absorb them, with any excess charged to profit or loss.
Items of property, plant and equipment are stated net of accumulated depreciation and any impairment losses.
Gains and losses on disposal of an item of property, plant and equipment are determined by comparing the proceeds from disposal with the carrying amount of property, plant and equipment and are recognised net in profit or loss within Net other operating income. When revalued assets are sold, the amounts included in the revaluation surplus reserve are transferred to retained earnings.
ii Finance and operating leases
Leases in terms of which the group assumes substantially all the risks and rewards of ownership are classified as finance leases.
When the group is a lessee under finance leases, the leased assets are capitalised and included in Property, plant and equipment and the corresponding liability to the lessor is included in Other liabilities. A finance lease and its corresponding liability are recognised initially at the fair value of the asset or, if lower, the present value of the minimum lease payments. Finance charges payable are recognised in Net interest income over the period of the lease based on the interest rate implicit in the lease so as to give a constant rate of interest on the remaining balance of the liability.
All other leases are classified as operating leases. When the group is the lessee, leased assets are not recognised on the statement of financial position. Rentals payable and receivable under operating leases are accounted for on a straight-line basis over the periods of the leases and are included in General and administrative expenses and Net other operating income respectively.
iii Subsequent costs
The cost of replacing a component of an item of property, plant and equipment is recognised in the carrying amount of the item if it is probable that the future economic benefits embodied within the part will flow to the group and its cost can be measured reliably. The carrying amount of the replaced part is derecognised. The costs of the day-to-day servicing of property, plant and equipment are recognised in profit or loss as incurred.
iv Depreciation
Depreciation is recognised in profit or loss on a straight-line basis over the estimated useful lives of each component of an item of property, plant and equipment. Land is not depreciated. The estimated useful lives for the current and comparative period are as follows:
– long leaseholds, freehold buildings and improvements 50 years
– short leaseholds and improvements to rented property over term of lease
– equipment, furniture and fittings 3 – 10 years
Depreciation methods, useful lives and residual values are reviewed at each reporting date and adjusted if appropriate.

47
3 Significant accounting policies (continued)
f Investment property
Property held for long-term rental yields or for capital appreciation or both that is not occupied by the group is classified as investment property.
Investment properties are included in the statement of financial position at fair value with changes therein recognised in profit or loss in the period of change. Fair values are determined by professional valuers who apply recognised valuation techniques. Any gain or loss on the disposal of an investment property is recognised in profit or loss. When the use of property changes such that it is reclassified as property, plant and equipment, its fair value at the date of reclassification becomes its cost for subsequent accounting.
g Impairment
i Financial investments: available-for-sale securities
At each balance sheet date an assessment is made of whether there is any objective evidence of impairment in the value of a financial asset. Impairment losses are recognised if, and only if, there is objective evidence of impairment as a result of one or more events that occurred after the initial recognition of the financial asset (a ‘loss event’) and that loss event (or events) has an impact on the estimated future cash flows of the financial asset that can be reliably estimated.
If the available-for-sale financial asset is impaired, the difference between the financial asset’s acquisition cost (net of any principal repayments and amortisation) and the current fair value, less any previous impairment loss recognised in profit or loss, is removed from other comprehensive income and recognised in profit or loss.
When assessing available-for-sale debt securities for objective evidence of impairment at the reporting date, the group considers all available evidence, including observable data or information about events specifically relating to the securities which may result in a shortfall in recovery of future cash flows. These events may include a significant financial difficulty of the issuer, a breach of contract such as a default, bankruptcy or other financial reorganisation, or the disappearance of an active market for the debt security because of financial difficulties relating to the issuer.
These types of specific events and other factors such as information about the issuers’ liquidity, business and financial risk exposures, levels of and trends in default for similar financial assets, national and local economic trends and conditions, and the fair value of collateral and guarantees may be considered individually, or in combination, to determine if there is objective evidence of impairment of a debt security.
Objective evidence of impairment for available-for-sale equity securities may include specific information about the issuer as detailed above, but may also include information about significant changes in technology, markets, economics or the law that provides evidence that the cost of the equity securities may not be recovered.
A significant or prolonged decline in the fair value of the asset below its cost is also objective evidence of impairment. In assessing whether it is significant, the decline in fair value is evaluated against the original cost of the asset at initial recognition. In assessing whether it is prolonged, the decline is evaluated against the period in which the fair value of the asset has been below its original cost at initial recognition.
Once an impairment loss has been recognised on an available-for-sale financial asset, the subsequent accounting treatment for changes in the fair value of that asset differs depending on the nature of the available-for-sale financial asset concerned:
– for an available-for-sale debt security, a subsequent decline in the fair value of the instrument is recognised in profit or loss when there is further objective evidence of impairment as a result of further decreases in the estimated future cash flows of the financial asset. Where there is no further objective evidence of impairment, the decline in the fair value of the financial asset is recognised in other comprehensive income.
– for an available-for-sale equity security, subsequent decreases in the fair value of the available-for-sale equity security are recognised in profit or loss, to the extent that further cumulative impairment losses have been incurred in relation to the acquisition cost of the equity security.
ii Loans and Receivables
Losses for impaired loans are recognised promptly when there is objective evidence that impairment of a loan or portfolio of loans has occurred. Impairment allowances are calculated on individual loans and on groups of loans assessed collectively. Impairment losses are recorded as charges to profit or loss. The carrying amount of impaired loans on the statement of financial position is reduced through the use of impairment allowance accounts. Losses which may arise from future events are not recognised.

Notes on the Financial Statements (continued)
48
H S B C B A N K M A L T A P . L . C .
3 Significant accounting policies (continued)
g Impairment (continued)
ii Loans and Receivables (continued)
Individually assessed loans and advances
The factors considered in determining whether a loan is individually significant for the purposes of assessing impairment include:
– the size of the loan;
– the number of loans in the portfolio; and
– the importance of the individual loan relationship, and how this is managed.
Loans that meet the above criteria will be individually assessed for impairment, except when volumes of defaults and losses are sufficient to justify treatment under a collective assessment methodology.
For all loans that are considered individually significant, the group assesses on a case-by-case basis at each reporting date whether there is any objective evidence that a loan is impaired. The criteria used by the group to determine that there is such objective evidence include:
– known cash flow difficulties experienced by the borrower;
– contractual payments of either principal or interest being past due for more than 90 days;
– the probability that the borrower will enter bankruptcy or other financial realisation;
– a concession granted to the borrower for economic or legal reasons relating to the borrower’s financial difficulty that results in forgiveness or postponement of principal, interest or fees, where the concession is not insignificant; and
– there has been deterioration in the financial condition or outlook of the borrower such that its ability to repay is considered doubtful.
For those loans where objective evidence of impairment exists, impaired losses are determined considering the following factors:
– the group’s aggregate exposure to the customer;
– the viability of the customer’s business model and their capability to trade successfully out of financial difficulties and generate sufficient cash flow to service debt obligations;
– the amount and timing of expected receipts and recoveries;
– the likely dividend available on liquidation or bankruptcy;
– the extent of other creditors’ commitments ranking ahead of, or pari passu with, the group and the likelihood of other creditors continuing to support the customer;
– the complexity of determining the aggregate amount and ranking of all creditor claims and the extent to which legal and insurance uncertainties are evident;
– the realisable value of security (or other credit risk mitigants) and likelihood of successful repossession; and
– the likely deduction of any costs involved in recovery of amounts outstanding.
The realisable value of security is determined based on the current market value when the impairment assessment is performed. The value is not adjusted for expected future changes in market prices; however, adjustments are made to reflect local conditions, such as forced sale discounts.
Impairment losses are calculated by discounting the expected future cash flows of a loan, which includes expected future receipts of contractual interest at the loan’s original effective interest rate and comparing the resultant present value with the loan’s current carrying amount. The impairment allowances on individually significant accounts are reviewed at least annually and more regularly when circumstances require. This normally encompasses re-assessment of the enforceability of any collateral held and the timing and amount of actual and anticipated receipts. Individually assessed impairment allowances are only released when there is reasonable and objective evidence of a reduction in the established loss estimate.

49
3 Significant accounting policies (continued)
g Impairment (continued)
ii Loans and Receivables (continued)
Collectively assesed loans and advances
Impairment is assessed on a collective basis in two circumstances:
– to cover losses which have been incurred but have not yet been identified on loans subject to individual assessment; and
– for homogeneous groups of loans that are not considered individually significant.
Individually assessed loans for which no evidence of loss has been specifically identified on an individual basis are grouped together according to their credit risk characteristics for the purpose of calculating an estimated collective impairment. These credit risk characteristics may include type of business involved, type of products offered, security obtained or other relevant factors. This reflects impairment losses that the group has incurred as a result of events occurring before the reporting date, which the group is not able to identify on an individual loan basis, and that can be reliably estimated. These losses will only be individually identified in the future. As soon as information becomes available which identifies losses on individual loans within the group, those loans are removed from the group and assessed on an individual basis for impairment.
The collective impairment allowance is determined after taking into account:
– historical loss experience in portfolios of similar risk characteristics (for example, by industry sector, loan grade or product);
– the estimated period between impairment occurring and the loss being identified and evidenced by the establishment of an appropriate allowance against the loss on an individual loan; and
– management’s experienced judgement as to whether the current economic and credit conditions are such that the actual level of inherent losses is likely to be greater or less than that suggested by historical experience.
The period between a loss occurring and its identification is estimated by local management for each identified portfolio. The factors that may influence this estimation include economic and market conditions, customer behaviour, portfolio management information, credit management techniques and collection and recovery experiences in the market. As it is assessed empirically on a periodic basis the estimated period between a loss occurring and its identification may vary over time as these factors change.
For homogeneous groups of loans that are not considered individually significant, two alternative methods are used to calculate allowances on a portfolio basis:
– When appropriate empirical information is available, the group utilises roll rate methodology. This methodology employs a statistical analyses of historical data and experience of delinquency and default to estimate the likelihood that loans will progress through the various stages of delinquency and ultimately prove irrecoverable. The estimated loss is the difference between the present value of expected future cash flows, discounted at the original effective interest rate of the portfolio, and the carrying amount of the portfolio. Current economic conditions are also evaluated when calculating the appropriate level of allowance required to cover inherent loss.
– When the portfolio size is small or when information is insufficient or not reliable enough to adopt a roll rate methodology, the group adopts a formulaic approach based on historical loss rate experience. Loss rates are calculated from the discounted expected future cash flows from a portfolio.
The inherent loss within each portfolio is assessed on the basis of statistical analysis using historical data observations, which are updated periodically to reflect recent portfolio and economic trends. When the most recent trends arising from changes in economic, regulatory or behavioural conditions are not fully reflected in the statistical analysis, they are taken into account by adjusting the impairment allowances derived solely from the statistical analysis to reflect these changes as at the reporting date.

Notes on the Financial Statements (continued)
50
H S B C B A N K M A L T A P . L . C .
3 Significant accounting policies (continued)
g Impairment (continued)
ii Loans and Receivables (continued)
Collectively assesed loans and advances (continued)
These additional portfolio risk factors may include recent loan portfolio growth and product mix, unemployment rates, bankruptcy trends, loan product features (such as the ability of borrowers to repay adjustable-rate loans where reset interest rates give rise to increases in interest charges), economic conditions such as national and local trends in housing markets and interest rates, portfolio seasoning, account management policies and practices, current levels of write-offs, changes in laws and regulations and other factors which can affect customer payment patterns on outstanding loans, such as natural disasters. These risk factors, where relevant, are taken into account when calculating the appropriate level of impairment allowances by adjusting the impairment allowances derived solely from historical loss experience.
Roll rates, loss rates and the expected timing of future recoveries are regularly benchmarked against actual outcomes to ensure they remain appropriate.
iii Non-financial assets
The carrying amounts of the group’s non-financial assets, other than investment property and deferred tax assets, are reviewed at each reporting date to determine whether there is any indication of impairment. If any such indication exists, then the asset’s recoverable amount is estimated.
An impairment loss is recognised if the carrying amount of an asset or its cash-generating unit exceeds its estimated recoverable amount. Impairment losses are recognised in profit or loss.
Impairment losses recognised in prior periods are assessed at each reporting date for any indications that the loss has decreased or no longer exists.
The recoverable amount of non-financial assets is the greater of their net selling price and value in use. In assessing value in use, the estimated future cash flows are discounted to their present value using a pre-tax discount rate that reflects current market assessments of the time value of money and the risks specific to the asset.
iv Reversals of impairment
An impairment loss is reversed if the reversal can be related objectively to an event occurring after the impairment loss was recognised.
If the amount of an impairment loss decreases in a subsequent period, and the decrease can be related objectively to an event occurring after the impairment was recognised, the excess is written back by reducing the loan impairment allowance account accordingly. For financial assets measured at amortised cost and available-for-sale financial investments that are debt securities, the reversal is recognised in profit or loss. For available-for-sale financial investments that are equity securities, the reversal is recognised directly in other comprehensive income.
An impairment loss on non-financial assets is reversed if there has been a change in the estimates used to determine the recoverable amount. An impairment loss is reversed only to the extent that the asset’s carrying amount does not exceed the carrying amount that would have been determined, net of depreciation or amortisation, if no impairment loss had been recognised.
v Loan write-offs
Loans (and the related impairment allowance accounts) are normally written off, either partially or in full, when there is no realistic prospect of recovery of these amounts and, for collateralised loans, when the proceeds from realising the security have been received.
h Non-current assets held for sale
Non-current assets are classified as held for sale when their carrying amounts will be recovered principally through sale, they are available for sale in their present condition and their sale is highly probable. Immediately before classification as held for sale, the assets are remeasured in accordance with the group’s accounting policies. Thereafter generally the assets are measured at the lower of their carrying amount and fair value less cost to sell. Impairment losses on initial classification as held for sale and subsequent gains or losses on remeasurement are recognised in profit or loss. Gains are not recognised in excess of any cumulative impairment loss.

51
3 Significant accounting policies (continued)
i Insurance and investment contracts
Through its insurance subsidiary, the group issues contracts to customers that contain insurance risk, financial risk or a combination thereof. A contract under which the group accepts significant insurance risk from another party by agreeing to compensate that party on the occurrence of a specified uncertain future event, is classified as an insurance contract. An insurance contract may also transfer financial risk, but is accounted for as an insurance contract if the insurance risk is significant.
Insurance contracts are accounted for as follows:
i Premiums
Premiums for life insurance contracts are accounted for when receivable, except in unit-linked business where premiums are accounted for when liabilities are established.
Reinsurance premiums are accounted for in the same accounting period as the premiums for the direct insurance contracts to which they relate.
ii Claims and reinsurance recoveries
Gross insurance claims for life insurance contracts reflect the total cost of claims arising during the year, including claim handling costs and any policyholder bonuses allocated in anticipation of a bonus declaration. Claims arising during the year include maturities, surrenders and death claims. Maturity claims are recognised when due for payment. Surrenders are recognised when paid or at an earlier date on which, following notification, the policy ceases to be included within the calculation of the related insurance liabilities. Death claims are recognised when notified.
Reinsurance recoveries are accounted for in the same period as the related claims.
iii Liabilities under insurance contracts
Liabilities under non-linked life insurance contracts are calculated based on actuarial principles.
Liabilities under unit-linked life insurance contracts are at least equivalent to the surrender or transfer value which is calculated by reference to the value of the relevant underlying funds or indices.
A liability adequacy test is carried out on insurance liabilities to ensure that the carrying amount of the liabilities is sufficient in the light of current estimates of future cash flows. When performing the liability adequacy test, all contractual cash flows are discounted and compared against the carrying value of the liability. Where a shortfall is identified it is charged immediately to profit or loss.
iv Present value of in-force long-term insurance business
The value placed on insurance contracts that are classified as long-term insurance business, and are in force at the reporting date is recognised as an asset.
The present value of in-force long-term insurance business is determined by discounting future cash flows expected to emerge from business currently in force, using appropriate assumptions in assessing factors such as future mortality, lapse rates and levels of expenses and a risk discount rate that reflects the risk premium attributable to the respective long-term insurance business. Movements in the present value of in-force long-term insurance business are included in Net other operating income on a gross of tax basis.
v Investment contracts
Investment contracts are those contracts where there is no significant insurance risk.
Customer liabilities under unit-linked investment contracts and the linked financial assets are designated at fair value through profit or loss, and the movements in fair value are recognised in profit or loss in Net income/ (expense) from insurance financial instruments designated at fair value.
Premiums receivable and amounts withdrawn are accounted for as increases/decreases in the liability recorded in respect of investment contracts.
Liabilities under unit-linked investment contracts are at least equivalent to the surrender or transfer value which is calculated by reference to the value of the relevant underlying funds or indices.

Notes on the Financial Statements (continued)
52
H S B C B A N K M A L T A P . L . C .
3 Significant accounting policies (continued)
i Insurance and investment contracts (continued)
v Investment contracts (continued)
Investment management fees receivable are recognised in profit or loss over the period of the provision of the investment management services in Net fee and commission income.
The incremental costs directly related to the acquisition of new investment contracts or renewal of existing investment contracts are deferred and amortised over the period of the provision of the investment management services.
j Provisions
Provisions are recognised when it is probable that an outflow of economic benefits will be required to settle a current legal or constructive obligation which has arisen as a result of past events, and for which a reliable estimate can be made of the amount of the obligation.
Contingent liabilities, which include certain guarantees and letters of credit pledged as collateral security, are possible obligations that arise from past events whose existence will be confirmed only by the occurrence, or non-occurrence, of one or more uncertain future events not wholly within the control of the group; or are present obligations that have arisen from past events but are not recognised because it is not probable that settlement will require the outflow of economic benefits, or because the amount of the obligations cannot be reliably measured. Contingent liabilities are not recognised in the financial statements but are disclosed unless the probability of settlement is remote.
Restructuring
A provision for restructuring is recognised when the group has approved a detailed and formal restructuring plan and the restructuring either has commenced or has been announced publicly. Future operating losses are not provided for.
k Financial guarantee contracts
Financial guarantees are contracts that require the group to make specified payments to reimburse the holder for a loss it incurs because a specified debtor fails to make payment when due in accordance with the terms of a debt instrument.
Financial guarantee liabilities are initially recognised at their fair value, and the initial fair value is amortised over the life of the financial guarantee. The financial guarantee liability is subsequently carried at the higher of the initial fair value less cumulative amortisation and the best estimate of the expenditure required to settle the obligations. Financial guarantees are included within customer accounts.
l Interest income and expense
Interest income and expense for all interest-bearing financial instruments except those classified as held for trading or designated at fair value through profit or loss are recognised in Interest receivable and Interest payable in profit or loss using the effective interest method. The effective interest method is a way of calculating the amortised cost of a financial asset or a financial liability (or groups of financial assets or financial liabilities) and of allocating the Interest receivable or Interest payable over the relevant period.
The effective interest rate is the rate that exactly discounts estimated future cash receipts or payments through the expected life of the financial instrument or, where appropriate, a shorter period, to the net carrying amount of the financial asset or financial liability. When calculating the effective interest rate, the group estimates cash flows considering all contractual terms of the financial instrument but excluding future credit losses. The calculation includes all amounts paid or received by the group that are an integral part of the effective interest rate of a financial instrument, including transaction costs and all other premiums or discounts.
Interest on impaired financial assets is recognised using the original effective interest rate.

53
3 Significant accounting policies (continued)
m Non-interest income
i Net fee and commission income
Fee income is recognised as follows:
– on the execution of a significant act when the significant act has been completed; and
– as the services are provided except where the fee is charged to cover the cost of a continuing service to, or risk borne for, the customer, or is interest in nature. In these cases, the fee is recognised on an appropriate basis over the relevant period.
Income which forms an integral part of the effective interest rate of a financial instrument is recognised as an adjustment to the effective interest rate and recorded in Net interest income.
Other fee and commission expense, which relates mainly to transaction and service fees are expensed as the services are received.
ii Dividend income
Dividend income is recognised on the date the entity’s right to receive income is established which in the case of quoted securities is usually the ex-dividend date.
iii Net income from insurance financial instruments designated at fair value
Net income from financial instruments designated at fair value includes:
– all gains and losses from changes in the fair value of financial assets and financial liabilities designated at fair value through profit or loss; and
– interest income and expense and dividend income arising on these financial instruments.
n Employee benefits
i Defined contribution plan
The group contributes towards the State pension defined contribution plan in accordance with local legislation and to which it has no commitment beyond the payment of fixed contributions. Obligations for contributions are recognised as an employee benefit in profit or loss in the periods during which services are rendered by employees.
ii Termination benefits
Termination benefits are recognised as an expense when the group is demonstrably committed, without realistic possibility of withdrawal, to a formal detailed plan to either terminate employment before the normal retirement date, or to provide termination benefits as a result of an offer made to encourage voluntary redundancy. Termination benefits for voluntary redundancies are recognised as an expense if the group has made an offer of voluntary redundancy, it is probable that the offer will be accepted, and the number of acceptances can be estimated reliably. If benefits are payable more than 12 months after the reporting date, then they are discounted to their present value.
iii Share-based payment transactions
Share-based payment arrangements in which the group receives goods or services as consideration for equity instruments in the ultimate parent company are accounted for as equity-settled share-based payment transactions.
The grant date fair value of share-based payment awards granted to employees is recognised as an employee expense, with a corresponding increase in equity, over the period that the employees unconditionally become entitled to the awards. The amount recognised as an expense is adjusted to reflect the number of awards for which the related service and non-market vesting conditions are expected to be met, such that the amount ultimately recognised as an expense is based on the number of awards that do meet the related service and non-market performance conditions at the vesting date.
Notes on the Financial Statements (continued)
54
H S B C B A N K M A L T A P . L . C .
3 Significant accounting policies (continued)
o Foreign currencies
Transactions in foreign currencies are recorded in the functional currency at the rate of exchange prevailing on the date of transaction. Monetary assets and liabilities denominated in foreign currencies are translated into the functional currency at the rate of exchange ruling at the reporting date. Non-monetary assets and liabilities that are measured at fair value in a foreign currency are translated into the functional currency using the rate of exchange at the date the fair value was determined. Non-monetary assets and liabilities that are measured at historical cost in a foreign currency are translated using the exchange rate at the date of the transaction.
Any exchange component of a gain or loss on a non-monetary item is recognised in other comprehensive income if the gain or loss on the non-monetary item is recognised in other comprehensive income. Any exchange component of a gain or loss on a non-monetary item is recognised in profit or loss if the gain or loss on the non-monetary item is recognised in profit or loss.
p Income tax
Income tax expense comprises current and deferred tax. Income tax is recognised in profit or loss except to the extent that it relates to items recognised directly in equity or in other comprehensive income, in which case it is recognised in the same statement in which the related item appears.
Current tax is the expected tax payable on the taxable income for the year, using tax rates enacted or substantively enacted at the reporting date, and any adjustment to tax payable in respect of previous years.
Deferred tax is recognised in respect of temporary differences between the carrying amounts of assets and liabilities for financial reporting purposes and the amounts used for taxation purposes. Deferred tax is measured at the tax rates that are expected to be applied to temporary differences when they reverse, based on the laws that have been enacted or substantively enacted by the reporting date.
A deferred tax asset is recognised for unused tax losses and deductible temporary differences, to the extent that it is probable that future taxable profits will be available against which they can be utilised. Deferred tax assets are reviewed at each reporting date and are reduced to the extent that it is no longer probable that the related tax benefit will be realised.
q Operating segments
The group’s operating segments are organised into three customer groups, Retail Banking and Wealth Management (‘RBWM’), Commercial Banking (‘CMB’) and Global Banking and Markets (‘GB&M’). The group’s chief decision maker regularly reviews operating activity by customer group. The group’s operating segments were determined to be customer groups because the chief decision maker uses information on customer group segments in order to make decisions about resource allocation and assessing performance assessment. The group’s chief decision maker is the Executive committee.
Measurement of segment assets, liabilities, income and expenses is based on the group’s accounting policies. Segment income and expenses include transfers between segments. Shared costs are included in segment on the basis of the actual recharges made.
r New standards and interpretations not adopted
A number of new standards, amendments to standards and interpretations are effective for annual periods beginning after 1 January 2012, and have not been applied in preparing these financial statements. None of these is expected to have a significant effect on these financial statements.
4 Financial instruments and risk management
a Use of financial instruments
The nature of the group’s core banking operations implies that financial instruments are extensively used in the course of its routine business. The group’s financial instruments consist of primary instruments and include cash balances with banks, loans and advances to customers, securities and amounts due to banks and customers.
The group is exposed to a mixed blend of risks and hence operates a risk management strategy with the objective of controlling and minimising their impact on group financial performance and position.
The principal categories of risk are credit risk, market risk and liquidity risk. These categories of risk in relation to life insurance business are described in note 4(e) and excluded from group figures disclosed in notes 4(a) to 4(c).

55
4 Financial instruments and risk management (continued)
b Credit risk excluding Insurance credit risk which is reported under 4(e)(ii)
i Credit risk management
Credit risk is the risk of financial loss if a customer or counterparty fails to meet an obligation under a contract. It arises principally from lending, trade finance and treasury business. It also arises when issuers of debt securities are downgraded and as a result the value of group's holdings of these assets fall. The group has standards, policies and procedures dedicated to control and monitor the risk arising from all such activities.
Within the overall framework of the group policy, the group has an established risk management process encompassing credit approvals, the control of exposures, credit policy direction to business units and the monitoring and reporting of exposures both on an individual and a portfolio basis which includes the management of adverse trends. Management is responsible for the quality of its credit portfolios and follows a credit process involving delegated approval authorities and credit procedures, the objective of which is to build and maintain risk assets of high quality. Regular reviews are undertaken to assess and evaluate levels of risk concentrations by market sector and product.
Special attention is paid to problem loans. Specialist units are established by the group to provide customers with support in order to help them avoid default wherever possible.
a Collateral and other credit enhancements
Collateral can be an important mitigant of credit risk. Nevertheless, it is group’s policy to establish that loans are within the customer’s capacity to repay rather than to over rely on security. In certain cases, depending on the customer’s standing and the type of product, facilities may be unsecured.
The group is required to implement guidelines on the acceptability of specific classes of collateral or credit risk mitigation, and determine suitable valuation parameters. Such parameters are expected to be conservative, reviewed regularly and supported by empirical evidence. Security structures and legal covenants are required to be subject to regular review to ensure that they continue to fulfil their intended purpose and remain in line with local market practice.
The table below sets out the principal types of collateral held against different types of financial assets:
Type of credit exposure Percentage of collaterised exposure ________________________________
Principal type of security held 31 December 31 December for secured lending 2012 2011 ______________ ______________
% % Loans and advances to retail customersMortgage lending Residential property 99 99 Personal lending Residential property 57 56 Credit cards None – –
Loans and advances to corporate customersGovernment and public sectors Government guarantees 85 70 Other Commercial property 58 62
The group typically does not hold collateral against financial assets designated at fair value, financial investments and loans to banks, and no such collateral was held at 31 December 2012 and 2011.
Residential mortgage lending
The table below stratifies credit exposures from mortgage loans and advances to retail customers by ranges of loan-to-value (‘LTV’). LTV is calculated as the ratio of the gross amount of loan or the amounted committed for loan commitments to the value of the collateral. The gross amounts exclude any impairment allowances. The valuation of the collateral excludes any adjustments for obtaining and selling the collateral. The value of the collateral for residential mortgage loans is based on the collateral value at origination updated based on changes in house price indices.
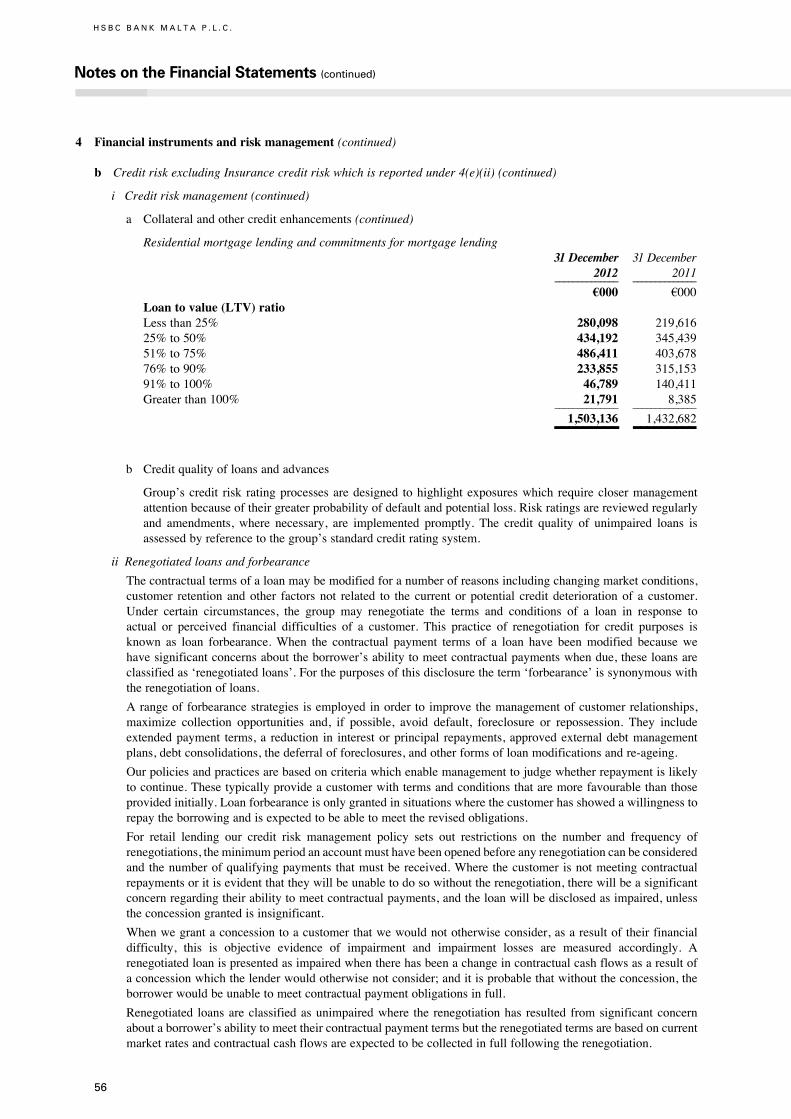
Notes on the Financial Statements (continued)
56
H S B C B A N K M A L T A P . L . C .
4 Financial instruments and risk management (continued)
b Credit risk excluding Insurance credit risk which is reported under 4(e)(ii) (continued)
i Credit risk management (continued)
a Collateral and other credit enhancements (continued)
Residential mortgage lending and commitments for mortgage lending 31 December 31 December 2012 2011 ______________ ______________
§000 §000 Loan to value (LTV) ratioLess than 25% 280,098 219,61625% to 50% 434,192 345,43951% to 75% 486,411 403,67876% to 90% 233,855 315,15391% to 100% 46,789 140,411Greater than 100% 21,791 8,385 ______________ ______________
1,503,136 1,432,682 _________ _________b Credit quality of loans and advances
Group’s credit risk rating processes are designed to highlight exposures which require closer management attention because of their greater probability of default and potential loss. Risk ratings are reviewed regularly and amendments, where necessary, are implemented promptly. The credit quality of unimpaired loans is assessed by reference to the group’s standard credit rating system.
ii Renegotiated loans and forbearance
The contractual terms of a loan may be modified for a number of reasons including changing market conditions, customer retention and other factors not related to the current or potential credit deterioration of a customer. Under certain circumstances, the group may renegotiate the terms and conditions of a loan in response to actual or perceived financial difficulties of a customer. This practice of renegotiation for credit purposes is known as loan forbearance. When the contractual payment terms of a loan have been modified because we have significant concerns about the borrower’s ability to meet contractual payments when due, these loans are classified as ‘renegotiated loans’. For the purposes of this disclosure the term ‘forbearance’ is synonymous with the renegotiation of loans.
A range of forbearance strategies is employed in order to improve the management of customer relationships, maximize collection opportunities and, if possible, avoid default, foreclosure or repossession. They include extended payment terms, a reduction in interest or principal repayments, approved external debt management plans, debt consolidations, the deferral of foreclosures, and other forms of loan modifications and re-ageing.
Our policies and practices are based on criteria which enable management to judge whether repayment is likely to continue. These typically provide a customer with terms and conditions that are more favourable than those provided initially. Loan forbearance is only granted in situations where the customer has showed a willingness to repay the borrowing and is expected to be able to meet the revised obligations.
For retail lending our credit risk management policy sets out restrictions on the number and frequency of renegotiations, the minimum period an account must have been opened before any renegotiation can be considered and the number of qualifying payments that must be received. Where the customer is not meeting contractual repayments or it is evident that they will be unable to do so without the renegotiation, there will be a significant concern regarding their ability to meet contractual payments, and the loan will be disclosed as impaired, unless the concession granted is insignificant.
When we grant a concession to a customer that we would not otherwise consider, as a result of their financial difficulty, this is objective evidence of impairment and impairment losses are measured accordingly. A renegotiated loan is presented as impaired when there has been a change in contractual cash flows as a result of a concession which the lender would otherwise not consider; and it is probable that without the concession, the borrower would be unable to meet contractual payment obligations in full.
Renegotiated loans are classified as unimpaired where the renegotiation has resulted from significant concern about a borrower’s ability to meet their contractual payment terms but the renegotiated terms are based on current market rates and contractual cash flows are expected to be collected in full following the renegotiation.

57
4 Financial instruments and risk management (continued)
b Credit risk excluding Insurance credit risk which is reported under 4(e)(ii) (continued)
ii Renegotiated loans and forbearance (continued)
Loans that have been identified as renegotiated retain this designation until maturity or derecognition. When a loan is restructured as part of a forbearance strategy and the restructuring results in a derecognition of the existing loan, the new loan is disclosed as renegotiated. A loan that is renegotiated is derecognised if the existing agreement is cancelled and a new agreement made on substantially different terms, or if the terms of an existing agreement are modified, such that the renegotiated loan is substantially a different financial instrument.
iii Credit exposure
The group’s maximum exposure to credit risk on financial instruments, whether recognised or unrecognised, before taking account of any collateral held or other credit enhancements can be classified in the following categories:
– Recognised financial assets comprise Balances with Central Bank of Malta, Treasury Bills and cash, Cheques in course of collection, Financial assets at fair value through profit or loss, Financial investments, loans and advances and acceptances and endorsements. The maximum exposure of these financial assets to credit risk, equals their carrying amount.
– Financial guarantees granted. The maximum exposure to credit risk is the full amount that the group would have to pay if the guarantees are called upon.
– Loan commitments and other credit related commitments that are irrevocable over the life of the respective facilities. The maximum exposure to credit risk is the full amount of the committed facilities.
Concentration of credit risk exists when a number of counterparties are engaged in similar activities, or operate in the same industry sector and so their ability to meet contractual obligations is similarly affected by certain conditions.
The following industry concentrations are considered significant for gross Loans and advances to customers:
2012 2011 ______________ ______________
§000 §000Group/Bank Agriculture 4,499 4,500Fishing 3,460 2,024 Mining and quarrying 1,938 2,100Manufacturing 136,908 107,400Electricity, gas and air-conditioning supply 106,888 108,304Water supply, sewerage waste management and remediation activities 33,627 31,117 Construction 385,817 420,473 Wholesale and retail trade and repairs 315,554 350,411Transport, storage and communication 51,993 54,554Accommodation and food service activities 152,971 157,123Information and communication 80,240 80,649 Financial and insurance activities 75,323 75,079 Real estate activities 68,124 63,776Professional, scientific and technical activities 24,597 26,201 Administrative and support service activities 15,424 18,175 Public administration and defence and compulsory social security 114,954 110,222Education 1,434 1,769Human health and social work activities 33,684 30,398Arts, entertainment and recreation 2,870 2,675Other services activities 8,806 6,483Household and individuals 1,801,482 1,748,859 ______________ ______________
Gross loans and advances to customers 3,420,593 3,402,292 _________ _________

Notes on the Financial Statements (continued)
58
H S B C B A N K M A L T A P . L . C .
4 Financial instruments and risk management (continued)
b Credit risk excluding Insurance credit risk which is reported under 4(e)(ii) (continued)
iii Credit exposure (continued)
Debt securities and other bills by rating agency (S&P Rating Agency) designation:
Treasury Debt Bills securities Total ______________ ______________ ______________
§000 §000 §000Group
At 31 December 2012AAA – 207,517 207,517 AA- to AA+ – 86,656 86,656 A- to A+ – 668,514 668,514 ______________ ______________ ______________ – 962,687 962,687 _________ _________ _________At 31 December 2011AAA – 266,652 266,652 AA- to AA+ – 11,918 11,918 A- to A+ 97,804 592,045 689,849 Lower than A- – 12,805 12,805 ______________ ______________ ______________
97,804 883,420 981,224 _________ _________ _________iv Credit quality of financial assets
The following tables provide a detailed analysis of the credit quality of the group’s lending portfolio:
a Distribution of gross loans and advances by credit quality
Loans and Loans and Loans and Loans and advances to advances to advances to advances to customers banks customers banks ______________ ______________ ______________ ______________
2012 2012 2011 2011 ______________ ______________ ______________ ______________
§000 §000 §000 §000
Group Gross loans and advances:– neither past due nor impaired 3,095,510 681,272 3,109,247 637,910– past due but not impaired 141,677 – 119,136 –– impaired 183,406 – 173,909 – ______________ ______________ ______________ ______________
3,420,593 681,272 3,402,292 637,910 _________ _________ _________ _________ Loans and advances to banks booked in subsidiary undertakings are neither past due nor impaired.
b Distribution of loans and advances neither past due nor impaired
The credit quality of the portfolio of loans and advances that were neither past due nor impaired at the reporting date can be assessed by reference to group’s standard credit grading system. The following information is based on that system:
Loans and Loans and Loans and Loans and advances to advances to advances to advances to customers banks customers banks ______________ ______________ ______________ ______________
2012 2012 2011 2011 ______________ ______________ ______________ ______________
§000 §000 §000 §000
GroupSatisfactory risk 2,742,227 681,272 2,724,158 637,910Watch list and special attention 234,143 – 243,156 –Sub-standard but not impaired 119,140 – 141,933 – ______________ ______________ ______________ ______________
3,095,510 681,272 3,109,247 637,910 _________ _________ _________ _________ Loans and advances to banks booked in subsidiary undertakings are of satisfactory risk.

59
4 Financial instruments and risk management (continued)
b Credit risk excluding Insurance Credit Risk which is reported under 4(e)(ii) (continued)
iv Credit quality of financial assets (continued)
c Loans and advances which were past due but not impaired
The past due ageing analysis includes loans and advances less than 90 days past due amounting to §123,883,000 (2011: §112,596,000).
Loans and advances to customers ________________________________
2012 2011 ______________ ______________
§000 §000 Group Past due up to 29 days 92,852 84,959Past due 30 – 59 days 22,089 20,021Past due 60 – 89 days 8,942 7,616Past due 90 – 179 days 15,698 5,426Past due over 180 days 2,096 1,114 ______________ ______________ 141,677 119,136 _________ _________Renegotiated loans as at 31 December 2012 amounted to §175,283,000 (2011: §130,701,000). §154,665,000 of these loans are impaired, §6,168,000 are past due but not impaired and §14,450,000 are neither past due nor impaired. 87% of these loans are collateralised and the interest income in relation to these loans amounted to §10,745,000. 48% of these loans relate to the construction industry.
d Individually impaired gross loans by segment Loans and advances to customers ________________________________ 2012 2011 ______________ ______________
§000 §000GroupPersonal banking 44,734 43,092Commercial and corporate 127,544 123,831Other 11,128 6,986 ______________ ______________
183,406 173,909 _________ _________v Movement in allowance accounts for loans and advances to customers
Individually Individually assessed Collective assessed Collective allowances allowances allowances allowances ______________ ______________ ______________ ______________
2012 2012 2011 2011 ______________ ______________ ______________ ______________
§000 §000 §000 §000GroupChange in allowances for uncollectability:At 1 January 45,402 12,600 38,299 12,768Additions 13,330 676 13,483 (168)Reversals (3,605) – (4,497) –Discount unwind (2,223) – (1,883) – ______________ ______________ ______________ ______________
At 31 December 52,904 13,276 45,402 12,600 _________ _________ _________ _________vi Settlement risk
The group’s activities may give rise to risk at the time of settlement of transactions and trades. Settlement risk is the risk of loss due to failure of a counterparty to honour its obligations to deliver cash, securities or other assets as contractually agreed.
For certain types of transactions the group mitigates this risk by conducting settlements through a settlement/clearing agent to ensure that a trade is settled only when both parties have fulfilled their contractual settlement obligations.

Notes on the Financial Statements (continued)
60
H S B C B A N K M A L T A P . L . C .
4 Financial instruments and risk management (continued)
c Liquidity risk
Liquidity risk is the risk that the group does not have sufficient financial resources to meet its financial obligations when they fall due or will have to do so at excessive cost. This risk can arise from mismatches in timing of cash flows.
The objective of the group’s liquidity and funding management is to ensure that all foreseeable funding commitments and deposit withdrawals can be met when due. It is the group’s objective to maintain a diversified and stable funding base with the objective of enabling the group to respond quickly and smoothly to unforeseen liquidity requirements.
The group’s liquidity and funding management process includes:
– projecting cash flows by considering the level of liquid assets necessary in relation thereto;
– monitoring liquidity ratios against internal and regulatory requirements;
– maintaining a diverse range of funding sources with adequate back-up facilities;
– managing the concentration and profile of debt maturities;
– monitoring depositor concentration in order to avoid undue reliance on large individual depositors and ensure a satisfactory overall funding mix; and
– maintaining liquidity and funding contingency plans. These plans identify early indicators of stress conditions and describe actions to be taken in the event of difficulties arising from systematic or other crisis while minimising adverse long-term implications for the business.
Current accounts and savings deposits payable on demand or at short notice form a significant part of the group’s funding. The group places considerable importance on maintaining the stability of these deposits.
Cash flows payable by the group under financial liabilities by remaining maturities
Due Due Due between between Gross within 3 and 12 1 and 5 Due after nominal Carrying 3 months months years 5 years outflow amount ______________ ______________ ______________ ______________ ______________ ______________
§000 §000 §000 §000 §000 §000Group
At 31 December 2012Deposits by banks 257,707 786 277 – 258,770 258,611Customer accounts 3,535,407 869,994 146,416 – 4,551,817 4,516,999Subordinated liabilities 2,203 2,203 74,530 31,038 109,974 87,240Other financial liabilities 28,165 550 – – 28,715 28,715 ______________ ______________ ______________ ______________ ______________ ______________
3,823,482 873,533 221,223 31,038 4,949,276 4,891,565 _________ _________ _________ _________ _________ _________Loan commitments 819,116 81,380 156,175 – 1,056,671 1,056,671 _________ _________ _________ _________ _________ _________At 31 December 2011Deposits by banks 395,588 984 17 – 396,589 389,170Customer accounts 3,271,718 929,693 223,698 – 4,425,109 4,402,975Subordinated liabilities 2,203 2,203 17,627 92,305 114,338 87,208Other financial liabilities 35,388 377 170 – 35,935 35,935 ______________ ______________ ______________ ______________ ______________ ______________
3,704,897 933,257 241,512 92,305 4,971,971 4,915,288 _________ _________ _________ _________ _________ _________Loan commitments 833,641 78,999 188,816 – 1,101,456 1,101,456 _________ _________ _________ _________ _________ _________Cash flows payable by the group under investment contracts and insurance contracts issued are disclosed in note 4e(iii).
Derivatives are assumed to be payable on demand and not by contractual maturity because trading liabilities are typically held for short periods of time.

61
4 Financial instruments and risk management (continued)
c Liquidity risk (continued) Due Due Due between between Gross within 3 and 12 1 and 5 Due after nominal Carrying 3 months months years 5 years outflow amount ______________ ______________ ______________ ______________ ______________ ______________
§000 §000 §000 §000 §000 §000Bank
At 31 December 2012Deposits by banks 257,707 786 277 – 258,770 258,611Customer accounts 3,555,535 869,994 146,416 – 4,571,945 4,537,127Subordinated liabilities 2,224 2,224 74,690 31,770 110,908 87,987Other financial liabilities 23,338 550 – – 23,888 23,888 ______________ ______________ ______________ ______________ ______________ ______________
3,838,804 873,554 221,383 31,770 4,965,511 4,907,613 _________ _________ _________ _________ _________ _________Loan commitments 826,479 81,380 156,175 – 1,064,034 1,064,034 _________ _________ _________ _________ _________ _________At 31 December 2011Deposits by banks 395,588 984 17 – 396,589 389,170Customer accounts 3,302,597 936,762 223,698 – 4,463,057 4,440,646Subordinated liabilities 2,224 2,224 17,795 93,114 115,357 87,933Other financial liabilities 31,238 377 170 – 31,785 31,785 ______________ ______________ ______________ ______________ ______________ ______________
3,731,647 940,347 241,680 93,114 5,006,788 4,949,534 _________ _________ _________ _________ _________ _________Loan commitments 833,741 78,899 188,816 – 1,101,456 1,101,456 _________ _________ _________ _________ _________ _________ The above tables incorporate all cash flows, on an undiscounted basis, related to both principal as well as those associated with all future coupon payments. Furthermore, loan commitments are not recognised on the Statements of Financial Position.
Assets available to meet these liabilities and to cover outstanding commitments, include balances with Central Bank of Malta, cash, cheques in course of collection, loans and advances to banks and to customers, and marketable debt securities.
The group would meet unexpected net cash outflows by accessing additional funding sources such as interbank lending, or by selling securities such as debt securities.
d Market risk
Market risk is the risk that movements in market risk factors, including foreign exchange rates, interest rates and market prices will reduce the group’s income or the value of its portfolios.
The objective of the group’s market risk management is to manage and control market risk exposures in order to optimise return on risk while maintaining a market profile consistent with the group’s status as a premier provider of financial products and services.
The group manages market risk through risk limits approved by HSBC Holdings. Limits are set by product and risk type with market liquidity being a principal factor in determining the level of limits set.
The group’s interest rate exposures comprise those originating in its treasury activities and those originating in other banking activities. The primary source of interest rate risk originating in other banking activities arises from the employment of non-interest liabilities, such as shareholders’ equity and current accounts, as well as fixed rate loans and liabilities, other than those generated by treasury business. The group’s Asset and Liability Management Committee (ALCO) assesses the interest rate risks which arise in the business. The primary objective of such interest rate risk management is to limit potential adverse effects of interest rate movements on Net interest income.

Notes on the Financial Statements (continued)
62
H S B C B A N K M A L T A P . L . C .
4 Financial instruments and risk management (continued)
d Market risk (continued) i Fair value and price verification control
Where certain financial instruments are measured at fair value, the valuation and the related price verification processes are subject to independent validations. The determination of fair values is therefore a significant element in the reporting of the group’s global market activities.
Certain of the group’s financial assets and liabilities are carried at cost or amortised cost less impairment and not at fair value.
a Investments – Equity and other non-fixed income instruments available-for-sale
Certain unlisted equity investments are carried at cost less impairment of §70,000 (2011: §369,000). There is no market for these investments and no recent transactions that provide evidence of the current fair value. Discounted cash flow techniques do not provide a reliable measure of the fair value of these investments.
b Loans and advances to banks and customers
This category of asset is reported net of impairment allowances to reflect the estimated recoverable amounts. As at 31 December 2012 the group’s carrying amount was §4,035,765,000 (2011: §3,982,246,000), and the bank’s carrying amount was §4,033,178,000 (2011: §3,982,193,000).
The loans and advances to customers category of asset amounts to §3,354,413,000 (2011: §3,344,290,000). This carrying value approximates to fair value in the case of loans which are repriceable at the group’s discretion. These loans constitute a significant element of the total loan portfolio.
The loans and advances to banks category of asset amounts to §681,352,000 (2011: §637,956,000) for the group and §678,765,000 (2011: §637,903,000) for the bank. For loans and advances to banks within the ‘less than one year’ maturity band, fair value is taken to be the amount carried at the reporting date. As at 31 December 2012, 91% of loans and advances to banks had a contractual repricing within the ‘less than three months’ band. Interest rates on these loans and advances reflect current market rates, and therefore the carrying amount approximates to fair value.
c Non-current assets held for sale
Assets acquired in satisfaction of debt amounting to §11,240,000 as at 31 December 2012 (2011: §11,108,000) consist mainly of repossessed immovable property measured at the lower of cost and their forced-sale value.
d Amounts owed to banks and customers
This category of liability is carried at amortised cost and as at 31 December 2012 amounts to §4,775,610,000 (2011: §4,792,145,000) for the group and §4,795,738,000 (2011: §4,829,816,000) for the bank. Of this liability, 70% has contractual repricing with the ‘less than three months’ band, 16% reprices within the ‘between three months and one year’ band whilst 14% reprices within the ‘between one year and five years’ band. For demand deposits and deposits maturing within one year, fair value is taken to be the amount payable on demand at the reporting date.
e Subordinated liabilities
This category of liability is carried at amortised cost. Fair value based on quoted market prices at the reporting date without deduction for transaction costs amounts to §92,533,000 as at 31 December 2012 (2011: §90,788,000).

63
4 Financial instruments and risk management (continued)
d Market risk (continued) ii Basis of valuing financial assets and liabilities measured at fair value
For all financial instruments where fair values are determined by reference to externally quoted prices or observable pricing inputs to models, independent price determination or validation is utilised. In inactive markets, direct observation of a traded price may not be possible. In these circumstances, the group will source alternative market information to validate the financial instrument’s fair value, with greater weight given to information that is considered to be more relevant and reliable.
Valuation techniques ___________________________________________________________________
With Quoted Using significant
market observable unobservable price inputs inputs ______________ ______________ ______________ ______________
Level 1 Level 2 Level 3 Total ______________ ______________ ______________ ______________
§000 §000 §000 §000GroupAt 31 December 2012AssetsDerivatives – 17,615 – 17,615Financial assets designated at fair value through profit or loss 454,591 – – 454,591Financial investments: available-for-sale 987,398 73 – 987,471
LiabilitiesDerivatives – 17,857 – 17,857Liabilities to customers under investment contracts 17,254 – – 17,254
At 31 December 2011AssetsDerivatives – 17,136 – 17,136Financial assets designated at fair value through profit or loss 370,080 – – 370,080Financial investments: available-for-sale 936,461 369 – 936,830
LiabilitiesDerivatives – 17,810 – 17,810Liabilities to customers under investment contracts 16,920 – – 16,920

Notes on the Financial Statements (continued)
64
H S B C B A N K M A L T A P . L . C .
4 Financial instruments and risk management (continued)
d Market risk (continued) ii Basis of valuing financial assets and liabilities measured at fair value (continued)
Valuation techniques ___________________________________________________________________
With Quoted Using significant
market observable unobservable price inputs inputs ______________ ______________ ______________ ______________
Level 1 Level 2 Level 3 Total ______________ ______________ ______________ ______________
§000 §000 §000 §000BankAt 31 December 2012AssetsDerivatives – 17,615 – 17,615Financial investments: available-for-sale 962,651 70 – 962,721
LiabilitiesDerivatives – 18,172 – 18,172
At 31 December 2011AssetsDerivatives – 17,856 – 17,856Financial investments: available-for-sale 883,378 369 – 883,747
LiabilitiesDerivatives – 17,810 – 17,810
iii Credit risk adjustment methodology
The group adopts a credit risk adjustment against over the counter derivative transactions to reflect within fair value the possibility that the counterparty may default, and it may not receive the full market value of the transactions.
The group calculates the credit risk adjustment by applying the probability of default of the counterparty to the expected positive exposure to the counterparty, and multiplying the result by the loss expected in the event of default. The calculation is performed over the life of the potential exposure.
For most products, the group uses a simulation methodology to calculate the expected positive exposure. The methodology simulates the range of potential exposures of the group to the counterparty over the life of an instrument. The range of exposures is calculated across the portfolio of transactions with a counterparty to arrive at an expected overall exposure. The probability of default assumptions are based upon historic rating transition matrices. The credit rating used for a particular counterparty is that determined by the bank’s internal credit process. Rating transition is taken account of throughout the duration of the exposure. A standard loss given default assumption is generally adopted. The group considers that an appropriate spread to reflect its own probability of default within the credit risk adjustment calculation is currently zero. Consequently, the group does not derive the adjustment on a bilateral basis and has a zero adjustment against derivative liabilities, often referred to as a ‘debit valuation adjustment’. The simulation methodology includes credit mitigants such as counterparty netting agreements and collateral agreements with the counterparty.

65
4 Financial instruments and risk management (continued)
d Market risk (continued) iv Value at risk (VAR)
One of the principal tools used by the group to monitor and limit market risk exposure is VAR. VAR is a technique that estimates potential losses that could occur on risk positions as a result of movements in market rates and prices over a specified time horizon and to a given level of confidence.
The VAR models used by the group are predominantly based on historical simulation. The historical simulation models derive plausible future scenarios from historical market rate time series, taking account of inter-relationships between different markets and rates, for example, between interest rates and foreign exchange rates.
The historical simulation models used by the group incorporate the following features:
– potential market movements are calculated with reference to data from the last two years;
– historical market rates and prices are calculated with reference to foreign exchange rates and commodity prices, interest rates, equity prices and the associated volatilities;
– VAR is calculated to a 99% confidence level; and
– VAR is calculated for a one-day holding period.
Although a valuable guide to risk, VAR should always be viewed in the context of its limitations, for example:
– the use of historical data as a proxy for estimating future events may not encompass all potential events, particularly those which are extreme in nature;
– the use of a one-day holding period assumes that all positions can be liquidated or hedged in one day. This may not fully reflect the market risk arising at times of severe illiquidity, when a one-day holding period may be insufficient to liquidate or hedge all positions fully;
– the use of a 99% confidence level, by definition, does not take into account losses that might occur beyond this level of confidence; and
– VAR is calculated on the basis of exposures outstanding at the close of business and therefore does not necessarily reflect intra-day exposures.
The group recognises these limitations by augmenting its VAR limits with other position and sensitivity limit structures.
The VAR for the group was as follows: 2012 2011 ______________ ______________
§000 §000
At 31 December 1,605 2,367 Average 1,947 1,827 Minimum 1,483 1,056 Maximum 2,577 2,480
The reduction in VAR as at 31 December 2012 compared with 31 December 2011 was caused principally by the repositioning of the bond portfolio from longer dated securities into shorter duration as part of the asset and liability management strategy.

Notes on the Financial Statements (continued)
66
H S B C B A N K M A L T A P . L . C .
4 Financial instruments and risk management (continued)
d Market risk (continued) v Sensitivity of net interest income
A principal part of HSBC’s management of market risk is to monitor the sensitivity of projected net interest income under varying interest rate scenarios (simulation modelling). For simulation modelling, business use a combination of scenarios relevant to local businesses and local markets and standard scenarios which are required throughout HSBC.
The table below sets out the impact on future net income/net assets of an incremental 50 basis points parallel fall or rise in all yield curves worldwide on the first day of the following year based on current balance sheet position/risk profiles and current interest rate policy.
Impact on Impact on profit for Impact on profit for Impact on the year net assets the year net assets ______________ ______________ ______________ ______________
2012 2012 2011 2011 ______________ ______________ ______________ ______________
§000 §000 §000 §000
Group/Bank+ 50 basis points 3,441 (5,972) 4,373 (5,847)- 50 basis points (8,214) 1,199 (10,613) (393)
vi Currency concentration Reporting Other Reporting Other currencies currencies Total currencies currencies Total ______________ ______________ ______________ ______________ ______________ ______________
2012 2012 2012 2011 2011 2011 ______________ ______________ ______________ ______________ ______________ ______________
§000 §000 §000 §000 §000 §000 Group Assets Balances with Central Bank of Malta, Treasury Bills and cash 82,341 24,650 106,991 230,989 2,399 233,388 Cheques in course of collection 6,727 484 7,211 22,078 607 22,685 Derivatives 15,065 2,550 17,615 12,359 4,777 17,136 Financial assets designated at fair value 362,045 92,546 454,591 298,900 71,180 370,080 Financial investments 819,097 168,374 987,471 820,608 116,222 936,830 Loans and advances to banks 85,784 595,568 681,352 67,120 570,836 637,956 Loans and advances to customers 3,316,273 38,140 3,354,413 3,305,134 39,156 3,344,290 Other assets 274,592 2,238 276,830 261,802 894 262,696 ______________ ______________ ______________ ______________ ______________ ______________
Total assets 4,961,924 924,550 5,886,474 5,018,990 806,071 5,825,061 _________ _________ _________ _________ _________ _________

67
4 Financial instruments and risk management (continued)
d Market risk (continued)
vi Currency concentration (continued)
Reporting Other Reporting Other currencies currencies Total currencies currencies Total ______________ ______________ ______________ ______________ ______________ ______________
2012 2012 2012 2011 2011 2011 ______________ ______________ ______________ ______________ ______________ ______________
§000 §000 §000 §000 §000 §000 Group Liabilities and equity Derivatives 15,212 2,645 17,857 13,539 4,271 17,810 Deposits by banks 226,513 32,098 258,611 374,097 15,073 389,170 Customer accounts 3,728,524 788,475 4,516,999 3,691,786 711,189 4,402,975 Liabilities to customers under investment contracts 17,254 – 17,254 16,920 – 16,920 Liabilities under insurance contracts issued 493,254 – 493,254 436,672 – 436,672 Subordinated liabilities 87,240 – 87,240 87,208 – 87,208 Other liabilities 89,315 5,346 94,661 103,914 3,927 107,841 Total equity 400,598 – 400,598 366,465 – 366,465 ______________ ______________ ______________ ______________ ______________ ______________
Total liabilities and equity 5,057,910 828,564 5,886,474 5,090,601 734,460 5,825,061 _________ _________ _________ _________ _________ _________
Reporting Other Reporting Other currencies currencies Total currencies currencies Total ______________ ______________ ______________ ______________ ______________ ______________
2012 2012 2012 2011 2011 2011 ______________ ______________ ______________ ______________ ______________ ______________
§000 §000 §000 §000 §000 §000 Bank Assets Balances with Central Bank of Malta, Treasury Bills and cash 82,340 24,650 106,990 230,988 2,399 233,387 Cheques in course of collection 6,727 484 7,211 22,078 607 22,685 Derivatives 15,065 2,550 17,615 13,079 4,777 17,856 Financial investments 794,383 168,338 962,721 768,749 114,998 883,747 Loans and advances to banks 83,197 595,568 678,765 67,067 570,836 637,903 Loans and advances to customers 3,316,273 38,140 3,354,413 3,305,134 39,156 3,344,290 Other assets 181,926 2,238 184,164 190,176 894 191,070 ______________ ______________ ______________ ______________ ______________ ______________
Total assets 4,479,911 831,968 5,311,879 4,597,271 733,667 5,330,938 _________ _________ _________ _________ _________ _________ Liabilities and equity Derivatives 15,527 2,645 18,172 13,539 4,271 17,810 Deposits by banks 226,513 32,098 258,611 374,097 15,073 389,170 Customer accounts 3,748,652 788,475 4,537,127 3,729,457 711,189 4,440,646 Subordinated liabilities 87,987 – 87,987 87,933 – 87,933 Other liabilities 58,615 5,346 63,961 79,647 3,878 83,525 Total equity 346,021 – 346,021 311,854 – 311,854 ______________ ______________ ______________ ______________ ______________ ______________
Total liabilities and equity 4,483,315 828,564 5,311,879 4,596,527 734,411 5,330,938 _________ _________ _________ _________ _________ _________

Notes on the Financial Statements (continued)
68
H S B C B A N K M A L T A P . L . C .
4 Financial instruments and risk management (continued)
e Insurance risk
The insurance risk of the group represents that faced by the life insurance subsidiary company. The principal insurance risk is that the cost of claims combined with acquisition and administration costs may exceed the aggregate amount of premiums received and investment income. The group manages its insurance risks through the application of formal underwriting, reinsurance and claims procedures designed to ensure compliance with regulations.
The following table provides an analysis of the insurance risk exposures by type of business: Group ________________________________
2012 2011 ______________ ______________
§000 §000 Life insurance (non-linked)
Insurance contracts with discretionary participation feature 341,956 317,835Term assurance and other long-term contracts 2,489 2,212 ______________ ______________
Total non-linked 344,445 320,047 Life insurance (linked) 148,809 116,625 ______________ ______________
Liabilities under insurance contracts issued 493,254 436,672 Investment contracts 17,254 16,920 ______________ ______________
Total insurance liabilities 510,508 453,592 _________ _________
Present value of in-force long-term insurance business (PVIF)
The HSBC life insurance business is accounted for using the embedded value approach, which, inter alia, provides a comprehensive framework for the evaluation of insurance and related risks.
The following table shows the effect on the PVIF of reasonably possible changes in the main economic assumptions across the life insurance business: PVIF Impact ________________________________
2012 2011 ______________ ______________
Assumptions Movement §000 §000 As published Risk free rate +100 basis points 8,222 1,951
Risk free rate -100 basis points (9,396) (3,420)
Expenses inflation +10% (549) (436)Expenses inflation +10% 598 487
Lapse rate +100 basis points (820) (852)Lapse rate -100 basis points 687 766
HSBC’s life insurance business is exposed to a range of financial risks, including market risk, credit risk and liquidity risk. The nature and management of these risks is described below.
i Market risk
a Interest rate risk
Life insurance business is exposed to interest rate risk when there is a mismatch in terms of duration or yields between assets and liabilities. The group manages the interest rate risk arising from its insurance underwriting business by establishing limits centrally. These govern the sensitivity of the net present values of expected future cash flows.
Interest rate risk is also assessed by measuring the impact of defined movements in interest yield curves on the profits after tax and net assets of the insurance underwriting business.

69
4 Financial instruments and risk management (continued)
e Insurance risk (continued)
i Market risk (continued)
b Equity risk
The group manages the equity risk arising from its holdings of equity securities centrally by setting limits on the maximum market value of equities that the insurance underwriting business may hold. Equity risk is also monitored by estimating the effect of predetermined movements in equity prices on the profit for the year and total net assets of the insurance underwriting business.
An immediate and permanent movement in interest yield curves as at the reporting date would have the following impact on the profit for the year and net assets at that date:
2012 2011 ________________________________ ________________________________
Impact on Impact on profit for Impact on profit for Impact on the year net assets the year net assets ______________ ______________ ______________ ______________
§000 §000 §000 §000
+100 basis points shift in yield curves (1,683) (1,683) (2,342) (2,342)
-100 basis points shift in yield curves 981 981 1,047 1,047
+10 per cent increase in equity prices 209 209 614 614
-10 per cent increase in equity prices (383) (383) (742) (742)
ii Credit risk
HSBC’s life insurance underwriting business is exposed to credit risk in respect of its investment portfolios and reinsurance transactions. The Investment Committee is responsible for the quality and performance of the investment portfolios and follows a credit process involving delegated approval authorities and credit procedures, the objective of which is to build and maintain risk assets of high quality.
The following table presents the analysis of debt securities within insurance business by rating agency (S & P Rating Agency):
Treasury Debt Bills securities Total ______________ ______________ ______________
§000 §000 §000
At 31 December 2012 AAA – 27,490 27,490 AA- to AA+ – 75,397 75,397 A- to A+ – 147,519 147,519 Lower than A- – 14,913 14,913 Unrated – 14,575 14,575 ______________ ______________ ______________
– 279,894 279,894 _________ _________ _________ At 31 December 2011 AAA – 65,914 65,914 AA- to AA+ – 41,978 41,978 A- to A+ 3,248 130,417 133,665 Lower than A- – 12,799 12,799 Unrated – 13,958 13,958 ______________ ______________ ______________
3,248 265,066 268,314 _________ _________ _________

70
H S B C B A N K M A L T A P . L . C .
Notes on the Financial Statements (continued)
4 Financial instruments and risk management (continued)
e Insurance risk (continued)
iii Liquidity risk
It is an inherent characteristic of almost all insurance contracts that there is uncertainty over the amount and the timing of settlement of claims liabilities that may arise, and this leads to liquidity risk. As part of the management of this exposure, estimates are prepared for most lines of life insurance business of cash flows expected to arise from insurance funds at the reporting date.
The following table shows the expected maturity of insurance liabilities at the reporting date:
Due Due Due between between Gross within 3 and 12 1 and 5 Due after nominal 3 months months years 5 years outflow ______________ ______________ ______________ ______________ ______________
§000 §000 §000 §000 §000
At 31 December 2012Liabilities to customers under investment contracts 186 301 3,278 19,764 23,529Liabilities under insurance contracts issued 13,619 30,140 152,846 263,583 460,188
At 31 December 2011Liabilities to customers under investment contracts 143 372 3,075 21,366 24,956Liabilities under insurance contracts issued 15,514 35,413 114,487 258,496 423,910
With effect from 2011, the company has changed the methodology for estimating liquidity risk. The key changes were:
– Linked Insurance Reserves are derived via undiscounted cash flows on a statutory basis. No future premiums are assumed and investment returns are not included in the provisions. All decrements are considered.
– Linked Investment Reserves are as above but only consider contractual maturities and no other form of decrement.
– Non-Linked Reserve are derived via undiscounted statutory reserves run-off on a reporting basis. All future premiums are considered and provisions based on all expected decrements. Timing of cash flows are based on the expected run-off of the reserve.
5 Capital management and allocation
HSBC’s capital management approach is driven by its strategy taking into account the regulatory, economic and commercial environment in which it operates. HSBC’s capital management policy is to maintain a strong capital base to support the development of its business and to meet regulatory capital requirements at all times.
Capital management policy is monitored by ALCO. An annual group capital plan is drawn up and approved by the Board with the objective of maintaining both the optimal amount of capital and the mix between the different components of capital. The group recognises the impact on shareholder returns by the level of equity capital employed and seeks to maintain a prudent balance between the advantages and flexibility afforded by a strong capital position and the higher returns on equity from increased leverage.
In implementing the EU’s directives which regulate capital requirements, the Malta Financial Services Authority (MFSA) supervises the group on a consolidated basis and the bank on a solo basis and, as such, receives information on the capital adequacy of, and sets capital requirements for, the group and the bank.
The group’s capital base is divided in two tiers, as defined in BR/03 (the Own Funds of Credit Institutions Authorised Under the Banking Act 1994):
– Original own funds comprise share capital, retained earnings and reserves created by appropriations of retained earnings. The book values of intangible assets, 50% of investment in HSBC Life Assurance (Malta) Ltd and final dividend are deducted in arriving at orginal own funds calculation. Depositor compensation scheme reserve is excluded from original own funds.

71
5 Capital management and allocation (continued)
– Additional own funds comprise qualifying subordinated loan capital, collective impairment allowances, and unrealised gains arising on the fair valuation of financial investments held as available-for-sale. Additional own funds also include reserves arising from the revaluation of properties. The remaining 50% of the book value of the investment in HSBC Life Assurance (Malta) Ltd is deducted in arriving at additional own funds calculation.
The group’s risk and capital management policy is based on the Basel II framework which is structured on three pillars. These have been adopted by the MFSA by way of banking rules as follows:
– Pillar 1 – BR/04 (Capital Requirements of Credit Institutions Authorised Under the Banking Act 1994) defines the minimum capital resouces requirements for credit, counterparty, market and operational risks. The risk is expressed in Risk Weighted Assets (RWAs) terms. The group has adopted the Standardised Approach in determining the material risks on its banking operations and operational risk.
Banking operations are categorised as either trading book or banking book and risk-weighted assets are determined accordingly. Banking book risk-weighted assets are measured by means of a hierarchy of risk weightings classified according to the nature of each asset and counterparty, taking into account any eligible collateral or guarantees. Banking book contingent liabilities and commitments giving rise to credit, foreign exchange or interest rate risk are assigned weights appropriate to the category of the counterparty, taking into account any eligible collateral or guarantees. Trading book risk-weighted assets are determined by taking into account market related risks such as foreign exchange, interest rate and equity position risks and counterparty risk.
– Pillar 2 – BR/12 (The Supervisory Review Process of Credit Institutions Authorised Under the Banking Act 1994) involves both the credit institution and the regulator in assessing whether the institution should hold additional capital against risks not covered under pillar 1. An integral part of pillar 2 is the Internal Capital Adequacy Assessment Process (ICAAP) which is the institution’s self-assessment of the levels of capital it needs to hold. An ICAAP was undertaken during the first half of the year. This document was approved by ALCO, EXCO and subsequently by the Board on 2 May 2012 and presented to the MFSA for review. The ICAAP is performed annually and is based upon a pillar 1 plus approach whereby the pillar 1 capital requirements for credit and operational risks are supplemented by an assessment of other material residual risks not fully addressed under pillar 1. The residual risks considered for ICAAP include concentration, liquidity, reputational and strategic risks, interest rate risk in the banking book and risks arsing from the macroeconomic environment. The group assesses credit risk by utilising the embedded operational infrastructure for the pillar 1 capital calculation together with an additional suite of models that take into account the internal assessment of diversification of risks, within our portfolios and similarly, any concentrations of risk that arise. The bank maintains a prudent stance of capital coverage, ensuring that any model risk is mitigated. Interest rate risk in the banking book (IRRBB) is defined as the exposure of non-trading products to interest rates. IRRBB economic capital is measured as the amount of capital necessary to cover an unexpected loss in the value of our non-trading products over one year to a 99% level of confidence.
Following the ICAAP submission, the regulator carries out the Supervisory Review Evaluation Process (SREP) and enters into discussion with the bank on the appropriate level of capital adequacy to cover pillar 2 risks.
– Stress and scenario testing
Stress testing forms part of the group’s risk and capital framework and is an integral component of ICAAP. As a key risk management tool, stress testing highlights to senior management potential adverse unexpected outcomes related to a mixture of risks and provides an indication of how much capital might be required to absorb losses, should adverse scenarios occur. Stress testing is used to assess risk concentrations, estimate the impact of stressed earnings, impairments and write-downs on the overall capital adequacy under a variety of adverse scenarios.
Macroeconomic stress testing considers the impact on both earnings and capital for a range of scenarios. It entails multi-year systemic shocks to assess the group’s ability to meet its capital requirements and liabilities as they fall due under a downturn in the business cycle and/or macroeconomic environment.
The principal business benefits of the stress testing framework include: understanding the impact of recessionary scenarios; assessing material risk concentrations; and forecasting the impact of market stress and scenarios on the group’s balance sheet liquidity.
At group level, a series of stress events are monitored on a regular basis to assess the potential impact of an extreme yet plausible event on the group. As a result, senior management is continuously enhancing internal controls to monitor the situation on an ongoing basis. In an adverse scenario, the group also has at its disposal a range of mitigating actions it can implement. The latter also form part of the ICAAP document.

72
H S B C B A N K M A L T A P . L . C .
Notes on the Financial Statements (continued)
5 Capital management and allocation (continued)
– Pillar 3 – BR/07 (Publication of Annual Report and Audited Financial Statements of Credit Institutions Authorised under the Banking Act 1994) is related to market discipline and aims to make institutions more transparent by requiring them to publish specific disclosures on the institutions’ risk and capital management under the Basel II framework. The group is considered as a significant local subsidiary of HSBC Holdings plc and is therefore exempt in terms of article 23 of BR/07 from full risk disclosure requirements under pillar 3. HSBC Holdings plc publishes pillar 3 disclosures as a separate document on the Group Investor Relations website.
Group Bank __________________________________________________ __________________________________________________
Exposure Capital Exposure Capital value RWA Required value RWA Required ______________ ______________ ______________ ______________ ______________ ______________
2012 2012 2012 2012 2012 2012 ______________ ______________ ______________ ______________ ______________ ______________
§000 §000 §000 §000 §000 §000Exposures under the standardised approachCentral government and central banks 896,367 – – 896,367 – –Institutions 881,178 159,055 12,724 878,776 157,784 12,623Public sector 229,617 21,032 1,683 229,617 21,032 1,683Corporates 391,137 350,683 28,054 391,137 350,683 28,054Retail 298,787 201,660 16,133 298,787 201,660 16,133Secured on real estate property 2,353,548 1,314,975 105,198 2,353,548 1,314,975 105,198Past due items 187,604 257,824 20,626 187,604 257,824 20,626Other items 293,579 217,400 17,392 298,567 222,840 17,827 _________ _________ _________ _________ _________ _________Credit and counterparty risk 5,531,817 2,522,629 201,810 5,534,403 2,526,798 202,144 _________ _________ _________ _________ _________ _________Operational risk 307,717 24,617 307,717 24,617 _________ _________ _________ _________Equity risk – – – – Foreign exchange risk 2,266 181 2,266 181 ______________ ______________ ______________ ______________
Market risk 2,266 181 2,266 181 _________ _________ _________ _________Total risk weighted assets and capital required 2,832,612 226,608 2,836,781 226,942 _________ _________ _________ _________ Group Bank ________________________________ ____________________________________
Face Weighted Face Weighted value amount value amount ______________ ______________ ______________ ______________
2012 2012 2012 2012 ______________ ______________ ______________ ______________
§000 §000 §000 §000Assets Balances with Central Bank of Malta, Treasury Bills and cash 106,990 – 106,990 –Cheques in course of collection 7,211 1,442 7,211 1,442Financial investments 963,103 22,080 963,067 22,034Loans and advances to banks 681,272 137,006 678,765 135,753Loans and advances to customers 3,420,593 2,077,116 3,420,593 2,077,116Shares in subsidiary companies – – 7,129 7,129Property, plant and equipment and investment property 66,528 66,528 66,613 66,613Other assets 36,356 20,801 34,202 19,090Prepayments and accrued income 36,471 36,061 35,699 35,176 ______________ ______________ ______________ ______________
5,318,524 2,361,034 5,320,269 2,364,353 _________ _________Contingent liabilities, commitments and other 1,200,319 161,595 1,209,385 162,445 _________ ______________ _________ ______________
Total adjusted assets and off-balance sheet items 2,522,629 2,526,798
Operational risk 307,717 307,717 Market risk 2,266 2,266 ______________ ______________
Total risk weighted assets 2,832,612 2,836,781 _________ _________

73
5 Capital management and allocation (continued)
Group Bank ______________ ______________
2012 2012 ______________ ______________
§000 §000Total own funds Tier 1 Called up share capital 87,552 87,552Retained earnings 216,342 218,126Exclusions/deductions:– Depositor compensation scheme reserve (26,643) (26,643)– Investment in HSBC Life Assurance (Malta) Ltd (14,289) (14,289)– Final dividend (14,901) (14,901)– Intangible assets (11,946) (11,943) ______________ ______________
236,115 237,902 _________ _________ Tier 2Available-for-sale reserve 13,107 13,108 Property revaluation reserve 27,235 27,235Collectively assessed allowances 13,276 13,276Subordinated liabilities 76,364 76,364Deductions:– Investment in HSBC Life Assurance (Malta) Ltd (14,289) (14,289) ______________ ______________
115,693 115,694 _________ _________Total own funds 351,808 353,596 _________ _________ Capital adequacy ratio at 31 December 2012 Tier 1 Ratio 8.3% 8.4%Total capital ratio 12.4% 12.5% _________ _________ Capital adequacy ratio at 31 December 2011 Tier 1 Ratio 7.4% 7.4%Total capital ratio 11.6% 11.7% _________ _________
6 Interest and similar income
Group Bank ________________________________ ________________________________
2012 2011 2012 2011 ______________ ______________ ______________ ______________
§000 §000 §000 §000On loans and advances to banks 3,464 3,072 3,430 3,072On loans and advances to customers 146,870 147,102 146,875 147,104On balances with Central Bank of Malta 462 1,148 462 1,148On Treasury Bills 465 2,075 465 2,075 ______________ ______________ ______________ ______________
151,261 153,397 151,232 153,399 ______________ ______________ ______________ ______________
On debt and other fixed income instruments 30,797 29,714 29,007 26,652Amortisation of net premiums (7,421) (7,149) (7,292) (7,444) ____________ ______________ ____________ ______________
23,376 22,565 21,715 19,208 ______________ ______________ ______________ ______________
174,637 175,962 172,947 172,607 _________ _________ _________ _________Interest receivable and similar income from:– Group companies 3,375 3,040 3,375 3,040 _________ _________ _________ _________– subsidiary companies – – 5 2 _________ _________ _________ _________Discount unwind on impaired loans and advances to customers included in interest receivable on loans and advances to customers amounted to §2,223,000 (2011: §1,883,000).

74
H S B C B A N K M A L T A P . L . C .
Notes on the Financial Statements (continued)
7 Interest expense
Group Bank ________________________________ ________________________________
2012 2011 2012 2011 ______________ ______________ ______________ ______________
§000 §000 §000 §000 On deposits by banks 656 3,853 656 3,853On customer accounts 36,430 38,370 36,790 38,720On subordinated liabilities 4,451 4,446 4,451 4,446On finance leases – 34 – 34 ______________ ______________ ______________ ______________
41,537 46,703 41,897 47,053 _________ _________ _________ _________Interest payable to:– Group companies 640 3,780 640 3,780 _________ _________ _________ _________– subsidiary companies – – 360 350 _________ _________ _________ _________
8 Net fee and commission income
Group Bank ________________________________ ________________________________
2012 2011 2012 2011 ______________ ______________ ______________ ______________
§000 §000 §000 §000 Net fee and commission income that is not anintegral part of the effective interest method on:– financial assets or liabilites not at fair value through profit or loss 17,118 20,965 17,118 21,015– trust and other fiduciary activities that result in the holding or investing of assets on behalf of individuals and other institutions 11,035 9,684 5,346 5,051– other 2,338 2,901 4,327 3,773 ______________ ______________ ______________ ______________
30,491 33,550 26,791 29,839 _________ _________ _________ _________Net fee and commission income from:– Group companies 1,527 1,311 761 1,027 _________ _________ _________ _________– subsidiary companies – – 4,124 3,306 _________ _________ _________ _________Net fee and commission income for the bank include §3,549,000 (2011: §3,243,000) derived from investment services activities.
9 Dividend income
Group Bank ________________________________ ________________________________
2012 2011 2012 2011 ______________ ______________ ______________ ______________
§000 §000 §000 §000 Available-for-sale financial investments – 1 – –Subsidiary companies – – 20,896 24,987 ______________ ______________ ______________ ______________
– 1 20,896 24,987 _________ _________ _________ _________10 Trading profits
2012 2011 ______________ ______________
§000 §000Group/BankProfit on foreign exchange activities 9,298 8,386Net profits/(losses) on financial instruments at fair value through profit or loss 18 (80) ______________ ______________
9,316 8,306 _________ _________

75
11 Net gains/(losses) on sale of available-for-sale financial investments
Group Bank ________________________________ ________________________________
2012 2011 2012 2011 ______________ ______________ ______________ ______________
§000 §000 §000 §000 Net revaluation gains/(losses) transferred from equity 4,049 (2,107) 3,344 (2,113) _________ _________ _________ _________
12 Net operating income
Net operating income includes net income from Life insurance business analysed as follows: Group ________________________________
2012 2011 ______________ ______________
§000 §000Net fee and commission income 883 795Net income/(expense) from insurance financial instruments designated at fair value through profit or loss 42,917 (6,455)Net gains on sale of available-for-sale financial investments 777 –Net earned insurance premiums 67,284 64,459Net other operating income 2,929 13,657 ______________ ______________
114,790 72,456Net insurance claims incurred and movement in policyholders’ liabilities (92,970) (55,723) ______________ ______________
21,820 16,733 _________ _________a Net earned insurance premiums Group ________________________________
2012 2011 ______________ ______________
§000 §000Life insurance Gross premium written 71,432 68,130Outward reinsurance premiums (4,148) (3,671) ______________ ______________
67,284 64,459 _________ _________b Net insurance claims incurred and movement in policyholders’ liabilities
Group ___________________________________________________________________________________________________
Gross Reinsurance Net Gross Reinsurance Net ______________ ______________ ______________ ______________ ______________ ______________
2012 2012 2012 2011 2011 2011 ______________ ______________ ______________ ______________ ______________ ______________
§000 §000 §000 §000 §000 §000Life insuranceClaims paid 51,201 (1,783) 49,418 27,268 (374) 26,894Change in technical provision 56,170 (12,937) 43,233 36,574 (8,183) 28,391Change in claims provision 1,459 (1,140) 319 1,275 (837) 438 ______________ ______________ ______________ ______________ ______________ ______________
108,830 (15,860) 92,970 65,117 (9,394) 55,723 _________ _________ _________ _________ _________ _________

76
H S B C B A N K M A L T A P . L . C .
Notes on the Financial Statements (continued)
13 Employee compensation and benefits
Group Bank ________________________________ ________________________________
2012 2011 2012 2011 ______________ ______________ ______________ ______________
§000 §000 §000 §000 Wages, salaries and allowances 45,517 46,397 42,431 43,855Defined contribution social security costs 2,509 2,445 2,352 2,313Retirement benefits 5,870 9,326 5,838 9,135Share-based payments 784 639 723 607 ______________ ______________ ______________ ______________
54,680 58,807 51,344 55,910 _________ _________ _________ _________ Number Number Number NumberAverage number of employees– executive and senior managerial 259 273 238 252– other managerial, supervisory and clerical 1,153 1,235 1,091 1,169– others 37 43 37 43 ______________ ______________ ______________ ______________
1,449 1,551 1,366 1,464 _________ _________ _________ _________ During 2011 the bank announced an early voluntary retirement scheme for its employees as part of the continued transformation programme for the business. The provision as at 31 December 2012 amounted to §6,038,000 for the group (2011: §10,738,000) and §5,976,000 (2011: §10,547,000) for the bank while the charge for the year amounted to §5,612,000 (2011: §9,326,000) for the group and §5,580,000 (2011: §9,135,000) for the bank.
In order to align the interests of staff with those of shareholders, share options in ordinary shares of the ultimate parent company are offered to group employees under all-employee share plans and achievement shares awarded to group middle management and above, under discretionary incentive plans. The company offers the following types of share option schemes to its employees.
Main Plans Policy Purpose
Savings related share options plans
• Exercisable within three months following the first anniversary of the commencement of a one-year savings contract or within six months following either the third or fifth anniversaries of the commencement of three-year or five-year contracts, respectively
• The exercise price is set at a 20% (2011: 20%) discount to the market value immediately preceding the date of invitation
• Eligible employees save up to £250 per month (or its equivalent in euros), with the option to use the savings to acquire shares
• To align the interests of all employees with the creation of shareholder value
HSBC Holdings Group share option plan
• Plan ceased in May 2005
• Exercisable between third and tenth anniversaries of the date of grant
• Long-term incentive plan between 2000 and 2005 during which certain HSBC employees were awarded share options
Group ____________________________________________________________________
Weighted Weighted average average exercise exercise Options price (§) Options price (§) ______________ ______________ ______________ ______________
2012 2012 2011 2011 ______________ ______________ ______________ ______________
Savings related Share Option PlansOutstanding at 1 January 768,222 3.89 774,896 3.87Granted during the year 511,004 5.52 100,299 5.92Exercised during the year (391,041) 3.83 (28,817) 5.95Closed during the year (210,421) 5.64 (78,156) 5.51 ______________ ______________
Outstanding at 31 December 677,764 4.61 768,222 3.89 _________ _________Exercisable at 31 December 27,683 5.12 7,990 7.64 _________ _________

77
13 Employee compensation and benefits (continued) Group ____________________________________________________________________
Weighted Weighted average average exercise exercise Options price (§) Options price (§) ______________ ______________ ______________ ______________
2012 2012 2011 2011 ______________ ______________ ______________ ______________
Group Share Option PlansOutstanding at 1 January 482,992 8.15 601,793 6.99Exercised during the year – – (2,524) 7.21Released during the year (3,329) 7.38 (116,277) 8.07 ______________ ______________
Outstanding at 31 December 479,663 8.35 482,992 8.15 _________ _________Exercisable at 31 December 479,663 8.35 166,118 7.21 _________ _________ The options outstanding at reporting date had a contractual life of between one and five years.
The weighted average share price and exercise price are denominated in pounds sterling and disclosed in euro equivalent using the exchange rates prevailing at the reporting date.
Fair value of share option schemes
Fair values of share options awarded under all-employee share option plans in 2012, measured at the date of grant of the option, are calculated using a Black-Scholes model.
The expected life of options depends on the behaviour of option holders, which is incorporated into the option model consistent with historic observable data. The fair values calculated are inherently subjective and uncertain due to the assumptions made and the limitations of the model used. The significant weighted average assumptions used to estimate the fair value of the options granted in 2012 were as follows:
1 year savings- 3 year savings- 5 year savings- related share related share related share option schemes option schemes option schemes _________________ _________________ _________________
Risk-free interest rate (%) 0.4 0.6 1.2Expected volatility (%) 25.0 25.0 25.0Expected life (years) 1 3 5
The risk-free interest rate was determined from the UK gilts zero-coupon yield curve. Expected volatility is estimated by considering both historic average share price volatility and implied volatility for traded options over HSBC shares of similar maturity to those of the employee options. Expected life is not a single input parameter but a function of various behavioural assumptions. Expected dividend yield was determined to be 4.5% per annum, in line with consensus analyst options.
The group also grants the following types of awards to its employees:
Award Policy Purpose
Restricted share awards (including Group Performance Share Plans ‘GSPS’)
• Vesting of awards generally subject to continued employment with the group
• Vesting often staggered over three years. GPSP awards vest after five years
• Certain shares subject to a retention requirement postvesting
• In the case of GPSP awards retention applies until cessation of employment
• Awards generally not subject to performance conditions
• Awards granted from 2010 onwards are subject to clawback provision prior to vesting
• Rewards employee performance and potential and retention of key employees
• To defer variable pay
These awards are generally granted to employees early in the year following the year to which the award relates. The charge for these awards is recognised from the start of the period to which the service relates to the end of the vesting period. The vesting period is the period over which the employee satisfies certain service conditions in order to become entitled to the award. Due to the staggered vesting profile of certain deferred share awards, the employee becomes entitled to a portion of the award at the end of each year during the vesting period.

78
H S B C B A N K M A L T A P . L . C .
Notes on the Financial Statements (continued)
14 Net impairment
Group Bank ________________________________ ________________________________
2012 2011 2012 2011 ______________ ______________ ______________ ______________
§000 §000 §000 §000 Write-downsInvestments– available-for-sale debt instruments – (3,981) – – – available-for-sale equity instruments (300) (198) (300) – ______________ ______________ ______________ ______________ (300) (4,179) (300) – ______________ ______________ ______________ ______________
Loans and advances to customers– specific allowances (6,811) (7,423) (6,811) (7,423)– collective allowances (676) – (676) –– bad debts written off (1,275) (1,110) (1,275) (1,110) ______________ ______________ ______________ ______________
(8,762) (8,533) (8,762) (8,533) ______________ ______________ ______________ ______________
Property, plant and equipment – (529) – (529) ______________ ______________ ______________ ______________
Intangible assets (622) – (622) – ______________ ______________ ______________ ______________
Reversals of write-downsLoans and advances to customers– specific allowances 3,605 4,497 3,605 4,497– collective allowances – 168 – 168– bad debts recovered 342 294 342 294 ______________ ______________ ______________ ______________
3,947 4,959 3,947 4,959 ______________ ______________ ______________ ______________
Property, plant and equipment 99 – 99 – ______________ ______________ ______________ ______________
Other assets– specific allowances – 32 – – ______________ ______________ ______________ ______________
Net impairment (5,638) (8,250) (5,638) (4,103) _________ _________ _________ _________15 Profit before tax
2012 2011 ______________ ______________
§000 §000 Group/Bank Profit before tax is stated after charging:
Directors’ emoluments– fees 169 164– other emoluments 1,260 1,000 ______________ ______________
1,429 1,164 _________ _________Profit before tax for the group is also stated after charging the following fees (excluding VAT) in relation to services provided by the external auditors of the group:
– auditors’ fees of §172,000;
– other assurance services fees of §33,000;
– tax advisory services fees of §29,000; and
– other non-audit services fees of §1,000.

79
16 Tax expense
Group Bank ________________________________ ________________________________
2012 2011 2012 2011 ______________ ______________ ______________ ______________
§000 §000 §000 §000 The charge for income tax, which is based on the taxable profit for the year at a rate of 35%, comprises: – current 28,679 38,896 35,107 39,395 – deferred 5,054 (8,158) (1,465) (6,455) ______________ ______________ ______________ ______________
33,733 30,738 33,642 32,940 _________ _________ _________ _________The tax on profit and the result of accounting profit multiplied by the applicable tax rate are reconciled as follows:
Group Bank ________________________________ ________________________________
2012 2011 2012 2011 ______________ ______________ ______________ ______________
§000 §000 §000 §000 Profit before tax 95,335 88,305 95,198 99,499 _________ _________ _________ _________Tax at the applicable rate of 35% 33,367 30,907 33,319 34,825Tax effect of non-taxable income – (17) – –Tax effect of profits taxed at different rates – – – (1,708)Tax effect of non-deductible expenses 70 33 68 31Tax effect of depreciation charges not deductible by way of capital allowances 275 321 275 321Tax effects of property sales tax consequences 38 62 – 61Tax effect of bonus shares received – 35 – – Tax effect of additional deductions (45) (45) (43) (45)Tax effect of temporary differences not previously recognised 28 (558) 23 (545) ______________ ______________ ______________ ______________
Tax expense 33,733 30,738 33,642 32,940 _________ _________ _________ _________17 Earnings per share
The calculation of earnings per share of the group and the bank is based on the profit attributable to shareholders of the bank as shown in profit or loss, divided by the number of shares in issue as at 31 December 2012.
18 Balances with Central Bank of Malta, Treasury Bills and cash
Group Bank ________________________________ ________________________________
2012 2011 2012 2011 ______________ ______________ ______________ ______________
§000 §000 §000 §000 Balances with Central Bank of Malta 75,279 104,624 75,279 104,624Malta Government Treasury Bills – 97,804 – 97,804Cash 31,712 30,960 31,711 30,959 ______________ ______________ ______________ ______________
106,991 233,388 106,990 233,387 _________ _________ _________ _________Balances with Central Bank of Malta include a reserve deposit requirement in terms of Regulation (EC)No. 1745/2003 of the European Central Bank which was reduced from 2% to 1% as from 18 January 2012. The average reserve deposit requirement as at the reporting date was §44,377,000 (2011: §87,682,000) in respect of the group and the bank.

80
H S B C B A N K M A L T A P . L . C .
Notes on the Financial Statements (continued)
19 Derivatives
Group Bank ________________________________ ________________________________
2012 2011 2012 2011 ______________ ______________ ______________ ______________
§000 §000 §000 §000Derivative assetsHeld for trading 17,615 17,136 17,615 17,856 _________ _________ _________ _________Held for trading instruments held with:– Group companies 3,623 4,137 3,623 4,137 _________ _________ _________ _________– subsidiary companies – – – 720 _________ _________ _________ _________Derivative liabilitiesHeld for trading 17,857 17,810 18,172 17,810 _________ _________ _________ _________Held for trading instruments held with:– Group companies 14,584 12,972 14,584 12,972 _________ _________ _________ _________– subsidiary companies – – 315 – _________ _________ _________ _________Derivatives held for trading
Fair value Fair value Fair value Fair value Notional assets liabilities Notional assets liabilities ______________ ______________ ______________ ______________ ______________ ______________
2012 2012 2012 2011 2011 2011 ______________ ______________ ______________ ______________ ______________ ______________
§000 §000 §000 §000 §000 §000 Group
Interest rate derivativesOver the counter products– interest rate swaps purchased 187,146 13,150 – 177,888 11,134 –– interest rate swaps written 187,146 – 13,624 177,888 – 11,716 Currency derivativesOver the counter products– foreign exchange contracts 197,466 1,839 1,491 128,494 2,973 2,949– foreign exchange options purchased 3,923 4 162 11,322 1,148 142– foreign exchange options written 3,923 46 4 11,322 26 1,148 Equity derivativesOver the counter products – equity index options purchased 59,534 2,576 – 86,532 1,855 –– equity index options written 59,534 – 2,576 86,532 – 1,855 ______________ ______________ ______________ ______________ 17,615 17,857 17,136 17,810 _________ _________ _________ _________
BankInterest rate derivativesOver the counter products– interest rate swaps purchased 187,146 13,150 – 177,888 11,134 – – interest rate swaps written 187,146 – 13,624 177,888 – 11,716 Currency derivativesOver the counter products– foreign exchange contracts 213,241 1,839 1,806 138,468 3,693 2,949– foreign exchange options purchased 3,923 4 162 11,322 1,148 142– foreign exchange options written 3,923 46 4 11,322 26 1,148

81
19 Derivatives (continued)
Derivatives held for trading (continued)
Fair value Fair value Fair value Fair value Notional assets liabilities Notional assets liabilities ______________ ______________ ______________ ______________ ______________ ______________
2012 2012 2012 2011 2011 2011 ______________ ______________ ______________ ______________ ______________ ______________
§000 §000 §000 §000 §000 §000 Bank
Equity derivativesOver the counter products– equity index options purchased 59,534 2,576 – 86,532 1,855 –– equity index options written 59,534 – 2,576 86,532 – 1,855 ______________ ______________ ______________ ______________
17,615 18,172 17,856 17,810 _________ _________ _________ _________20 Financial assets designated at fair value through profit or loss
Group ________________________________
2012 2011 ______________ ______________
§000 §000 Debt, Treasury Bills and other fixed income instruments 255,183 216,172Equity and other non-fixed income instruments 199,408 153,908 ______________ ______________
454,591 370,080 _________ _________
a Debt, Treasury Bills and other fixed income instruments Group ________________________________
2012 2011 ______________ ______________
§000 §000 Issued by public bodies – local government 72,320 57,468 – foreign government 99,956 70,559
Issued by other issuers – local banks 3,042 3,184
– foreign banks 33,216 27,702– others local 2,498 3,860– others foreign 44,151 53,399 ______________ ______________
255,183 216,172 _________ _________Listing status– listed on the Malta Stock Exchange 77,860 64,512– listed elsewhere 177,323 151,660 ______________ ______________
255,183 216,172 _________ _________ At 1 January 216,172 141,547
Exchange adjustments – 34 Additions 149,389 157,258Disposals/Redemptions (123,036) (81,304)Changes in fair value 12,658 (1,363) ______________ ______________
At 31 December 255,183 216,172 _________ _________

82
H S B C B A N K M A L T A P . L . C .
Notes on the Financial Statements (continued)
20 Financial assets designated at fair value through profit or loss (continued)
b Equity and other non-fixed income instruments Group ________________________________
2012 2011 ______________ ______________
§000 §000Issued by issuers other than public bodies and banks– others local 49,116 43,376– others foreign 150,292 110,532 ______________ ______________
199,408 153,908 _________ _________Listing status– listed on the Malta Stock Exchange 49,116 43,376– listed elsewhere 150,292 110,532 ______________ ______________
199,408 153,908 _________ _________
At 1 January 153,908 164,022Exchange adjustments (554) 1,838Additions 53,804 80,441Disposals (27,963) (83,311)Changes in fair value 20,213 (9,082) ______________ ______________
At 31 December 199,408 153,908 _________ _________ The bank has no assets designated as at fair value through profit or loss.
21 Financial investments
Group Bank ________________________________ ________________________________
2012 2011 2012 2011 ______________ ______________ ______________ ______________
§000 §000 §000 §000Debt and other fixed income instruments– available-for-sale 987,398 934,837 962,651 883,378Equity and other non-fixed income instruments– available-for-sale 73 1,993 70 369 ______________ ______________ ______________ ______________
987,471 936,830 962,721 883,747 _________ _________ _________ _________
a Debt and other fixed income instruments available-for-sale
Group Bank ________________________________ ________________________________
2012 2011 2012 2011 ______________ ______________ ______________ ______________
§000 §000 §000 §000Issued by public bodies– local government 679,720 602,171 661,513 569,953– foreign government 108,449 127,303 103,196 120,436Issued by other issuers– foreign banks 7,789 52,419 7,001 46,865– local others 499 491 – –– foreign others 190,941 152,453 190,941 146,124 ______________ ______________ ______________ ______________
987,398 934,837 962,651 883,378 _________ _________ _________ _________Amounts include:– issued by Group companies 36 42 – – _________ _________ _________ _________Listing status– listed on the Malta Stock Exchange 680,219 602,662 661,513 569,953– listed elsewhere 307,179 332,175 301,138 313,425 ______________ ______________ ______________ ______________
987,398 934,837 962,651 883,378 _________ _________ _________ _________

83
21 Financial investments (continued)
a Debt and other fixed income instruments available-for-sale (continued)
Group Bank ________________________________ ________________________________
2012 2011 2012 2011 ______________ ______________ ______________ ______________
§000 §000 §000 §000At 1 January 934,837 688,650 883,378 592,740Exchange adjustments 984 (3,580) 914 (3,034)Amortisation (7,411) (7,193) (7,292) (7,466)Additions 375,638 599,119 375,638 599,077Disposals/Redemptions (333,394) (344,150) (306,239) (302,557) Changes in fair value 16,744 1,991 16,252 4,618 ______________ ______________ ______________ ______________
At 31 December 987,398 934,837 962,651 883,378 _________ _________ _________ _________Debt instruments with a carrying amount of §126,438,000 (2011: §125,720,000) have been pledged against the provision of credit lines by the Central Bank of Malta. At 31 December 2012, no balances were outstanding against these credit lines. In addition debt securities with a carrying amount of §19,004,000 (2011: §17,979,000) have been pledged in favour of the Depositors’ Compensation Scheme (refer to note 41).
b Equity and other non-fixed income instruments available-for-sale
Group Bank ________________________________ ________________________________
2012 2011 2012 2011 ______________ ______________ ______________ ______________
§000 §000 §000 §000 Issued by issuers other than public bodies and banks– local others 59 1,979 56 355– foreign others 14 14 14 14 ______________ ______________ ______________ ______________ 73 1,993 70 369 _________ _________ _________ _________Listing status– local unlisted 59 1,979 56 355– foreign unlisted 14 14 14 14 ______________ ______________ ______________ ______________
73 1,993 70 369 _________ _________ _________ _________At 1 January 1,993 1,956 369 367Disposals (1,665) – – –Impairment (300) – (300) –Changes in fair value 45 37 1 2 ______________ ______________ ______________ ______________At 31 December 73 1,993 70 369 _________ _________ _________ _________As at the reporting date, total impairment loss on the group’s equity and other non-fixed income instruments available-for-sale amounted to §347,000 (2011: §640,000).

84
H S B C B A N K M A L T A P . L . C .
Notes on the Financial Statements (continued)
22 Loans and advances to banks
Group Bank ________________________________ ________________________________
2012 2011 2012 2011 ______________ ______________ ______________ ______________
§000 §000 §000 §000 Repayable on call and at short notice 2430,129 295,662 427,542 295,609Term loans and advances 251,223 342,294 251,223 342,294 ______________ ______________ ______________ ______________
681,352 637,956 678,765 637,903 _________ _________ _________ _________Amounts include:– due from Group companies 667,464 622,726 667,464 622,726 _________ _________ _________ _________
23 Loans and advances to customers
2012 2011 ______________ ______________
§000 §000 Group/Bank Repayable on call and at short notice 425,387 444,167Term loans and advances 2,995,206 2,958,125 ______________ ______________
Gross loans and advances to customers 3,420,593 3,402,292Allowances for uncollectability (66,180) (58,002) ______________ ______________
Net loans and advances to customers 3,354,413 3,344,290 _________ _________Allowances for uncollectability– individually assessed allowances 52,904 45,402– collectively assessed allowances 13,276 12,600 ______________ ______________
66,180 58,002 _________ _________The balance of individually assessed allowances at the reporting date includes §31,676,000 (2011: §25,157,000) in respect of interest in suspense which has been netted off against interest receivable.
24 Shares in subsidiary companies
Bank Incorporated Nature of EquityName of company in business interest 2012 2011 ______________ ______________ ______________
% §000 §000
HSBC Life Assurance Malta Life 99.99 28,578 28,578 (Malta) Ltd insurance
HSBC Global Asset Malta Portfolio 99.99 5,940 5,940 Management (Malta) Limited management services
HSBC Securities Services Malta Fund 99.99 1,166 1,166 (Malta) Limited administration services
HSBC Stockbrokers (Malta) Limited Malta Stockbroking 99.99 23 23 services ______________ ______________
35,707 35,707 _________ _________HSBC Life Assurance (Malta) Ltd holds investment in the following subsidiary:
Name of company Incorporated Nature of Equity in business interest 2012 2011 ______________ ______________ ______________
% §000 §000
HSBC Insurance Management Services Malta Insurance 99.99 25 25 (Europe) Limited Management Services

85
25 Intangible assets
Group Bank ________________________________ ________________________________
2012 2011 2012 2011 ______________ ______________ ______________ ______________
§000 §000 §000 §000 Software 12,044 12,568 11,943 12,497Present value of in-force long-term insurance business 79,166 76,443 – – ______________ ______________ ______________ ______________
91,210 89,011 11,943 12,497 _________ _________ _________ _________a Software
Group Bank ________________________________ ________________________________
2012 2011 2012 2011 ______________ ______________ ______________ ______________
§000 §000 §000 §000 CostAt 1 January 23,840 18,780 22,558 17,383Additions 3,089 5,758 3,034 5,729Disposals (873) (698) (873) (554) ______________ ______________ ______________ ______________
At 31 December 26,056 23,840 24,719 22,558 ______________ ______________ ______________ ______________
AmortisationAt 1 January 11,272 11,110 10,061 9,800Charge for the year 2,566 860 2,541 815Disposals (448) (698) (448) (554)Impairments losses 622 – 622 – ______________ ______________ ______________ ______________
At 31 December 14,012 11,272 12,776 10,061 ______________ ______________ ______________ ______________
Carrying amount at 1 January 12,568 7,670 12,497 7,583 _________ _________ _________ _________Carrying amount at 31 December 12,044 12,568 11,943 12,497 _________ _________ _________ _________
b Present value of in-force long-term insurance business Group ________________________________
2012 2011 ______________ ______________
§000 §000 At 1 January 76,443 62,985Addition from current year new business 8,344 6,251Movement from in-force business (5,621) 7,207 ______________ ______________
At 31 December 79,166 76,443 _________ _________The following are the key assumptions used in the computation of the group’s PVIF in the current and comparative periods:
Risk free rate Euro swap curve
Risk adjusted discount rate Euro swap curve + 50 bps Operational Risk Margin
Expenses inflation French inflation swap curve modified for Malta
Lapse rate Different rates for different products

86
H S B C B A N K M A L T A P . L . C .
Notes on the Financial Statements (continued)
26 Property, plant and equipment
Land and Computer building s equipment Others Total ______________ ______________ ______________ ______________
§000 §000 §000 §000Group Cost/revaluationAt 1 January 2012 44,233 17,194 45,019 106,446Acquisitions 282 899 1,829 3,010Revaluation (5,120) – – (5,120)Disposals (23) (480) (2,740) (3,243) ______________ ______________ ______________ ______________
At 31 December 2012 39,372 17,613 44,108 101,093 ______________ ______________ ______________ ______________
Depreciation and impairment lossesAt 1 January 2012 1,115 13,915 31,303 46,333Charge for the year 526 939 2,593 4,058Revaluation (1,098) – – (1,098) Reversal of impairment losses – – (99) (99)Disposals (18) (464) (2,491) (2,973) ______________ ______________ ______________ ______________
At 31 December 2012 525 14,390 31,306 46,221 ______________ ______________ ______________ ______________
Carrying amount at 1 January 2012 43,118 3,279 13,716 60,113 _________ _________ _________ _________Carrying amount at 31 December 2012 38,847 3,223 12,802 54,872 _________ _________ _________ _________Cost/revaluationAt 1 January 2011 46,978 19,208 49,007 115,193Acquisitions 71 422 2,779 3,272Disposals (2,816) (2,436) (6,767) (12,019) ______________ ______________ ______________ ______________
At 31 December 2011 44,233 17,194 45,019 106,446 ______________ ______________ ______________ ______________
Depreciation and impairment lossesAt 1 January 2011 1,678 15,315 32,713 49,706Charge for the year 579 1,036 3,585 5,200Impairment losses – – 529 529Disposals (1,142) (2,436) (5,524) (9,102) ______________ ______________ ______________ ______________
At 31 December 2011 1,115 13,915 31,303 46,333 ______________ ______________ ______________ ______________
Carrying amount at 1 January 2011 45,300 3,893 16,294 65,487 _________ _________ _________ _________Carrying amount at 31 December 2011 43,118 3,279 13,716 60,113 _________ _________ _________ _________ Group ________________________________
2012 2011 ______________ ______________
§000 §000Carrying amount of land and buildings occupied for own activities 38,944 43,021 _________ _________ Land and Computer buildings equipment Others Total ______________ ______________ ______________ ______________
§000 §000 §000 §000Bank Cost/revaluationAt 1 January 2012 44,338 16,947 44,803 106,088Acquisitions 282 897 1,824 3,003Revaluation (5,120) – – (5,120)Disposals (23) (480) (2,740) (3,243) ______________ ______________ ______________ ______________
At 31 December 2012 39,477 17,364 43,887 100,728 ______________ ______________ ______________ ______________

87
26 Property, plant and equipment (continued)
Land and Computer buildings equipment Others Total ______________ ______________ ______________ ______________
§000 §000 §000 §000Bank Depreciation and impairment lossesAt 1 January 2012 1,115 13,668 31,110 45,893Charge for the year 526 937 2,589 4,052Revaluation (1,098) – – (1,098)Reversal of impairment losses – – (99) (99)Disposals (18) (464) (2,491) (2,973) ______________ ______________ ______________ ______________
At 31 December 2012 525 14,141 31,109 45,775 ______________ ______________ ______________ ______________
Carrying amount at 1 January 2012 43,223 3,279 13,693 60,195 _________ _________ _________ _________Carrying amount at 31 December 2012 38,952 3,223 12,778 54,953 _________ _________ _________ _________Cost/revaluationAt 1 January 2011 47,083 18,961 48,806 114,850Additions 71 422 2,764 3,257Disposals (2,816) (2,436) (6,767) (12,019) ______________ ______________ ______________ ______________
At 31 December 2011 44,338 16,947 44,803 106,088 ______________ ______________ ______________ ______________
Depreciation and impairment lossesAt 1 January 2011 1,678 15,069 32,523 49,270Charge for the year 579 1,035 3,582 5,196Impairment losses – – 529 529Disposals (1,142) (2,436) (5,524) (9,102) ______________ ______________ ______________ ______________
At 31 December 2011 1,115 13,668 31,110 45,893 ______________ ______________ ______________ ______________
Carrying amount at 1 January 2011 45,405 3,892 16,283 65,580 _________ _________ _________ _________Carrying amount at 31 December 2011 43,223 3,279 13,693 60,195 _________ _________ _________ _________ Bank ________________________________
2012 2011 ______________ ______________
§000 §000Carrying amount of land and buildings occupied for own activities 38,952 43,223 _________ _________The carrying amount of land and buildings that would have been included in the financial statements had these assets been carried at cost less depreciation is §14,423,000 (2011: §14,672,000) for the group and the bank.
In December 2012, land and buildings were revalued on a market value basis as determined by a registered appraiser having an appropriate recognised professional qualification and recent experience in the location and category of the property being valued. Fair values were determined having regard to recent market transactions for similar properties in the same locations as the bank’s land and buildings.
27 Investment property
Fair Value Cost Fair Value Cost ______________ ______________ ______________ ______________
2012 2012 2011 2011 ______________ ______________ ______________ ______________
§000 §000 §000 §000GroupFreehold land and buildingsAs at 1 January 14,598 8,593 14,591 8,574Additions 34 34 19 19Fair value adjustments (149) – (12) –Disposals (12) (12) – – ______________ ______________ ______________ ______________
At 31 December 14,471 8,615 14,598 8,593 _________ _________ _________ _________

88
H S B C B A N K M A L T A P . L . C .
Notes on the Financial Statements (continued)
27 Investment property (continued) Fair Value Cost Fair Value Cost ______________ ______________ ______________ ______________
2012 2012 2011 2011 ______________ ______________ ______________ ______________
§000 §000 §000 §000
BankFreehold land and buildingsAs at 1 January 11,663 6,501 11,668 6,494Additions 9 9 7 7Fair value adjustments – – (12) –Disposals (12) (12) – – ______________ ______________ ______________ ______________
At 31 December 11,660 6,498 11,663 6,501 _________ _________ _________ _________During the year ended 31 December 2012, §884,000 (2011: §787,000) was recognised as rental income in profit or loss relating to investment property for the group. The bank recognised §687,000 (2011: §596,000) as rental income, which was received from a Group company.
28 Non-current assets held for sale
Group/Bank ________________________________
2012 2011 ______________ ______________
§000 §000 Assets acquired in satisfaction of debt 11,240 11,108Other – 1,870 ______________ ______________
11,240 12,978 _________ _________Repossessed properties are made available for sale in an orderly fashion, with the proceeds used to reduce or repay the outstanding indebtedness. The group does not generally occupy repossessed properties for its business use. In the main, repossessed property consists of immovable property.
29 Other assets
Group Bank ________________________________ ________________________________
2012 2011 2012 2011 ______________ ______________ ______________ ______________
§000 §000 §000 §000 Acceptances and endorsements 1,939 2,015 1,939 2,015Reinsurance assets 35,816 22,287 – –Other 8,754 6,907 7,043 6,591 ______________ ______________ ______________ ______________
46,509 31,209 8,982 8,606 _________ _________ _________ _________Amounts include:– due from Group companies 1,415 1,899 1,415 1,899 _________ _________ _________ _________

89
30 Prepayments and accrued income
Group Bank ________________________________ ________________________________
2012 2011 2012 2011 ______________ ______________ ______________ ______________
§000 §000 §000 §000 Accrued income 39,887 39,485 34,540 34,388Prepayments 1,234 1,144 1,159 1,139 ______________ ______________ ______________ ______________
41,121 40,629 35,699 35,527 _________ _________ _________ _________Amounts include:– due from Group companies 399 510 288 464 _________ _________ _________ _________– due from subsidiary companies – – 366 360 _________ _________ _________ _________
31 Deposits by banks
2012 2011 ______________ ______________
§000 §000Group/Bank Term deposits 219,518 357,428Repayable on demand 39,093 31,742 ______________ ______________
258,611 389,170 _________ _________Amounts include:– due to Group companies 237,425 371,510 _________ _________
32 Customer accounts
Group Bank ________________________________ ________________________________
2012 2011 2012 2011 ______________ ______________ ______________ ______________
§000 §000 §000 §000 Term deposits 1,753,256 1,876,167 1,756,003 1,885,426Repayable on demand 2,763,743 2,526,808 2,781,124 2,555,220 ______________ ______________ ______________ ______________
4,516,999 4,402,975 4,537,127 4,440,646 _________ _________ _________ _________Amounts include:– due to Group companies – 106 – 106 _________ _________ _________ _________– due to subsidiary companies – – 20,128 37,671 _________ _________ _________ _________
33 Deferred tax
Group Bank ________________________________ ________________________________
2012 2011 2012 2011 ______________ ______________ ______________ ______________
§000 §000 §000 §000Deferred tax (liabilities)/assets are attributable to the following:– excess of capital allowances over depreciation (1,410) (1,354) (1,413) (1,353)– allowances for uncollectibility 22,110 19,716 22,110 19,509– property sales tax consequences (6,347) (6,944) (6,007) (6,590)– fair value movements on investments (7,388) (2,970) (7,015) (2,538)– value of in-force life insurance business (27,708) (26,755) – –– fair value movement on policyholders’ investments 2,086 9,431 – –– retirement benefits 2,115 3,927 2,092 3,859– unutilised tax losses 2,039 – – –– other 1,413 994 1,486 1,010 ______________ ______________ ______________ ______________
(13,090) (3,955) 11,253 13,897 _________ _________ _________ _________

90
H S B C B A N K M A L T A P . L . C .
Notes on the Financial Statements (continued)
33 Deferred tax (continued) Group ____________________________________________________________________
At Recognised At 1 January in profit Recognised 31 December 2012 or loss in equity 2012 ______________ ______________ ______________ ______________
§000 §000 §000 §000Movement in temporary differences relating to:– excess of capital allowances over depreciation (1,354) (56) – (1,410)– allowances for uncollectibility 19,716 2,394 – 22,110 – property sales tax consequences (6,944) 14 583 (6,347)– fair value movements on investments (2,970) – (4,418) (7,388) – value of in-force life insurance business (26,755) (953) – (27,708)– fair value movement on policyholders’ investments 9,431 (7,345) – 2,086 – retirement benefits 3,927 (1,812) – 2,115– unutilised tax losses – 2,039 – 2,039 – other 994 665 (246) 1,413 ______________ ______________ ______________ ______________
(3,955) (5,054) (4,081) (13,090) _________ _________ _________ _________ Group ____________________________________________________________________
At Recognised At 1 January in profit Recognised 31 December 2011 or loss in equity 2011 ______________ ______________ ______________ ______________
§000 §000 §000 §000Movement in temporary differences relating to:– excess of capital allowances over depreciation (677) (677) – (1,354)– allowances for uncollectibility 15,682 4,034 – 19,716 – property sales tax consequences (6,936) (1) (7) (6,944)– fair value movements on investments (390) – (2,580) (2,970) – value of in-force life insurance business (22,045) (4,710) – (26,755)– fair value movement on policyholders’ investments 3,124 6,307 – 9,431 – retirement benefits 504 3,423 – 3,927– other 1,468 (218) (256) 994 ______________ ______________ ______________ ______________
(9,270) 8,158 (2,843) (3,955) _________ _________ _________ _________ Bank ____________________________________________________________________
At Recognised At 1 January in profit Recognised 31 December 2012 or loss in equity 2012 ______________ ______________ ______________ ______________
§000 §000 §000 §000Movement in temporary differences relating to:– excess of capital allowances over depreciation (1,353) (60) – (1,413)– allowances for uncollectibility 19,509 2,601 – 22,110– property sales tax consequences (6,590) – 583 (6,007)– fair value movements on investments (2,538) – (4,477) (7,015)– retirement benefits 3,859 (1,767) – 2,092 – other 1,010 691 (215) 1,486 ______________ ______________ ______________ ______________
13,897 1,465 (4,109) 11,253 _________ _________ _________ _________

91
33 Deferred tax (continued) Bank ____________________________________________________________________
At Recognised At 1 January in profit Recognised 31 December 2011 or loss in equity 2011 ______________ ______________ ______________ ______________
§000 §000 §000 §000Movement in temporary differences relating to:– excess of capital allowances over depreciation (675) (678) – (1,353)– allowances for uncollectibility 15,533 3,976 – 19,509– property sales tax consequences (6,583) – (7) (6,590)– fair value movements on investments (164) – (2,374) (2,538)– retirement benefits 503 3,356 – 3,859 – other 1,441 (199) (232) 1,010 ______________ ______________ ______________ ______________
10,055 6,455 (2,613) 13,897 _________ _________ _________ _________The group’s deferred tax assets and liabilities on the statement of financial position have not been off-set to the extent that there is no legally enforceable right of set-off with the tax authorities.
34 Liabilities to customers under investment contracts
Group ______________________________
2012 2011 ______________ ______________
§000 §000At 1 January 16,920 18,962Premiums received 89 552Amounts paid on surrender and other termination during the year (1,500) (1,381)Changes in unit prices and other movements 1,745 (1,213) ______________ ______________
At 31 December 17,254 16,920 _________ _________35 Liabilities under insurance contracts issued
Group ______________________________
Gross Gross ______________ ______________
2012 2011 ______________ ______________
§000 §000Life insurance (non-linked)Provisions for policyholders 341,956 317,835Outstanding claims 2,489 2,212 ______________ ______________
Total non-linked 344,445 320,047 _________ _________Life insurance (linked)Provisions for policyholders 148,609 116,561Outstanding claims 200 64 ______________ ______________
Total linked 148,809 116,625 _________ _________Total liabilities under insurance contracts 493,254 436,672 _________ _________

92
H S B C B A N K M A L T A P . L . C .
Notes on the Financial Statements (continued)
35 Liabilities under insurance contracts issued (continued) Group _____________________________________________________________________
Non-linked Linked business business All business __________________ __________________ __________________
Provisions Provisions for policy- for policy- Outstanding holders holders claims Total __________________ __________________ __________________ __________________
2012 2012 2012 2012 __________________ __________________ __________________ __________________
§000 §000 §000 §000At 1 January 317,835 116,561 2,276 436,672Claims in respect of new business – 30,782 4,464 35,246Movement for the year 24,121 1,266 (2,858) 22,529Previous year claims paid – – (1,193) (1,193) __________________ __________________ __________________ __________________
At 31 December 341,956 148,609 2,689 493,254 ______________ ______________ ______________ ______________ __________________ __________________ __________________ __________________
2011 2011 2011 2011 __________________ __________________ __________________ __________________
§000 §000 §000 §000At 1 January 285,546 112,346 12,569 410,461Claims in respect of new business – 28,288 2,251 30,539Movement for the year 32,289 (24,073) (891) 7,325Previous year claims paid – – (11,653) (11,653) __________________ __________________ __________________ __________________
At 31 December 317,835 116,561 2,276 436,672 ______________ ______________ ______________ ______________36 Other liabilities
Group Bank ________________________________ ________________________________
2012 2011 2012 2011 ______________ ______________ ______________ ______________
§000 §000 §000 §000 Bills payable 10,346 11,288 10,346 11,288Cash collateral for commitments 255 190 255 190Obligations under finance leases – 67 – 67Acceptances and endorsements 1,939 2,015 1,939 2,015Other 16,682 24,585 11,855 20,365 ______________ ______________ ______________ ______________
29,222 38,145 24,395 33,925 _________ _________ _________ _________37 Accruals and deferred income
Group Bank ________________________________ ________________________________
2012 2011 2012 2011 ______________ ______________ ______________ ______________
§000 §000 §000 §000Accrued interest 17,186 18,553 17,258 18,670Other 16,373 17,492 14,885 16,548 ____________ ______________ ______________ ______________
33,559 36,045 32,143 35,218 _________ _________ _________ _________Amounts include:– due to Group companies 3,997 3,723 2,951 3,296 _________ _________ _________ _________– due to subsidiary companies – – 72 117 _________ _________ _________ _________

93
38 Provisions for liabilities and other charges
Group Bank ________________________________ ________________________________
2012 2011 2012 2011 ______________ ______________ ______________ ______________
§000 §000 §000 §000 At 1 January 11,251 2,548 11,031 2,511Provisions made during the year 6,575 10,832 6,543 10,627Provisions reversed during the year – (1,704) – (1,704)Provisions utilised during the year (10,333) (425) (10,151) (403) ______________ ______________ ______________ ______________
At 31 December 7,493 11,251 7,423 11,031 _________ _________ _________ _________Provisions for liabilities and other charges include amounts raised in relation to litigations and early voluntary retirement scheme.
The bank is a party to legal actions arising from normal business operations. Management believes that adequate provisions have been made against these litigations, based on legal advice, on the timing and amount of the possible economic outflows.
Refer to note 13 for details of the early voluntary retirement scheme provision.
39 Subordinated liabilities
Group Bank ________________________________ ________________________________
2012 2011 2012 2011 ______________ ______________ ______________ ______________
§000 §000 §000 §000 4.60% subordinated unsecured loan stock 2017 58,113 58,082 58,113 58,0825.90% subordinated unsecured loan stock 2018 29,127 29,126 29,874 29,851 ______________ ______________ ______________ ______________
87,240 87,208 87,987 87,933 _________ _________ _________ _________Subordinated loan liabilities held by:– subsidiary companies – – 747 725 _________ _________ _________ _________The above liabilities will, in the event of the winding up of the bank, be subordinated to the claims of depositors and all other creditors. The group did not have any defaults of interest or other breaches with respect to its subordinated liabilities during the current and comparative period.
40 Share capital
2012 2011 ______________ ______________
§000 §000 Authorised470,000,000 Ordinary shares of 30 cent each 141,000 141,000 _________ _________Issued and fully paid up291,840,000 Ordinary shares of 30 cent each 87,552 87,552 _________ _________
41 Reserves
Revaluation reserve
The revaluation reserve comprises the surplus arising on the revaluation of the group’s freehold and long leasehold properties and the cumulative net change in fair values of available-for-sale financial investments held by the group, net of deferred taxation. The revaluation reserve is not available for distribution.
Depositor Compensation Scheme reserve
Retained earnings is inclusive of Depositor Compensation Scheme reserve amounting to §26,643,000. This reserve is excluded from the Own Funds calculation (refer to note 5).
As at 31 December 2012, debt securities with a carrying amount of §19,004,000 had been pledged in terms of the Depositor Compensation Scheme (refer to note 21a). Central Bank balances amounting to §6,200,000 have also been pledged in favour of the scheme.
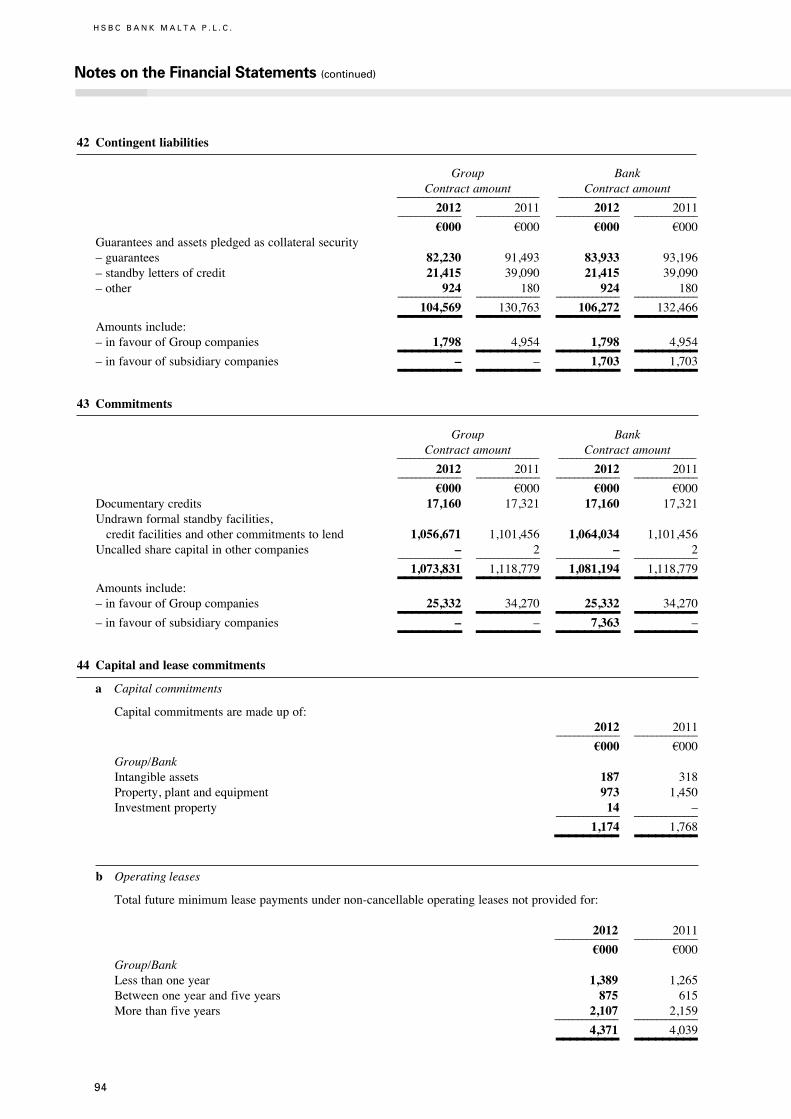
94
H S B C B A N K M A L T A P . L . C .
Notes on the Financial Statements (continued)
42 Contingent liabilities
Group Bank Contract amount Contract amount ________________________________ _______________________________
2012 2011 2012 2011 ______________ ______________ ______________ ______________
§000 §000 §000 §000 Guarantees and assets pledged as collateral security– guarantees 82,230 91,493 83,933 93,196– standby letters of credit 21,415 39,090 21,415 39,090– other 924 180 924 180 ______________ ______________ ______________ ______________
104,569 130,763 106,272 132,466 _________ _________ _________ _________Amounts include:– in favour of Group companies 1,798 4,954 1,798 4,954 _________ _________ _________ _________– in favour of subsidiary companies – – 1,703 1,703 _________ _________ _________ _________
43 Commitments
Group Bank Contract amount Contract amount ________________________________ _______________________________
2012 2011 2012 2011 ______________ ______________ ______________ ______________
§000 §000 §000 §000 Documentary credits 17,160 17,321 17,160 17,321Undrawn formal standby facilities, credit facilities and other commitments to lend 1,056,671 1,101,456 1,064,034 1,101,456Uncalled share capital in other companies – 2 – 2 ______________ ______________ ______________ ______________
1,073,831 1,118,779 1,081,194 1,118,779 _________ _________ _________ _________Amounts include:– in favour of Group companies 25,332 34,270 25,332 34,270 _________ _________ _________ _________– in favour of subsidiary companies – – 7,363 – _________ _________ _________ _________
44 Capital and lease commitments
a Capital commitments
Capital commitments are made up of: 2012 2011 ______________ ______________
§000 §000Group/BankIntangible assets 187 318Property, plant and equipment 973 1,450Investment property 14 – ______________ ______________
1,174 1,768 _________ _________b Operating leases
Total future minimum lease payments under non-cancellable operating leases not provided for:
2012 2011 ______________ ______________
§000 §000 Group/Bank Less than one year 1,389 1,265Between one year and five years 875 615More than five years 2,107 2,159 ______________ ______________
4,371 4,039 _________ _________

95
44 Capital and lease commitments (continued)
c Finance leases
Finance lease payments, both principal and finance charge, are payable as follows: 2012 2011 ______________ ______________
§000 §000 Group/Bank Less than one year – 89Between one year and five years – – ______________ ______________
Total minimum lease payments – 89Finance charges – (22) ______________ ______________
Present value of minimum lease payments – 67 _________ _________45 Dividends
Bank ____________________________________________________________________
2012 2011 2012 2011 ______________ ______________ ______________ ______________
% per share % per share §000 §000Gross of income tax% per 30 cent share– prior year’s final 24 26 21,012 22,472– interim 33 27 29,184 23,931 ______________ ______________ ______________ ______________
57 53 50,196 46,403 _________ _________ _________ _________ Cent Cent per share per share §000 §000Net of income taxcent per 30 cent share– prior year’s final 4.68 5.01 13,658 14,607– interim 6.50 5.33 18,970 15,555 ______________ ______________ ______________ ______________
11.18 10.34 32,628 30,162 _________ _________ _________ _________The Directors have proposed a final gross ordinary dividend of 7.9 cent (2011: 7.2 cent) per share. The final dividend will be payable to shareholders on the bank’s register as at 19 March 2013.
46 Cash and cash equivalents
Group Bank ________________________________ ________________________________
2012 2011 2012 2011 ______________ ______________ ______________ ______________
§000 §000 §000 §000 Balances of cash and cash equivalents are analysed below:Cash 31,712 30,960 31,711 30,959Balances with Central Bank of Malta (excluding reserve deposit) 30,902 16,942 30,902 16,942Loans and advances to banks 623,580 548,039 620,993 547,986Deposits by banks (257,533) (388,178) (257,533) (388,178) ______________ ______________ ______________ ______________
Per Statements of Cash Flows 428,661 207,763 426,073 207,709
Adjustment to reflect balances with contractual maturity of more than three months 56,694 186,729 56,694 186,729 ______________ ______________ ______________ ______________
Per Statements of Financial Position 485,355 394,492 482,767 394,438 _________ _________ _________ _________

96
H S B C B A N K M A L T A P . L . C .
Notes on the Financial Statements (continued)
46 Cash and cash equivalents (continued)
Group Bank ________________________________ ________________________________
2012 2011 2012 2011 ______________ ______________ ______________ ______________
§000 §000 §000 §000 Analysed as follows:Cash and balances with Central Bank of Malta (excluding reserve deposit) 62,614 47,902 62,613 47,901Malta Government Treasury Bills – 97,804 – 97,804Loans and advances to banks 681,352 637,956 678,765 637,903Deposits by banks (258,611) (389,170) (258,611) (389,170) ______________ ______________ ______________ ______________
485,355 394,492 482,767 394,438 _________ _________ _________ _________47 Segmental analysis
a Class of business
The group’s segments are organised into three global businesses; Retail Banking and Wealth Management, Commercial Banking and Global Banking and Markets. The global businesses reflect the way the CEO, as chief operating decision-maker, reviews financial information in order to make decisions about allocating resources and assessing performance. Information provided to the chief operating decision-maker is measured in accordance with IFRSs.
Retail Banking Global and Wealth Commercial Banking Group Management Banking and Markets Intersegment Total ______________ ______________ ______________ ______________ ______________
2012 2012 2012 2012 2012 ______________ ______________ ______________ ______________ ______________
§000 §000 §000 §000 §000
Group
Net interest income– External 45,419 67,320 20,361 – 133,100 – Inter-segment 15,866 (13,800) (2,066) – – _________ _________ _________ _________ _________ 61,285 53,520 18,295 – 133,100 Net non-interest income– External 39,633 12,618 12,325 – 64,576 – Inter-segment (686) 658 927 (899) – _________ _________ _________ _________ _________ 38,947 13,276 13,252 (899) 64,576 External employee compensation and benefits (36,722) (12,762) (5,196) – (54,680) _________ _________ _________ _________ _________General and administrative expenses– External (25,005) (8,247) (1,699) – (34,951) – Inter-segment (899) – – 899 – _________ _________ _________ _________ _________ (25,904) (8,247) (1,699) 899 (34,951)
External Depreciation (3,224) (677) (158) – (4,059) _________ _________ _________ _________ _________External Amortisation (1,724) (757) (85) – (2,566) _________ _________ _________ _________ _________External Net impairment (2,185) (3,332) (121) – (5,638) _________ _________ _________ _________ _________External Net provisions for liabilities and other charges (215) (79) (153) – (447) _________ _________ _________ _________ _________Profit before tax 30,258 40,942 24,135 – 95,335 _________ _________ _________ _________ _________AssetsSegment total assets 2,595,765 1,564,874 1,725,835 – 5,886,474 _________ _________ _________ _________ _________Average total assets 2,511,192 1,627,247 1,717,219 – 5,855,658 _________ _________ _________ _________ _________Total Equity 197,198 177,737 25,663 – 400,598 _________ _________ _________ _________ _________

97
47 Segmental analysis (continued)
a Class of business (continued) Retail Banking Global and Wealth Commercial Banking Group Management Banking and Markets Intersegment Total ______________ ______________ ______________ ______________ ______________
2011 2011 2011 2011 2011 ______________ ______________ ______________ ______________ ______________
§000 §000 §000 §000 §000
Group
Net interest income– External 44,614 68,129 16,516 – 129,259 – Inter-segment 16,514 (15,024) (1,490) – – _________ _________ _________ _________ _________ 61,128 53,105 15,026 – 129,259 Net non-interest income– External 35,109 25,670 4,827 – 65,606 – Inter-segment (694) 386 884 (576) – _________ _________ _________ _________ _________ 34,415 26,056 5,711 (576) 65,606 External employee compensation and benefits (39,726) (16,280) (2,801) – (58,807) _________ _________ _________ _________ _________General and administrative expenses– External (23,724) (7,287) (2,322) – (33,333) – Inter-segment (576) – – 576 – _________ _________ _________ _________ _________ (24,300) (7,287) (2,322) 576 (33,333)
External Depreciation (3,752) (1,448) – – (5,200) _________ _________ _________ _________ _________External Amortisation (566) (258) (36) – (860) _________ _________ _________ _________ _________External Net impairment (6,102) (2,180) 32 – (8,250) _________ _________ _________ _________ _________External Net provisions for liabilities and other charges – 204 (314) – (110) _________ _________ _________ _________ _________Profit before tax 21,097 51,912 15,296 – 88,305 _________ _________ _________ _________ _________Assets
Segment total assets 2,426,710 1,689,684 1,708,667 – 5,825,061 _________ _________ _________ _________ _________Average total assets 2,355,091 1,689,947 1,692,599 – 5,737,637 _________ _________ _________ _________ _________Total Equity 174,733 168,127 23,605 – 366,465 _________ _________ _________ _________ _________
b Geographical segments
The group’s activities are carried out within Malta. There are no identifiable geographical segments or other material concentrations.
c Products and services
The group provides a comprehensive range of banking and related financial services to its customers. The products and services offered to customers are organised by global businesses.
– Retail Banking and Wealth Management (‘RBWM’) offers a broad range of products and services to meet the personal banking, consumer finance and wealth management needs of individual customers. Typically, customer offerings include personal banking products (current and savings accounts, mortgages and personal loans, credit cards, debit cards and local and international payment services) and wealth management services (insurance and investment products, global asset management services and financial planning services).

Notes on the Financial Statements (continued)
98
H S B C B A N K M A L T A P . L . C .
47 Segmental analysis (continued)
c Products and services (continued)
– Commercial Banking (‘CMB’) product offerings include the provision of receivables financing services, payments and cash management, international trade finance, commercial cards, insurance, cash and derivatives in foreign exchange and interest rates, and online and direct banking offerings.
– Global Banking and Markets (‘GB&M’) provides tailored solutions to corporate and institutional clients. The client-focused business lines deliver a full range of banking capabilities including financing, advisory and transaction services; a markets business that provides services in rates, foreign exchange, money markets and securities services; and principal investment activities.
48 Related party transactions
During the course of banking operations, the group conducted business transactions with entities owned by the ultimate parent and its subsidiaries on an arm’s length basis.
Executive Directors participate in the HSBC Group share option plans (refer to note 13).
a Transactions, arrangements and agreements involving Directors and others
Particulars of transactions, arrangements and agreements entered into with Directors, connected persons and companies controlled by them and with key management personnel of HSBC Bank Malta p.l.c.:
Group Bank ________________________________ ________________________________
Balance at Balance at Balance at Balance at end of year end of year end of year end of year ______________ ______________ ______________ ______________
2012 2011 2012 2011 ______________ ______________ ______________ ______________
§000 §000 §000 §000Directors, connected persons and companies controlled by them Loans 35,962 41,799 35,962 41,799Credit card transactions 8 – 8 –Guarantees 926 1,488 926 1,488Commitments to lend 36,114 27,866 36,114 27,866 Senior executive management Loans 736 585 736 585Credit card transactions 51 48 46 44
The above banking facilities are part of long-term commercial relationships and were made in the ordinary course of business and on substantially the same terms, including interest rates and security, as for comparable transactions with persons of a similar standing or, where applicable, with other employees. The transactions did not involve more than the normal risk of repayment or present other unfavourable features.
b Compensation to Directors and key management personnel
Group Bank ________________________________ ________________________________
2012 2011 2012 2011 ______________ ______________ ______________ ______________
§000 §000 §000 §000 Short-term employee benefits 3,659 2,376 3,402 2,172Retirement benefits 302 268 302 268Other long-term benefits 5 – 5 –Share-based payments 56 103 56 103 ______________ ______________ ______________ ______________
4,022 2,747 3,765 2,543 _________ _________ _________ _________ Details of Directors’ fees and emoluments are stated in note 15.

99
48 Related party transactions (continued)
c Transactions with other related parties
Information relating both to transactions with HSBC Holdings plc and its subsidiaries as well as with subsidiary companies of HSBC Bank Malta p.l.c. are stated in the ‘Notes on the Financial Statements’ where the following are disclosed.
Note 6 – interest and similar income Note 7 – interest expense Note 8 – net fee and commission income Note 9 – dividend income Note 13 – employee compensation and benefits Note 19 – derivatives Note 22 – loans and advances to banks Note 24 – shares in subsidiary companies Note 27 – investment property Note 29 – other assetsNote 30 – prepayments and accrued incomeNote 31 – deposits by banksNote 32 – customer accountsNote 37 – accruals and deferred incomeNote 39 – subordinated liabilitiesNote 42 – contingent liabilitiesNote 43 – commitments
Included in Interest and similar income (refer to note 6) and in Interest expense (refer to note 7), the group recognised interest amounting to §2,186,000 (2011: §2,880,000) and §16,000 (2011:§256,000) respectively, on advances and deposits placed with an intermediate parent.
Included in Net fee and commission income (refer to note 8), the group recognised commission amounting to §677,000 (2011: §997,000) received from an intermediate parent.
Furthermore, expenditure relating to transactions with HSBC Holdings plc and its subsidiaries amounting to §3,197,000 (2011: §2,838,000) for the group and §2,869,000 (2011: §2,634,000) for the bank is included in Employee compensation and benefits and §12,350,000 (2011:§10,539,000) for the group and §11,273,000 (2011: §9,578,000) for the bank is included within General and administrative expenses.
49 Trust and custody activities
The group provides trust and custody services to individuals, trusts, retirement benefit plans and other institutions, whereby it holds and manages assets or invests funds received in various financial instruments at the direction of the customer. The group receives fee income for providing these services. Trust assets and assets held in custody are not assets of the group and are not recognised in the statements of financial position. The group is not exposed to any credit risk relating to such placements, as it does not guarantee these investments.
At 31 December 2012, the total assets held by the group on behalf of customers were §3,801,190,000 (2011: §4,036,218,000).
50 Registered office and ultimate parent company
The addresses of the registered and principal offices of the bank and its subsidiary companies included in the consolidated financial statements can be found in a separate statement which is filed at the Registrar of Companies in accordance with the provisions of the Fourth Schedule to the Companies Act, 1995.
The ultimate parent company of HSBC Bank Malta p.l.c. is HSBC Holdings plc, and the immediate parent company is HSBC Europe B.V., which are incorporated and registered in England. The registered address of both companies is 8 Canada Square, London E14 5HQ, United Kingdom. Copies of the HSBC Holdings plc Annual Review 2012 and Annual Report and Accounts 2012 may be obtained from its registered office, from 30 March 2013 or viewed on www.hsbc.com from 4 March 2013.

Notes on the Financial Statements (continued)
100
H S B C B A N K M A L T A P . L . C .
51 Investor compensation scheme
In accordance with the provisions of the Investor Compensation Scheme Regulations, 2003 issued under the Investment Services Act, 1994, licence holders are required to transfer a variable contribution to an Investor Compensation Scheme Reserve and place the equivalent amount with a bank, pledged in favour of the Scheme. Alternatively licence holders can elect to pay the amount of variable contribution directly to the Scheme.
HSBC Bank Malta p.l.c. and HSBC Stockbrokers (Malta) Limited have elected to pay the amount of the variable contribution directly to the Scheme.
52 Accounting estimates and judgements
In addition to disclosures set out in notes 4 and 25, the Directors considered the development, selection and disclosure of the group’s critical accounting policies and estimates and the application of these policies and estimates. Estimates and judgements are continually evaluated and are based on historical and other factors, including expectations of future events that are believed to be reasonable under the circumstances.
Critical accounting judgement in applying accounting policies
i Impairment losses on loans and advances
The group reviews its loan portfolio to assess impairment on an ongoing basis as relevant generic data is observed concerning risks associated with groups of loans with similar risk characteristics (refer to note 3(g)(ii)). As a result, the group makes judgements as to whether there is any observable data indicating that there is a measurable decrease in the estimated future cash flows from a portfolio of loans, before the decrease is actually identified with an individual loan in that portfolio. The evidence may include observable data indicating that there has been an adverse change in the relative economic situation of an asset group or in the credit status of borrowers in a group. Management uses estimates based on historical loss experience for assets with credit risk characteristics and objective evidence of impairment similar to those in the portfolio when scheduling its future cash flows. The methodology and assumptions used for estimating both the amount and timing of future cash flows are reviewed regularly to reduce any differences between loss estimates and actual loss experience.
ii Policyholder claims and benefits
The determination of the liabilities under long-term insurance contracts is dependent on estimates made by the group. Estimates are made as to the expected number of deaths for each of the years in which the group is exposed to risk. The group bases these estimates on Industry standard mortality tables that reflect recent historical mortality experience, adjusted where appropriate to reflect the group’s own experience. The estimated number of deaths determines the value of the benefit payments and the value of the valuation premiums. The main source of uncertainty is that epidemics such as AIDS, SARS, pandemic flu, swine flu and wide-ranging lifestyle changes, such as in eating, smoking and exercise habits, could result in future mortality being significantly worse than in the past for the age groups in which the group has significant exposure to mortality risk.
Estimates are also made as to future investment income arising from the assets backing long-term insurance contracts. These estimates are based on current market returns as well as expectations about future economic and financial developments. Interest rate assumptions on liabilities as at reporting date are based on the Euro swap rates curve. Appropriate margins were taken for bond portfolio and equities/property portfolio.
If the average future investment returns differs by +/-1% from management’s estimates, the insurance liability would decrease by §3,288,000 or increase by §4,858,000. In this case there is no relief arising from reinsurance contracts held.
If the number of deaths in future years differs by +/-10% from management’s estimate, the liability would increase by §649,000 or decrease by §594,000.
For long-term insurance contracts with fixed and guaranteed terms and with discretionary participation features, estimates of future deaths, investment returns and administration expenses form the assumptions used for calculating the liabilities during the life of the contract. A margin for risk and uncertainty is added to these assumptions. New estimates are made each subsequent year to reflect the current long-term outlook.

101
52 Accounting estimates and judgements (continued)
iii Fair value of derivatives
The fair value of financial instruments that are not quoted in active markets are determined by using valuation techniques. Where valuation techniques (for example models) are used to determine fair values, they are validated and periodically reviewed by qualified personnel independent of the area that created them. All models are certified before they are used, and models are calibrated to ensure that outputs reflect actual data and comparative market prices. To the extent practical, models use only observable data, however areas such as credit risk (both own and counterparty), volatilities and correlations require management to make estimates. Changes in assumptions about these factors could affect reported fair value of financial instruments.
iv Impairment of available-for-sale equity instruments
The group determines that available-for-sale equity investments are impaired when there has been a significant or prolonged decline in the fair value below its cost. This determination of what is significant or prolonged requires judgement. In making this judgement, the group evaluates among other factors, the normal volatility in share price. In addition, impairment may be appropriate when there is evidence of deterioration in the financial health of the investee, industry and sector performance, changes in technology, and operational and financial cash flows.

102
H S B C B A N K M A L T A P . L . C .
Independent Auditors’ Report to the Members of HSBC Bank Malta p.l.c.
Report on the financial statements
We have audited the financial statements of HSBC Bank Malta p.l.c. (the “bank”) and of the group of which the bank is the parent, as set out on pages 35 to 101, which comprise the statements of financial position as at 31 December 2012 and the income statements and statements of comprehensive income, changes in equity and cash flows for the year then ended, and notes, comprising a summary of significant accounting policies and other explanatory information.
Directors’ responsibility for the financial statements
As explained more fully in the Directors’ Responsibilities Statement set out on page 34, the directors are responsible for the preparation of financial statements that give a true and fair view in accordance with International Financial Reporting Standards as adopted by the EU, the Companies Act, 1995 (Chapter 386, Laws of Malta) (the “Act”), and the Banking Act, 1994 (Chapter 371, Laws of Malta), and, as regards the financial statements of the Group, Article 4 of the IAS Regulation, and for such internal control as the directors determine are necessary to enable the preparation of financial statements that are free from material misstatement, whether due to fraud or error.
Auditors’ responsibility
Our responsibility is to express an opinion on these financial statements based on our audit. This report, including the opinion, has been prepared for and only for the Company’s members as a body in accordance with Article 179 of the Act, and Article 31 of the Banking Act, 1994 (Chapter 371, Laws of Malta), and may not be appropriate for any other purpose.
In addition, we read the other information contained in the Annual Report 2012 and consider whether it is consistent with the audited financial statements. We consider the implications for our report if we become aware of any apparent material misstatements of fact or material inconsistencies with the financial statements.
We conducted our audit in accordance with International Standards on Auditing. Those standards require that we comply with ethical requirements and plan and perform the audit to obtain reasonable assurance about whether the financial statements are free from material misstatement.
An audit involves performing procedures to obtain audit evidence about the amounts and disclosures in the financial statements. The procedures selected depend on our judgement, including the assessment of the risks of material misstatement of the financial statements, whether due to fraud or error. In making those risk assessments, we consider internal control relevant to the entity’s preparation of financial statements that give a true and fair view in order to design audit procedures that are appropriate in the circumstances, but not for the purpose of expressing an opinion on the effectiveness of the entity’s internal control. An audit also includes evaluating the appropriateness of accounting policies used and the reasonableness of accounting estimates made by management, as well as evaluating the overall presentation of the financial statements.
We believe that the audit evidence we have obtained is sufficient and appropriate to provide a basis for our audit opinion.
Opinion on financial statements
In our opinion, the financial statements:
– give a true and fair view of the group’s and the bank’s financial position as at 31 December 2012, and of their financial performance and their cash flows for the year then ended in accordance with International Financial Reporting Standards as adopted by the EU; and
– have been properly prepared in accordance with the Companies Act, 1995 (Chapter 386, Laws of Malta), the Banking Act, 1994 (Chapter 371, Laws of Malta), and, as regards the financial statements of the group, Article 4 of the IAS Regulation.

103
Report on other legal and regulatory requirements
Matters on which we are required to report by the Banking Act, 1994 (Chapter 371, Laws of Malta)
In our opinion:
– we have obtained all the information and explanations which, to the best of our knowledge and belief, were necessary for the purpose of our audit;
– proper books of account have been kept by the bank so far as appears from our examination thereof;
– the bank’s financial statements are in agreement with the books of account; and
– to the best of our knowledge and belief and, on the basis of the explanations given to us, the financial statements give the information required by law in force in the manner so required.
Matters on which we are required to report by exception by the Companies Act, 1995 (Chapter 386, Laws of Malta) (the “Act”), other than those reported upon above
We have nothing to report in respect of the following matters where the Act requires us to report to you if, in our opinion:
– the information given in the Report of the Directors for the financial year for which the financial statements are prepared is not consistent with the financial statements; or
– certain disclosures of directors’ remuneration specified by the Act are not made.
Report required by Listing Rule 5.98 issued by the Listing Authority in Malta on the Directors’ Statement of Compliance with the Code of Principles of Good Corporate Governance (the “Principles”) outlined in Appendix 5.1 to Chapter 5 (Continuing Obligations) of the Listing Rules (the “Appendix”)
Listing Rule 5.97 requires an Issuer whose securities are admitted to trading on a Regulated Market operating in Malta to prepare a corporate governance statement. In addition, as an Issuer registered in Malta, Listing Rule 5.94 requires that the Issuer endeavours to adopt the Principles and to prepare a report explaining how it has complied with the provisions of the Appendix.
Our responsibility as independent auditors of the bank, is laid down by Listing Rule 5.98, which requires us to issue a report on the Directors’ Statement of Compliance with the Principles, which is set out on pages 24 to 30.
We review the Directors’ Statement of Compliance, and report as to whether this Statement provides the disclosures required by Listing Rule 5.97. We are not required to, and we do not, consider whether the Board’s statements on internal control and risk management systems cover all the risks and controls in relation to the financial reporting process, or form an opinion on the effectiveness of the group’s corporate governance procedures or its risks and control procedures, nor on the ability of the group to continue in operational existence.
In our opinion, the Directors’ Statement of Compliance set out on pages 24 to 30 provides the disclosures required by Listing Rule 5.97 issued by the Listing Authority of Malta.
Noel Mizzi (Partner) for and on behalf of
KPMGRegistered Auditors Portico BuildingMarina Street Pietà PTA 9044Malta
4 March 2013

104
H S B C B A N K M A L T A P . L . C .
Group Income Statements and Statements of Comprehensive Income: Five-Year Comparison
Group Income Statements
2012 2011 2010 2009 2008 ______________ ______________ ______________ ______________ ______________
§000 §000 §000 §000 §000
Interest receivable and similar income 174,637 175,962 169,012 169,038 245,510Interest expense (41,537) (46,703) (46,170) (64,068) (122,466) ______________ ______________ ______________ ______________ ______________
Net interest income 133,100 129,259 122,842 104,970 123,044
Net non-interest income 64,576 65,606 53,346 54,689 65,257Operating expenses (96,256) (98,200) (87,605) (83,769) (90,409) Net impairment (5,638) (8,250) (5,496) (4,429) (1,907) Net provisions for liabilities and other charges (447) (110) 1 (265) 102 ______________ ______________ ______________ ______________ ______________
Profit before tax 95,335 88,305 83,088 71,196 96,087Tax expense (33,733) (30,738) (29,327) (25,329) (32,972) ______________ ______________ ______________ ______________ ______________ Profit for the year 61,602 57,567 53,761 45,867 63,115 _________ _________ _________ _________ _________Profit attributable to shareholders 61,602 57,567 53,761 45,867 63,115 _________ _________ _________ _________ _________Earnings per share 21.1c 19.7c 18.4c 15.7c 21.6c _________ _________ _________ _________ _________Group Statements of Comprehensive Income
2012 2011 2010 2009 2008 ______________ ______________ ______________ ______________ ______________
§000 §000 §000 §000 §000
Profit attributable to shareholders 61,602 57,567 53,761 45,867 63,115 ______________ ______________ ______________ ______________ ______________
Other comprehensive incomeAvailable-for-sale investments:– fair value gains 16,671 1,193 1,178 17,496 (9,635) – fair value (gains)/losses transferred to profit or loss on disposal (4,049) 2,107 369 (1,071) (1,348) – amounts transferred to profit or loss on impairment – 4,179 198 – – Properties:– revaluation (4,022) – 2,117 – –Income taxes (3,835) (2,580) (699) (5,749) 3,844 ______________ ______________ ______________ ______________ ______________
Other comprehensive income for the year, net of tax 4,765 4,899 3,163 10,676 (7,139) _________ _________ _________ _________ _________Total comprehensive income for the year, net of tax 66,367 62,466 56,924 56,543 55,976 _________ _________ _________ _________ _________

105
H S B C B A N K M A L T A P . L . C .
Group Statements of Financial Position: Five-Year Comparison
2012 2011 2010 2009 2008 ______________ ______________ ______________ ______________ ______________
§000 §000 §000 §000 §000
AssetsBalances with Central Bank of Malta, Treasury Bills and cash 106,991 233,388 379,985 172,671 130,682Cheques in course of collection 7,211 22,685 9,011 10,764 9,308Derivatives 17,615 17,136 11,489 11,746 11,823Financial assets designated at fair value 454,591 370,080 305,569 248,553 279,714Financial investments 987,471 936,830 690,606 478,975 429,912Loans and advances to banks 681,352 637,956 714,901 747,657 1,072,306Loans and advances to customers 3,354,413 3,344,290 3,290,435 3,226,477 3,112,240Intangible assets 91,210 89,011 70,655 60,691 64,256Property, plant and equipment 54,872 60,113 65,487 65,397 70,684Investment property 14,471 14,598 14,591 14,588 14,050Non-current assets held for sale 11,240 12,978 9,674 10,604 9,168Current tax assets 6,134 – 4,712 6,164 2,966Deferred tax assets 11,273 14,158 10,181 9,053 15,916Other assets 46,509 31,209 34,425 20,712 25,824Prepayments and accrued income 41,121 40,629 38,710 33,748 47,239 ______________ ______________ ______________ ______________ ______________
Total assets 5,886,474 5,825,061 5,650,431 5,117,800 5,296,088 _________ _________ _________ _________ _________LiabilitiesDerivatives 17,857 17,810 12,311 11,044 11,381Deposits by banks 258,611 389,170 232,790 168,771 462,185Customer accounts 4,516,999 4,402,975 4,462,861 4,086,669 4,016,632Current tax liabilities 24 4,287 2,603 207 688Deferred tax liabilities 24,363 18,113 19,604 18,851 17,600Liabilities to customers under investment contracts 17,254 16,920 18,962 16,853 15,122Liabilities under insurance contracts issued 493,254 436,672 410,461 351,513 311,250Other liabilities 29,222 38,145 33,024 35,479 36,734Accruals and deferred income 33,559 36,045 34,287 33,422 53,930Provisions for liabilities and other charges 7,493 11,251 2,548 577 312Subordinated liabilities 87,240 87,208 87,150 87,827 87,777 ______________ ______________ ______________ ______________ ______________
Total liabilities 5,485,876 5,458,596 5,316,601 4,811,213 5,013,611 ______________ ______________ ______________ ______________ ______________
Total equity 400,598 366,465 333,830 306,587 282,477 ______________ ______________ ______________ ______________ ______________
Total liabilities and equity 5,886,474 5,825,061 5,650,431 5,117,800 5,296,088 _________ _________ _________ _________ _________Memorandum itemsContingent liabilities 104,569 130,763 128,947 119,449 129,925 _________ _________ _________ _________ _________Commitments 1,073,831 1,118,779 977,718 923,900 1,110,572 _________ _________ _________ _________ _________

106
H S B C B A N K M A L T A P . L . C .
Group Statements of Cash Flows: Five-Year Comparison
2012 2011 2010 2009 2008 ______________ ______________ ______________ ______________ ______________
§000 §000 §000 §000 §000
Net cash from/(used in) operating activities 258,354 29,772 103,151 293,498 (309,684) ______________ ______________ ______________ ______________ ______________
Cash flows (used in)/from investing activitiesDividends received 26 785 281 387 49Interest received from financial investments 41,356 34,624 25,575 16,115 23,884Purchase of financial investments (375,638) (599,079) (307,715) (218,285) (83,733)Proceeds from sale and maturity of financial investments 335,059 344,079 94,246 187,399 88,551Purchase of property, plant and equipment, investment property and intangible assets (6,133) (9,031) (11,038) (4,174) (7,556) Proceeds on sale of property, plant and equipment and intangible assets 502 2,094 453 2,097 9,755Proceeds on disposal of card acquiring business – 11,075 – – – ______________ ______________ ______________ ______________ ______________
Net cash flows (used in)/from investing activities (4,828) (215,453) (198,198) (16,461) 30,950 ______________ ______________ ______________ ______________ ______________
Cash flows used in financing activitiesDividends paid (32,628) (30,162) (30,162) (32,817) (50,649)Issue of subordinated loan stock – – – – 30,000Subordinated loan stock issue costs – – – – (226) ______________ ______________ ______________ ______________ ______________
Net cash used in financing activities (32,628) (30,162) (30,162) (32,817) (20,875) ______________ ______________ ______________ ______________ ______________
Increase/(decrease) in cash and cash equivalents 220,898 (215,843) (125,209) 244,220 (299,609) _________ _________ _________ _________ _________

107
H S B C B A N K M A L T A P . L . C .
Group Accounting Ratios: Five-Year Comparison
2012 2011 2010 2009 2008 ______________ ______________ ______________ ______________ ______________
% % % % %
Net operating income to total assets 3.4 3.3 3.1 3.1 3.6
Operating expenses to total assets 1.6 1.7 1.5 1.6 1.7
Cost efficiency ratio 48.7 50.4 49.7 52.5 48.0 Profit before tax to total assets 1.6 1.5 1.5 1.4 1.8
Profit before tax on equity 23.8 24.1 24.9 23.2 34.0
Profit after tax to equity 15.4 15.7 16.1 15.0 22.3
2012 2011 2010 2009 2008 ______________ ______________ ______________ ______________ ______________
Shares in issue (millions) 291.8 291.8 291.8 291.8 291.8
Net assets per 30 cent share (cent) 137.3 125.6 114.4 105.1 96.8
Earnings per 30 cent share (cent) 21.1 19.7 18.4 15.7 21.6
Dividend per 30 cent share (cent)– gross 17.2 15.9 15.9 17.3 26.7– net 11.2 10.3 10.3 11.2 17.4
Dividend cover 1.9 1.9 1.8 1.4 1.2

108
H S B C B A N K M A L T A P . L . C .
Group Financial Highlights in US dollars
2012 2011 ______________ ______________
US$000 US$000
Income statementsNet operating income 260,685 256,978Operating expenses (126,938) (129,501)Net impairment (7,435) (10,880)Net provisions for liabilities and other charges (589) (145) ______________ ______________
Profit before tax 125,723 116,452Tax expense (44,485) (40,536) ______________ ______________
Profit for the year 81,238 75,916 _________ _________Profit attributable to shareholders 81,238 75,916 _________ _________Statements of Financial PositionAssetsBalances with Central Bank of Malta, Treasury Bills and cash 141,094 307,780Cheques in course of collection 9,510 29,916Derivatives 23,230 22,599Financial assets designated at fair value through profit or loss 599,492 488,043Financial investments 1,302,227 1,235,445Loans and advances to banks 898,533 841,304Loans and advances to customers 4,423,633 4,410,282Intangible assets 120,283 117,383Property, plant and equipment 72,362 79,274Investment property 19,084 19,251Non-current assets held for sale 14,823 17,114Current tax assets 8,089 –Deferred tax assets 14,866 18,671Other assets 61,334 41,157Prepayments and accrued income 54,228 53,580 ______________ ______________
Total assets 7,762,788 7,681,799 _________ _________Liabilities and equityDerivatives 23,549 23,487Deposits by banks 341,043 513,218Customer accounts 5,956,792 5,806,423Current tax liabilities 32 5,653Deferred tax liabilities 32,129 23,886Liabilities to customers under investment contracts 22,754 22,313Liabilities under insurance contracts issued 650,479 575,861Other liabilities 38,537 50,305Accruals and deferred income 44,256 47,534Provisions for liabilities and other charges 9,881 14,838Subordinated liabilities 115,048 115,005Called up share capital 115,459 115,459Revaluation reserve 49,634 43,350Retained earnings 363,195 324,467 ______________ ______________
Total liabilities and equity 7,762,788 7,681,799 _________ _________The US Dollar Exchange as at 31 December 2012 was §1 = US$1.31875. Comparative results have also been translated at these rates.

109
H S B C B A N K M A L T A P . L . C .
Branches and Offices
MALTA OFFICESRegistered Office/Head Office116 Archbishop StreetValletta VLT 1444Tel: 2597 0000 Fax: 2380 4923
Retail Banking and Wealth ManagementBusiness Banking Centre80 Mill Street, Qormi QRM 3101Tel: 2380 1895 Fax: 2380 4537Premier Centre Wealth Management OfficeBusiness Banking Centre 80 Mill Street, Qormi QRM 3101 Tel: 2148 9100 Fax: 2380 2219
Commercial BankingBusiness Banking Centre80 Mill Street, Qormi QRM 3101Tel: 2380 1895 Fax: 2380 4532International Banking CentreBusiness Banking Centre 80 Mill Street QormiTel: 2380 1895 Fax: 2380 2676Trade ServicesBusiness Banking Centre80 Mill Street, Qormi QRM 3101Tel: 2380 1828 Fax: 2380 4535
Operations Centre80 Mill Street, Qormi QRM 3101Tel: 2380 0000 Fax: 2380 4923Card Products DivisionOperations Centre80 Mill Street, Qormi QRM 3101Tel: 2380 2380 Fax: 2380 4924Contact CentreOperations Centre80 Mill Street, Qormi QRM 3101Tel: 2380 2380 Fax: 2149 0613
Legal Office32 Merchants StreetValletta VLT 1173Tel: 2597 2406 Fax: 2597 2417Contracts Centre32 Merchants Street, Valletta VLT 1173Tel: 2597 3382 Fax: 2597 3306Inheritance Unit1st Floor, 32 Merchants StreetValletta VLT 1173Tel: 2380 3360/1/2/3/4Fax: 2380 3365
BRANCHES
BalzanBertu Fenech Square BZN 1032Tel: 2380 2380 Fax: 2380 1190Birkirkara 1 Naxxar Road BKR 9049Tel: 2380 2380 Fax: 2334 1690 BirΩebbu©a2 BirΩebbu©a Road BBG 1508Tel: 2380 2380 Fax: 2361 4790 Bu©ibbaBay Square SPB 2511Tel: 2380 2380 Fax: 2334 7390Cospicua50 Pilgrimage Street BML 1580Tel: 2380 2380 Fax: 2293 4090FguraCouncil of Europe Square FGR 1254Tel: 2380 2380 Fax: 2361 8790
GΩira196 The Strand GZR 1023Tel: 2380 2380 Fax: 2324 3990Óamrun121 St. Joseph Road HMR 1017Tel: 2380 2380 Fax: 2597 2390MarsascalaSt. Anthony Street MSK 9057Tel: 2380 2380 Fax: 2163 6860Mellie˙a6 Gorg Borg Olivier Street MLH 1027Tel: 2380 2380 Fax: 2334 6890Mosta63 Constitution Street MST 9058Tel: 2380 2380 Fax: 2334 6190Msida, University of Malta (Agency)Room 6, Ground FloorHumanities Building MSD 2080Tel: 2380 2380 Fax: 2133 1377Paola12 Antoine De Paule Square PLA 1261Tel: 2380 2380 Fax: 2361 1390Qormi38 St. Sebastian Street QRM 2331Tel: 2380 2380 Fax: 2380 5490Rabat 12 Saqqajja Square RBT 1190Tel: 2380 2380 Fax: 2334 5890San Ìwann198 Naxxar Road SGN 9030Tel: 2380 2380 Fax: 2324 7590St JuliansSt. George’s Road STJ 3202Tel: 2380 2380 Fax: 2324 2090St Paul’s BaySt. Paul’s Street SPB 3419Tel: 2380 2380 Fax: 2334 6490SliemaHigh Street SLM 1549Tel: 2380 2380 Fax: 2324 6090Sliema ShareShopHigh Street SLM 1549Tel: 2380 2381 Fax: 2324 6046SwieqiSt. Andrews Road SWQ 9020Tel: 2380 2380 Fax: 2324 8894 Valletta32 Merchants Street VLT 1173Tel: 2380 2380 Fax: 2597 3320Ûabbar19 Sanctuary Street ZBR 1010Tel: 2380 2380 Fax: 2361 4290Ûebbu©254 Main Street ZBG 1304Tel: 2380 2380 Fax: 2293 4490Ûejtun25th November Avenue ZTN 2018Tel: 2380 2380 Fax: 2361 5690Ûurrieq38 High Street ZRQ 1318Tel: 2380 2380 Fax: 2361 7890
GOzO OFFICESVictoria90 Republic Street VCT 1017Tel: 2380 2380 Fax: 2293 7192Victoria ShareShop90 Republic Street VCT 1016Tel: 2293 7103 Fax: 2293 7192 Nadur (Agency)18 St. Peter & St. Paul Square NDR 1010Tel: 2380 2380 Fax: 2155 0952Xag˙ra (Agency)8th September Avenue XRA 1011 (Corner with Victory Street)Tel: 2380 2380 Fax: 2155 6313
SUBSIDIARY COMPANIESHSBC Global Asset Management (Malta) LtdOperations Centre80 Mill Street Qormi QRM 3101Tel: 2380 5128 Fax: 2380 5191HSBC Life Assurance (Malta) LtdBusiness Banking Centre 80 Mill Street Qormi QRM 3101Tel: 2380 8699 Fax: 2380 8690HSBC Stockbrokers (Malta) LtdBusiness Banking Centre 80 Mill Street Qormi QRM 3101Tel: 2380 2211 Fax: 2380 2495HSBC Securities Services (Malta) LtdOperations Centre80 Mill Street Qormi QRM 3101Tel: 2380 5157 Fax: 2380 5190HSBC Insurance Management Services (Europe) LimitedBusiness Banking Centre80 Mill Street Qormi QRM 3101Tel: 2380 8699 Fax: 2380 8690


© Copyright HSBC Bank Malta p.l.c. 2013All rights reserved
No part of this publication may be reproduced, stored in a retrieval system, or transmitted, in any form or by any means, electronic, mechanical, photocopying, recording, or otherwise, without the prior written permission of HSBC Bank Malta p.l.c.
Published by HSBC Bank Malta p.l.c., Valletta.
Cover designed by Black Sun Plc, London; text pages designed by Group Communications (Asia), The Hongkong and Shanghai Banking Corporation Limited, Hong Kong.
Printed by Gutenberg Press, Gudja Malta on Lenza Green paper using vegetable oil based inks. Made in Austria, the paper comprises 100% post-consumer waste. Pulps used are totally chlorine-free.
ISSN 1811-7570ISBN 978-99932-12-14-0
PhotographyPage 2: Jon WrigleyPages 3, 8, 12 and 13: Andrew Gauci AttardPage 5: Ben CamillePage 14: Claire FarrugiaPages 16 and 17: Jon Wrigley and HSBC Bank plc

HSBC Bank Malta p.l.c. 116 Archbishop Street Valletta VLT 1444MaltaTelephone: 356 2597 0000www.hsbc.com.mt


![L-Im[iba Tajba fl-Iskejjel - Education Documents… · (Anti-Bullying Services) _____ 26 Il-Pro[ett Pilota _____ 27 Appendi`i Il-Kumitat Ministerjali g]all-Im[iba Tajba fl-Iskejjel_____](https://img.pdfslide.net/doc/110x75/6061898b5bb3cf49206a788a/l-imiba-tajba-fl-iskejjel-education-documents-anti-bullying-services-.jpg)