Embed Size (px)
Citation preview

HSBC Bank plc Interim Report 2016
H
SB
C B
ank p
lc In
terim R
epo
rt 2016
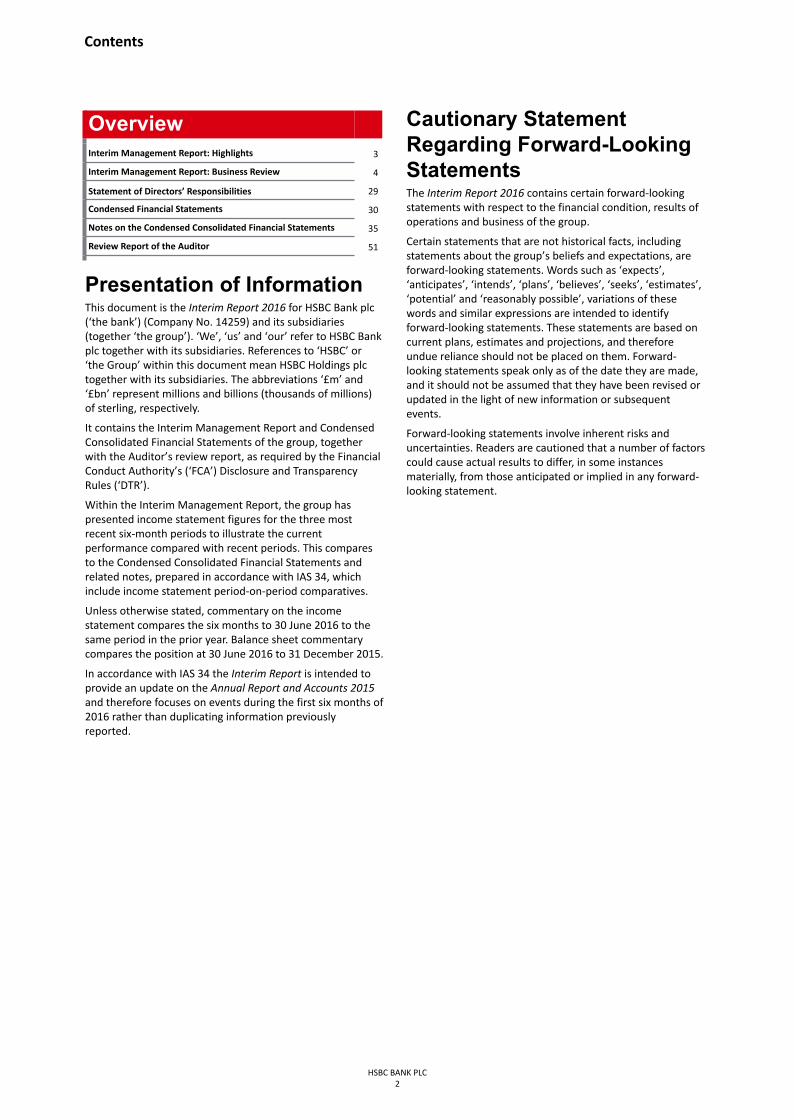
OverviewInterim Management Report: Highlights 3
Interim Management Report: Business Review 4
Statement of Directors’ Responsibilities 29
Condensed Financial Statements 30
Notes on the Condensed Consolidated Financial Statements 35
Review Report of the Auditor 51
Presentation of InformationThis document is the Interim Report 2016 for HSBC Bank plc(‘the bank’) (Company No. 14259) and its subsidiaries(together ‘the group’). ‘We’, ‘us’ and ‘our’ refer to HSBC Bankplc together with its subsidiaries. References to ‘HSBC’ or‘the Group’ within this document mean HSBC Holdings plctogether with its subsidiaries. The abbreviations ‘£m’ and‘£bn’ represent millions and billions (thousands of millions)of sterling, respectively.
It contains the Interim Management Report and CondensedConsolidated Financial Statements of the group, togetherwith the Auditor’s review report, as required by the FinancialConduct Authority’s (‘FCA’) Disclosure and TransparencyRules (‘DTR’).
Within the Interim Management Report, the group haspresented income statement figures for the three mostrecent six-month periods to illustrate the currentperformance compared with recent periods. This comparesto the Condensed Consolidated Financial Statements andrelated notes, prepared in accordance with IAS 34, whichinclude income statement period-on-period comparatives.
Unless otherwise stated, commentary on the incomestatement compares the six months to 30 June 2016 to thesame period in the prior year. Balance sheet commentarycompares the position at 30 June 2016 to 31 December 2015.
In accordance with IAS 34 the Interim Report is intended toprovide an update on the Annual Report and Accounts 2015and therefore focuses on events during the first six months of2016 rather than duplicating information previouslyreported.
Cautionary StatementRegarding Forward-LookingStatementsThe Interim Report 2016 contains certain forward-lookingstatements with respect to the financial condition, results ofoperations and business of the group.
Certain statements that are not historical facts, includingstatements about the group’s beliefs and expectations, areforward-looking statements. Words such as ‘expects’,‘anticipates’, ‘intends’, ‘plans’, ‘believes’, ‘seeks’, ‘estimates’,‘potential’ and ‘reasonably possible’, variations of thesewords and similar expressions are intended to identifyforward-looking statements. These statements are based oncurrent plans, estimates and projections, and thereforeundue reliance should not be placed on them. Forward-looking statements speak only as of the date they are made,and it should not be assumed that they have been revised orupdated in the light of new information or subsequentevents.
Forward-looking statements involve inherent risks anduncertainties. Readers are cautioned that a number of factorscould cause actual results to differ, in some instancesmaterially, from those anticipated or implied in any forward-looking statement.
Contents
HSBC BANK PLC2

Half-year to
30 Jun2016
30 Jun2015
31 Dec2015
For the period (£m)
Reported profit before tax 1,991 2,136 835
Adjusted profit before tax1 1,810 2,621 1,447
Net operating income before loan impairment charges and other credit risk provisions2 6,737 7,052 5,818
Profit attributable to shareholders of the parent company 1,410 1,529 413
At period end (£m)
Total equity attributable to shareholders of the parent company 40,823 34,975 37,497
Total assets 887,661 749,853 727,941
Risk-weighted assets 243,648 234,513 229,382
Loans and advances to customers (net of impairment allowances) 266,614 248,042 258,506
Customer accounts 363,651 336,964 332,830
Capital ratios3 (%)Common equity tier 1 9.6 9.3 9.6
Total tier 1 ratio 11.6 10.9 11.8
Total capital ratio 15.3 14.3 15.5
Performance, efficiency and other ratios (annualised %)
Annualised return on average shareholders’ equity4 7.7 9.3 2.5
Pre-tax return on average risk-weighted assets (reported basis) 1.7 1.7 0.7
Pre-tax return on average risk-weighted assets (adjusted basis) 1.5 2.1 1.2
Cost efficiency ratio (adjusted basis)5 65.5 59.3 69.9
Jaws (adjusted basis)6 (9.3) 4.2 (4.0)
Ratio of customer advances to customer accounts 73.3 73.6 77.7
1 Adjusted performance is computed by adjusting reported results for the effect of significant items as detailed on pages 21 and 22.2 Net operating income before loan impairment charges and other credit risk provisions is also referred to as revenue.3 Capital ratios are based on transitional CRD IV rules (refer to page 14).4 The return on average total shareholders’ equity is defined as profit attributable to shareholders of the parent company divided by the average total
shareholders’ equity, adjusted for other equity instruments.5 Adjusted cost efficiency ratio is defined as total operating expenses (adjusted) divided by net operating income before loan impairment charges and
other credit risk provisions (adjusted). Net operating income before loan impairment charges and other credit risk provisions (adjusted) is alsoreferred to as revenue (adjusted).
6 Adjusted jaws measures the difference between adjusted revenue and adjusted cost growth rates.
Highlights
HSBC BANK PLC3

Our strategyHSBC aims to be the world’s leading and most respectedinternational bank. The Group aims to achieve this byfocusing on the needs of its customers and the societies itserves, thereby delivering long-term sustainable value to allits stakeholders.
The group’s strategy and strategic direction is embedded inHSBC’s strategy, which aims to capture value from itsinternational network.
Our strategy is built around long-term trends and reflects ourdistinctive advantages.
Long-term trendsIncreasing global connectivity The international flow of goods, services and financecontinues to expand, aided by the development oftechnology and data in personal and commercial exchanges.
Distinctive advantagesUnrivalled global presenceHSBC’s network provides access to more than 90% of globaltrade and capital flows. We use it to enable clients toparticipate in global growth opportunities and offer leadingproduct capabilities to build deeper and more enduringrelationships with businesses and individuals withinternational needs.
Universal banking modelWe serve the full range of banking customers through ourfour businesses, from individual savers to large multinationalcorporations. This universal banking model enables us toeffectively meet our clients’ diverse financial needs, supporta strong capital and funding base, reduce risk profile andvolatility, and generate stable returns for shareholders.
Long-term strategyDevelop our international networkThe group derives value from HSBC’s network of businessesto support future growth and increase global connectivity.
We aim to develop and leverage the presence and globalreach of HSBC in our long-term commitment towards ourstrategic European markets.
Invest in wealth management and select retailbusinessesWe aim to capture opportunities arising from social mobility,wealth creation and long-term demographic changes in ourpriority markets where we can achieve profitable scale.
Investing in the futureWe continue to focus on the long-term needs of ourcustomers. We are investing in technology to serve ourclients better through digital channels such as mobilepayments. We also aim to develop and use our uniquecapabilities to support clients in the transition to a lowcarbon economy.
Strategic actions At HSBC’s Investor Update in June 2015, the Group outlined aseries of strategic actions to make the most of its competitiveadvantages and respond to the changing environment inwhich it operates, many of which are applicable to the group.
These actions are focused on improving efficiency in how weuse our resources and investing for growth in line with ourstrategy. Progress has been made against these actions, eachof which has targets defined to the end of 2017:
• reduce risk weighted assets (‘RWAs’) across the Group;
• optimise HSBC’s global network;
• set up a UK ring-fenced bank;
• deliver US$4.5–5.0bn of cost savings;
• deliver revenue growth above gross domestic product(‘GDP’) from HSBC’s international network;
• grow business from renminbi (‘RMB’)internationalisation; and
• implement Global Standards.
The Group’s strategic actions will help in achieving ourmedium-term financial targets, such as increasing our returnon equity and achieving positive jaws.
Structural reformPolicy background to recovery and resolutionFollowing the financial crisis, G20 leaders requested that theFinancial Stability Board (‘FSB’) establish more effectivearrangements for the recovery and resolution of 30designated global systemically important banks (‘G-SIBs’),resulting in a series of policy recommendations in relation torecovery and resolution planning, cross-border cooperationagreements and measures to mitigate obstacles toresolution.
Banking structural reform and recovery andresolution planningGlobally there have been a number of developments relatingto banking structural reform and the introduction of recoveryand resolution regimes. As recovery and resolution planninghas developed, some regulators and national authoritieshave also required changes to the corporate structures ofbanks. These include requiring the local incorporation ofbanks or ring-fencing of certain businesses. In the UK, ring-fencing legislation has been enacted requiring the separationof retail and small and medium-sized enterprise (‘SME’)banking activity from trading activity.
HSBC resolution strategyThe Group continues to work with primary regulators todevelop and agree a resolution strategy for HSBC. It is viewedthat a strategy by which the Group breaks up at a subsidiarybank level at the point of resolution (referred to as MultiplePoint of Entry strategy) rather than being kept together as aGroup at the point of resolution (referred to as a Single Pointof Entry strategy) is the optimal approach as it is aligned tothe Group’s existing legal and business structure. Similar toall G-SIBs, the Group is working with regulators to betterunderstand inter-dependencies between different businessesand subsidiary banking entities in the Group in order toenhance resolvability.
Business Review
HSBC BANK PLC4

Implementation of the ServCo groupThe Group started making changes to its corporate structureto mitigate or remove critical inter-dependencies to furtherfacilitate the resolution of the Group. In particular, to removeoperational dependencies (where one subsidiary bankprovides critical services to another), the Group is in theprocess of transferring critical services from subsidiary banksto a separately incorporated group of service companies(‘ServCo group’). The ServCo group will be separately fundedto ensure continuity of services in resolution. A significantportion of the ServCo group already exists and this initiativeinvolves transferring the remaining critical services still heldby subsidiary banks into the ServCo group. The services willthen be provided to the subsidiary banks by the ServCogroup.
To progress implementation, certain critical assets and15,447 employees performing shared services in the UK havebeen transferred from HSBC Bank plc to the ServCo group,which is not a subsidiary of HSBC Bank plc but of HSBCHoldings plc. There were no changes to employment termsand conditions or pension benefits as a result of thesetransfers. In July 2016, the operational aspect of payroll andexpense management for these employees was transferredto the ServCo group. This will impact our reported employee-related costs and headcount data. Such costs will berecharged to the bank.
To support the creation of the ServCo group and to ensurethat employees transferred retained existing pensionbenefits, a new section of the HSBC Bank (UK) PensionScheme was created with segregated assets and liabilities.The new section provides ServCo group employees with theirdefined contribution pension and, where relevant, definedbenefit pension benefits arising from future salary increasesabove Consumer Price Index (‘CPI’).
UK ring-fencingIn 2013 and 2014, UK legislation was enacted requiring largebanking groups to ring-fence UK retail banking activity in aseparately incorporated banking subsidiary (a ring-fencedbank) that will be prohibited from engaging in significanttrading activity. Ring-fencing is to be completed by 1 January2019. The legislation also details the applicable individualcustomers to be transferred to the ring-fenced bank byreference to gross worth and corporate customers to betransferred based on turnover, assets and number ofemployees. In addition, the legislation places restrictions onthe activities and geographical scope of ring-fenced banks.
There continue to be regulatory developments related to theproposed rules on ring-fencing. During 2015, the PrudentialRegulation Authority (‘PRA’) and other regulators issued newproposed rules on governance arrangements, ring-fencingtransfer schemes, prudential requirements, intragrouparrangements and operational continuity and the use offinancial market infrastructure. The regulatory landscapecontinues to evolve and the finalisation of rules in respect ofring-fencing is expected to continue until 2017.
The headquarters of the UK ring-fenced bank, HSBC UK, willbe located in Birmingham. Our ambition is to be the bank ofchoice in the UK and as a name, HSBC UK will build on theglobal connectivity and customer trust of the HSBC brandand differentiate us in a competitive market.
The final business design provides for the transfer into HSBCUK of the qualifying components of HSBC Bank plc’s UK RetailBanking and Wealth Management (‘RBWM’), CommercialBanking (‘CMB’) and Global Private Banking (‘GPB’)businesses. HSBC Bank plc’s UK Global Banking and Markets(‘GB&M’) business will remain in HSBC Bank plc. HSBC Bankplc remains the issuer under its debt issuance programmes,and outstanding securities issued under such programmeswill continue to be obligations of HSBC Bank plc.
The Group presented a final ring-fencing project plan toregulators in January 2016. The plan is ultimately subject tocourt approval, as well as that of the PRA, Financial ConductAuthority (‘FCA’) and other applicable regulators.
HSBC BANK PLC5

Economic environmentUK real Gross Domestic Product (‘GDP’) growth acceleratedto 0.6% quarter-on-quarter in the second quarter of 2016,from 0.4% quarter-on-quarter in the first quarter of the year.GDP was 2.2% higher than the same quarter a year earlier.The unemployment rate inched down to 4.9% in the threemonths to May. Employment as a percentage of theworkforce stood at an all-time high of 74%. Wage growth hasslowed from last year, but rose to 2.3% in the three monthsto April. The annual rate of growth of the CPI measure ofinflation stood at 0.5% in June 2016. Activity in the housingmarket was strong in the first quarter, but slowed in thesecond quarter, following the imposition of higher stampduty on buy-to-let purchases.
Following the UK’s vote to leave the European Union (‘EU’),the economic outlook has shifted markedly. UK real GDP isnow expected to rise by 1.5% in 2016, and slow sharply in2017, albeit narrowly avoiding a recession. Investment mightbe hardest hit by the uncertainty surrounding the UK’spolitical and economic outlook. CPI inflation is expected torise on the back of exchange rate depreciation, rising to anannual rate of 1.2% by the fourth quarter of 2016.
In the eurozone, the domestic-led cyclical recoverycontinued. Real GDP in the region as a whole surprised onthe upside in the first quarter of 2016, growing by 0.6% aftergrowing by 0.4% in the last quarter of 2015. Spain continuedto be the strongest performer among the four largest
eurozone economies, with real GDP growth of 0.8% in thefirst quarter, but the recovery was more broad-based, withGermany growing by 0.7% and France by 0.6%. Italy waslagging behind, with growth of 0.3%. The renewed fall inenergy prices is continuing to provide a significant boostto real wages, supporting consumption, while publicconsumption has also been supportive of growth thanks tothe reduction in interest payments brought about by theECB’s quantitative easing programme. The mild weather overthe winter also boosted residential construction, particularlyin countries such as Germany. Exports, however, are startingto slow, as the impact of the past euro depreciation starts tofade and global demand remains weak.
The monetary policy stance from the ECB is helping tosupport demand and is easing credit conditions in theeurozone. But as the impact of lower energy prices onconsumer purchasing power fades, sustainable growthdepends on the delivery of a broader package of investmentmeasures to support demand and raise productivity, and amore coordinated fiscal effort. The outcome of the UKreferendum on its membership of the EU is also likely toweigh on trade, and consumer and investor confidence in theeurozone. HSBC Global Research expects real GDP growth inthe eurozone of 1.4% in 2016, slightly lower than the 1.6%achieved in 2015, and 1.0% in 2017, with CPI inflationremaining subdued (0.9% in 2017) after the rebound at theturn of the year due to the base effect from energy prices.
HSBC Global Research expects global GDP growth to be 2.2%in 2016, down from 2.4% in 2015.
Business Review (continued)
HSBC BANK PLC6
Financial summary
HSBC BANK PLC7
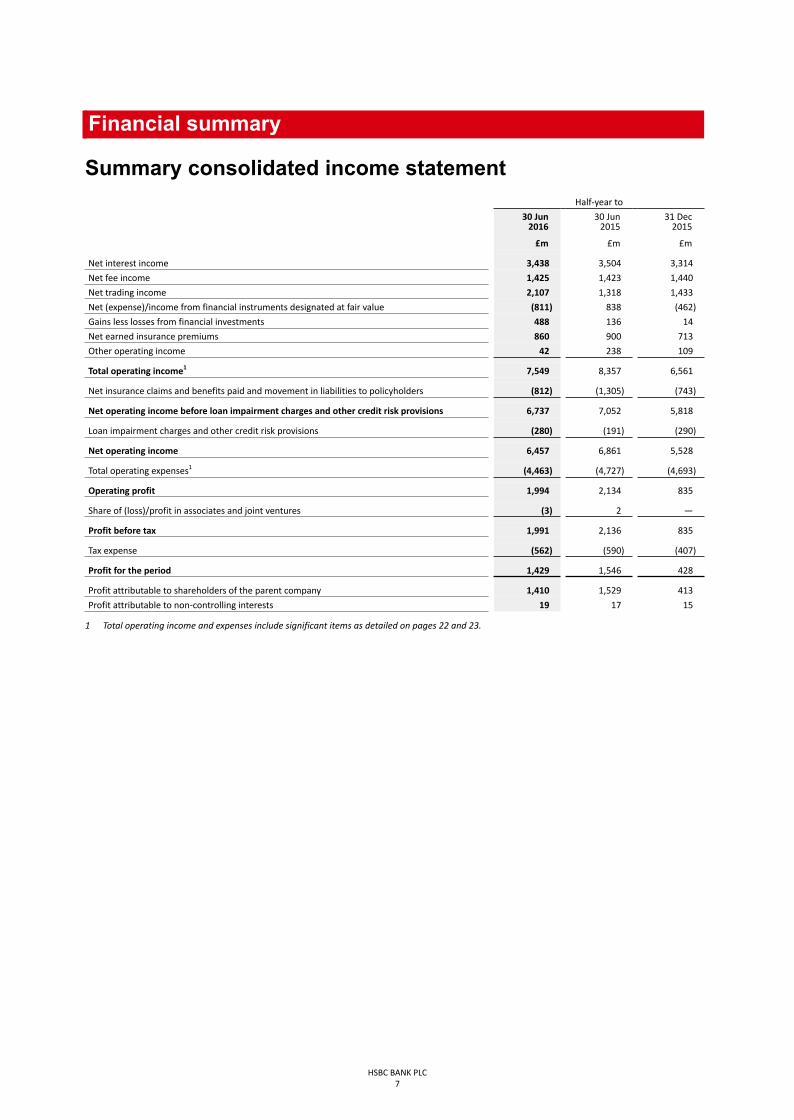
Summary consolidated income statementHalf-year to
30 Jun2016
30 Jun2015
31 Dec2015
£m £m £m
Net interest income 3,438 3,504 3,314
Net fee income 1,425 1,423 1,440
Net trading income 2,107 1,318 1,433
Net (expense)/income from financial instruments designated at fair value (811) 838 (462)
Gains less losses from financial investments 488 136 14
Net earned insurance premiums 860 900 713
Other operating income 42 238 109
Total operating income1 7,549 8,357 6,561
Net insurance claims and benefits paid and movement in liabilities to policyholders (812) (1,305) (743)
Net operating income before loan impairment charges and other credit risk provisions 6,737 7,052 5,818
Loan impairment charges and other credit risk provisions (280) (191) (290)
Net operating income 6,457 6,861 5,528
Total operating expenses1 (4,463) (4,727) (4,693)
Operating profit 1,994 2,134 835
Share of (loss)/profit in associates and joint ventures (3) 2 —
Profit before tax 1,991 2,136 835
Tax expense (562) (590) (407)
Profit for the period 1,429 1,546 428
Profit attributable to shareholders of the parent company 1,410 1,529 413
Profit attributable to non-controlling interests 19 17 15
1 Total operating income and expenses include significant items as detailed on pages 22 and 23.

Review of businessperformanceReported performanceHSBC Bank plc and its subsidiaries reported a profit beforetax of £1,991m in the first half of 2016, compared with aprofit of £2,136m and £835m in the first and second halvesof 2015 respectively.
Net interest income decreased by £66m or 2% comparedwith the first half of 2015. The decrease was primarily inGB&M in Legacy Credit and in RBWM due to spreadcompression on mortgages in the UK and lower credit cardincome as customers continue to de-leverage. By contrast,net interest income in CMB increased, primarily in the UK,from growth in Term Lending and Global Liquidity and CashManagement (‘GLCM’) deposit balances.
Net fee income increased by £2m. In GB&M, net fee incomeincreased in Global Banking reflecting higher mergers andacquisitions activity. This increase was mostly offset by areduction in RBWM, mainly due to lower interchange fees forcredit cards in the UK following a regulatory change. WealthInvestments revenue was also adversely impacted followingthe migration of funds to clean share classes and re-pricing ofa discretionary offering.
Net trading income increased by £789m or 60% comparedwith the first half of 2015. The increase was primarily due tohigher favourable foreign exchange movements on tradingassets held as economic hedges against issued foreigncurrency debt designated at fair value. By contrast, tradingincome decreased in our Equities and, to a lesser extent,Foreign Exchange businesses due to market volatilityresulting in reduced client activity. In RBWM, net tradingincome decreased due to negative fair value adjustments onnon-qualifying hedges of £19m, notably in our French homeloan portfolio, compared with positive movements of £20min the first half of 2015.
Net expense from financial instruments designated at fairvalue decreased by £1.6bn compared with the prior period.£1.3bn of this was due to adverse foreign exchangemovements on economically hedged foreign currency debt inGB&M (offset from assets held as economic hedges in ‘Nettrading income’). In addition, income arising from financialassets held to meet liabilities under insurance andinvestment contracts decreased, reflecting lower netinvestment returns in the first half of 2016 compared with2015. These returns reflected weaker equity markets inFrance and the UK.
This decrease was partly offset by higher favourable creditspread-related movements in the fair value of the group’sown long-term debt of £117m.
Gains less losses from financial investments increased by£352m. This was primarily due to a gain on disposal of ourmembership interest in Visa Europe of £416m in the first halfof 2016. Excluding this, gains less losses from financialinvestments decreased by £64m mainly in GB&M due tolower available-for-sale gains in Balance Sheet Management,notably in the UK.
Net insurance premium income decreased by £40m mainly inthe UK due to lower pension premiums following the sale ofthe pension business in the second half of 2015. There wasalso lower income from the sale of investment contracts in
RBWM France driven by the low returns available in the lowinterest rate environment.
Other operating income decreased by £196m or 82%. Thiswas due to a decrease in the present value of in-force (‘PVIF’)long-term insurance business in RBWM France, driven byinvestment assumption changes following a fall in long terminterest rates and equity market performance in 2016compared to 2015.
Net insurance claims and benefits paid and movement inliabilities to policyholders decreased by £493m. Thisreflected lower investment returns on assets held to supportliabilities under contracts where the policyholder bearsinvestment risk. This decrease was due to weaker equitymarket movements in the first half of 2016 compared with2015 in the UK and France.
Loan impairment charges and other credit risk provisions(‘LICs’) increased by £89m. This increase was primarily inCMB due to higher collectively assessed impairments in theUK and higher individually assessed impairments in the UK(notably in the oil and gas and, to a lesser extent, shippingsectors) and Spain (in the construction sector). This waspartly offset by lower individually assessed impairments inFrance.
In GB&M, loan impairment charges decreased due tonet releases of individually and collectively assessedimpairments compared with net charges in the prior year.This was partly offset by lower net releases on available-for-sale asset-backed securities.
RBWM and GPB loan impairment charges were broadlyunchanged compared with the first half of 2016.
Total operating expenses decreased by £264m or 6%. Thedecrease included a number of significant items including:
• lower settlements and provisions in connection with legaland regulatory matters, down by £436m, primarily inGB&M;
• lower UK customer redress provisions, notably inestimated redress for possible mis-selling of paymentprotection insurance (‘PPI’) policies in previous years (nilprovision in the first half of 2016 compared to £60mbooked for the same period in 2015); partly offset by
• costs-to-achieve (as defined on page 21) of £309m; and
• Madoff litigation costs in the first half of 2016 of £20m.
Excluding these items, expenses were lower by £111mmainly driven by a reduction in IT costs in RBWM and GB&Mand lower staff costs across all of the global businesses. Thiswas partly offset by a marginal increase in CMB due to anincrease in customer redress provisions.
For further details of significant items affecting revenuesand costs, please refer to disclosure note on pages 22 and23.
Tax expense of £562m was £28m lower than in the first halfof 2015. The effective tax rate for the first half of 2016 was28.2%, compared with 27.6% for the same period in 2015.
Excluding significant items (notably non-taxable gain ondisposal of Visa Europe in 2016 and settlements andprovisions in connection with foreign exchange investigationsin 2015), the effective tax rate for the first half of 2016 was30.3% compared to 24.8% in 2015. The increase was mainlyattributable to the 8% surcharge on UK banking profits,which became effective from 1 January 2016.
Business Review (continued)
HSBC BANK PLC8

HSBC BANK PLC9
Summary consolidated balance sheetAt 30 June 2016
30 Jun2016
31 Dec2015
£m £m
Assets
Cash and balances at central banks 55,147 39,749
Trading assets 142,356 110,585
Financial assets designated at fair value 7,337 6,829
Derivative Assets 238,906 166,785
Loans and advances to banks 21,113 23,222
Loans and advances to customers 266,614 258,506
Reverse repurchase agreements – non-trading 47,164 30,537
Financial investments 83,561 71,352
Other 25,463 20,376
Total assets 887,661 727,941
Liabilities and Equity
Liabilities
Deposits by banks 28,986 24,202
Customer accounts 363,651 332,830
Repurchase agreements – non-trading 27,408 17,000
Trading liabilities 107,968 73,489
Financial liabilities designated at fair value 19,419 19,001
Derivatives Liabilities 234,698 162,864
Debt securities in issue 25,215 26,069
Liabilities under insurance contracts issued 18,940 16,664
Other liabilities 19,827 17,697
Total liabilities 846,112 689,816
Equity
Total shareholders’ equity 40,823 37,497
Non-controlling interests 726 628
Total equity 41,549 38,125
Total liabilities and equity 887,661 727,941
Review of business positionTotal reported assets were 22% higher than at 31 December2015.
The group maintained a strong and liquid balance sheet withthe ratio of customer advances to customer accountsreducing 4.4% to 73.3% (31 December 2015: 77.7%).
The group’s Common Equity Tier 1 ratio remained unchangedat 9.6% (31 December 2015: 9.6%). Risk-weighted assets of£243,648m were 6% higher than at 31 December 2015,principally due to movements in foreign exchange rates.
The primary effect of the UK referendum on its membershipof the EU on the group’s reported balance sheet was anincrease in the value of derivative positions and related cashcollateral, and an increase in the value of non-sterlingdenominated balance sheet items on translation. Increasedtrading assets were also a key driver of overall balance sheetgrowth, reflecting a seasonal increase in activity.
AssetsCash and balances at central banks increased by 39% as thegroup held more cash in the run up to, and immediatelyfollowing, the EU referendum.
Trading assets increased by 29% primarily due to an increasein market activity relative to year end and changes in assetprices.
Derivative assets increased by 43% primarily due to adownwards shift in major yield curves and movements inforeign exchange rates.
Loans and advances to customers increased by 3% due togrowth in corporate term lending and foreign exchange movements. This was partly offset by a reduction in grosscorporate overdrafts, with a corresponding marginalreduction in customer accounts, following an initiative withclients to settle positions in notional pools.
Reverse repurchase agreements – non-trading increased by54% reflecting reduced market activity at year end.
Financial investments increased by 17% principally due to anincrease in the balance of highly liquid assets.
Other assets increased by 25% due to a range of factors, butpredominantly due to a rise in precious metal prices.
LiabilitiesCustomer accounts increased by 9%, due to growth in retailand corporate balances, an increase in placements by HSBCHoldings, and foreign exchange movements. This was partlyoffset by a reduction in gross customer deposits as part of aninitiative to reduce balances in notional pooling accounts(see loans and advances). The increase in placements byHSBC Holdings resulted from the Group’s plan todownstream Total Loss Absorbing Capacity (‘TLAC’) to itssubsidiaries. It is expected that these placements will betransformed into debt compliant with the MinimumRequirements for own funds and Eligible Liabilities (‘MREL’)in due course.
Repurchase agreements – non-trading increased by 61% inline with reverse repurchase agreements.
Trading liabilities increased by 47% in line with tradingassets.
Financial liabilities designated at fair value and debtsecurities in issue increased by 2% and reduced by 3%respectively, as the group’s external debt profile remainedbroadly stable.
Derivative liabilities increased by 44%, broadly in line withderivative assets as the underlying risk is broadly matched.
Liabilities under insurance contracts issued increased by 14%primarily due to foreign exchange movements.
EquityTotal shareholders’ equity increased by 9%. The increase inretained earnings from profit generated was supported by anincrease in the foreign exchange reserve and actuarial gainson defined benefit pension plans.
Business Review (continued)
HSBC BANK PLC10
RiskManaging risk 11
Top and emerging risks 11
Areas of special interest 12
Financial crime compliance and regulatory compliance 12
The Monitor 12
Regulatory stress tests 13
UK Referendum on European Union membership 13
Foreign Exchange 13
Oil and gas prices 13
HSBC BANK PLC11
Managing riskThe group’s risk profile is underpinned by its core philosophyof maintaining a strong balance sheet, robust liquidityposition and capital strength. The group continued to have aconservative risk profile during the first half of 2016.
As a provider of banking and financial services, the firm runsrisk at the core of its day-to-day activities. While the group’sstrategy, risk appetite, plans and performance targets are settop-down, day-to-day responsibility for risk management iscascaded through the delegation of individual accountability,with reporting and escalation facilitated through riskgovernance structures. Policies, procedures and limits aredefined to ensure activities remain within an understood andappropriate level of risk. Identification, measurement,monitoring and reporting of risks are essential to informregular and strategic decision making. This is supported by aneffective system of controls to ensure compliance.
The risk management framework promotes a strong riskculture which is reinforced by HSBC Values and GlobalStandards and ensures that our risk profile remainsconservative and aligned to our risk appetite. Further detailsare set out on page 19 of the Annual Report and Accounts2015. There have been no material changes to our policiesand practices regarding risk management and governance asdescribed in the Annual Report and Accounts 2015.
Top and emerging risksOur principal banking risks are credit risk, operational risk,market risk, liquidity and funding risk, compliance risk andreputational risk. We also incur pension and insurance risk.
The group continuously monitors and identifies risks.This process, which is informed by an assessment of itsrisk factors and the results of stress testing, gives rise tothe classification of certain principal risks. Changes in theassessment of principal risks may result in adjustments tothe group’s business strategy and, potentially, its riskappetite.
In addition, on a forward-looking basis, the group aimsto identify, monitor and, where possible, measure andmitigate large scale events or sets of circumstances thatmay have the potential to have a material impact on ourfinancial results or reputation and the sustainability ofour long-term business model. These events, giving riseto additional principal banking risks noted above, arecaptured together as the top and emerging risks.
During the first half of 2016, the group made a number ofchanges to its top and emerging risks to reflect its revisedassessment of their effect on the group and changes in thescope of risk definitions, to ensure appropriate focus.
Within externally driven risks, ‘Risk of the UK exit from EU’has been added as a standalone item, having previouslybeen included within both ‘Geopolitical risk’ and ‘Economicoutlook and capital flows’. ‘Cyber threats and unauthorisedaccess to systems’ replaces ‘System resilience’. ‘Increasingregulatory expectations’ replaces ‘Regulatory developmentswith adverse impact on business model and profitability’,reflecting the broader impact of enhanced regulatoryexpectations. ‘Financial Crime Compliance’ now includes ‘USDeferred Prosecution Agreement (‘DPA’) and relatedagreements and consent orders’, with ‘Market illiquidity andvolatility’ replacing ‘Economic outlook and capital flows’,with other risks covering specific aspects of the economicoutlook.
Within internally driven risks, ‘IT systems infrastructure andresilience’ has been added to reflect the need to ensure thatour core banking systems remain robust as digital andmobile banking services continue to evolve. ‘Model Risk’ isalso a new addition to this set, reflecting the regulatorychallenges to model governance in an increasing and variedregulatory environment.
Further details on the group’s top and emerging risks are setout on the following page.

Top and Emerging risks
Risk Trend Mitigants
Externally driven
* UK exit from EU
é
We planned and managed the immediate aftermath of the vote successfully. We undertookscenario analyses and stress tests, and closely engaged with the PRA on liquidity planning inthe lead up to, and following, the UK referendum on EU membership to identify vulnerabilitiesin the event of a ‘leave’ vote and potential mitigating actions. However, negotiation of the UK’sexit agreement might take years to resolve. Until the terms of exit are known, we cannot fullydetermine the impact on HSBC. We will continue to work with regulators, governments andour customers to manage risks as they arise, particularly across those sectors most impactedby the outcome.
Geopolitical riské
Geopolitical unrest across a number of regions has led to heightened risk across Europe. Wecontinue to monitor the situations closely.
Turning of the credit cycleè
Stress tests were conducted on our oil and gas portfolio on US$25 and US$20 per barrel pricescenarios, as well as on the metals and mining portfolio. These sectors remain underenhanced monitoring with risk appetite and new lending significantly curtailed.
† Cyber threat and unauthorisedaccess to systems è
We continue to improve our governance and controls framework to protect HSBC informationand technical infrastructure against ever-increasing and sophisticated cyber-threats.
† Increasing regulatoryexpectations
è
We actively engaged with regulators and policy makers to help ensure that new regulatoryrequirements, such as the recent Basel Commission on Banking Supervision consultation onreducing variation on credit risk RWAs, are considered fully and can be implemented in aneffective manner.
Regulatory focus on conduct ofbusiness and financial crime è
We further enhanced our management of conduct in areas including the treatment ofpotentially vulnerable customers, market surveillance, employee training and performance.
† Financial Crime Compliance
é
We are continuing to take concerted action to remediate Anti-Money Laundering andSanctions compliance deficiencies and to implement Global Standards. We also continue toembed Affiliate Risk management to further mitigate financial crime risk issues arising fromoperations conducted within the HSBC network.
† Market illiquidity and volatilityè
Several initiatives are in place including the eTrading platform. We monitor risks closely andreport regularly on illiquidity and concentration risks to the PRA.
Internally driven
* IT systems infrastructure andresilience é
We are investing in specialist teams and our systems capability to help ensure strong digitalcapabilities, delivery quality and resilience within our customer journeys.
People riskè
We have increased our focus on resource planning and employee retention and aredeveloping initiatives to equip line managers with skills to both manage change and supporttheir employees.
Execution riskè
We have strengthened our prioritisation and governance processes for significant strategic,regulatory and compliance projects.
* Model risk
é
The scope of regulatory development is ever increasing, leading to challenges in modelgovernance which may have an impact on our RWAs and hence capital demand. We havecreated centralised global analytical functions and recruited additional subject matter expertsin our modelling and independent model review teams. A new global policy on model riskmanagement has been implemented and an enhanced model governance framework is alsobeing rolled out globally to address key internal and regulatory requirements.
Data managementè
We continued to enhance our data governance, quality and architecture to help enableconsistent data aggregation, reporting and management.
é Risk heightened during first half of 2016è Risk remained at the same level as 31 December 2015† Thematic risk renamed during the first half of 2016* New risk introduced during the first half of 2016
Business Review (continued)
HSBC BANK PLC12
Areas of special interestFinancial crime compliance and regulatorycomplianceHSBC has experienced increasing levels of compliance riskin recent years as regulators and other agencies pursuedinvestigations into historical activities. These includeinvestigations related to compliance with anti-moneylaundering and sanctions laws and regulations giving rise tothe US Deferred Prosecution Agreement (‘US DPA’), mis-selling in the UK of Payment Protection Insurance (‘PPI’)policies, investigations in connection with the setting of Libor,other benchmark interest rates, activities related to foreignexchange, precious metals and credit default swaps. Details
of these investigations and legal proceedings can be found inNote 12 on the Financial Statements and the work of theMonitor, who has been appointed to assess HSBC’s progressagainst the Group’s various obligations in the US, is describedbelow.
The level of inherent compliance risk remained high in thefirst half of 2016 as the industry continued to experiencegreater regulatory scrutiny and heightened levels ofregulatory oversight and supervision.
The MonitorUnder the agreements entered into with the US Departmentof Justice (‘DoJ’) and the UK Financial Conduct Authority(‘FCA’) in 2012, including the five-year US DPA, an
independent compliance monitor (‘the Monitor’) wasappointed to produce annual assessments of theeffectiveness of the Group’s anti-money laundering (‘AML’)and sanctions compliance programme. The work of theMonitor is described on page 20 of the Annual Report andAccounts 2015.
HSBC is working to implement the agreed recommendationsflowing from the Monitor’s reviews. The Monitor’s thirdannual follow-up review is under way.
HSBC BANK PLC13
Regulatory stress testsStress testing and scenario analysis form a key component ofHSBC Bank plc’s integrated risk management framework.They provide a forward-looking assessment of risk andidentify key fault lines under a range of scenarios. Thisfacilitates the monitoring of top and emerging risks and thedevelopment of appropriate mitigating actions andcontingency plans, across a range of stressed conditions.Stress testing also informs business, capital planning andstrategic decision making, allowing the group to formulateresponses and mitigate risks in advance of actual conditionsexhibiting the stresses identified in the scenarios.
HSBC Bank plc and the Group have taken part in thePrudential Regulation Authority’s (‘PRA’) 2016 concurrentstress test exercise involving the major UK banks. Thescenario for the 2016 stress test incorporated a synchronisedglobal downturn in output growth particularly affecting HongKong and China; UK economic growth was significantlyimpacted with property prices falling by almost a third andunemployment increasing materially. The Group’s results forthe PRA’s 2016 stress test will be published by the Bank ofEngland alongside the Financial Stability Report in the fourthquarter of 2016.
A summary of our approach to stress testing and scenarioanalysis is provided on page 20 of the Annual Report andAccounts 2015.
UK Referendum on European UnionMembershipFollowing the UK electorate’s vote to leave the EU in anational referendum, there has been a period of volatilityagainst a backdrop of uncertainty, which is likely to continuefor some time. We were aware of the potential for marketdisruption in the aftermath of a vote to leave the EU andtook steps to plan for this outcome.
During 2015 and the first half of 2016, we undertook anumber of different analyses including stress tests toconsider the potential impacts of a vote to leave the EU oncapital positions, key portfolios, liquidity and our customers.
As the referendum approached, our priority was to ensurethat we had adequate liquidity in each operating currencyacross all businesses. We also focused on operational and ITinfrastructure resilience in anticipation of higher volumesand potential collateral calls immediately following thereferendum. In addition, our global functions were engagedthroughout and provided guidance on several issuesincluding the standards of conduct to be maintained during aperiod of heightened volatility.
We are actively monitoring our portfolio to identify areas ofstress, supported by stress testing analyses. Over the comingweeks and months, we intend to continue to work withregulators, governments and our customers in an effort tomanage risks as they arise, particularly across those sectorsmost impacted by the outcome. We will also continue tofocus on serving and supporting our customers, anddelivering on our strategy.
Negotiation of the UK’s exit agreement, its futurerelationship with the EU and its trading relationship with therest of the world might take a considerable number of yearsto resolve. During this time, uncertainty as to the preciseterms of these arrangements and the future legal andregulatory landscape may lead to uncertain economicconditions and market volatility. This may lead to reducedeconomic growth which may affect both HSBC and ourclients. Among other issues, the UK’s future relationship withthe EU may have implications for the future business modelfor the group’s London-based European cross-border bankingoperations, which relies on unrestricted access to theEuropean financial services market.
Until the terms and timing of the UK’s exit from the EUare confirmed, including the terms on which UK financialinstitutions will conduct cross border business post-exit, itis not possible to fully determine the impact on HSBC.
Foreign ExchangeIn the first half of 2016 there was a marked decline in thevalue of sterling compared to US dollars and euros. While thisdepreciation in sterling value has not had a material impacton our businesses, it has impacted the value of our non-sterling denominated businesses on translation. This effect ismost relevant to our reported balance sheet and capitalratios. Details of the group’s structural exposure to foreigncurrencies can be found in Note 10 (page 45).
Oil and gas pricesOil and gas prices have remained low since the middle of2014 as a result of existing global supply and demandimbalances, with significant price declines in late 2015 andearly 2016. While some price recovery has been seenrecently, this has tended to be driven by unexpected supplyoutages rather than genuine market forces driving supply anddemand back into balance. Continued lower oil prices causeincreased credit risks within oil-related industries togetherwith fiscal and financing challenges for the energy exporters.
Oil and gas related counterparties have responded rapidly tothe changing economic outlook, cutting back on capitalexpenditure as well as reducing operating expenses in orderto manage cash flows and sustain profitability. Largeintegrated producers have remained resilient. Oil fieldservices companies have proved to be more vulnerable giventhe scale back in capital expenditure.
It is not expected that growth in the global demand for oilwill be sufficient on its own to bring the market into balance.Price recovery over the medium term therefore remainsdependent on the reduction of excess supply. We continue tomanage the portfolio carefully and selectively.

CapitalCapital overview 14
Risk-weighted assets 15
Capital 16
Leverage ratio 18
Regulatory balance sheet 19
Our objective in managing the group’s capital is to maintainappropriate levels of capital to support our business strategyand meet regulatory and stress testing related requirements.
We manage group capital to ensure we exceed currentregulatory requirements and respect the payment priority ofour capital providers. Throughout the six months to 30 June2016, we complied with the PRA’s regulatory capitaladequacy requirements, including those relating to stresstesting.
The group’s approach to managing its capital position hasbeen to ensure the bank, its regulated subsidiaries and thegroup exceed current regulatory requirements and are wellplaced to meet expected future capital requirements.
A summary of our policies and practices regarding capitalmanagement, measurement and allocation is provided onpage 72 of the Annual Report and Accounts 2015.
HSBC BANK PLC14
Regulatory developmentsThroughout the six months to June 2016, there were a seriesof documents issued by the Basel Committee on BankingSupervision which proposed significant changes to theregulatory framework. The key publications proposedchanges to:
• the framework for credit risk capital requirements underboth the internal model and standardised approaches;
• the operational risk framework;
• the credit valuation adjustment capital framework;
• the scope of consolidation to include entities giving riseto ‘step-in risk’; and
• the leverage ratio exposure calculation and buffers.
The final impact of these and other proposals will depend onthe outcome of the consultation processes and quantitativeimpact studies, and any changes would need to betransposed into law before coming into effect. This includesthe finalised changes that relate to the market risk,counterparty risk and securitisation regimes. In the UK, theBank of England’s Financial Policy Committee (‘FPC’) hasindicated that there will be an offset with the PRA’s Pillar 2capital framework as a result of these changes, but the fullscope and size of this offset is currently uncertain.
The FPC also, in July 2016, decided to keep the UKcountercyclical capital buffer requirement at 0% until at leastJune 2017, having previously planned to raise it to 0.5% inMarch 2017. Furthermore, the FPC recommended that thePRA buffer requirements reduce in line with this decision.The PRA did this with immediate effect.
As part of Recovery and Resolution frameworks, theinternational standard for TLAC was finalised by the FinancialStability Board. The Bank of England expects to implementthis through the EU’s MREL framework, which it hasconsulted on but has yet to finalise.
Capital overviewCapital ratios
30 Jun2016
31 Dec2015
% %
CRD IV transitional
Common equity tier 1 ratio1 9.6 9.6
Tier 1 ratio 11.6 11.8
Total capital ratio 15.3 15.5
Total regulatory capital and risk-weighted assets
30 Jun2016
31 Dec2015
£m £m
CRD IV transitional
Common equity tier 1 capital1 23,466 21,939
Additional tier 1 capital 4,873 5,078
Tier 2 capital 9,042 8,586
Total regulatory capital 37,381 35,603
Risk-weighted assets 243,648 229,382
RWAs by risk type
RWAsCapital
required2
£m £m
Credit risk 165,996 13,280
Counterparty credit risk 31,575 2,526
Market risk 23,415 1,873
Operational risk 22,662 1,813
At 30 Jun 2016 243,648 19,492
1 Since 1 January 2015 the CRD IV transitional CET1 and end point CET1capital ratios have become aligned for HSBC Bank plc.
2 In this and all following tables where the term appears, ‘Capitalrequired’ represents the Pillar 1 capital charge at 8% of RWAs.

Risk-weighted assetsRWA and Capital requirements for credit risk and information on risk exposuresCredit risk RWAs by exposure class
At 30 Jun 2016
Exposurevalue RWAs
Capitalrequired
£m £m £m
IRB Advanced approach 320,966 99,981 7,998
Retail:
– secured by mortgages on immovable property SME 1,453 348 28
– secured by mortgages on immovable property non-SME 93,318 4,792 383
– qualifying revolving retail 22,438 4,337 347
– other SME 7,813 3,775 302
– other non-SME 18,225 4,048 324
Total retail 143,247 17,300 1,384
Central governments and central banks 21,745 3,255 260
Institutions 12,478 3,294 263
Corporates1 143,496 76,132 6,091
IRB Securitisation positions 23,553 15,235 1,219
IRB Non-credit obligation assets 7,824 3,760 301
IRB Foundation approach 22,109 14,020 1,122
Institutions 28 7 1
Corporates 22,081 14,013 1,121
Standardised approach 150,796 33,000 2,640
Central governments and central banks2 104,674 1,559 125
Institutions 9,769 2,414 193
Corporates 24,368 21,157 1,693
Retail 2,995 2,170 174
Secured by mortgages on immovable property 2,846 984 79
Exposures in default 929 1,210 97
Equity3 997 1,968 157
Items associated with particularly high risk 727 1,090 87
Claims in the form of collective investments undertakings 39 39 3
International organisations 2,045 — —
Other items 1,407 409 32
Total credit risk 525,248 165,996 13,280
1 ‘Corporates’ includes specialised lending exposures subject to supervisory slotting approach of £14,036m and RWAs of £9,910m.2 ‘Central governments and central banks’ under the standardised approach includes exposures to regional governments and public sector entities.3 ‘Equity’ includes investment in insurance companies which are risk weighted at 250%.
Counterparty credit risk RWAs by exposure class
At 30 Jun 2016
RWAsCapital
required
£m £m
IRB Advanced approach 18,556 1,485
Central governments and central banks 496 40
Institutions 7,387 591
Corporates 10,673 854
IRB Foundation approach 1,260 101
Corporates 1,260 101
Standardised approach 3,938 315
Institutions 3,288 263
Corporates 650 52
CVA advanced 3,231 258
CVA standardised 3,816 305
CCP standardised 774 62
Total counterparty credit risk 31,575 2,526
HSBC BANK PLC15
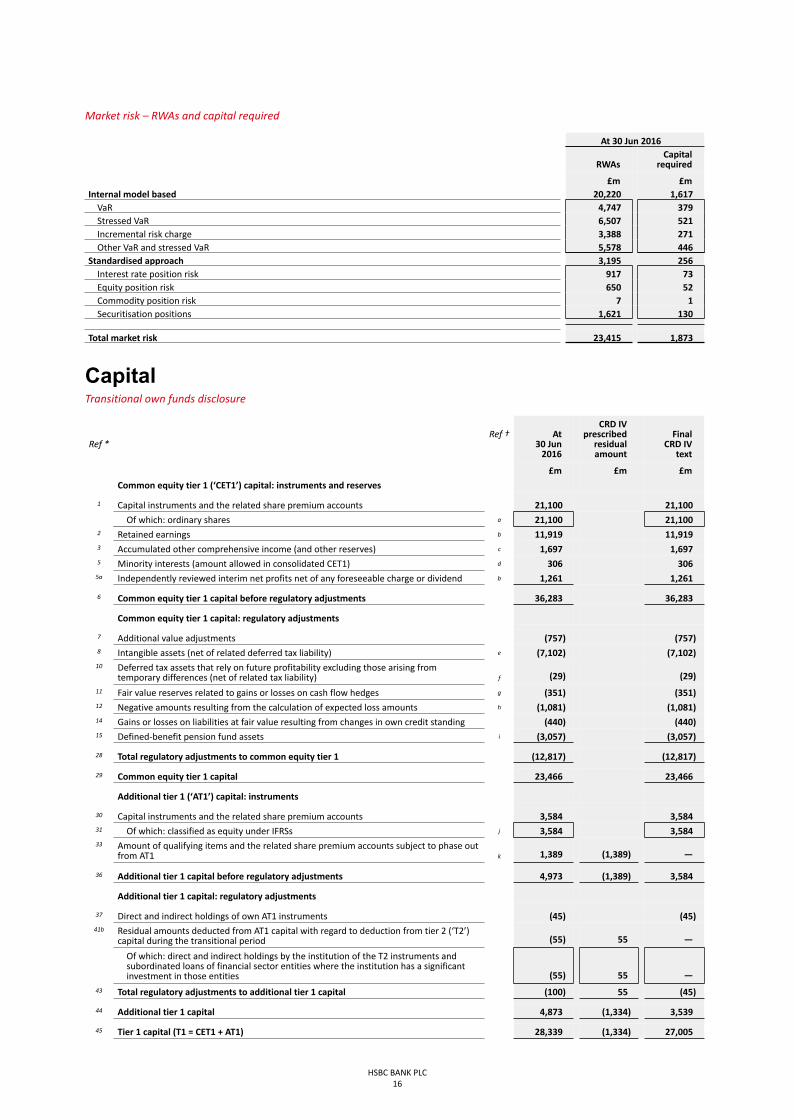
Market risk – RWAs and capital required
At 30 Jun 2016
RWAsCapital
required
£m £mInternal model based 20,220 1,617
VaR 4,747 379Stressed VaR 6,507 521Incremental risk charge 3,388 271Other VaR and stressed VaR 5,578 446
Standardised approach 3,195 256Interest rate position risk 917 73Equity position risk 650 52Commodity position risk 7 1Securitisation positions 1,621 130
Total market risk 23,415 1,873
HSBC BANK PLC16
CapitalTransitional own funds disclosure
Ref *Ref † At
30 Jun2016
CRD IVprescribed
residualamount
FinalCRD IV
text
£m £m £m
Common equity tier 1 (‘CET1’) capital: instruments and reserves
1 Capital instruments and the related share premium accounts 21,100 21,100
Of which: ordinary shares a 21,100 21,1002 Retained earnings b 11,919 11,9193 Accumulated other comprehensive income (and other reserves) c 1,697 1,6975 Minority interests (amount allowed in consolidated CET1) d 306 306
5a Independently reviewed interim net profits net of any foreseeable charge or dividend b 1,261 1,261
6 Common equity tier 1 capital before regulatory adjustments 36,283 36,283
Common equity tier 1 capital: regulatory adjustments
7 Additional value adjustments (757) (757)8 Intangible assets (net of related deferred tax liability) e (7,102) (7,102)
10 Deferred tax assets that rely on future profitability excluding those arising fromtemporary differences (net of related tax liability) f (29) (29)
11 Fair value reserves related to gains or losses on cash flow hedges g (351) (351)12 Negative amounts resulting from the calculation of expected loss amounts h (1,081) (1,081)14 Gains or losses on liabilities at fair value resulting from changes in own credit standing (440) (440)15 Defined-benefit pension fund assets i (3,057) (3,057)
28 Total regulatory adjustments to common equity tier 1 (12,817) (12,817)
29 Common equity tier 1 capital 23,466 23,466
Additional tier 1 (‘AT1’) capital: instruments
30 Capital instruments and the related share premium accounts 3,584 3,58431 Of which: classified as equity under IFRSs j 3,584 3,58433 Amount of qualifying items and the related share premium accounts subject to phase out
from AT1 k 1,389 (1,389) —
36 Additional tier 1 capital before regulatory adjustments 4,973 (1,389) 3,584
Additional tier 1 capital: regulatory adjustments
37 Direct and indirect holdings of own AT1 instruments (45) (45)41b Residual amounts deducted from AT1 capital with regard to deduction from tier 2 (‘T2’)
capital during the transitional period (55) 55 —
Of which: direct and indirect holdings by the institution of the T2 instruments andsubordinated loans of financial sector entities where the institution has a significantinvestment in those entities (55) 55 —
43 Total regulatory adjustments to additional tier 1 capital (100) 55 (45)
44 Additional tier 1 capital 4,873 (1,334) 3,539
45 Tier 1 capital (T1 = CET1 + AT1) 28,339 (1,334) 27,005

Ref * Ref †At
30 Jun2016
CRD IVprescribed
residualamount
FinalCRD IV
text
£m £m £m
Tier 2 capital: instruments and provisions
46 Capital instruments and the related share premium accounts l 7,969 7,96947 Amount of qualifying items and the related share premium accounts subject to phase out
from T2 m 1,124 (1,124) —48 Qualifying own funds instruments included in consolidated T2 capital (including minority
interests and AT1 instruments not included in CET1 or AT1) issued by subsidiaries andheld by third parties 199 (199) —
49 Of which: instruments issued by subsidiaries subject to phase out n 199 (199) —
51 Tier 2 capital before regulatory adjustments 9,292 (1,323) 7,969
Tier 2 capital: regulatory adjustments
52 Direct and indirect holdings of own T2 instruments (30) (30)
55 Direct and indirect holdings by the institution of the T2 instruments and subordinatedloans of financial sector entities where the institution has a significant investment inthose entities (net of eligible short positions) (220) (55) (275)
57 Total regulatory adjustments to tier 2 capital (250) (55) (305)
58 Tier 2 capital 9,042 (1,378) 7,664
59 Total capital (TC = T1 + T2) 37,381 (2,712) 34,669
60 Total risk-weighted assets 243,648 243,648
Capital ratios and buffers61 Common equity tier 1 9.6%62 Tier 1 11.6%63 Total capital 15.3%64 Institution specific buffer requirement 0.633%
Of which:65 – capital conservation buffer requirement 0.625%66 – countercyclical buffer requirement 0.008%68 Common equity tier 1 available to meet buffers1 5.1%
Amounts below the threshold for deduction (before risk weighting)72 Direct and indirect holdings of the capital of financial sector entities where the institution
does not have a significant investment in those entities (amount below 10% thresholdand net of eligible short positions) 1,228
73 Direct and indirect holdings by the institution of the CET1 instruments of financial sectorentities where the institution has a significant investment in those entities (amountbelow 10% threshold and net of eligible short positions) 647
75 Deferred tax assets arising from temporary differences (amount below 10% threshold,net of related tax liability) 612
Applicable caps on the inclusion of provisions in tier 277 Cap on inclusion of credit risk adjustments in T2 under standardised approach 46479 Cap for inclusion of credit risk adjustments in T2 under internal ratings-based approach 916
Capital instruments subject to phase-out arrangements (only applicable between1 January 2013 and 1 January 2022)
82 Current cap on AT1 instruments subject to phase out arrangements 1,38983 Amount excluded from AT1 due to cap (excess over cap after redemptions and maturities) 22584 Current cap on T2 instruments subject to phase out arrangements 1,77785 Amount excluded from T2 due to cap (excess over cap after redemptions and maturities) —
* The references identify the lines prescribed in the EBA template which are applicable and where there is a value.† The references (a) – (n) identify balance sheet components on page 19 which are used in the calculation of regulatory capital.1 Common equity tier 1 available to meet buffers after Pillar 1 capital requirements.
A list of the features of our capital instruments in accordance with Annex III of the Commission Implementing Regulation1423/2013 is also being published on HSBC’s website with reference to our balance sheet at 30 June 2016, along with the fullterms and conditions.
HSBC BANK PLC17

Leverage ratioThe Basel III leverage ratio has been implemented in the EUfor reporting and disclosure purposes but, at this stage,has not been set as a binding requirement. However inDecember 2015, the PRA published rules on a UK leverageratio framework, which includes binding requirements.These requirements are super-equivalent to the Basel andEU regimes, and came into force on 1 January 2016.
Although there is currently no binding leverage ratiorequirement under CRD IV and the PRA’s UK leverage ratiorequirements are not binding on the group, the leverage
exposure measure is calculated by the group each month,and presented to our Asset & Liability ManagementCommittee (‘ALCO’), which monitors the risk of excessleverage. Leverage ratio is currently monitored on atransitional basis and is presented on this basis in the tablesbelow.
Our leverage ratio of 3.7% was down from 4.0% at the end of2015. This was mainly as a result of the increase in the size ofthe balance sheet.
HSBC BANK PLC18
Summary reconciliation of accounting assets and leverage ratio exposures
Ref * Ref †At 30 Jun
2016
£m1 Total assets as per published financial statements o 887,661
Adjustments for:2 – entities which are consolidated for accounting purposes but are outside the scope of regulatory consolidation o (24,665)4 – derivative financial instruments (167,673)5 – securities financing transactions 4,8076 – off-balance sheet items (i.e. conversion to credit equivalent amounts of off-balance sheet exposures) 63,0277 – other adjustments 3,106
8 Total leverage ratio exposure 766,263
Leverage ratio common disclosure
Ref *At 30 Jun
2016
On-balance sheet exposures (excluding derivatives and securities financing transactions (‘SFT’)
1 On-balance sheet items (excluding derivatives, SFTs and fiduciary assets, but including collateral) 582,028
2 (Asset amounts deducted in determining Tier 1 capital) (12,378)
3 Total on-balance sheet exposures (excluding derivatives, SFTs and fiduciary assets) 569,650
Derivative exposures
4 Replacement cost associated with all derivatives transactions (i.e. net of eligible cash variation margin) 18,957
5 Add-on amounts for PFE associated with all derivatives transactions (mark-to-market method) 66,773
6 Gross-up for derivatives collateral provided where deducted from the balance sheet assets pursuant to IFRSs 3,061
7 (Deductions of receivables assets for cash variation margin provided in derivatives transactions) (25,689)
8 (Exempted CCP leg of client-cleared trade exposures) (1,468)
9 Adjusted effective notional amount of written credit derivatives 153,106
10 (Adjusted effective notional offsets and add-on deductions for written credit derivatives) (143,627)
11 Total derivative exposures 71,113
Securities financing transaction exposures
12 Gross SFT assets (with no recognition of netting), after adjusting for sales accounting transactions 93,825
13 (Netted amounts of cash payables and cash receivables of gross SFT assets) (36,159)
14 Counterparty credit risk exposure for SFT assets 4,807
16 Total securities financing transaction exposures 62,473
Other off-balance sheet exposures
17 Off-balance sheet exposures at gross notional amount 170,137
18 (Adjustments for conversion to credit equivalent amounts) (107,110)
19 Total off-balance sheet exposures 63,027
Capital and total exposures
20 Tier 1 capital 28,339
21 Total leverage ratio exposure 766,263
22 Leverage ratio 3.7%
EU-23 Choice on transitional arrangements for the definition of the capital measure Transitional
* The references identify the lines prescribed in the EBA template which are applicable and where there is a value.† The reference (o) identifies balance sheet components on page 19.

Regulatory balance sheetRegulatory and accounting consolidationsThe basis of consolidation for the purpose of financialaccounting under IFRSs, described in Note 1 on the FinancialStatements, differs from that used for regulatory purposes.The following table provides a reconciliation of the financialaccounting balance sheet to the regulatory scope ofconsolidation.
Interests in banking associates are equity accounted inthe financial accounting consolidation, whereas theirexposures are proportionally consolidated for regulatory
purposes by including our share of assets, liabilities, profitand loss and RWAs in accordance with the PRA’s applicationof Capital Requirements Directive (‘CRD IV’).
Subsidiaries engaged in insurance activities are excludedfrom the regulatory consolidation by excluding assets,liabilities and post-acquisition reserves, leaving theinvestment of these insurance subsidiaries to be recorded atcost and deducted from CET1 (subject to thresholds).
The regulatory consolidation also excludes special purposeentities (‘SPEs’) where significant risk has been transferred tothird parties. Exposures to these SPEs are risk-weighted assecuritisation positions for regulatory purposes.
HSBC BANK PLC19
Reconciliation of balance sheets – financial accounting to regulatory scope of consolidation
Accountingbalance
sheet
De-consolidationof insurance/other entities
Consolidationof bankingassociates
Regulatorybalance
sheet
Ref † £m £m £m £m
Assets
Cash and balances at central banks 55,147 — 73 55,220
Items in the course of collection from other banks 1,202 — — 1,202
Trading assets 142,356 316 95 142,767
Financial assets designated at fair value 7,337 (7,337) — —
Derivatives 238,906 (120) — 238,786
Loans and advances to banks 21,113 (799) 10 20,324
Loans and advances to customers 266,614 (4,141) — 262,473
Of which:
– impairment allowances on IRB portfolios h (1,838) — — (1,838)
– impairment allowances on standardised portfolios (816) — — (816)
Reverse repurchase agreements – non-trading 47,164 335 — 47,499
Financial investments 83,561 (12,462) 94 71,193
Assets held for sale 27 — — 27
Capital invested in insurance and other entities — 598 — 598
Current tax assets 116 (5) — 111
Prepayments, accrued income and other assets 16,099 (739) 39 15,399
Of which:
– retirement benefit assets i 4,069 — — 4,069
Interests in associates and joint ventures 287 (1) (235) 51
Of which:
– positive goodwill on acquisition e 48 — (48) —
Goodwill and intangible assets e 7,620 (521) 3 7,102
Deferred tax assets f 112 128 4 244
Total assets at 30 Jun 2016 o 887,661 (24,748) 83 862,996

† The references (a) – (n) identify balance sheet components which are used in the calculation of regulatory capital on page 16. The reference (o)identifies balance sheet component used in the calculation of the Leverage ratio on page 18.
Accountingbalance
sheet
De-consolidationof insurance/other entities
Consolidationof bankingassociates
Regulatorybalance
sheet
Ref † £m £m £m £m
Liabilities and equity
Deposits by banks 28,986 (15) 53 29,024
Customer accounts 363,651 1,212 — 364,863
Repurchase agreements – non-trading 27,408 — — 27,408
Items in the course of transmission to other banks 718 — — 718
Trading liabilities 107,968 520 1 108,489
Financial liabilities designated at fair value 19,419 (1,007) — 18,412
Of which:
– term subordinated debt included in tier 2 capital l,m 1,583 — — 1,583
– preferred securities included in tier 1 capital k 310 — — 310
Derivatives 234,698 160 — 234,858
Debt securities in issue 25,215 (5,132) — 20,083
Current tax liabilities 269 (78) 1 192
Liabilities under insurance contracts 18,940 (18,940) — —
Accruals, deferred income and other liabilities 6,853 (897) 26 5,982
Of which:
– retirement benefit liabilities 383 (2) 7 388
Provisions 2,110 (7) 2 2,105
Of which:
– contingent liabilities and contractual commitments 23 — — 23
Of which:
– credit-related provisions on IRB portfolios h 20 — — 20
– credit-related provisions on standardised portfolios 3 — — 3
Deferred tax liabilities 766 — — 766
Subordinated liabilities 9,111 — — 9,111
Of which:
– preferred securities included in tier 1 capital k 700 — — 700
– perpetual subordinated debt included in tier 2 capital l,n 3,297 — — 3,297
– term subordinated debt included in tier 2 capital l,m,n 4,382 — — 4,382
Total liabilities at 30 Jun 2016 846,112 (24,184) 83 822,011
Called up share capital a 797 — — 797
Share premium account a,k 20,733 — — 20,733
Other equity instruments j 3,584 — — 3,584
Other reserves c,g 1,510 — — 1,510
Retained earnings b,c 14,199 (564) — 13,635
Total shareholders’ equity 40,823 (564) — 40,259
Non-controlling interests d,k 726 — — 726
Of which:
– non-cumulative preference shares issued by subsidiariesincluded in tier 1 capital k 150 — — 150
Total equity at 30 Jun 2016 41,549 (564) — 40,985
Total liabilities and equity at 30 Jun 2016 887,661 (24,748) 83 862,996
Business Review (continued)
HSBC BANK PLC20

Performance and businessreviewProfit/(loss) on ordinary activities before tax
Half-year to
30 Jun2016
30 Jun2015
31 Dec2015
£m £m £m
Retail Banking and WealthManagement 678 606 260
Commercial Banking 962 881 716
Global Banking and Markets 429 606 28
Global Private Banking 72 97 48
Other (150) (54) (217)
1,991 2,136 835
Total assets
At
30 Jun2016
30 Jun2015
31 Dec2015
£m £m £m
Retail Banking and WealthManagement 158,391 149,580 150,270
Commercial Banking 83,686 79,478 80,919
Global Banking and Markets 722,578 577,837 543,803
Global Private Banking 16,278 14,902 15,044
Other (93,272) (71,944) (62,095)
887,661 749,853 727,941
HSBC BANK PLC21
Reported performanceHSBC Bank plc reported a profit before tax of £1,991m,£145m or 7% lower than the first half of 2015.
In RBWM, reported profit before tax increased by £72mprimarily due to lower expenses reflecting lower customerredress charges and a gain on disposal of our membershipinterest in Visa Europe partly offset by lower revenue mainlydue to adverse movements in the PVIF long-term insurancebusiness in France.
In CMB, reported profit before tax rose by £81m, due tohigher revenue arising from a gain on disposal of ourmembership interest in Visa Europe, partly offset by higherloan impairment charges in the UK and Spain.
In GB&M reported profit before tax decreased by £177m,mainly from lower revenue in Markets compared with astrong performance in the first half of 2015, partly offset by
lower costs from settlements and provisions in connectionwith legal and regulatory matters.
In GPB, reported profit before tax decreased by £25mreflecting lower revenue due to the non-recurrence of a prioryear gain on the sale of a portfolio of liquid assets in the UK.
In Other, reported loss before tax increased by £96m mainlydriven by higher costs, notably costs-to-achieve, partly offsetby favourable credit-spread-related movements in the fairvalue of the group’s own long-term debt.
Use of non-GAAP financial measuresOur reported results are prepared in accordance with IFRSsas detailed in the Financial Statements starting on page 30. Inmeasuring our business performance, the primary financialmeasure that we use is ‘adjusted performance’, which hasbeen derived from our reported results in order to eliminatefactors which distort year-on-year comparisons. This isconsidered to be a non-GAAP financial measure.
Adjusted performance Adjusted performance is computed by adjusting reportedresults for the period-on-period effects of significant itemswhich distort period-on-period comparisons.
‘Significant items’ are excluded from adjusted performancebecause management and investors would ordinarily identifyand consider them separately in order to better understandthe underlying trends in the business.
In 2015, two new categories of significant items in relation toexpenses have been added, namely costs-to-achieve (‘CTA’)and costs to establish the UK ring-fenced bank. CTA comprisethose specific costs relating to the achievement of strategicactions set out in the Investor Update in June 2015. Theseare costs incurred between 1 July 2015 and 31 December2017, and do not include ongoing initiatives such as GlobalStandards. Any costs arising within this category have beenincurred as part of a significant transformation programmeand are included within significant items. CTA includerestructuring costs which were identified as a separatesignificant item prior to 1 July 2015.
We consider adjusted performance provides usefulinformation for investors by aligning internal and externalreporting, identifying and quantifying items managementbelieve to be significant and providing insight into howmanagement assesses year-on-year performance.
A reconciliation to the adjusted basis is given in the tablesbelow.
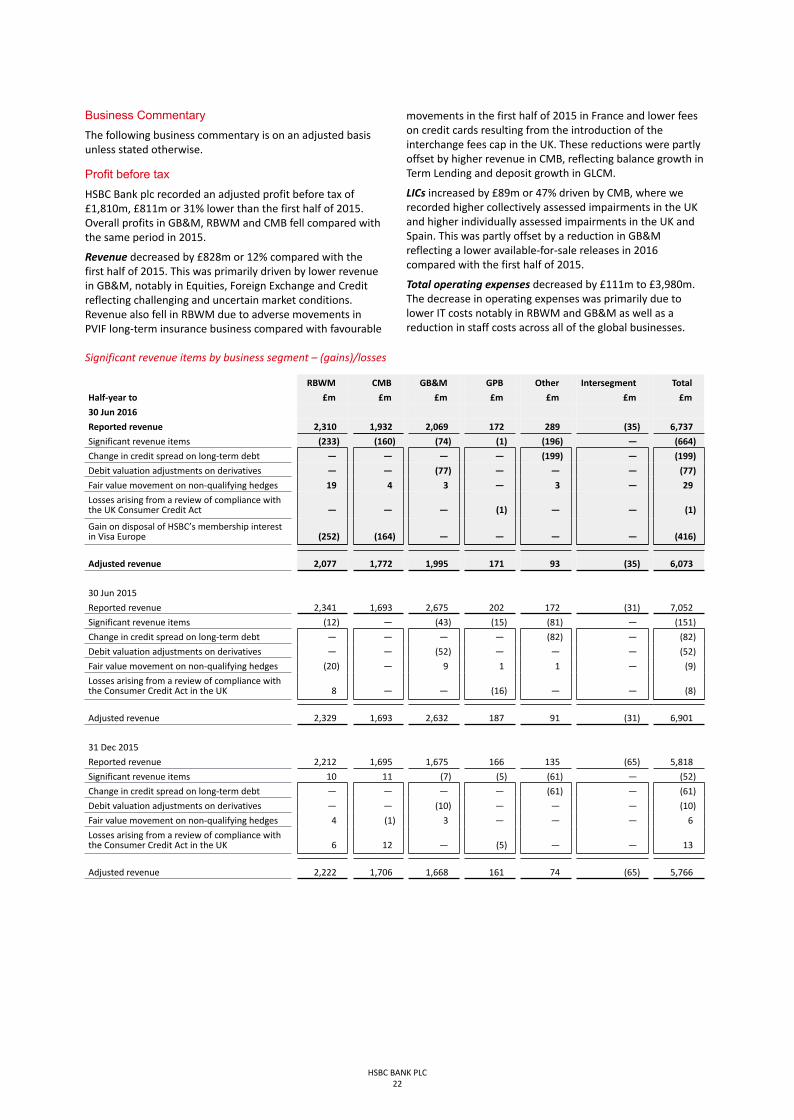
Business Commentary The following business commentary is on an adjusted basisunless stated otherwise.
Profit before tax HSBC Bank plc recorded an adjusted profit before tax of£1,810m, £811m or 31% lower than the first half of 2015.Overall profits in GB&M, RBWM and CMB fell compared withthe same period in 2015.
Revenue decreased by £828m or 12% compared with thefirst half of 2015. This was primarily driven by lower revenuein GB&M, notably in Equities, Foreign Exchange and Creditreflecting challenging and uncertain market conditions.Revenue also fell in RBWM due to adverse movements inPVIF long-term insurance business compared with favourable
movements in the first half of 2015 in France and lower feeson credit cards resulting from the introduction of theinterchange fees cap in the UK. These reductions were partlyoffset by higher revenue in CMB, reflecting balance growth inTerm Lending and deposit growth in GLCM.
LICs increased by £89m or 47% driven by CMB, where werecorded higher collectively assessed impairments in the UKand higher individually assessed impairments in the UK andSpain. This was partly offset by a reduction in GB&Mreflecting a lower available-for-sale releases in 2016compared with the first half of 2015.
Total operating expenses decreased by £111m to £3,980m.The decrease in operating expenses was primarily due tolower IT costs notably in RBWM and GB&M as well as areduction in staff costs across all of the global businesses.
Significant revenue items by business segment – (gains)/losses
RBWM CMB GB&M GPB Other Intersegment Total
Half-year to £m £m £m £m £m £m £m
30 Jun 2016
Reported revenue 2,310 1,932 2,069 172 289 (35) 6,737
Significant revenue items (233) (160) (74) (1) (196) — (664)
Change in credit spread on long-term debt — — — — (199) — (199)
Debit valuation adjustments on derivatives — — (77) — — — (77)
Fair value movement on non-qualifying hedges 19 4 3 — 3 — 29
Losses arising from a review of compliance withthe UK Consumer Credit Act — — — (1) — — (1)
Gain on disposal of HSBC’s membership interestin Visa Europe (252) (164) — — — — (416)
Adjusted revenue 2,077 1,772 1,995 171 93 (35) 6,073
30 Jun 2015
Reported revenue 2,341 1,693 2,675 202 172 (31) 7,052
Significant revenue items (12) — (43) (15) (81) — (151)
Change in credit spread on long-term debt — — — — (82) — (82)
Debit valuation adjustments on derivatives — — (52) — — — (52)
Fair value movement on non-qualifying hedges (20) — 9 1 1 — (9)
Losses arising from a review of compliance withthe Consumer Credit Act in the UK 8 — — (16) — — (8)
Adjusted revenue 2,329 1,693 2,632 187 91 (31) 6,901
31 Dec 2015
Reported revenue 2,212 1,695 1,675 166 135 (65) 5,818
Significant revenue items 10 11 (7) (5) (61) — (52)
Change in credit spread on long-term debt — — — — (61) — (61)
Debit valuation adjustments on derivatives — — (10) — — — (10)
Fair value movement on non-qualifying hedges 4 (1) 3 — — — 6
Losses arising from a review of compliance withthe Consumer Credit Act in the UK 6 12 — (5) — — 13
Adjusted revenue 2,222 1,706 1,668 161 74 (65) 5,766
HSBC BANK PLC22
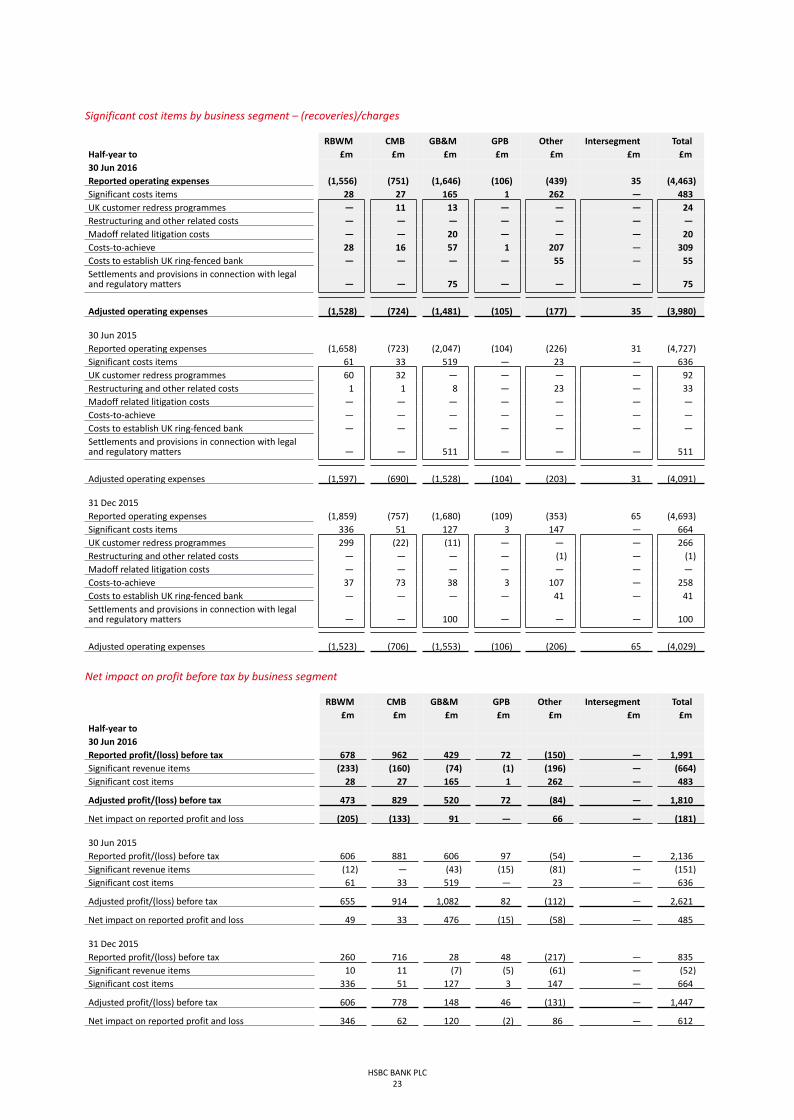
Significant cost items by business segment – (recoveries)/charges
RBWM CMB GB&M GPB Other Intersegment TotalHalf-year to £m £m £m £m £m £m £m30 Jun 2016Reported operating expenses (1,556) (751) (1,646) (106) (439) 35 (4,463)Significant costs items 28 27 165 1 262 — 483UK customer redress programmes — 11 13 — — — 24Restructuring and other related costs — — — — — — —Madoff related litigation costs — — 20 — — — 20Costs-to-achieve 28 16 57 1 207 — 309Costs to establish UK ring-fenced bank — — — — 55 — 55Settlements and provisions in connection with legaland regulatory matters — — 75 — — — 75
Adjusted operating expenses (1,528) (724) (1,481) (105) (177) 35 (3,980)
30 Jun 2015Reported operating expenses (1,658) (723) (2,047) (104) (226) 31 (4,727)Significant costs items 61 33 519 — 23 — 636UK customer redress programmes 60 32 — — — — 92Restructuring and other related costs 1 1 8 — 23 — 33Madoff related litigation costs — — — — — — —Costs-to-achieve — — — — — — —Costs to establish UK ring-fenced bank — — — — — — —Settlements and provisions in connection with legaland regulatory matters — — 511 — — — 511
Adjusted operating expenses (1,597) (690) (1,528) (104) (203) 31 (4,091)
31 Dec 2015Reported operating expenses (1,859) (757) (1,680) (109) (353) 65 (4,693)Significant costs items 336 51 127 3 147 — 664UK customer redress programmes 299 (22) (11) — — — 266Restructuring and other related costs — — — — (1) — (1)Madoff related litigation costs — — — — — — —Costs-to-achieve 37 73 38 3 107 — 258Costs to establish UK ring-fenced bank — — — — 41 — 41Settlements and provisions in connection with legaland regulatory matters — — 100 — — — 100
Adjusted operating expenses (1,523) (706) (1,553) (106) (206) 65 (4,029)
Net impact on profit before tax by business segment
RBWM CMB GB&M GPB Other Intersegment Total£m £m £m £m £m £m £m
Half-year to30 Jun 2016Reported profit/(loss) before tax 678 962 429 72 (150) — 1,991Significant revenue items (233) (160) (74) (1) (196) — (664)Significant cost items 28 27 165 1 262 — 483
Adjusted profit/(loss) before tax 473 829 520 72 (84) — 1,810
Net impact on reported profit and loss (205) (133) 91 — 66 — (181)
30 Jun 2015Reported profit/(loss) before tax 606 881 606 97 (54) — 2,136Significant revenue items (12) — (43) (15) (81) — (151)Significant cost items 61 33 519 — 23 — 636
Adjusted profit/(loss) before tax 655 914 1,082 82 (112) — 2,621
Net impact on reported profit and loss 49 33 476 (15) (58) — 485
31 Dec 2015Reported profit/(loss) before tax 260 716 28 48 (217) — 835Significant revenue items 10 11 (7) (5) (61) — (52)Significant cost items 336 51 127 3 147 — 664
Adjusted profit/(loss) before tax 606 778 148 46 (131) — 1,447
Net impact on reported profit and loss 346 62 120 (2) 86 — 612
HSBC BANK PLC23
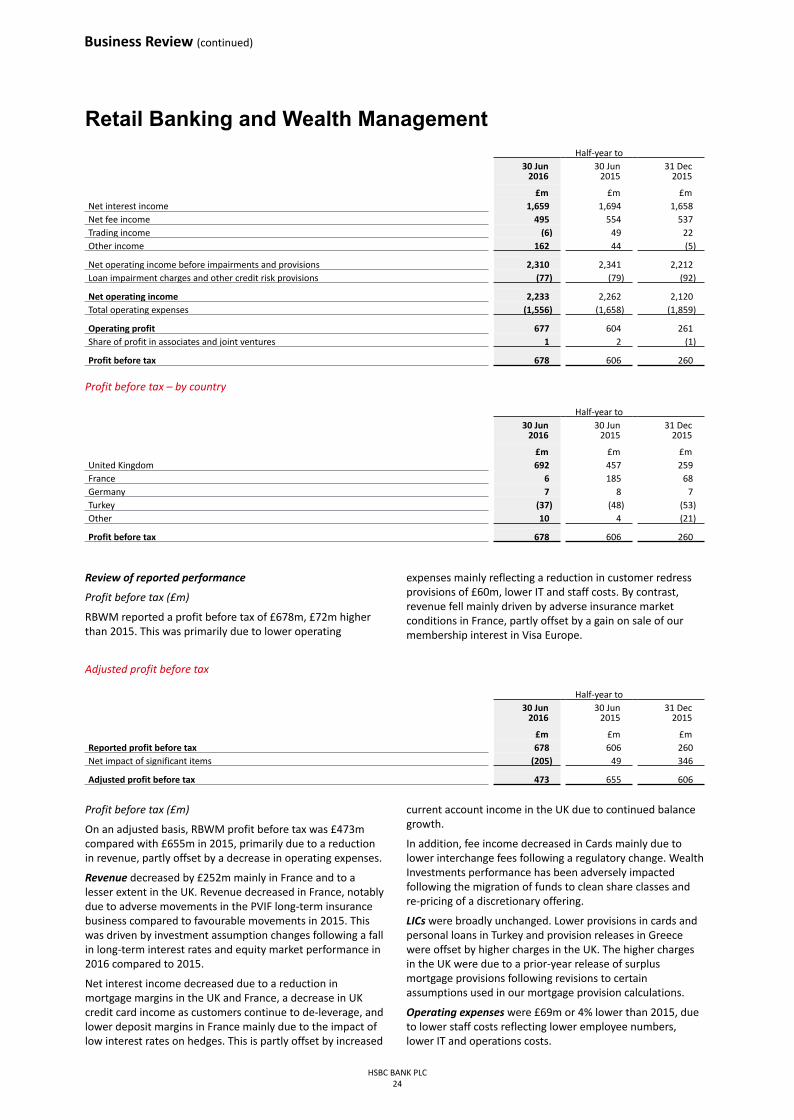
Retail Banking and Wealth Management Half-year to
30 Jun2016
30 Jun2015
31 Dec2015
£m £m £mNet interest income 1,659 1,694 1,658Net fee income 495 554 537Trading income (6) 49 22Other income 162 44 (5)
Net operating income before impairments and provisions 2,310 2,341 2,212Loan impairment charges and other credit risk provisions (77) (79) (92)
Net operating income 2,233 2,262 2,120Total operating expenses (1,556) (1,658) (1,859)
Operating profit 677 604 261Share of profit in associates and joint ventures 1 2 (1)
Profit before tax 678 606 260
Profit before tax – by country
Half-year to30 Jun
201630 Jun
201531 Dec
2015
£m £m £mUnited Kingdom 692 457 259France 6 185 68Germany 7 8 7Turkey (37) (48) (53)Other 10 4 (21)
Profit before tax 678 606 260
Business Review (continued)
HSBC BANK PLC24
Review of reported performance
Profit before tax (£m)
RBWM reported a profit before tax of £678m, £72m higherthan 2015. This was primarily due to lower operating
expenses mainly reflecting a reduction in customer redressprovisions of £60m, lower IT and staff costs. By contrast,revenue fell mainly driven by adverse insurance marketconditions in France, partly offset by a gain on sale of ourmembership interest in Visa Europe.
Adjusted profit before tax
Half-year to30 Jun
201630 Jun
201531 Dec
2015
£m £m £mReported profit before tax 678 606 260Net impact of significant items (205) 49 346
Adjusted profit before tax 473 655 606
Profit before tax (£m)
On an adjusted basis, RBWM profit before tax was £473mcompared with £655m in 2015, primarily due to a reductionin revenue, partly offset by a decrease in operating expenses.
Revenue decreased by £252m mainly in France and to alesser extent in the UK. Revenue decreased in France, notablydue to adverse movements in the PVIF long-term insurancebusiness compared to favourable movements in 2015. Thiswas driven by investment assumption changes following a fallin long-term interest rates and equity market performance in2016 compared to 2015.
Net interest income decreased due to a reduction inmortgage margins in the UK and France, a decrease in UKcredit card income as customers continue to de-leverage, andlower deposit margins in France mainly due to the impact oflow interest rates on hedges. This is partly offset by increased
current account income in the UK due to continued balancegrowth.
In addition, fee income decreased in Cards mainly due tolower interchange fees following a regulatory change. WealthInvestments performance has been adversely impactedfollowing the migration of funds to clean share classes andre-pricing of a discretionary offering.
LICs were broadly unchanged. Lower provisions in cards andpersonal loans in Turkey and provision releases in Greecewere offset by higher charges in the UK. The higher chargesin the UK were due to a prior-year release of surplusmortgage provisions following revisions to certainassumptions used in our mortgage provision calculations.
Operating expenses were £69m or 4% lower than 2015, dueto lower staff costs reflecting lower employee numbers,lower IT and operations costs.

Commercial BankingHalf-year to
30 Jun2016
30 Jun2015
31 Dec2015
£m £m £mNet interest income 1,172 1,097 1,148Net fee income 569 559 542Trading income 8 11 8Other income 183 26 (3)
Net operating income before impairments and provisions 1,932 1,693 1,695Loan impairment charges and other credit risk provisions (214) (89) (222)
Net operating income 1,718 1,604 1,473Total operating expenses (751) (723) (757)
Operating profit 967 881 716Share of profit in associates and joint ventures (5) — —
Profit before tax 962 881 716
Profit before tax – by country
Half-year to30 Jun
201630 Jun
201531 Dec
2015
£m £m £mUnited Kingdom 829 766 648France 96 54 45Germany 25 20 23Turkey 1 8 7Other 11 33 (7)
Profit before tax 962 881 716
HSBC BANK PLC25
Review of reported performance
Profit before tax (£m)
CMB reported a profit before tax of £962m, £81m or 9%higher than 2015. This was driven by higher revenue arising
from a gain on sale of our membership interest in VisaEurope, partly offset by higher loan impairment charges inthe UK and Spain.
Adjusted profit before tax
Half-year to30 Jun
201630 Jun
201531 Dec
2015
£m £m £mReported profit before tax 962 881 716Net impact of significant items (133) 33 62
Adjusted profit before tax 829 914 778
Profit before tax (£m)
On an adjusted basis, CMB profit before tax was £829mcompared with £914m in 2015, a decrease of £85m or 9%.This decrease was driven by higher loan impairment chargesnotably in the UK and Spain.
Revenue increased by £79m, mainly in the UK reflectingbalance growth from new business inflows in Credit andLending and deposit growth in GLCM. This was partly offsetby lower insurance and investments revenue following thesale of the pension business in the second half of 2015.
LICs increased reflecting higher collectively assessedprovisions in the UK and higher individually assessedprovisions in the UK (in the oil and gas and, to a lesser extent,shipping sectors) and Spain (in the construction sector). Thiswas partly offset by lower individually assessed amounts inFrance.
Operating expenses were £34m higher compared with 2015.This was mainly due to an increase in customer remediationprovision in the UK.

Global Banking and MarketsHalf-year to
30 Jun2016
30 Jun2015
31 Dec2015
£m £m £m
Net interest income1 595 694 480
Net fee income 307 251 312
Trading income1 2,001 1,145 1,325
Other income (834) 585 (442)
Net operating income before impairments and provisions 2,069 2,675 1,675
Loan impairment charges and other credit risk provisions 5 (22) 32
Net operating income 2,074 2,653 1,707
Total operating expenses (1,646) (2,047) (1,680)
Operating profit 428 606 27
Share of profit in associates and joint ventures 1 — 1
Profit before tax 429 606 28
1 The bank’s Balance Sheet Management business, reported within GB&M, provides funding to the trading businesses. To report GB&M trading incomeon a fully funded basis, net interest income and net trading income are grossed up to reflect internal funding transactions prior to their elimination inthe ‘inter-segment’ column (see Note 4).
Profit before tax – by country
Half-year to
30 Jun2016
30 Jun2015
31 Dec2015
£m £m £m
United Kingdom 146 273 (74)
France 93 158 (86)
Germany 66 49 54
Turkey 41 32 29
Other 83 94 105
Profit before tax 429 606 28
Business Review (continued)
HSBC BANK PLC26
Review of reported performance
Profit before tax (£m)
GB&M reported a profit before tax of £429m, compared with
£606m in 2015, a decrease of £177m. Market uncertaintyadversely impacted revenue, however this was partly offsetby lower costs booked in the first half of 2016.
Adjusted profit before tax
Half-year to
30 Jun2016
30 Jun2015
31 Dec2015
£m £m £m
Reported profit before tax 429 606 28
Net impact of significant items 91 476 120
Adjusted profit before tax 520 1,082 148
Profit before tax (£m)
On an adjusted basis, GB&M profit before tax was £520mcompared with £1,082m in 2015, a decrease of £562mprimarily due to decreased revenue compared with a strongperformance in the first half of 2015, partly offset by loweroperating expenses and loan impairment charges.
Revenue decreased by £637m, notably in Markets, whereincome fell in Equities and Foreign Exchange reflectingmarket volatility, which led to reduced client activity.
In addition, Balance Sheet Management revenue fell due tolower gains on disposal of available-for-sale debt securitiesand gains from hedging programmes in the first half of 2015.
LICs decreased mainly driven by net releases of individuallyand collectively assessed impairments compared with netcharges in the prior year. This was partly offset by lower netreleases on available-for-sale asset-backed securities.
Operating expenses were £47m lower mainly due to lowerstaff and IT costs, notably in the UK.

Global Private BankingHalf-year to
30 Jun2016
30 Jun2015
31 Dec2015
£m £m £m
Net interest income 99 126 107
Net fee income 52 57 50
Trading income 7 5 8
Other income 14 14 1
Net operating income before impairments and provisions 172 202 166
Loan impairment charges and other credit risk provisions 6 (1) (9)
Net operating income 178 201 157
Total operating expenses (106) (104) (109)
Operating profit 72 97 48
Share of profit in associates and joint ventures — — —
Profit before tax 72 97 48
Profit before tax – by country
Half-year to
30 Jun2016
30 Jun2015
31 Dec2015
£m £m £m
United Kingdom 65 84 41
France 3 7 2
Germany 4 8 5
Other — (2) —
Profit before tax 72 97 48
HSBC BANK PLC27
Review of reported performance
Profit before tax (£m)
GPB reported a profit before tax of £72m, £25m lower than2015, mainly due to lower revenue as a result of therepositioning of the business.
Adjusted profit before tax
Half-year to
30 Jun2016
30 Jun2015
31 Dec2015
£m £m £m
Reported profit before tax 72 97 48
Net impact of significant items — (15) (2)
Adjusted profit before tax 72 82 46
Profit before tax (£m)
GPB adjusted profit before tax was £72m compared with£82m in 2015, a decrease of £10m.
Revenue fell by £16m due to lower average lending balancesreflecting the repositioning of the business and the non-recurrence of a gain on the sale of bonds in the first half of2015.
LICs decreased mainly due to lower collectively assessedprovisions.
Operating expenses were broadly unchanged.

Other‘Other’ contains the results of financing operations, centralsupport and functional costs with associated recoveries,certain property transactions and movements in fair value ofown debt.
Half-year to
30 Jun2016
30 Jun2015
31 Dec2015
£m £m £m
Net interest income (17) (47) (16)
Net fee income 2 2 (1)
Trading income 27 48 7
Change in Credit Spread on long-term debt 199 82 61
Other income 78 87 84
Net operating income before impairments and provisions 289 172 135
Loan impairment charges and other credit risk provisions — — 1
Net operating income 289 172 136
Total operating expenses (439) (226) (353)
Operating loss (150) (54) (217)
Share of profit in associates and joint ventures — — —
Loss before tax (150) (54) (217)
Business Review (continued)
HSBC BANK PLC28
Review of reported performance
Loss before tax (£m)
Other reported a loss before tax of £150m compared with aloss of £54m in 2015. This was mainly due to higher costs,
notably costs-to-achieve and costs to establish the UK ring-fenced bank, partly offset by favourable credit-spread-relatedmovements in the fair value of the group’s own long-termdebt.
Adjusted loss before tax
Half-year to
30 Jun2016
30 Jun2015
31 Dec2015
£m £m £m
Reported loss before tax (150) (54) (217)
Net impact of significant items 66 (58) 86
Adjusted loss before tax (84) (112) (131)
Loss before tax (£m)
Other adjusted loss was £84m compared with a loss of£112m in 2015, a decrease of £28m.
Revenue remained broadly unchanged compared with theprior year.
Operating expenses decreased by £26m compared with2015, mainly driven by a release of a provision relating to the2015 bonus accrual in the UK.
Statement of Directors’ ResponsibilitiesThe Directors, who are required to prepare the financial statements on the going concern basis unless it is not appropriate, aresatisfied that the group and bank have the resources to continue in business for the foreseeable future and that the financialstatements continue to be prepared on the going concern basis.
The Directors, the names of whom are set out below, confirm that to the best of their knowledge:
• the condensed set of financial statements has been prepared in accordance with IAS 34 ‘Interim Financial Reporting’ asadopted by the EU; and
• the interim management report includes a fair review of the information required by DTR 4.2.7R of the Disclosure andTransparency Rules, being an indication of important events that have occurred during the first six months of the financialyear ending 31 December 2016 and their impact on the condensed set of financial statements; and a description of theprincipal risks and uncertainties for the remaining six months of the financial year.
J R Symonds† (Chairman); J F Trueman† (Deputy Chairman); A P S Simoes (Chief Executive); J Coyle†; Dame Denise Holt†; S WLeathes†; D Lister†; Dame Mary Marsh†; and T B Moulonguet†.
On behalf of the Board
A P S Simoes
3 August 2016
Chief Executive
† Independent non-executive Director
Statement of Directors' Responsibilities
HSBC BANK PLC29

Financial Statements
Condensed Financial Statements
HSBC BANK PLC30
Consolidated income statement for the half-year to 30 June 2016
Half-year to
30 Jun2016
30 Jun2015
Notes £m £m
Interest income 4,714 4,712
Interest expense (1,276) (1,208)
Net interest income 3,438 3,504
Fee income 2,067 2,110
Fee expense (642) (687)
Net fee income 1,425 1,423
Trading income excluding net interest income 1,920 1,067
Net interest income on trading activities 187 251
Net trading income 2,107 1,318
Changes in fair value of long-term debt issued and related derivatives (738) 503
Net (expense)/income from other financial instruments designated at fair value (73) 335
Net (expense)/income from financial instruments designated at fair value (811) 838
Gains less losses from financial investments 488 136
Dividend income 5 6
Net earned insurance premiums 860 900
Other operating income 37 232
Total operating income 7,549 8,357
Net insurance claims and benefits paid and movement in liabilities to policyholders (812) (1,305)
Net operating income before loan impairment charges and other credit risk provisions 6,737 7,052
Loan impairment charges and other credit risk provisions 3 (280) (191)
Net operating income 6,457 6,861
Employee compensation and benefits (2,076) (2,153)
General and administrative expenses (2,133) (2,332)
Depreciation and impairment of property, plant and equipment (145) (122)
Amortisation and impairment of intangible assets (109) (120)
Total operating expenses (4,463) (4,727)
Operating profit 1,994 2,134
Share of (loss)/profit in associates and joint ventures (3) 2
Profit before tax 1,991 2,136
Tax expense (562) (590)
Profit for the period 1,429 1,546
Profit attributable to shareholders of the parent company 1,410 1,529
Profit attributable to non-controlling interests 19 17

Consolidated statement of comprehensive income for the half-year to 30 June 2016
Half-year to
30 Jun2016
30 Jun2015
£m £m
Profit for the period 1,429 1,546
Other comprehensive income/(expense)Items that will be reclassified subsequently to profit or loss when specific conditions are met:
Available-for-sale investments (173) (89)
– fair value gains 336 26
– fair value gains reclassified to the income statement (500) (122)
– amounts reclassified to the income statement in respect of impairment losses/(gains) 13 (6)
– income taxes (22) 13
Cash flow hedges 310 (173)
– fair value gains 61 103
– fair value losses/(gains) reclassified to the income statement 366 (344)
– income taxes (117) 68
Exchange differences and other 1,648 (1,053)
Items that will not be reclassified subsequently to profit or loss:
Remeasurement of the defined benefit asset 419 (998)
– before income taxes 564 (1,242)
– income taxes (145) 244
Other comprehensive income/(expense) for the period, net of tax 2,204 (2,313)
Total comprehensive income/(expense) for the period 3,633 (767)
Attributable to:
– shareholders of the parent company 3,562 (745)
– non-controlling interests 71 (22)
Total comprehensive income/(expense) for the period 3,633 (767)
HSBC BANK PLC31
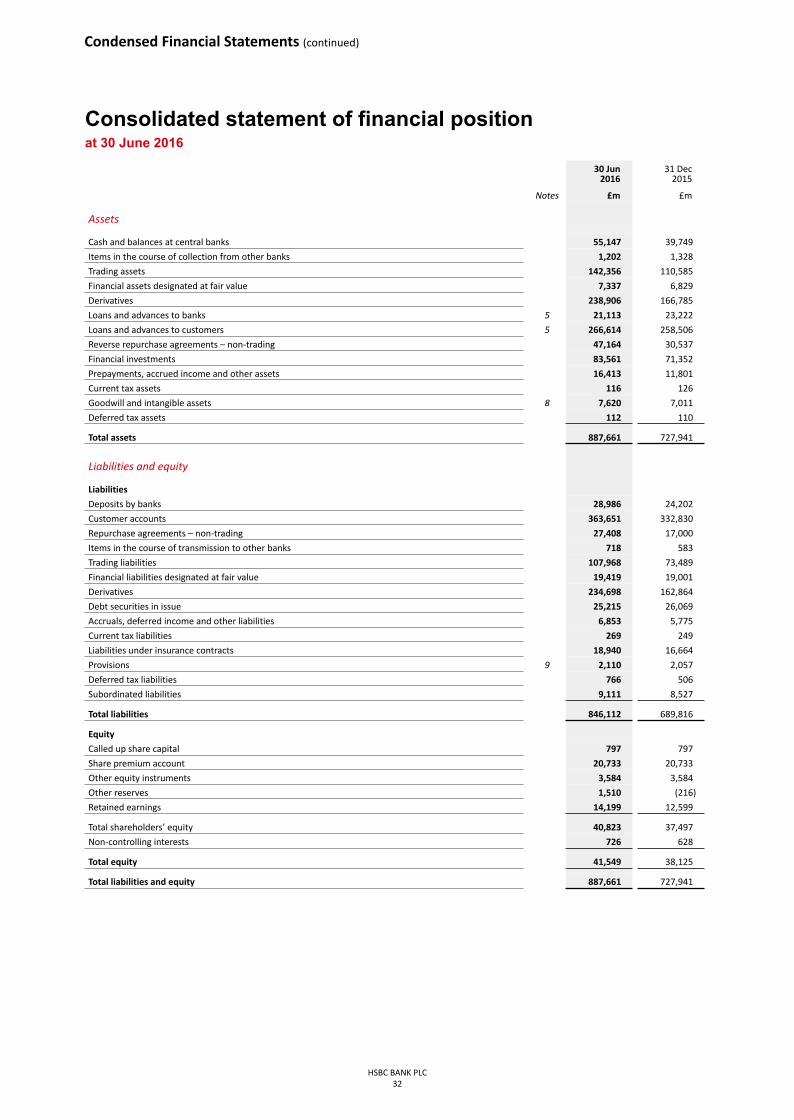
Consolidated statement of financial position at 30 June 2016
30 Jun2016
31 Dec2015
Notes £m £m
Assets
Cash and balances at central banks 55,147 39,749
Items in the course of collection from other banks 1,202 1,328
Trading assets 142,356 110,585
Financial assets designated at fair value 7,337 6,829
Derivatives 238,906 166,785
Loans and advances to banks 5 21,113 23,222
Loans and advances to customers 5 266,614 258,506
Reverse repurchase agreements – non-trading 47,164 30,537
Financial investments 83,561 71,352
Prepayments, accrued income and other assets 16,413 11,801
Current tax assets 116 126
Goodwill and intangible assets 8 7,620 7,011
Deferred tax assets 112 110
Total assets 887,661 727,941
Liabilities and equity
Liabilities
Deposits by banks 28,986 24,202
Customer accounts 363,651 332,830
Repurchase agreements – non-trading 27,408 17,000
Items in the course of transmission to other banks 718 583
Trading liabilities 107,968 73,489
Financial liabilities designated at fair value 19,419 19,001
Derivatives 234,698 162,864
Debt securities in issue 25,215 26,069
Accruals, deferred income and other liabilities 6,853 5,775
Current tax liabilities 269 249
Liabilities under insurance contracts 18,940 16,664
Provisions 9 2,110 2,057
Deferred tax liabilities 766 506
Subordinated liabilities 9,111 8,527
Total liabilities 846,112 689,816
Equity
Called up share capital 797 797
Share premium account 20,733 20,733
Other equity instruments 3,584 3,584
Other reserves 1,510 (216)
Retained earnings 14,199 12,599
Total shareholders’ equity 40,823 37,497
Non-controlling interests 726 628
Total equity 41,549 38,125
Total liabilities and equity 887,661 727,941
Condensed Financial Statements (continued)
HSBC BANK PLC32

Consolidated statement of cash flows for the half-year to 30 June 2016
Half-year to
30 Jun2016
30 Jun2015
£m £m
Cash flows from operating activities
Profit before tax 1,991 2,136
Adjustments for:
– non-cash items included in profit before tax 914 1,022
– change in operating assets (6,931) 23,075
– change in operating liabilities 48,421 (19,655)
– elimination of exchange differences (9,178) 4,885
– net gain from investing activities (490) (137)
– share of profit in associates and joint ventures 3 (2)
– contributions paid to defined benefit plans (32) (62)
– tax paid (592) (441)
Net cash generated from operating activities 34,106 10,821
Cash flows from investing activities
Purchase of financial investments (20,503) (13,873)
Proceeds from the sale and maturity of financial investments 14,449 18,984
Purchase of property, plant and equipment (143) (140)
Proceeds from the sale of property, plant and equipment 14 14
Purchase of goodwill and intangible assets (96) (98)
Proceeds from the sale of intangible assets 1 1
Net cash outflow from acquisition of businesses and subsidiaries — (8)
Net cash (used in)/generated from investing activities (6,278) 4,880
Cash flows from financing activities
Subordinated loan capital issued 54 —
Subordinated loan capital repaid (176) —
Net cash inflow from change in stake of subsidiaries 40 2
Dividends paid to shareholders (335) (377)
Dividends paid to non-controlling interests (14) (12)
Net cash used in financing activities (431) (387)
Net increase in cash and cash equivalents 27,397 15,314
Cash and cash equivalents at 1 Jan 62,995 71,500
Effect of exchange rate changes on cash and cash equivalents 5,196 (2,316)
Cash and cash equivalents at 30 Jun 95,588 84,498
HSBC BANK PLC33

Consolidated statement of changes in equity for the half-year to 30 June 2016
Other reserves
Calledup share
capitalShare
premiumOther equityinstruments
Retainedearnings
Available-for-sale fair
value reserve
Cash flowhedgingreserve
Foreign exchange
reserve
Total share-holders’
equity
Non-controlling
interestsTotal
equity
£m £m £m £m £m £m £m £m £m £m
At 1 Jan 2016 797 20,733 3,584 12,599 979 43 (1,238) 37,497 628 38,125
Profit for the period — — — 1,410 — — — 1,410 19 1,429
Other comprehensive income (net of tax) — — — 425 (172) 310 1,589 2,152 52 2,204
– available-for-sale investments — — — — (172) — — (172) (1) (173)
– cash flow hedges — — — — — 310 — 310 — 310
– remeasurement of defined benefit asset/liability — — — 425 — — — 425 (6) 419
– exchange differences and other — — — — — — 1,589 1,589 59 1,648
Total comprehensive income for the period — — — 1,835 (172) 310 1,589 3,562 71 3,633
Dividends to shareholders — — — (335) — — — (335) (14) (349)
Net impact of equity-settled share based payments — — — 63 — — — 63 — 63
Change in business combinations and other movements — — — (6) (1) — — (7) 41 34
Tax on items taken directly to equity — — — 43 — — — 43 — 43
At 30 Jun 2016 797 20,733 3,584 14,199 806 353 351 40,823 726 41,549
At 1 Jan 2015 797 20,733 2,196 11,580 1,070 176 (474) 36,078 620 36,698
Profit for the period — — — 1,529 — — — 1,529 17 1,546
Other comprehensive income (net of tax) — — — (1,000) (86) (173) (1,015) (2,274) (39) (2,313)
– available-for-sale investments — — — — (86) — — (86) (3) (89)
– cash flow hedges — — — — — (173) — (173) — (173)
– remeasurement of defined benefit asset/liability — — — (1,000) — — — (1,000) 2 (998)
– exchange differences and other — — — — — — (1,015) (1,015) (38) (1,053)
Total comprehensive income for the period — — — 529 (86) (173) (1,015) (745) (22) (767)
Dividends to shareholders — — — (377) — — — (377) (12) (389)
Net impact of equity-settled share based payments — — — 20 — — — 20 — 20
Changes in business combinations and other movements — — — (1) — — — (1) — (1)
At 30 Jun 2015 797 20,733 2,196 11,751 984 3 (1,489) 34,975 586 35,561
Condensed Financial Statements (continued)
HSBC BANK PLC34
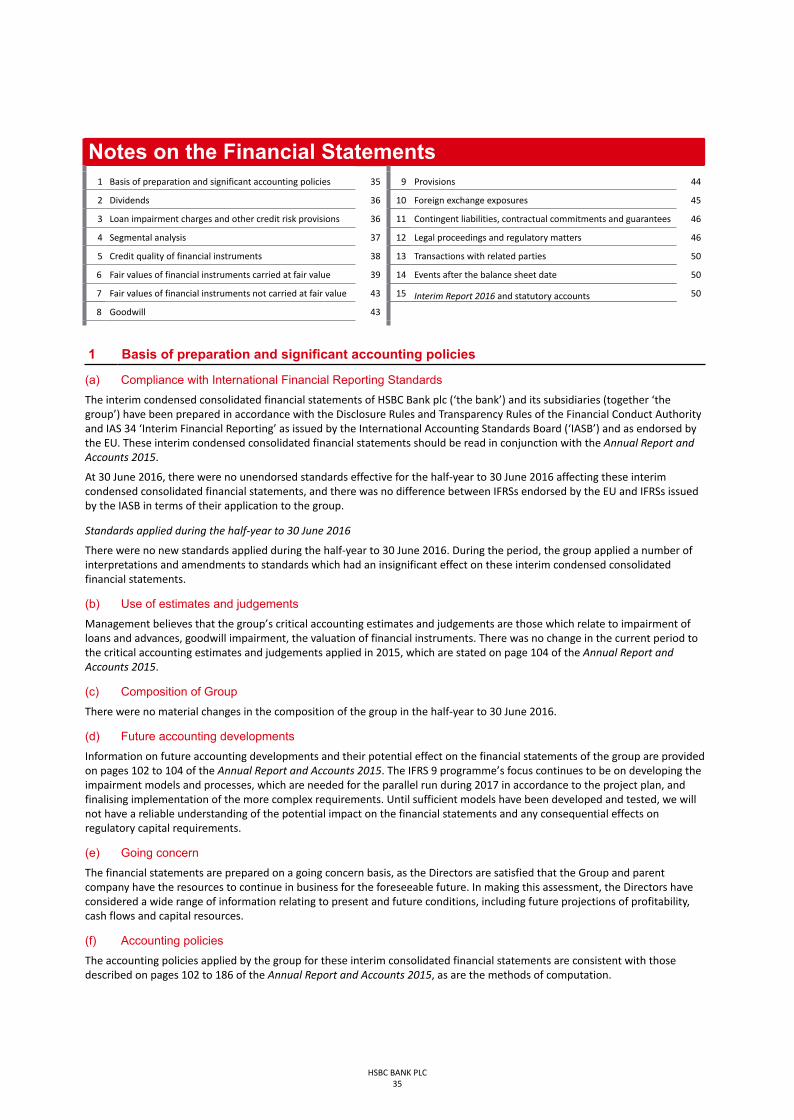
HSBC BANK PLC35
Notes on the Financial Statements1 Basis of preparation and significant accounting policies 35 9 Provisions 44
2 Dividends 36 10 Foreign exchange exposures 45
3 Loan impairment charges and other credit risk provisions 36 11 Contingent liabilities, contractual commitments and guarantees 46
4 Segmental analysis 37 12 Legal proceedings and regulatory matters 46
5 Credit quality of financial instruments 38 13 Transactions with related parties 50
6 Fair values of financial instruments carried at fair value 39 14 Events after the balance sheet date 50
7 Fair values of financial instruments not carried at fair value 43 15 Interim Report 2016 and statutory accounts 50
8 Goodwill 43
1 Basis of preparation and significant accounting policies
(a) Compliance with International Financial Reporting StandardsThe interim condensed consolidated financial statements of HSBC Bank plc (‘the bank’) and its subsidiaries (together ‘thegroup’) have been prepared in accordance with the Disclosure Rules and Transparency Rules of the Financial Conduct Authorityand IAS 34 ‘Interim Financial Reporting’ as issued by the International Accounting Standards Board (‘IASB’) and as endorsed bythe EU. These interim condensed consolidated financial statements should be read in conjunction with the Annual Report andAccounts 2015.
At 30 June 2016, there were no unendorsed standards effective for the half-year to 30 June 2016 affecting these interimcondensed consolidated financial statements, and there was no difference between IFRSs endorsed by the EU and IFRSs issuedby the IASB in terms of their application to the group.
Standards applied during the half-year to 30 June 2016
There were no new standards applied during the half-year to 30 June 2016. During the period, the group applied a number ofinterpretations and amendments to standards which had an insignificant effect on these interim condensed consolidatedfinancial statements.
(b) Use of estimates and judgementsManagement believes that the group’s critical accounting estimates and judgements are those which relate to impairment ofloans and advances, goodwill impairment, the valuation of financial instruments. There was no change in the current period tothe critical accounting estimates and judgements applied in 2015, which are stated on page 104 of the Annual Report andAccounts 2015.
(c) Composition of GroupThere were no material changes in the composition of the group in the half-year to 30 June 2016.
(d) Future accounting developments Information on future accounting developments and their potential effect on the financial statements of the group are providedon pages 102 to 104 of the Annual Report and Accounts 2015. The IFRS 9 programme’s focus continues to be on developing theimpairment models and processes, which are needed for the parallel run during 2017 in accordance to the project plan, andfinalising implementation of the more complex requirements. Until sufficient models have been developed and tested, we willnot have a reliable understanding of the potential impact on the financial statements and any consequential effects onregulatory capital requirements.
(e) Going concernThe financial statements are prepared on a going concern basis, as the Directors are satisfied that the Group and parentcompany have the resources to continue in business for the foreseeable future. In making this assessment, the Directors haveconsidered a wide range of information relating to present and future conditions, including future projections of profitability,cash flows and capital resources.
(f) Accounting policiesThe accounting policies applied by the group for these interim consolidated financial statements are consistent with thosedescribed on pages 102 to 186 of the Annual Report and Accounts 2015, as are the methods of computation.

2 Dividends
Dividends paid to shareholders of the parent company were as follows:
Dividends to shareholders of the parent company
Half-year to
30 Jun 2016 30 Jun 2015 31 Dec 2015
Per share Total
Per share Total
Per share Total
£ £m £ £m £ £m
Dividends paid on ordinary shares
– Second interim dividend in respect of 2014 — — 0.40 315 — —
– First interim dividend in respect of 2015 — — — — 0.67 540
– Second interim dividend in respect of 2015 0.34 272 — — — —
Total 0.34 272 0.40 315 0.67 540
Dividends on preference shares classified as equity An annual dividend of £1.23 per share, totalling £43m, on the HSBC Bank plc non-cumulative third dollar preference shares waspaid in the second half of 2015.
Total coupons on capital securities classified as equity
Half-year to
First call date
30 Jun2016
30 Jun2015
31 Dec2015
Total Total Total
£m £m £m
Undated Subordinated additional Tier 1 Instruments1
– £1,096m Dec 2019 31 31 31
– £1,100m Dec 2024 32 31 33
Total 63 62 64
1 Discretionary coupons are paid quarterly.
Notes on the Condensed Financial Statements (continued)
HSBC BANK PLC36
3 Loan impairment charges and other credit risk provisions
Half-year to
30 Jun2016
30 Jun2015
Loan impairment charges on loans and advances
– new allowances net of allowance releases 396 313
– recoveries of amounts previously written off (104) (99)
292 214
Impairment releases on debt securities and other credit risk provisions (12) (23)
280 191
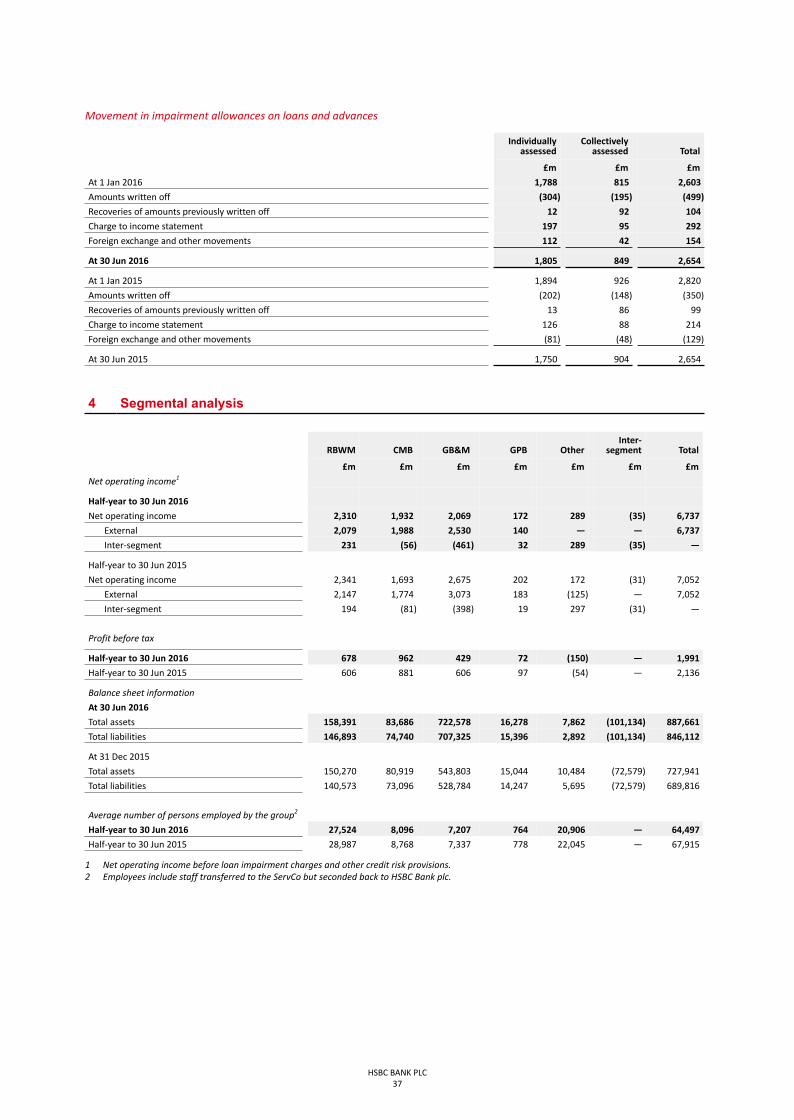
Movement in impairment allowances on loans and advances
Individuallyassessed
Collectivelyassessed Total
£m £m £m
At 1 Jan 2016 1,788 815 2,603
Amounts written off (304) (195) (499)
Recoveries of amounts previously written off 12 92 104
Charge to income statement 197 95 292
Foreign exchange and other movements 112 42 154
At 30 Jun 2016 1,805 849 2,654
At 1 Jan 2015 1,894 926 2,820
Amounts written off (202) (148) (350)
Recoveries of amounts previously written off 13 86 99
Charge to income statement 126 88 214
Foreign exchange and other movements (81) (48) (129)
At 30 Jun 2015 1,750 904 2,654
HSBC BANK PLC37
4 Segmental analysis
RBWM CMB GB&M GPB OtherInter-
segment Total
£m £m £m £m £m £m £m
Net operating income1
Half-year to 30 Jun 2016
Net operating income 2,310 1,932 2,069 172 289 (35) 6,737
External 2,079 1,988 2,530 140 — — 6,737
Inter-segment 231 (56) (461) 32 289 (35) —
Half-year to 30 Jun 2015
Net operating income 2,341 1,693 2,675 202 172 (31) 7,052
External 2,147 1,774 3,073 183 (125) — 7,052
Inter-segment 194 (81) (398) 19 297 (31) —
Profit before tax
Half-year to 30 Jun 2016 678 962 429 72 (150) — 1,991
Half-year to 30 Jun 2015 606 881 606 97 (54) — 2,136
Balance sheet information
At 30 Jun 2016
Total assets 158,391 83,686 722,578 16,278 7,862 (101,134) 887,661
Total liabilities 146,893 74,740 707,325 15,396 2,892 (101,134) 846,112
At 31 Dec 2015
Total assets 150,270 80,919 543,803 15,044 10,484 (72,579) 727,941
Total liabilities 140,573 73,096 528,784 14,247 5,695 (72,579) 689,816
Average number of persons employed by the group2
Half-year to 30 Jun 2016 27,524 8,096 7,207 764 20,906 — 64,497
Half-year to 30 Jun 2015 28,987 8,768 7,337 778 22,045 — 67,915
1 Net operating income before loan impairment charges and other credit risk provisions.2 Employees include staff transferred to the ServCo but seconded back to HSBC Bank plc.

5 Credit quality of financial instruments
The five credit quality classifications set out and defined on page 32 of the Annual Report and Accounts 2015 describe the creditquality of the group’s lending, debt securities portfolios and derivatives. These classifications each encompass a range of moregranular, internal credit rating grades assigned to wholesale and retail lending businesses, as well as the external ratingsattributed by external agencies to debt securities. There is no direct correlation between internal and external ratings atgranular level, except to the extent each falls within a single credit quality classification.
The following tables set out the group’s distribution of financial instruments by credit quality classification:
Distribution of total financial instruments exposed to credit risk by credit quality
Neither past due nor impaired
Strong
Medium Pastdue not
impaired Impaired
Totalgross
amountImpairmentallowances TotalGood Satisfactory
Sub-standard
£m £m £m £m £m £m £m £m £m
At 30 Jun 2016 632,349 99,613 83,548 8,337 1,354 7,433 832,634 (2,654) 829,980
At 31 Dec 2015 497,085 85,038 69,179 7,760 1,307 7,598 667,967 (2,603) 665,364
% % % % % % %
At 30 Jun 2016 75.9 12.0 10.0 1.0 0.2 0.9 100.0
At 31 Dec 2015 74.4 12.7 10.4 1.2 0.2 1.1 100.0
Distribution of loans and advances held at amortised cost by credit quality
Neither past due nor impaired
Strong
MediumPast
due notimpaired Impaired
Totalgross
amountImpairmentallowances TotalGood Satisfactory
Sub-standard
£m £m £m £m £m £m £m £m £m
At 30 Jun 2016
Loans and advances tocustomers 148,996 49,259 56,931 6,182 1,347 6,553 269,268 (2,654) 266,614
– personal 99,580 6,286 2,482 467 834 1,779 111,428 (643) 110,785
– corporate andcommercial 32,246 39,115 50,959 5,658 510 4,576 133,064 (1,852) 131,212
– non-banking financialinstitutions 17,170 3,858 3,490 57 3 198 24,776 (159) 24,617
Loans and advances to banks 17,711 1,831 1,488 83 — — 21,113 — 21,113
At 31 Dec 2015
Loans and advances tocustomers 149,911 45,236 52,595 5,693 1,302 6,372 261,109 (2,603) 258,506
– personal 96,569 6,271 2,043 466 778 1,641 107,768 (635) 107,133
– corporate andcommercial 34,993 35,442 48,287 5,138 514 4,538 128,912 (1,837) 127,075
– non-banking financialinstitutions 18,349 3,523 2,265 89 10 193 24,429 (131) 24,298
Loans and advances to banks 19,975 1,833 1,351 63 — — 23,222 — 23,222
Notes on the Condensed Financial Statements (continued)
HSBC BANK PLC38

6 Fair values of financial instruments carried at fair value
The accounting policies, control framework and the hierarchy used to determine fair values are consistent with those appliedfor the Annual Report and Accounts 2015.
Financial instruments carried at fair value and bases of valuation
Valuation techniques
Quotedmarket
price
Usingobservable
inputs
Withsignificant
unobservableinputs
Recurring fair value measurements Level 1 Level 2 Level 3 Total
At 30 Jun 2016 £m £m £m £m
Assets
Trading assets 67,962 71,943 2,451 142,356
Financial assets designated at fair value 6,999 337 1 7,337
Derivatives 626 235,960 2,320 238,906
Financial investments: available for sale 69,245 13,277 1,038 83,560
Liabilities
Trading liabilities 24,991 81,822 1,155 107,968
Financial liabilities designated at fair value 3,329 16,089 1 19,419
Derivatives 1,417 231,693 1,588 234,698
At 31 Dec 2015
Assets
Trading assets 67,879 40,264 2,442 110,585
Financial assets designated at fair value 6,516 311 2 6,829
Derivatives 549 164,778 1,458 166,785
Financial investments: available for sale 55,682 14,205 1,465 71,352
Liabilities
Trading liabilities 18,343 54,649 497 73,489
Financial liabilities designated at fair value 2,972 16,027 2 19,001
Derivatives 922 161,197 745 162,864
There were no transfers between Level 1 and Level 2 during the period (30 June 2015: nil). A portfolio of AFS debt securities,with a value of £978m and previously reported as Level 2, were reclassified as Level 1 at 30 June 2016.
Financial instruments measured at fair value using a valuation technique with significant unobservable inputs – Level 3
Assets Liabilities
Available forsale
Held fortrading
Designated atfair value
through profitor loss Derivatives
Held fortrading
Designated atfair value
through profitor loss Derivatives
£m £m £m £m £m £m £m
Private equity investments 432 37 — — 36 — —
Asset-backed securities 579 428 — — — — —
Structured notes — 3 — — 1,119 — —
Derivatives — — — 2,320 — — 1,588
Other portfolios 27 1,983 1 — — 1 —
At 30 Jun 2016 1,038 2,451 1 2,320 1,155 1 1,588
Private equity investments 737 24 — — 24 — —
Asset-backed securities 706 250 — — — — —
Structured notes — 3 — — 473 — —
Derivatives — — — 1,458 — — 745
Other portfolios 22 2,165 2 — — 2 —
At 31 Dec 2015 1,465 2,442 2 1,458 497 2 745
HSBC BANK PLC39

Reconciliation of fair value measurements in Level 3 of the fair value hierarchy
Assets Liabilities
Availablefor sale
Held fortrading
Designatedat fairvalue
throughprofit or
loss DerivativesHeld fortrading
Designatedat fairvalue
throughprofit or
loss Derivatives
£m £m £m £m £m £m £m
At 1 Jan 2016 1,465 2,442 2 1,458 497 2 745
Total gains recognised in profit or loss — 100 — 978 196 — 845
– trading income excluding netinterest income — 100 — 978 196 — 845
– gains less losses from financialinvestments — — — — — — —
Total gains or losses recognised in othercomprehensive income 173 21 — 30 25 — 3
– available-for-sale investments: fairvalue gains 120 — — — — — —
– exchange differences 53 21 — 30 25 — 3
Purchases 83 49 — — — — —
Issues — — — — 619 — —
Sales (487) (731) (1) — (11) (1) —
Settlements (25) (10) — (69) (98) — (147)
Transfer out (398) (25) — (83) (74) — (82)
Transfer in 227 605 — 6 1 — 224
At 30 Jun 2016 1,038 2,451 1 2,320 1,155 1 1,588
Unrealised gains recognised in profit orloss relating to assets and liabilitiesheld at 30 June 2016 2 25 — 829 163 — 165
– trading income excluding netinterest income — 25 — 829 163 — 165
– net income from other financialinstruments designated at fairvalue — — — — — — —
– loan impairment charges andother credit risk provisions 2 — — — — — —
At 1 Jan 2015 1,546 2,153 5 1,614 1,293 5 1,221
Total (losses)/gains recognised in profitor loss (5) (16) — 275 (77) — (331)
– trading income excluding netinterest income — (16) — 275 (77) — (331)
– gains less losses from financialinvestments (5) — — — — — —
Total gains/(losses) recognised in othercomprehensive income 37 (14) — (19) (5) — (3)
– available-for-sale investments: fairvalue gains 43 — — — — — —
– exchange differences (6) (14) — (19) (5) — (3)
Purchases 123 10 — — — — —
Issues — — — — 8 — —
Sales (173) (738) (2) — (7) (2) —
Settlements (10) (39) — 3 (151) — 13
Transfer out (682) (18) — (32) (128) — (21)
Transfer in 205 326 — 39 36 — 11
At 30 Jun 2015 1,041 1,664 3 1,880 969 3 890
Unrealised (losses)/gains recognised inprofit or loss relating to assets andliabilities held at 30 Jun 2015 (10) (6) (1) 307 (52) (1) (249)
– trading income excluding netinterest income — (6) — 307 (52) — (249)
– net (expense) from other financialinstruments designated at fairvalue — — (1) — — (1) —
– loan impairment charges andother credit risk provisions (10) — — — — — —
Notes on the Condensed Financial Statements (continued)
HSBC BANK PLC40

Effect of changes in significant unobservable assumptions to reasonably possible alternativesThe following tables show the sensitivity of Level 3 fair values to reasonably possible alternative assumptions:
By accounting classification
Reflected in profit or loss
Reflected in othercomprehensive income
Favourablechanges
Unfavourablechanges
Favourablechanges
Unfavourablechanges
£m £m £m £m
Derivatives, trading assets and trading liabilities1 121 (132) — —
Financial assets and liabilities designated at fair value 10 (10) — —
Financial investments: available for sale 11 (3) 66 (66)
At 30 Jun 2016 142 (145) 66 (66)
Derivatives, trading assets and trading liabilities1 98 (82) — —
Financial assets and liabilities designated at fair value — (1) — —
Financial investments: available for sale 7 (4) 86 (86)
At 31 Dec 2015 105 (87) 86 (86)
1 Derivatives, trading assets and trading liabilities are presented as one category to reflect the manner in which these financial instruments arerisk‑managed.
By Level 3 instrument type
Reflected inprofit or loss
Reflected inother comprehensive income
Favourablechanges
Unfavourablechanges
Favourablechanges
Unfavourablechanges
£m £m £m £m
Private equity including strategic investments 6 (6) 31 (31)
Asset-backed securities 15 (6) 35 (35)
Structured notes 6 (6) — —
Derivatives 79 (89) — —
Other portfolios 36 (38) — —
At 30 Jun 2016 142 (145) 66 (66)
Private equity including strategic investments 4 (4) 52 (52)
Asset-backed securities 8 (3) 34 (34)
Structured notes 7 (7) — —
Derivatives 13 (13) — —
Other portfolios 73 (60) — —
At 31 Dec 2015 105 (87) 86 (86)
Key unobservable inputs to Level 3 financial instruments and inter-relationships When the fair value of a financial instrument is affected by more than one unobservable assumption, the above table reflectsthe most favourable or most unfavourable change from varying the assumptions individually.
Key unobservable inputs to Level 3 financial instruments The table below lists key unobservable inputs to Level 3 financial instruments, and provides the range of those inputs as at30 June 2016. The categories of key unobservable inputs are described further on pages 135 to 136 of the Annual Report andAccounts 2015.
HSBC BANK PLC41
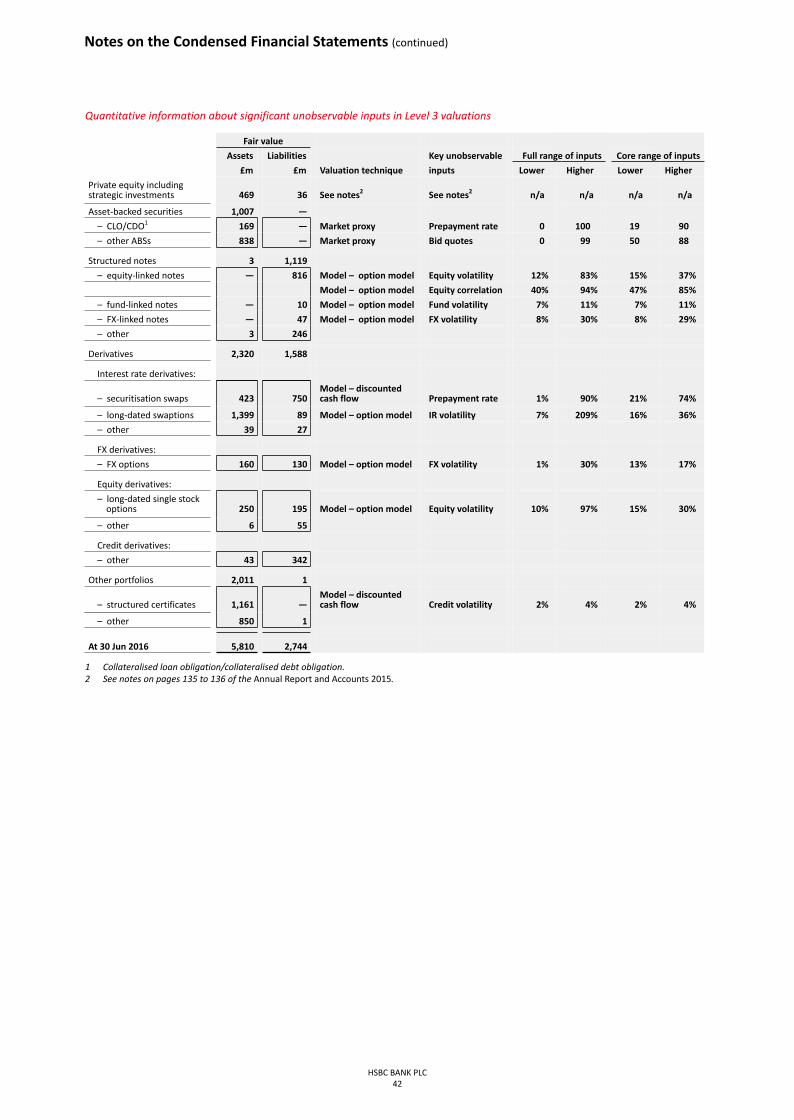
Quantitative information about significant unobservable inputs in Level 3 valuations
Fair value
Assets Liabilities Key unobservable Full range of inputs Core range of inputs
£m £m Valuation technique inputs Lower Higher Lower Higher
Private equity includingstrategic investments 469 36 See notes2 See notes2 n/a n/a n/a n/a
Asset-backed securities 1,007 —
– CLO/CDO1 169 — Market proxy Prepayment rate 0 100 19 90
– other ABSs 838 — Market proxy Bid quotes 0 99 50 88
Structured notes 3 1,119
– equity-linked notes — 816 Model – option model Equity volatility 12% 83% 15% 37%
Model – option model Equity correlation 40% 94% 47% 85%
– fund-linked notes — 10 Model – option model Fund volatility 7% 11% 7% 11%
– FX-linked notes — 47 Model – option model FX volatility 8% 30% 8% 29%
– other 3 246
Derivatives 2,320 1,588
Interest rate derivatives:
– securitisation swaps 423 750Model – discounted cash flow Prepayment rate 1% 90% 21% 74%
– long-dated swaptions 1,399 89 Model – option model IR volatility 7% 209% 16% 36%
– other 39 27
FX derivatives:
– FX options 160 130 Model – option model FX volatility 1% 30% 13% 17%
Equity derivatives:
– long-dated single stockoptions 250 195 Model – option model Equity volatility 10% 97% 15% 30%
– other 6 55
Credit derivatives:
– other 43 342
Other portfolios 2,011 1
– structured certificates 1,161 —Model – discounted cash flow Credit volatility 2% 4% 2% 4%
– other 850 1
At 30 Jun 2016 5,810 2,744
1 Collateralised loan obligation/collateralised debt obligation.2 See notes on pages 135 to 136 of the Annual Report and Accounts 2015.
Notes on the Condensed Financial Statements (continued)
HSBC BANK PLC42

7 Fair values of financial instruments not carried at fair value
The basis for measuring the fair values of loans and advances to banks and customers, financial investments, deposits by banks,customer accounts, debt securities in issue and subordinated liabilities is explained on page 138 of the Annual Report andAccounts 2015.
Fair values of financial instruments which are not carried at fair value on the balance sheet
At
30 Jun 2016
31 Dec2015
Carryingamount
Fairvalue
CarryingAmount
Fairvalue
£m £m £m £m
Assets
Loans and advances to banks 21,113 21,113 23,222 23,222
Loans and advances to customers 266,614 266,969 258,506 258,743
Reverse repurchase agreements – non-trading 47,164 47,164 30,537 30,537
Financial investments: debt securities 1 1 — —
Liabilities
Deposits by banks 28,986 28,986 24,202 24,202
Customer accounts 363,651 363,690 332,830 332,875
Repurchase agreements – non-trading 27,408 27,408 17,000 17,000
Debt securities in issue 25,215 25,215 26,069 26,067
Subordinated liabilities 9,111 8,979 8,527 8,251
The fair values in this note are stated at a specific date and may be significantly different from the amounts which will actuallybe paid on the maturity or settlement dates of the instruments. In many cases, it would not be possible to realise immediatelythe estimated fair values given the size of the portfolios measured. Accordingly, these fair values do not represent the value ofthese financial instruments to the group as a going concern.
HSBC BANK PLC43
8 Goodwill
Impairment testingAs described on page 149 of the Annual Report and Accounts 2015, goodwill is tested for impairment at 1 July each year andwhenever there is an indication that goodwill may be impaired. At 30 June 2016, we reviewed the inputs used in our mostrecent impairment test in the light of current economic and market conditions, and identified an indicator of impairment forthe one cash-generating unit (‘CGU’) disclosed as sensitive in the Annual Report and Accounts 2015.
The indicator related to the perceived increase in the cost of equity for UK and European banks following the UK electorate’svote to leave the EU. As a result, an impairment test was performed for Global Banking and Markets at 30 June 2016. The keyassumptions and result of this test are included in the disclosure below. There were no indicators of impairment in respect ofthe other CGUs.
The discount rate used for Global Banking and Markets includes a 100 basis point uplift to reflect the increased risk in Europeanmarkets following the UK’s referendum on membership of the EU. Given the proximity of the referendum to the end of thereporting period, and the subsequent market volatility, the adjustment represents management’s judgement based on thelatest available information, including the latest broker reports. Furthermore, the test was based on recently updated internalforecasts, which include a preliminary assessment of the impact of the referendum result. All of these factors could impact onthe headroom of this CGU in the future.
Key assumptions in the VIU calculation
Goodwill at 30 Jun 2016 Discount rate
Nominal growth ratebeyond initial cash
flow projections
Cash-generating unit £m % %
Global Banking and Markets 2,099 10.7 3.8
Sensitivities of key assumptions in calculating VIUAt 30 June 2016, Global Banking and Markets was not impaired, but was sensitive to reasonably possible changes in the keyassumptions supporting the recoverable amount. In making an estimate of reasonably possible changes to assumptions,management considers the available evidence in respect of each input to the model. These include the external range ofobservable discount rates, historical performance against forecast, and risks attaching to the key assumptions underlying cashflow projections.
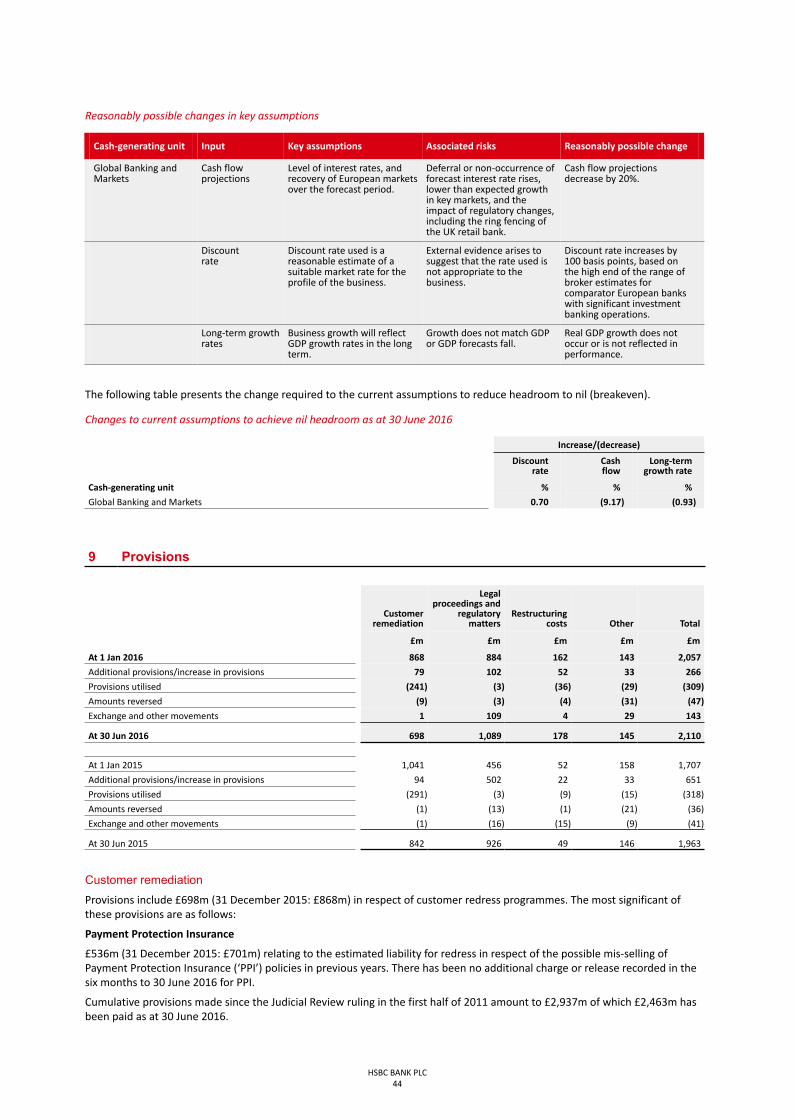
Reasonably possible changes in key assumptions
Cash-generating unit Input Key assumptions Associated risks Reasonably possible change
Global Banking andMarkets
Cash flowprojections
Level of interest rates, and recovery of European marketsover the forecast period.
Deferral or non-occurrence offorecast interest rate rises,lower than expected growthin key markets, and theimpact of regulatory changes,including the ring fencing ofthe UK retail bank.
Cash flow projectionsdecrease by 20%.
Discount rate
Discount rate used is areasonable estimate of asuitable market rate for theprofile of the business.
External evidence arises tosuggest that the rate used isnot appropriate to thebusiness.
Discount rate increases by100 basis points, based onthe high end of the range ofbroker estimates forcomparator European bankswith significant investmentbanking operations.
Long-term growthrates
Business growth will reflectGDP growth rates in the longterm.
Growth does not match GDPor GDP forecasts fall.
Real GDP growth does notoccur or is not reflected inperformance.
The following table presents the change required to the current assumptions to reduce headroom to nil (breakeven).
Changes to current assumptions to achieve nil headroom as at 30 June 2016
Increase/(decrease)
Discount rate
Cash flow
Long-termgrowth rate
Cash-generating unit % % %
Global Banking and Markets 0.70 (9.17) (0.93)
HSBC BANK PLC44
9 Provisions
Customerremediation
Legalproceedings and
regulatorymatters
Restructuringcosts Other Total
£m £m £m £m £m
At 1 Jan 2016 868 884 162 143 2,057
Additional provisions/increase in provisions 79 102 52 33 266
Provisions utilised (241) (3) (36) (29) (309)
Amounts reversed (9) (3) (4) (31) (47)
Exchange and other movements 1 109 4 29 143
At 30 Jun 2016 698 1,089 178 145 2,110
At 1 Jan 2015 1,041 456 52 158 1,707
Additional provisions/increase in provisions 94 502 22 33 651
Provisions utilised (291) (3) (9) (15) (318)
Amounts reversed (1) (13) (1) (21) (36)
Exchange and other movements (1) (16) (15) (9) (41)
At 30 Jun 2015 842 926 49 146 1,963
Customer remediationProvisions include £698m (31 December 2015: £868m) in respect of customer redress programmes. The most significant ofthese provisions are as follows:
Payment Protection Insurance
£536m (31 December 2015: £701m) relating to the estimated liability for redress in respect of the possible mis-selling ofPayment Protection Insurance (‘PPI’) policies in previous years. There has been no additional charge or release recorded in thesix months to 30 June 2016 for PPI.
Cumulative provisions made since the Judicial Review ruling in the first half of 2011 amount to £2,937m of which £2,463m hasbeen paid as at 30 June 2016.
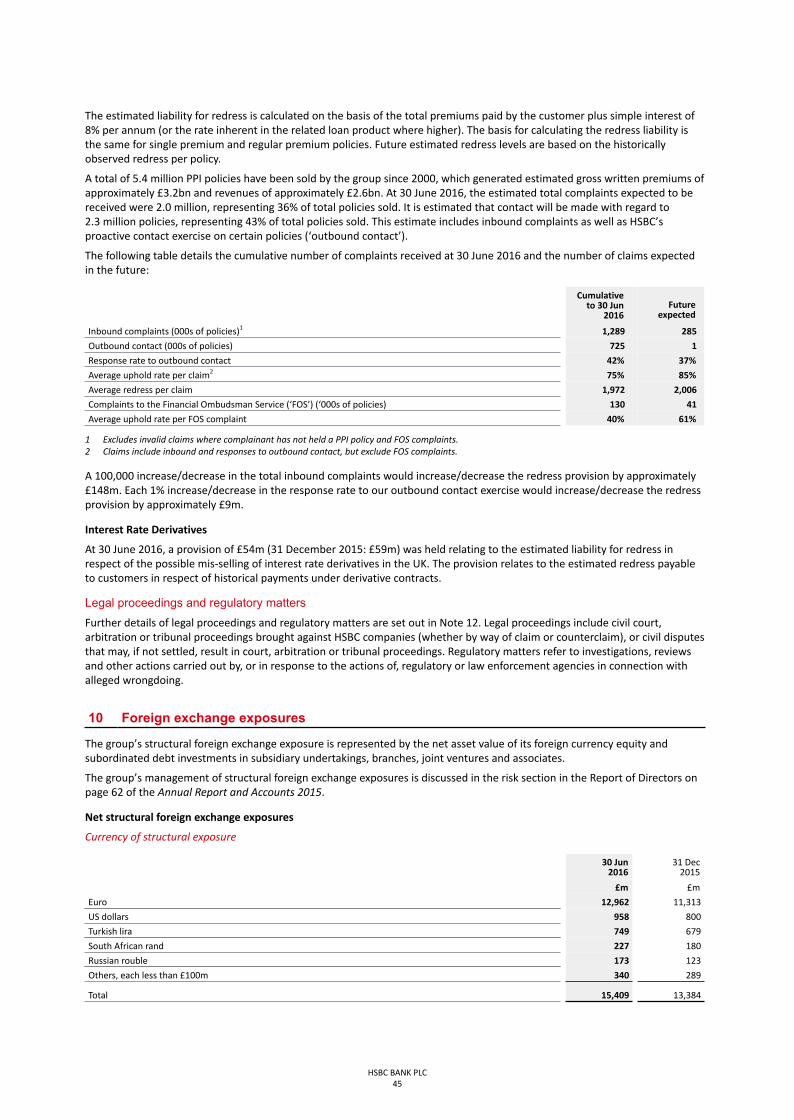
The estimated liability for redress is calculated on the basis of the total premiums paid by the customer plus simple interest of8% per annum (or the rate inherent in the related loan product where higher). The basis for calculating the redress liability isthe same for single premium and regular premium policies. Future estimated redress levels are based on the historicallyobserved redress per policy.
A total of 5.4 million PPI policies have been sold by the group since 2000, which generated estimated gross written premiums ofapproximately £3.2bn and revenues of approximately £2.6bn. At 30 June 2016, the estimated total complaints expected to bereceived were 2.0 million, representing 36% of total policies sold. It is estimated that contact will be made with regard to2.3 million policies, representing 43% of total policies sold. This estimate includes inbound complaints as well as HSBC’sproactive contact exercise on certain policies (‘outbound contact’).
The following table details the cumulative number of complaints received at 30 June 2016 and the number of claims expectedin the future:
Cumulativeto 30 Jun
2016Future
expected
Inbound complaints (000s of policies)1 1,289 285
Outbound contact (000s of policies) 725 1
Response rate to outbound contact 42% 37%
Average uphold rate per claim2 75% 85%
Average redress per claim 1,972 2,006
Complaints to the Financial Ombudsman Service (‘FOS’) (‘000s of policies) 130 41
Average uphold rate per FOS complaint 40% 61%
1 Excludes invalid claims where complainant has not held a PPI policy and FOS complaints.2 Claims include inbound and responses to outbound contact, but exclude FOS complaints.
A 100,000 increase/decrease in the total inbound complaints would increase/decrease the redress provision by approximately£148m. Each 1% increase/decrease in the response rate to our outbound contact exercise would increase/decrease the redressprovision by approximately £9m.
Interest Rate Derivatives
At 30 June 2016, a provision of £54m (31 December 2015: £59m) was held relating to the estimated liability for redress inrespect of the possible mis-selling of interest rate derivatives in the UK. The provision relates to the estimated redress payableto customers in respect of historical payments under derivative contracts.
Legal proceedings and regulatory mattersFurther details of legal proceedings and regulatory matters are set out in Note 12. Legal proceedings include civil court,arbitration or tribunal proceedings brought against HSBC companies (whether by way of claim or counterclaim), or civil disputesthat may, if not settled, result in court, arbitration or tribunal proceedings. Regulatory matters refer to investigations, reviewsand other actions carried out by, or in response to the actions of, regulatory or law enforcement agencies in connection withalleged wrongdoing.
HSBC BANK PLC45
10 Foreign exchange exposures
The group’s structural foreign exchange exposure is represented by the net asset value of its foreign currency equity andsubordinated debt investments in subsidiary undertakings, branches, joint ventures and associates.
The group’s management of structural foreign exchange exposures is discussed in the risk section in the Report of Directors onpage 62 of the Annual Report and Accounts 2015.
Net structural foreign exchange exposures
Currency of structural exposure
30 Jun2016
31 Dec2015
£m £m
Euro 12,962 11,313
US dollars 958 800
Turkish lira 749 679
South African rand 227 180
Russian rouble 173 123
Others, each less than £100m 340 289
Total 15,409 13,384

11 Contingent liabilities, contractual commitments and guarantees
30 Jun2016
31 Dec2015
£m £m
Guarantees and contingent liabilities
Guarantees 19,422 18,196
Other contingent liabilities 252 210
19,674 18,406
Commitments
Documentary credits and short-term trade-related transactions 3,092 2,898
Forward asset purchases and forward deposits placed 343 216
Undrawn formal standby facilities, credit lines and other commitments to lend 135,757 128,519
139,192 131,633
The above table discloses the nominal principal amounts of commitments, guarantees and other contingent liabilities.Contingent liabilities arising from legal proceedings, regulatory and other matters against the group are disclosed in Note 12.Nominal principal amounts represent the amounts at risk should contracts be fully drawn upon and clients default. As asignificant proportion of guarantees and commitments are expected to expire without being drawn upon, the total of thenominal principal amounts is not indicative of future liquidity requirements.
Capital commitmentsIn addition to the commitments disclosed above, at 30 June 2016 the group had £7m (31 December 2015: £17m) of capitalcommitments contracted but not provided for and £24m (31 December 2015: £26m) of capital commitments authorised butnot contracted for.
Notes on the Condensed Financial Statements (continued)
HSBC BANK PLC46
12 Legal proceedings and regulatory matters
The group is party to legal proceedings and regulatory matters in a number of jurisdictions arising out of its normal businessoperations. Apart from the matters described below, the group considers that none of these matters are material. Therecognition of provisions is determined in accordance with the accounting policies set out in Note 27 of the Annual Report andAccounts 2015. While the outcome of legal proceedings and regulatory matters is inherently uncertain, management believesthat, based on the information available to it, appropriate provisions have been made in respect of these matters as at 30 June2016 (see Note 9). Where an individual provision is material, the fact that a provision has been made is stated and quantified,except to the extent doing so would be seriously prejudicial. Any provision recognised does not constitute an admission ofwrongdoing or legal liability. It is not practicable to provide an aggregate estimate of potential liability for our legal proceedingsand regulatory matters as a class of contingent liabilities.
Bernard L. Madoff Investment Securities LLCBernard L. Madoff (‘Madoff’) was arrested in December 2008 and later pleaded guilty to running a Ponzi scheme. His firm,Bernard L. Madoff Investment Securities LLC (‘Madoff Securities’), is being liquidated in the US by a trustee (the ‘Trustee’).
Various non-US HSBC companies provided custodial, administration and similar services to a number of funds incorporatedoutside the US whose assets were invested with Madoff Securities. Based on information provided by Madoff Securities, as at30 November 2008, the purported aggregate value of these funds was US$8.4bn, including fictitious profits reported by Madoff.Based on information available to HSBC, we have estimated that the funds’ actual transfers to Madoff Securities minus theiractual withdrawals from Madoff Securities during the time HSBC serviced the funds totalled approximately US$4bn. VariousHSBC companies have been named as defendants in lawsuits arising out of Madoff Securities’ fraud.
US/UK litigation: The Trustee has brought lawsuits against various HSBC companies in the US Bankruptcy Court and in theEnglish High Court, seeking recovery of transfers from Madoff Securities to HSBC in an amount not yet pleaded or determined.HSBC and other parties to the action have moved to dismiss the Trustee’s US actions. The deadline by which the Trustee mustserve HSBC with his English action has been extended to the end of the third quarter of 2016.
Alpha Prime Fund Ltd (‘Alpha Prime’) and Senator Fund SPC (‘Senator’), co-defendants in one of the Trustee’s US actions, haveeach brought cross-claims against certain HSBC defendants. HSBC has moved to dismiss those cross-claims.
Fairfield Sentry Limited, Fairfield Sigma Limited and Fairfield Lambda Limited (together, ‘Fairfield’) (in liquidation since July2009) have brought lawsuits in the US and the British Virgin Islands (‘BVI’) against fund shareholders, including HSBC companiesthat acted as nominees for clients, seeking restitution of redemption payments. Fairfield’s US actions are stayed pending theoutcome of the action in the BVI (see below).
In December 2014, three additional actions were filed in the US. A purported class of direct investors in Madoff Securitiesasserted common law claims against various HSBC companies in the United States District Court for the Southern District ofNew York (the ‘New York District Court’). Two investors in Hermes International Fund Limited (‘Hermes’) also asserted commonlaw claims against various HSBC companies in the New York District Court. HSBC has moved to dismiss both actions. In addition,
SPV Optimal SUS Ltd (‘SPV OSUS’), the purported assignee of the Madoff-invested company, Optimal Strategic US Equity Ltd,filed a lawsuit in New York state court against various HSBC companies and others, seeking damages on various alleged groundsincluding breach of fiduciary duty and breach of trust.
BVI litigation: Beginning in October 2009, liquidators for Fairfield (‘Fairfield Liquidators’) commenced lawsuits against fundshareholders, including HSBC companies that acted as nominees for clients, seeking recovery of redemption payments. InMarch 2016, the BVI court denied a motion brought by certain non-HSBC defendants challenging the Fairfield Liquidators’authorisation to pursue their US claims, which those defendants have appealed.
Cayman Islands litigation: In February 2013, Primeo Fund Limited (‘Primeo’) (in liquidation since April 2009) brought an actionagainst HSBC Securities Services Luxembourg (‘HSSL’) and The Bank of Bermuda (Cayman), alleging breach of contract andbreach of fiduciary duty, and claiming damages and equitable compensation. Trial is scheduled to begin in November 2016.
Luxembourg litigation: In April 2009, Herald Fund SPC (‘Herald’) (in liquidation since July 2013) brought an action against HSSLbefore the Luxembourg District Court, seeking restitution of cash and securities Herald purportedly lost because of MadoffSecurities’ fraud, or money damages. The Luxembourg District Court dismissed Herald’s securities restitution claim, butreserved Herald’s cash restitution claim and its claim for money damages. Herald has appealed this judgement.
In March 2010, Herald (Lux) SICAV (‘Herald (Lux)’) (in liquidation since April 2009) brought an action against HSSL before theLuxembourg District Court, seeking restitution of securities, or the cash equivalent, or money damages. Herald (Lux) has alsorequested the restitution of fees paid to HSSL.
Alpha Prime and Senator have each brought an action against HSSL before the Luxembourg District Court, seeking therestitution of securities, or the cash equivalent, or money damages. Both matters have been temporarily suspended at therequest of Alpha Prime and Senator, respectively. In April 2015, Senator commenced an action against the Luxembourg branchof HSBC Bank plc asserting identical claims before the Luxembourg District Court.
HSSL has also been named as a defendant in various actions by shareholders in Primeo Select Fund, Herald, Herald (Lux), andHermes. Most of these actions have been dismissed, suspended or postponed.
Ireland litigation: In November 2013, Defender Limited brought an action against HSBC Institutional Trust Services (Ireland)Limited (‘HTIE’) and others, alleging breach of contract and claiming damages and indemnification for fund losses. A trial datehas not yet been scheduled.
In May 2016, following a hearing on two preliminary issues, HTIE was successful in obtaining an order dismissing two remainingclaims by purported shareholders in Thema International Fund plc.
SPV OSUS’s action against HTIE and HSBC Securities Services (Ireland) Limited alleging breach of contract and claiming damagesand indemnification for fund losses was dismissed in October 2015. SPV OSUS’s appeal is scheduled for hearing in January 2017.
There are many factors that may affect the range of possible outcomes, and the resulting financial impact, of the variousMadoff-related proceedings described above, including but not limited to the multiple jurisdictions in which the proceedingshave been brought. Based upon the information currently available, management’s estimate of possible aggregate damagesthat might arise as a result of all claims in the various Madoff-related proceedings is up to or exceeding US$800m, excludingcosts and interest. Due to uncertainties and limitations of this estimate, the ultimate damages could differ significantly from thisamount.
Anti-money laundering and sanctions-related mattersIn October 2010, HSBC Bank USA N.A. (‘HSBC Bank USA’) entered into a consent order with the Office of the Comptroller of theCurrency (‘OCC’), and HSBC North America Holdings (‘HNAH’) entered into a consent order with the Federal Reserve Bureau(‘FRB’) (each an ‘Order’ and together, the ‘Orders’). These Orders required improvements to establish an effective compliancerisk management programme across HSBC’s US businesses, including risk management related to the Bank Secrecy Act (‘BSA’)and anti-money laundering (‘AML’) AML compliance. HSBC Bank USA is not currently in compliance with the OCC Order. Stepsare being taken to address the requirements of the Orders.
In December 2012, HSBC Holdings plc (‘HSBC Holdings’), HNAH and HSBC Bank USA entered into agreements with US and UKgovernment agencies regarding past inadequate compliance with the BSA, AML and sanctions laws. Among those agreements,HSBC Holdings and HSBC Bank USA entered into a five-year deferred prosecution agreement with, among others, the USDepartment of Justice (‘DoJ’) (the ‘US DPA’); and HSBC Holdings consented to a cease-and-desist order, and HSBC Holdings andHNAH consented to a civil money penalty order with the FRB. HSBC Holdings also entered into an agreement with the Office ofForeign Assets Control (‘OFAC’) regarding historical transactions involving parties subject to OFAC sanctions, as well as anundertaking with the UK Financial Conduct Authority (the ‘FCA’), to comply with certain forward-looking AML and sanctions-related obligations. In addition, HSBC Bank USA entered into civil money penalty orders with the Financial Crimes EnforcementNetwork of the US Treasury Department and the OCC.
Under these agreements, HSBC Holdings and HSBC Bank USA made payments totalling US$1.9bn to US authorities andundertook various further obligations, including, among others, to continue to cooperate fully with the DoJ in any and allinvestigations, not to commit any crime under US federal law subsequent to the signing of the agreement, and to retain anindependent compliance monitor (the ‘Monitor’). In January 2016, the Monitor delivered his second annual follow-up reviewreport. Through his country-level reviews, the Monitor identified potential anti-money laundering and sanctionscompliance issues that the DoJ and HSBC are reviewing further. Additionally, as discussed elsewhere in this Note, HSBC is thesubject of other ongoing investigations and reviews by the DoJ. The potential consequences of breaching the US DPA, as well as
HSBC BANK PLC47

the role of the Monitor and his second annual review, are discussed on pages 20 and 23 of the Annual Report and Accounts2015.
HSBC Bank USA also entered into two consent orders with the OCC. These required HSBC Bank USA to correct thecircumstances noted in the OCC’s report and to adopt an enterprise-wide compliance programme, and imposed restrictions onacquiring control of, or holding an interest in, any new financial subsidiary, or commencing a new activity in its existing financialsubsidiary, without the OCC’s prior approval.
These settlements with US and UK authorities have led to private litigation, and do not preclude further private litigationrelated to HSBC’s compliance with applicable BSA, AML and sanctions laws or other regulatory or law enforcement actions forBSA, AML, sanctions or other matters not covered by the various agreements.
In November 2014, a complaint was filed in the US District Court for the Eastern District of New York on behalf ofrepresentatives of US persons alleged to have been killed or injured in Iraq between April 2004 and November 2011. Thecomplaint was filed against HSBC Holdings, HSBC Bank plc, HSBC Bank USA and HSBC Bank Middle East, as well as other non-HSBC banks and the Islamic Republic of Iran. The plaintiffs allege that defendants violated the US Anti-Terrorism Act (‘US ATA’)by altering or falsifying payment messages involving Iran, Iranian parties and Iranian banks for transactions processed throughthe US. Defendants filed a motion to dismiss in May 2015.
Based on the facts currently known, it is not practicable at this time for HSBC to predict the resolution of this lawsuit, includingthe timing or any possible impact on HSBC, which could be significant.
Mossack Fonseca & Co.HSBC has received requests for information from various regulatory and law enforcement authorities around the worldconcerning persons and entities believed to be linked to Mossack Fonseca & Co., a service provider of personal investmentcompanies. HSBC is cooperating with the relevant authorities.
Based on the facts currently known, it is not practicable at this time for HSBC to predict the resolution of this matter, includingthe timing or any possible impact on HSBC, which could be significant.
London interbank offered rates, European interbank offered rates and other benchmark interest rate investigationsand litigationVarious regulators and competition and law enforcement authorities around the world, including in the UK, the US, the EU andSwitzerland, are conducting investigations and reviews related to certain past submissions made by panel banks and theprocesses for making submissions in connection with the setting of London interbank offered rates (‘Libor’), Europeaninterbank offered rates (‘Euribor’) and other benchmark interest rates. As certain HSBC companies are members of such panels,HSBC has been the subject of regulatory demands for information and is cooperating with those investigations and reviews.
In May 2014, HSBC received a Statement of Objections from the European Commission (the ‘Commission’), alleging anti-competitive practices in connection with the pricing of euro interest rate derivatives. The Statement of Objections setsout the Commission’s preliminary views and does not prejudge the final outcome of its investigation. HSBC responded tothe Commission’s Statement of Objections in March 2015, and a hearing before the Commission took place in June 2015. Adecision by the Commission is pending.
US dollar Libor: Beginning in 2011, HSBC and other panel banks have been named as defendants in a number of privatelawsuits filed in the US with respect to the setting of US dollar Libor. The complaints assert claims under various US laws,including US antitrust and racketeering laws, the US Commodity Exchange Act (‘US CEA’), and state law. The lawsuits includeindividual and putative class actions, most of which have been transferred and/or consolidated for pre-trial purposes before theNew York District Court.
The New York District Court has issued decisions dismissing certain of the claims in response to motions filed by the defendants.Those decisions resulted in the dismissal of the plaintiffs’ federal and state antitrust claims, racketeering claims, and unjustenrichment claims. Dismissal of certain of these claims was appealed to the US Court of Appeals for the Second Circuit, whichreversed the New York District Court’s dismissal of plaintiffs’ antitrust claims in May 2016.
Euroyen Tokyo interbank offered rate (‘Tibor’) and/or Japanese yen Libor: In April 2012 and July 2015, HSBC and other panelbanks were named as defendants in putative class actions filed in the New York District Court on behalf of persons whotransacted in financial instruments allegedly related to the euroyen Tibor and/or Japanese yen Libor. The complaints allege,among other things, misconduct related to euroyen Tibor, although HSBC is not a member of the Japanese BankersAssociation’s euroyen Tibor panel, as well as Japanese yen Libor, in violation of US antitrust laws, the US CEA, and state law. InMay 2016, HSBC reached an agreement in principle with plaintiffs to resolve both of these actions, subject to court approval.The court granted preliminary approval of the settlement in June 2016, and HSBC made payment of the agreed settlementamount into an escrow account. The final settlement approval hearing is scheduled for November 2016.
Euribor: In November 2013, HSBC and other panel banks were named as defendants in a putative class action filed in the NewYork District Court on behalf of persons who transacted in euro futures contracts and other financial instruments allegedlyrelated to Euribor. The complaint alleges, among other things, misconduct related to Euribor in violation of US antitrust laws,the US CEA and state law. In May 2016, HSBC reached an agreement in principle with plaintiffs to resolve this action, subject tocourt approval.
Singapore Interbank Offered Rate (‘SIBOR’) and/or Singapore Swap Offer Rate (‘SOR’): In July 2016, HSBC and other panelbanks were named as defendants in a putative class action filed in the New York District Court on behalf of persons who
Notes on the Condensed Financial Statements (continued)
HSBC BANK PLC48

transacted in products related to SIBOR and/or SOR. The complaint alleges, among other things, misconduct related to SIBORand/or SOR in violation of US antitrust and racketeering laws, and state law. This matter is at an early stage.
US dollar International Swaps and Derivatives Association fix (‘ISDAfix’): In September 2014, HSBC and other panel bankswere named as defendants in a number of putative class actions consolidated in the New York District Court on behalf ofpersons who transacted in interest rate derivatives or purchased or sold financial instruments that were either tied to ISDAfixrates or were executed shortly before, during, or after the time of the daily ISDAfix setting window. The consolidated complaintalleges, among other things, misconduct related to these activities in violation of US antitrust laws, the US CEA and state law.HSBC’s motion to dismiss the complaint was denied in March 2016.
There are many factors that may affect the range of outcomes, and the resulting financial impact, of these matters, which couldbe significant.
Foreign exchange rate investigations and litigationVarious regulators and competition and law enforcement authorities around the world, including in the US, the EU, Brazil andSouth Korea, are conducting investigations and reviews into trading by HSBC and others on the foreign exchange markets. HSBCis cooperating with these investigations and reviews.
In May 2015, the DoJ resolved its investigations with respect to five non-HSBC financial institutions, four of whom agreed toplead guilty to criminal charges of conspiring to manipulate prices in the foreign exchange spot market, and resulting in theimposition of criminal fines in the aggregate of more than US$2.5bn. Additional penalties were imposed at the same time bythe FRB and other banking regulators. HSBC was not a party to these resolutions, and investigations into HSBC by the DoJ, FRBand others around the world continue.
In late 2013 and early 2014, HSBC and other banks were named as defendants in various putative class actions consolidated inthe New York District Court. The consolidated complaint alleged, among other things, that the defendants conspired tomanipulate the WM/Reuters foreign exchange benchmark rates. In September 2015, HSBC reached an agreement with plaintiffsto resolve the consolidated action, subject to court approval. In December 2015, the court granted preliminary approval of thesettlement, and HSBC made payment of the agreed settlement amount into an escrow account. The court has not yet set a datefor the final approval hearing.
In June 2015, a putative class action was filed in the New York District Court making similar allegations on behalf of EmployeeRetirement Income Security Act of 1974 (‘ERISA’) plan participants, and another complaint was filed in the US District Court forthe Northern District of California in May 2015. HSBC filed a motion to transfer the California action to New York, which wasgranted in November 2015.
In September 2015, two additional putative class actions making similar allegations under Canadian law were issued in Canadaagainst various HSBC companies and other financial institutions.
As at 30 June 2016, HSBC has recognised a provision in the amount of £927m. There are many factors that may affect the rangeof outcomes, and the resulting financial impact, of these matters. Due to uncertainties and limitations of these estimates, theultimate penalties could differ significantly from the amount provided.
Precious metals fix-related investigations and litigationVarious regulators and competition and law enforcement authorities, including in the US and the EU, are conductinginvestigations and reviews relating to HSBC’s precious metals operations and trading. HSBC is cooperating with theseinvestigations and reviews. In November 2014, the Antitrust Division and Criminal Fraud Section of the DoJ issued a documentrequest to HSBC Holdings, seeking the voluntary production of certain documents in connection with a criminal investigationthat the DoJ is conducting of alleged anti-competitive and manipulative conduct in precious metals trading. In January 2016,the Antitrust Division of the DoJ informed HSBC that it was closing its investigation; however, the Criminal Fraud Section’sinvestigation remains ongoing.
Gold: Beginning in March 2014, numerous putative class actions were filed in the New York District Court and the US DistrictCourts for the District of New Jersey and the Northern District of California, naming HSBC and other members of The LondonGold Market Fixing Limited as defendants. The complaints allege that, from January 2004 to the present, defendants conspiredto manipulate the price of gold and gold derivatives for their collective benefit in violation of US antitrust laws, the US CEAand New York state law. The actions were consolidated in the New York District Court. Defendants moved to dismiss theconsolidated action and a hearing took place in April 2016.
In December 2015, a putative class action under Canadian law was filed in the Ontario Superior Court of Justice against variousHSBC companies and other financial institutions. Plaintiffs allege that, from January 2004 to March 2014, defendants conspiredto manipulate the price of gold and gold-related investment instruments in violation of the Canadian Competition Act andcommon law.
Silver: Beginning in July 2014, numerous putative class actions were filed in the US District Courts for the Southern and EasternDistricts of New York, naming HSBC and other members of The London Silver Market Fixing Ltd as defendants. The complaintsallege that, from January 1999 to the present, defendants conspired to manipulate the price of silver and silver derivatives fortheir collective benefit in violation of US antitrust laws, the US CEA and New York state law. The actions were consolidated inthe New York District Court. Defendants moved to dismiss the consolidated action and a hearing took place in April 2016.
In April 2016, two putative class actions under Canadian law were filed in the Ontario and Quebec Superior Courts of Justiceagainst various HSBC companies and other financial institutions. Plaintiffs in both actions allege that from January 1999 to
HSBC BANK PLC49
August 2014 defendants conspired to manipulate the price of silver and silver-related investment instruments in violation of theCanadian Competition Act and common law. These actions are at an early stage.
Platinum and palladium: Between late 2014 and early 2015, numerous putative class actions were filed in the New York DistrictCourt, naming HSBC and other members of The London Platinum and Palladium Fixing Company Limited as defendants. Thecomplaints allege that, from January 2008 to the present, defendants conspired to manipulate the price of platinum groupmetals (‘PGM’) and PGM-based financial products for their collective benefit in violation of US antitrust laws and the US CEA.Defendants have moved to dismiss the action.
There are many factors that may affect the range of outcomes, and the resulting financial impact, of these matters, which couldbe significant.
Credit default swap litigationVarious HSBC companies, among other financial institutions, ISDA, and Markit, were named as defendants in numerousputative class actions filed in the New York District Court and the Illinois District Court. The actions alleged that the defendants,violated US antitrust laws by, among other things, conspiring to restrict access to credit default swap pricing exchanges andblock new entrants into the exchange market. The actions were subsequently consolidated in the New York District Court. InSeptember 2015, the HSBC defendants reached an agreement with plaintiffs to resolve the consolidated action, and final courtapproval of that settlement was granted in April 2016.
Interest rate swap litigationIn February 2016, various HSBC companies, among others, were added as defendants to a pending putative class action filed inthe New York District Court. The amended complaint, along with other complaints filed in the New York District Court and theIllinois District Court, alleged that the defendants violated US antitrust laws by, among other things, conspiring to boycott andeliminate various entities and practices that would have brought exchange trading to buy-side investors in the interest rateswaps marketplace. In June 2016, the actions were consolidated in the New York District Court. This matter is at an early stage.
Based on the facts currently known, it is not practicable at this time for HSBC to predict the resolution of this matter, includingthe timing or any possible impact on HSBC, which could be significant.
Fédération Internationale de Football Association (‘FIFA’) related investigationsHSBC has received inquiries from the DoJ regarding its banking relationships with certain individuals and entities that are ormay be associated with FIFA. The DoJ is investigating whether multiple financial institutions, including HSBC, permitted theprocessing of suspicious or otherwise improper transactions, or failed to observe applicable AML laws and regulations. HSBC iscooperating with the DoJ’s investigation.
Based on the facts currently known, it is not practicable at this time for HSBC to predict the resolution of this matter, includingthe timing or any possible impact on HSBC, which could be significant.
Notes on the Condensed Financial Statements (continued)
HSBC BANK PLC50
13 Transactions with related parties
There were no changes in the related party transactions described in Note 38 of the Annual Report and Accounts 2015 thathave had a material effect on the financial position or performance of HSBC in the half-year to 30 June 2016. All related partytransactions that took place in the half-year to 30 June 2016 were similar in nature to those disclosed in the Annual Report andAccounts 2015.
14 Events after the balance sheet date
A first interim dividend for the financial year ending 31 December 2016 of £255m was declared by the Directors on 3 August2016.
The group agreed to dispose of its interest in Vocalink, formerly an associate undertaking, on 21 July 2016. The gain on sale, ofapproximately £60m, is likely to be recognised in early 2017, upon completion of regulatory approvals and other customaryclosing conditions.
15 Interim Report 2016 and statutory accounts
The information in this Interim Report 2016 is unaudited and does not constitute statutory accounts within the meaning ofsection 434 of the Companies Act 2006. The Interim Report 2016 was approved by the Board of Directors on 3 August 2016. Thestatutory accounts for the year ended 31 December 2015 have been delivered to the Registrar of Companies in England andWales in accordance with section 447 of the Companies Act 2006. The group’s auditor, PricewaterhouseCoopers LLP (‘PWC’)has reported on those accounts. Its report was unqualified; did not include a reference to any matters to which PWC drewattention by way of emphasis without qualifying their report; and did not contain a statement under section 498(2) or (3) of theCompanies Act 2006.
Independent review report to HSBC Bank plcReport on the condensed consolidated interim financial statements Our conclusionWe have reviewed HSBC Bank plc’s condensed consolidated interim financial statements (the ‘interim financial statements’) inthe interim report of HSBC Bank plc for the six-month period ended 30 June 2016. Based on our review, nothing has come toour attention that causes us to believe that the condensed consolidated interim financial statements are not prepared, in allmaterial respects, in accordance with International Accounting Standard 34, ‘Interim Financial Reporting’, as adopted by theEuropean Union and the Disclosure Rules and Transparency Rules of the United Kingdom’s Financial Conduct Authority.
This conclusion is to be read in the context of what we say in the remainder of this report.
What we have reviewedThe condensed consolidated interim financial statements, which are prepared by HSBC Bank plc comprise:
• the consolidated statement of financial position as at 30 June 2016;
• the consolidated income statement and consolidated statement of comprehensive income for the period then ended;
• the consolidated statement of cash flows for the period then ended;
• the consolidated statement of changes in equity for the period then ended; and
• the explanatory notes to the condensed consolidated interim financial statements.
As disclosed in Note 1 to the interim financial statements, the financial reporting framework that has been applied in thepreparation of the full annual financial statements of the group is applicable law and International Financial ReportingStandards (IFRSs) as adopted by the European Union.
The condensed consolidated interim financial statements included in the interim report have been prepared in accordance withInternational Accounting Standard 34, ‘Interim Financial Reporting’, as adopted by the European Union and the Disclosure Rulesand Transparency Rules of the United Kingdom’s Financial Conduct Authority.
What a review of interim financial statements involvesWe conducted our review in accordance with International Standard on Review Engagements (UK and Ireland) 2410, ‘Review ofInterim Financial Information Performed by the Independent Auditor of the Entity’ issued by the Auditing Practices Board foruse in the United Kingdom. A review of interim financial information consists of making enquiries, primarily of personsresponsible for financial and accounting matters, and applying analytical and other review procedures.
A review is substantially less in scope than an audit conducted in accordance with International Standards on Auditing (UK andIreland) and, consequently, does not enable us to obtain assurance that we would become aware of all significant matters thatmight be identified in an audit. Accordingly, we do not express an audit opinion.
We have read the other information contained in the interim report and considered whether it contains any apparentmisstatements or material inconsistencies with the information in the interim financial statements.
Responsibilities for the interim financial statements and the review Our responsibilities and those of the Directors1,2
The interim report, including the condensed consolidated interim financial statements, is the responsibility of, and has beenapproved by, the Directors. The Directors are responsible for preparing the interim report in accordance with the DisclosureRules and Transparency Rules of the United Kingdom’s Financial Conduct Authority.
Our responsibility is to express a conclusion on the condensed consolidated interim financial statements in the interim reportbased on our review. This report, including the conclusion, has been prepared for and only for the company for the purpose ofcomplying with the Disclosure Rules and Transparency Rules of the United Kingdom’s Financial Conduct Authority and for noother purpose. We do not, in giving this conclusion, accept or assume responsibility for any other purpose or to any otherperson to whom this report is shown or into whose hands it may come save where expressly agreed by our prior consent inwriting.
PricewaterhouseCoopers LLPChartered AccountantsLondon, United Kingdom 3 August 2016
1 The maintenance and integrity of the HSBC Bank plc website is the responsibility of the directors; the work carried out by the auditors does notinvolve consideration of these matters and, accordingly, the auditors accept no responsibility for any changes that may have occurred to the interimfinancial statements since they were initially presented on the website.
2 Legislation in the United Kingdom governing the preparation and dissemination of financial statements may differ from legislation in otherjurisdictions.
Independent Review Report by PricewaterhouseCoopers LLP to HSBC Bank plc
HSBC BANK PLC51


HSBC Bank plc
Incorporated in England with limited liability. Registered in England: number 14259
REGISTERED OFFICE
8 Canada Square, London E14 5HQ, United Kingdom
Web: www.hsbc.co.uk
© Copyright HSBC Bank plc 2016
All rights reserved
No part of this publication may be reproduced, stored in a retrieval system, or transmitted, in any form or by any means,electronic, mechanical, photocopying, recording, or otherwise, without the prior written permission of HSBC Bank plc.

HSBC Bank plc8 Canada SquareLondon E14 5HQUnited KingdomTelephone: 44 020 7991 8888www.hsbc.co.uk
H
SB
C B
ank p
lc In
terim R
epo
rt 2016