Embed Size (px)
Citation preview

RECOMMENDED
MILE*
TM
For Professional Clients only
HSBC Global Strategy Portfolios A world of opportunities made affordable
1
HSBC Global Strategy PortfoliosA world of opportunities made affordable
A balancing act
In many ways, playing a game of chess
is similar to multi-asset investing:
winning strategies are rooted in a
robust decision-making framework
and a forward-looking approach.
The chess master has their Queen,
Bishops, and Knights ready to attack.
While the absolute value of every chess
piece is important, so is its relative value
based on how it can move, and also its
current position on the board.
Similarly, our multi-asset investment
team works to identify the optimal
combination of assets in today’s
investment markets, to benefit from
global opportunities and balance
risks in each portfolio. We do this by
effectively employing our investment
resources and leveraging the expertise
of our multi-asset specialists based in
different markets around the world.
Source: HSBC Global Asset Management as at 30 June 2017.
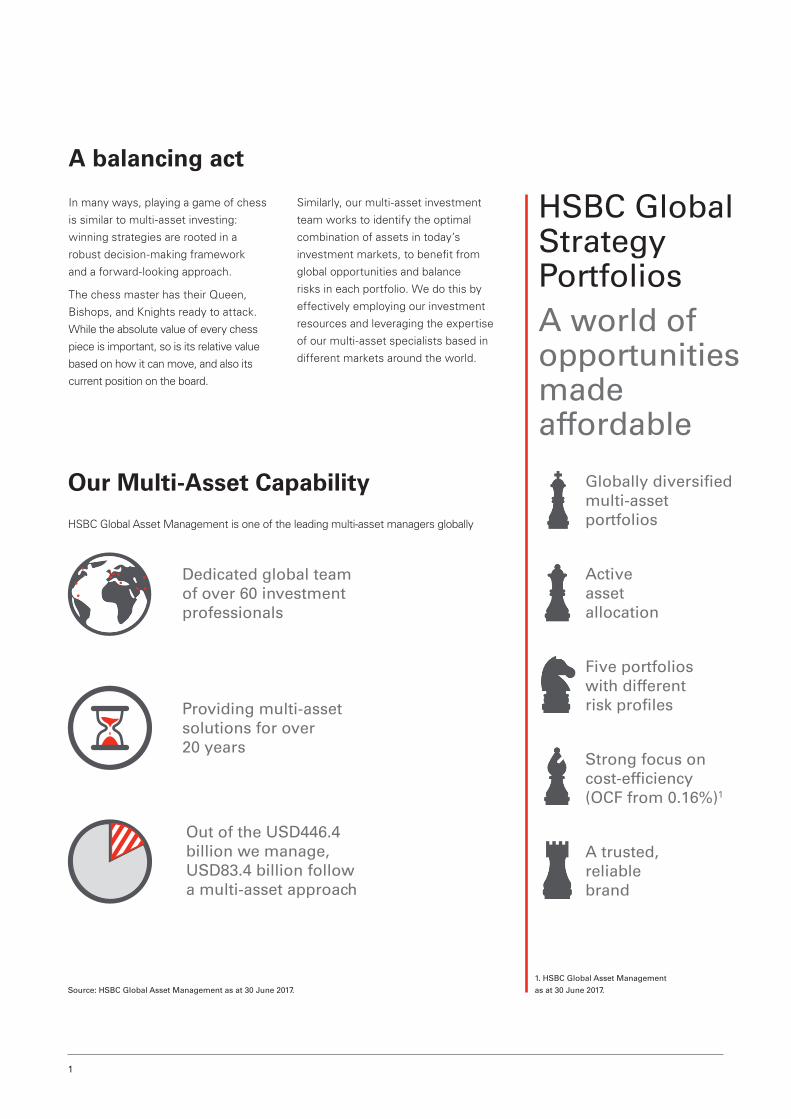
Our Multi-Asset Capability
HSBC Global Asset Management is one of the leading multi-asset managers globally
Globally diversified multi-asset portfolios
Active asset allocation
Five portfolios with different risk profiles
Strong focus on cost-efficiency (OCF from 0.16%)1
A trusted, reliable brand
Dedicated global team of over 60 investment professionals
1. HSBC Global Asset Management
as at 30 June 2017.
Providing multi-asset solutions for over 20 years
Out of the USD446.4 billion we manage, USD83.4 billion follow a multi-asset approach
HSBC Global Strategy Portfolios: A world of opportunities made affordable 2
Get a broad view of the game
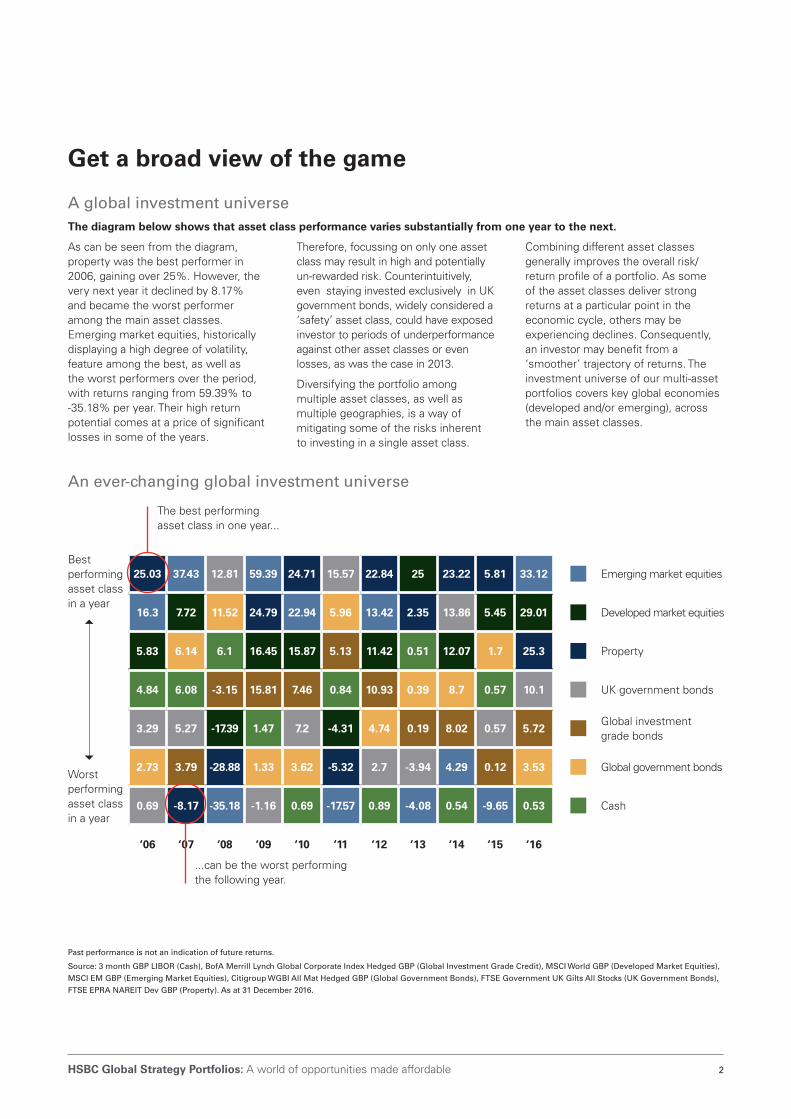
A global investment universeThe diagram below shows that asset class performance varies substantially from one year to the next.
As can be seen from the diagram, property was the best performer in 2006, gaining over 25%. However, the very next year it declined by 8.17% and became the worst performer among the main asset classes. Emerging market equities, historically displaying a high degree of volatility, feature among the best, as well as the worst performers over the period, with returns ranging from 59.39% to -35.18% per year. Their high return potential comes at a price of significant losses in some of the years.
Therefore, focussing on only one asset class may result in high and potentially un-rewarded risk. Counterintuitively, even staying invested exclusively in UK government bonds, widely considered a ‘safety’ asset class, could have exposed investor to periods of underperformance against other asset classes or even losses, as was the case in 2013.
Diversifying the portfolio among multiple asset classes, as well as multiple geographies, is a way of mitigating some of the risks inherent to investing in a single asset class.
Combining different asset classes generally improves the overall risk/return profile of a portfolio. As some of the asset classes deliver strong returns at a particular point in the economic cycle, others may be experiencing declines. Consequently, an investor may benefit from a ‘smoother’ trajectory of returns. The investment universe of our multi-asset portfolios covers key global economies (developed and/or emerging), across the main asset classes.
Past performance is not an indication of future returns.
Source: 3 month GBP LIBOR (Cash), BofA Merrill Lynch Global Corporate Index Hedged GBP (Global Investment Grade Credit), MSCI World GBP (Developed Market Equities),
MSCI EM GBP (Emerging Market Equities), Citigroup WGBI All Mat Hedged GBP (Global Government Bonds), FTSE Government UK Gilts All Stocks (UK Government Bonds),
FTSE EPRA NAREIT Dev GBP (Property). As at 31 December 2016.
An ever-changing global investment universe
25.03 37.43 12.81 59.39 24.71 15.57 22.84 25 23.22 5.81 33.12 Emerging market equities
16.3 7.72 11.52 24.79 22.94 5.96 13.42 2.35 13.86 5.45 29.01 Developed market equities
5.83 6.14 6.1 16.45 15.87 5.13 11.42 0.51 12.07 1.7 25.3 Property
4.84 6.08 -3.15 15.81 7.46 0.84 10.93 0.39 8.7 0.57 10.1 UK government bonds
3.29 5.27 -17.39 1.47 7.2 -4.31 4.74 0.19 8.02 0.57 5.72Global investment grade bonds
2.73 3.79 -28.88 1.33 3.62 -5.32 2.7 -3.94 4.29 0.12 3.53 Global government bonds
0.69 -8.17 -35.18 -1.16 0.69 -17.57 0.89 -4.08 0.54 -9.65 0.53 Cash
‘06 ‘07 ‘08 ‘09 ‘10 ‘11 ‘12 ‘13 ‘14 ‘15 ‘16
‘06
25.03
16.30
11.38
9.99
5.83
4.84
3.29
2.73
1.19
0.69
‘07
37.43
16.57
7.72
6.79
6.14
6.08
5.27
3.79
2.20
-8.17
‘08
28.93
12.81
11.52
6.10
-3.15
-9.94
-17.39
-27.37
-28.88
-35.18
‘09
59.48
59.39
27.00
24.79
16.45
15.81
10.10
1.47
1.33
-1.16
‘10
24.71
22.94
19.81
15.87
15.00
12.34
7.46
7.20
3.62
0.69
‘11
15.57
8.19
5.96
5.13
2.93
0.84
-1.23
-4.31
-5.32
-17.57
‘13
25.00
7.31
2.35
0.51
0.39
0.19
-3.94
-4.08
-5.78
-10.76
‘14
23.22
13.86
12.07
8.70
8.02
7.48
4.29
2.71
0.54
0.24
‘12
22.84
18.75
13.42
11.49
11.42
10.93
4.74
2.70
0.89
18.14
Year
‘15
5.81
5.45
1.70
0.74
0.57
0.57
0.12
-2.11
-6.18
-9.65
‘16
33.12
29.01
27.41
25.30
15.63
10.10
9.26
5.72
3.53
0.53
Global government bonds
Emerging market equities
Global investment grade credit
Global high yield credit
Property
Developed market equities
Hard currency EMD
Local currency EMD
Cash
UK government bonds
Key:
Best performing asset class in year
Worst performing asset class in year
The best performing asset class in one year...
...can be the worst performing the following year.
Best performing asset class in a year
Worst performing asset class in a year
HSBC Global Strategy Portfolios: A world of opportunities made affordable 3
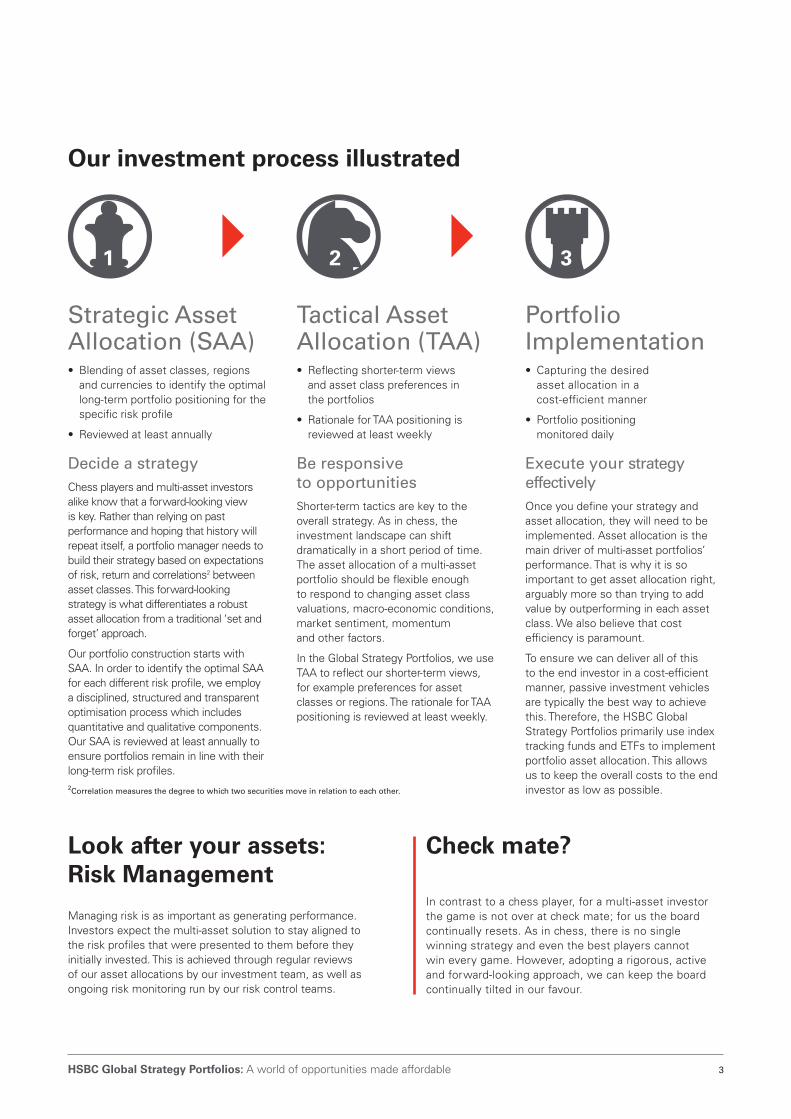
Our investment process illustrated
1 2
2Correlation measures the degree to which two securities move in relation to each other.
3
Strategic Asset Allocation (SAA)• Blending of asset classes, regions
and currencies to identify the optimal long-term portfolio positioning for the specific risk profile
• Reviewed at least annually
Decide a strategy Chess players and multi-asset investors alike know that a forward-looking view is key. Rather than relying on past performance and hoping that history will repeat itself, a portfolio manager needs to build their strategy based on expectations of risk, return and correlations2 between asset classes. This forward-looking strategy is what differentiates a robust asset allocation from a traditional ‘set and forget’ approach.
Our portfolio construction starts with SAA. In order to identify the optimal SAA for each different risk profile, we employ a disciplined, structured and transparent optimisation process which includes quantitative and qualitative components. Our SAA is reviewed at least annually to ensure portfolios remain in line with their long-term risk profiles.
Tactical Asset Allocation (TAA)• Reflecting shorter-term views
and asset class preferences in the portfolios
• Rationale for TAA positioning is reviewed at least weekly
Be responsive to opportunities Shorter-term tactics are key to the overall strategy. As in chess, the investment landscape can shift dramatically in a short period of time. The asset allocation of a multi-asset portfolio should be flexible enough to respond to changing asset class valuations, macro-economic conditions, market sentiment, momentum and other factors.
In the Global Strategy Portfolios, we use TAA to reflect our shorter-term views, for example preferences for asset classes or regions. The rationale for TAA positioning is reviewed at least weekly.
Portfolio Implementation • Capturing the desired
asset allocation in a cost-efficient manner
• Portfolio positioning monitored daily
Execute your strategy effectively Once you define your strategy and asset allocation, they will need to be implemented. Asset allocation is the main driver of multi-asset portfolios’ performance. That is why it is so important to get asset allocation right, arguably more so than trying to add value by outperforming in each asset class. We also believe that cost efficiency is paramount.
To ensure we can deliver all of this to the end investor in a cost-efficient manner, passive investment vehicles are typically the best way to achieve this. Therefore, the HSBC Global Strategy Portfolios primarily use index tracking funds and ETFs to implement portfolio asset allocation. This allows us to keep the overall costs to the end investor as low as possible.
Look after your assets: Risk Management
Managing risk is as important as generating performance. Investors expect the multi-asset solution to stay aligned to the risk profiles that were presented to them before they initially invested. This is achieved through regular reviews of our asset allocations by our investment team, as well as ongoing risk monitoring run by our risk control teams.
Check mate?
In contrast to a chess player, for a multi-asset investor the game is not over at check mate; for us the board continually resets. As in chess, there is no single winning strategy and even the best players cannot win every game. However, adopting a rigorous, active and forward-looking approach, we can keep the board continually tilted in our favour.
4
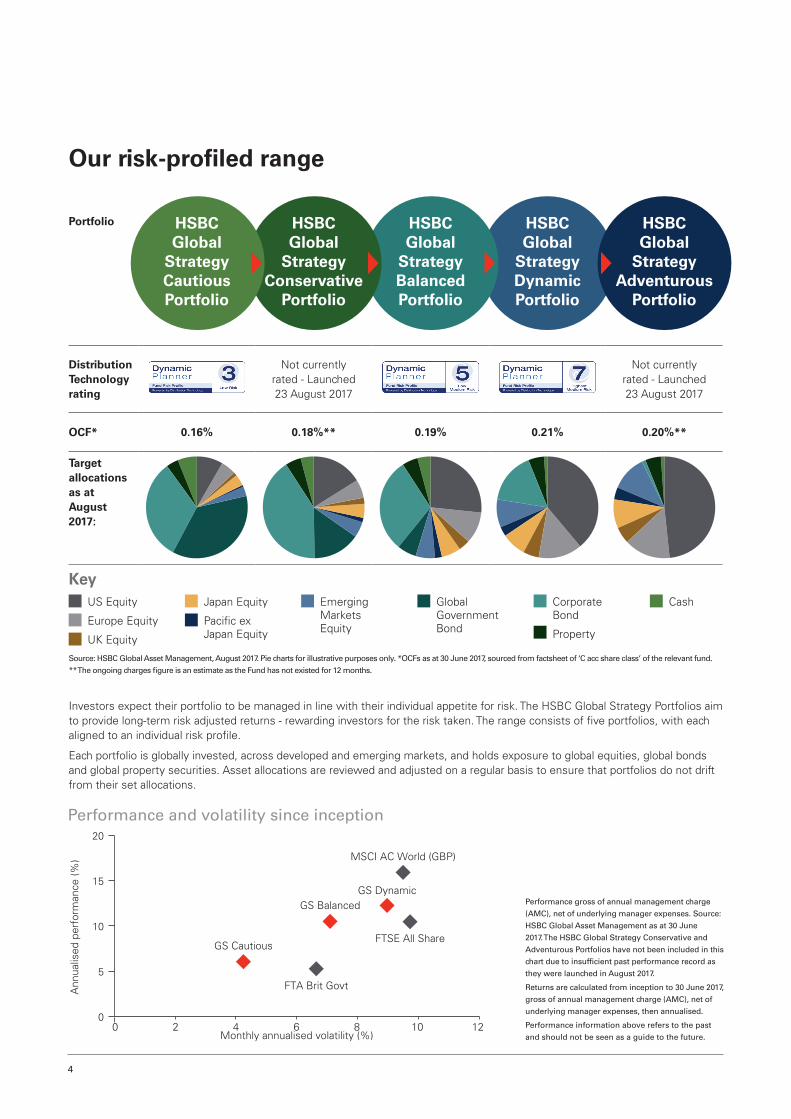
Performance and volatility since inception
GS DynamicGS Balanced
GS Cautious
FTA Brit Govt
FTSE All Share
MSCI AC World (GBP)
20
15
10
5
0
Ann
ualis
ed p
erfo
rman
ce (%
)
Monthly annualised volatility (%)0 2 4 6 8 10 12
Performance gross of annual management charge
(AMC), net of underlying manager expenses. Source:
HSBC Global Asset Management as at 30 June
2017. The HSBC Global Strategy Conservative and
Adventurous Portfolios have not been included in this
chart due to insufficient past performance record as
they were launched in August 2017.
Returns are calculated from inception to 30 June 2017,
gross of annual management charge (AMC), net of
underlying manager expenses, then annualised.
Performance information above refers to the past
and should not be seen as a guide to the future.
Source: HSBC Global Asset Management, August 2017. Pie charts for illustrative purposes only. *OCFs as at 30 June 2017, sourced from factsheet of ‘C acc share class’ of the relevant fund.
** The ongoing charges figure is an estimate as the Fund has not existed for 12 months.
Investors expect their portfolio to be managed in line with their individual appetite for risk. The HSBC Global Strategy Portfolios aim to provide long-term risk adjusted returns - rewarding investors for the risk taken. The range consists of five portfolios, with each aligned to an individual risk profile.
Each portfolio is globally invested, across developed and emerging markets, and holds exposure to global equities, global bonds and global property securities. Asset allocations are reviewed and adjusted on a regular basis to ensure that portfolios do not drift from their set allocations.
Our risk-profiled range
Portfolio HSBC Global
Strategy Cautious Portfolio
HSBC Global
Strategy Conservative
Portfolio
HSBC Global
Strategy Balanced Portfolio
HSBC Global
Strategy Dynamic Portfolio
HSBC Global
Strategy Adventurous
Portfolio
Distribution Technology rating
Not currently rated - Launched 23 August 2017
Not currently rated - Launched 23 August 2017
OCF* 0.16% 0.18%** 0.19% 0.21% 0.20%**
Target allocations as at August 2017:
US Equity
Europe Equity
UK Equity
Japan Equity
Pacific ex Japan Equity
Emerging Markets Equity
Global Government Bond
Corporate Bond
Property
Cash
Key
For professional clients only and should not be distributed to or relied upon by Retail clients.
The HSBC Global Strategy Portfolios area sub-fund of HSBC OpenFunds, an Open Ended Investment Company that is authorised in the UK by the Financial Conduct Authority. The Authorised Corporate Director and Investment Manager is HSBC Global Asset Management (UK) Limited. All applications are made on the basis of the HSBC OpenFunds prospectus, Key Investor Information Document (KIID), Supplementary Information Document (SID) and most recent annual and semi annual report, which can be obtained upon request free of charge from HSBC Global Asset Management (UK) Limited, 8, Canada Square, Canary Wharf, London, E14 5HQ, UK, or the local distributors. Investors and potential investors should read and note the risk warnings in the prospectus and relevant KIID and additionally, in the case of retail clients, the information contained in the supporting SID.
The material contained in this presentation is for information only and does not constitute investment advice or a recommendation to any recipient of this material to buy or sell investments. HSBC Global Asset Management (UK) Limited has based this presentation on information obtained from sources it believes to be reliable but which it has not independently verified. HSBC Global Asset Management (UK) Limited and HSBC Group accept no responsibility as to its accuracy or completeness. This presentation is intended for discussion only and shall not be capable of creating any contractual or other legal obligations on the part of HSBC Global Asset Management (UK) Limited or any other HSBC Group company. Care has been taken to ensure the accuracy of this presentation but HSBC Global Asset Management (UK) Limited accepts no responsibility for any errors or omissions contained therein. The views expressed here were held at the time of preparation and are subject to change.
Any forecast, projection or target where provided is indicative only and is not guaranteed in any way. HSBC Global Asset Management (UK) Limited accepts no liability for any failure to meet such forecast, projection or target. Past performance should not be seen as an indication of future returns. The value of investments and any income from them can go down as well as up and investors may not get back the amount originally invested.
Where overseas investments are held the rate of currency exchange may cause the value of such investments to go down as well as up. Investments in emerging markets are by their nature higher risk and potentially more volatile than those inherent in established markets. Stock market investments should be viewed as a medium to long term investment and should be held for at least five years.
Where charges are taken from capital, although this will enhance the income distributed, it may constrain the capital growth of your investment. If charges are taken from income, and there is insufficient income to meet such charges, any deficit will be taken from the capital. This could result in an erosion of the capital value of the investment. The level of yields are not guaranteed and may rise or fall in the future.
The information in this presentation is based on HSBC’s interpretation of current legislation and HM Revenue & Customs practice.
While we believe that this interpretation is correct, we cannot guarantee it. Legislation and tax practice may change in the future. Tax treatment is based upon individual client circumstances.
This document is issued in the UK by HSBC Global Asset Management (UK) Limited which is authorised and regulated by the Financial Conduct Authority. Copyright HSBC Global Asset Management (UK) Limited 2017. All Rights Reserved. ED0258 EXP:30/03/2018
Contact
For more information, please contact us:
Telephone: 0800 358 3011
Email: [email protected]
Website: www.assetmanagement.hsbc.com/uk/advisers
*The HSBC Global Strategy Balanced Portfolio - Retail X Acc – and HSBC Global Strategy Dynamic Portfolio - Retail X Acc – are both rated 5 Stars as at 31 July 2017.