Embed Size (px)
Citation preview
Hsien-wen LiaoPhD. Candidate
National Chengchi University
Yuanchen ChangDepartment of Finance
National Chengchi University
News Effects on the Valuation of Closed-end Country Funds:Evidence around the Asian Financial Crisis Period

2004/12/16 NCCU 2/23
Content
• Introduction• Related literatures• Data and methodology• Empirical results• Concluding remark
2004/12/16 NTTU 3/23
To resolve how news reports affect investors’ sentiment around the Asian financial crisis.
Concerning categorized news reports, to reveal how investors react to those news reports.
To resolve whether news effects have boundaries around financial crisis.
Introduction

2004/12/16 NTTU 4/23
• The effects of news arrivals on the valuation of asset prices
Mitchell and Mulherin (1994), Berry and Howe (1994): Significant relationship is found between information arrivals and
trading volumes.
Chan and Wei (1996): Political issues on the handover of Hong Kong show positive
impact on return.
Chan, Chui and Kwok (2001): Economic news have distinctive impacts on trading when
comparing with political news. (Investors’ perceptual biases)
Related literatures
2004/12/16 NTTU 5/23
• Closed-end fund and investors’ reactions to news arrivals
Lee, Shleifer and Thaler (1990), Dimson and Minio-Kozerski (1999):
Shares of closed-end funds trade at an average discount. (market friction)
Lee et al. (1991): Discounts are a proxy for changes of individual investors’
sentiment.
Burch, Emery and Fuerst (2003): Country fund discounts worsened dramatically following the 9-1
1 attack and then recovered gradually alongside the broader market. (Investors’ sentiment)
Related literature (cont.)
2004/12/16 NTTU 6/23
Funds: Six Asian country funds listed on NYSE:
Indonesia Fund, Korea Fund,
Malaysia Fund, First Philippine Fund,
Taiwan Fund, Thailand Fund.
Data source: Bloomberg
Data and methodology
2004/12/16 NTTU 7/23
Sample period: Jan. 1995 to Dec. 2002
(Except for Indonesia Fund, its sample period is from Jan. 1995 to Nov. 2001.)
Sub-periods: Before-and-During Crisis: Jan. 1995 – Dec. 1998 Post Crisis: Jan. 1999 – Dec. 2002
(Except for Indonesia Fund)
Data and methodology (cont.)
2004/12/16 NTTU 8/23
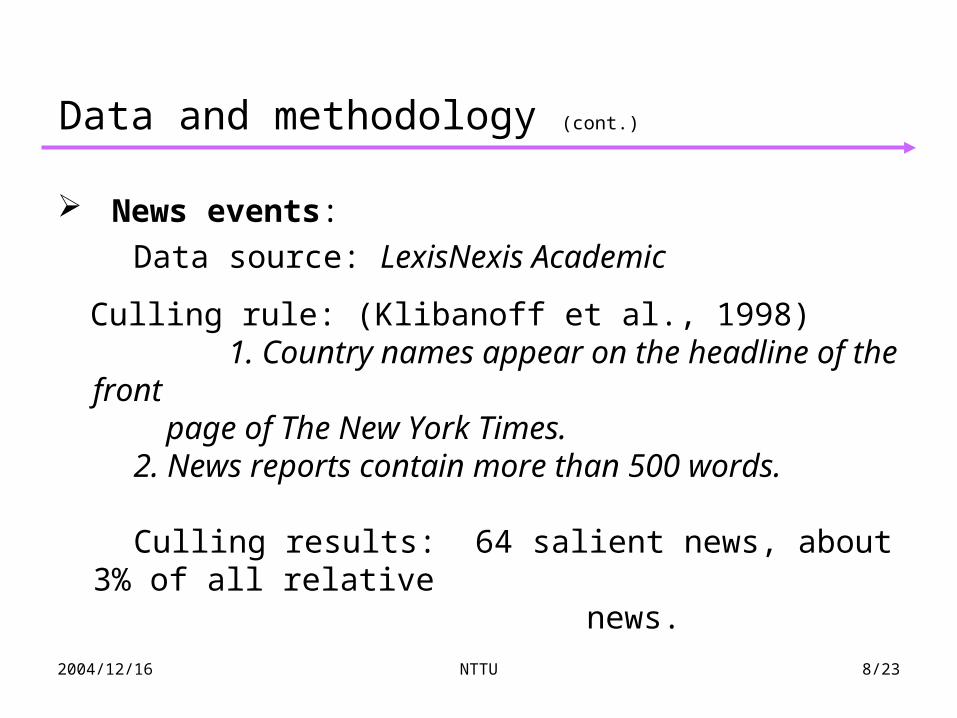
News events:
Data source: LexisNexis Academic
Culling rule: (Klibanoff et al., 1998) 1. Country names appear on the headline of the front
page of The New York Times. 2. News reports contain more than 500 words.
Culling results: 64 salient news, about 3% of all relative
news.
Data and methodology (cont.)
2004/12/16 NTTU 9/23
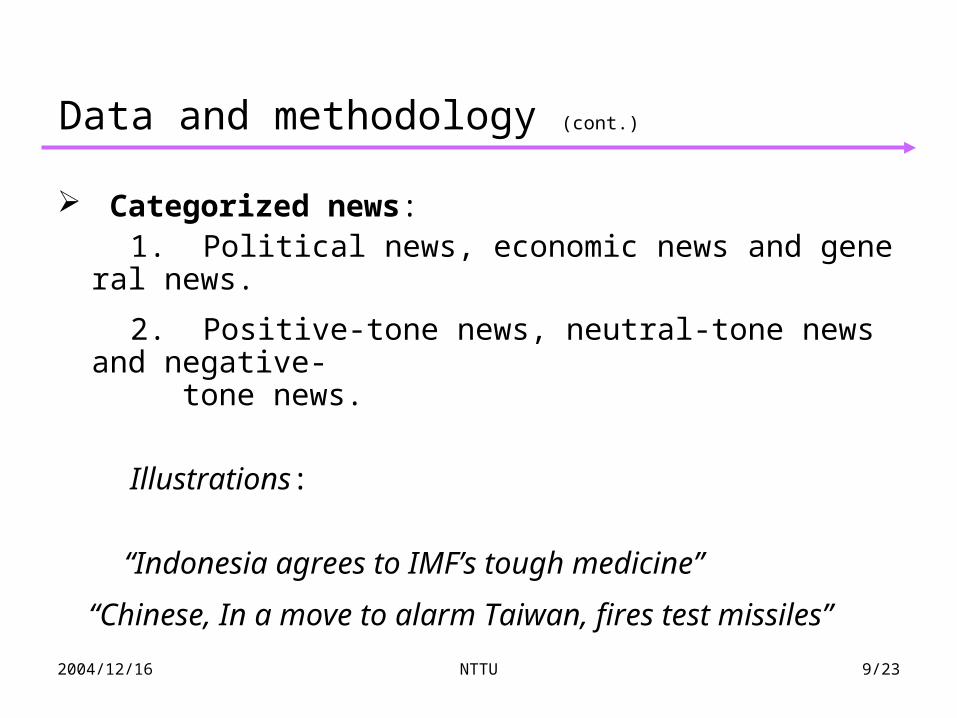
Categorized news: 1. Political news, economic news and general news.
2. Positive-tone news, neutral-tone news and negative- tone news.
Illustrations:
“Indonesia agrees to IMF’s tough medicine”
“Chinese, In a move to alarm Taiwan, fires test missiles”
Data and methodology (cont.)
2004/12/16 NTTU 10/23
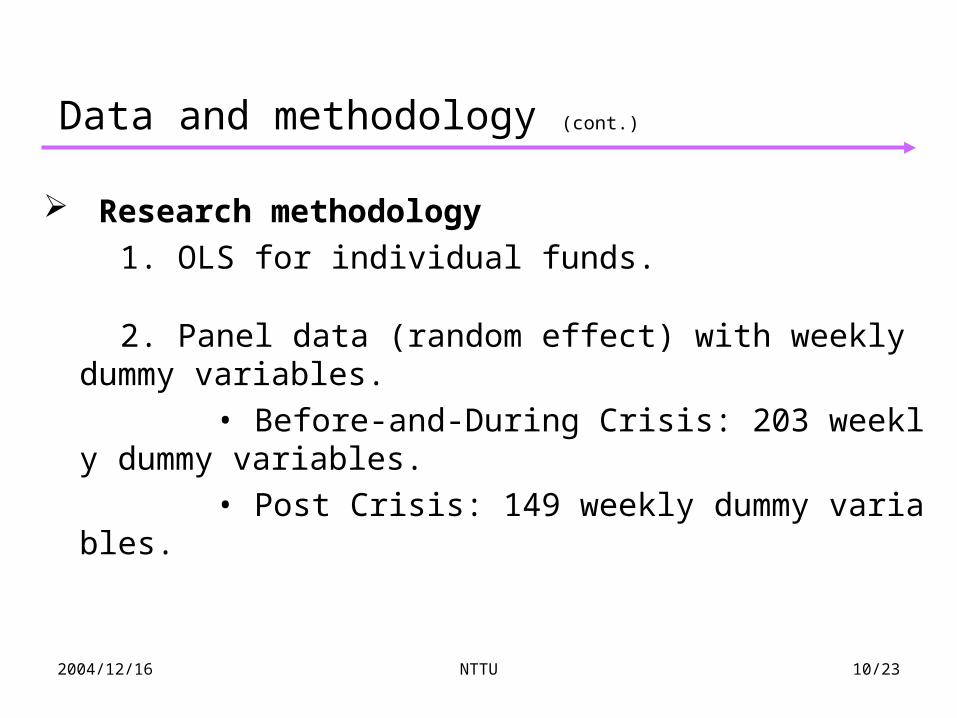
Research methodology
1. OLS for individual funds.
2. Panel data (random effect) with weekly dummy variables.
• Before-and-During Crisis: 203 weekly dummy variables.
• Post Crisis: 149 weekly dummy variables.
Data and methodology (cont.)
2004/12/16 NTTU 11/23
Empirical results
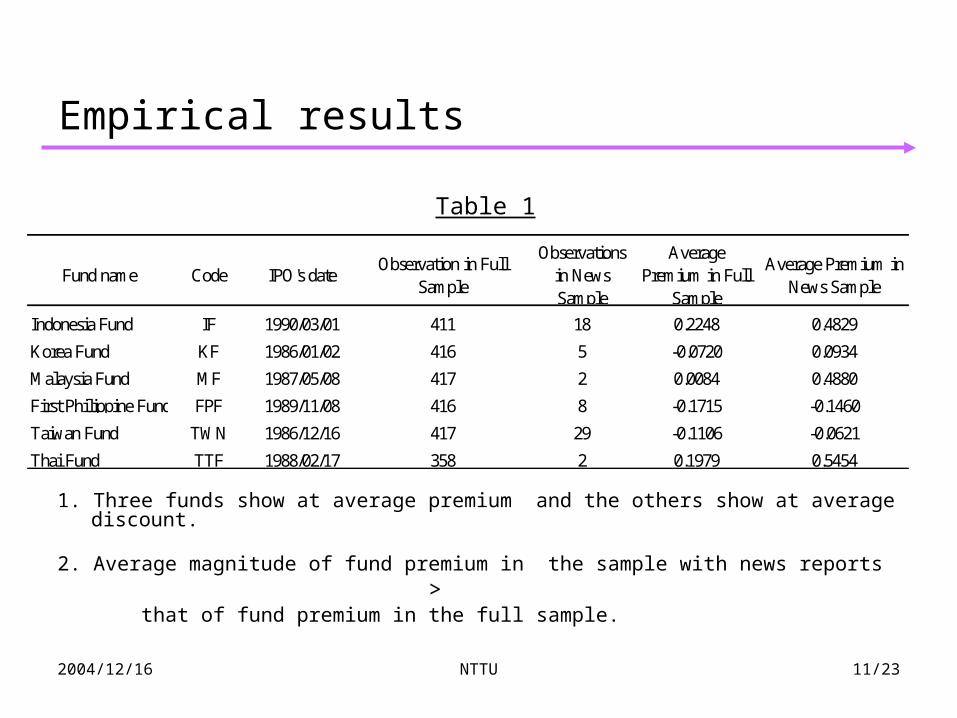
1. Three funds show at average premium and the others show at average discount.
2. Average magnitude of fund premium in the sample with news reports > that of fund premium in the full sample.
Fund name Code IPO's dateObservation in Full
Sample
Observationsin NewsSample
AveragePremium in Full
Sample
Average Premium inNews Sample
Indonesia Fund IF 1990/03/01 411 18 0.2248 0.4829
Korea Fund KF 1986/01/02 416 5 -0.0720 0.0934
Malaysia Fund MF 1987/05/08 417 2 0.0084 0.4880
First Philippine Fund FPF 1989/11/08 416 8 -0.1715 -0.1460
Taiwan Fund TWN 1986/12/16 417 29 -0.1106 -0.0621
Thai Fund TTF 1988/02/17 358 2 0.1979 0.5454
Table 1
2004/12/16 NTTU 12/23
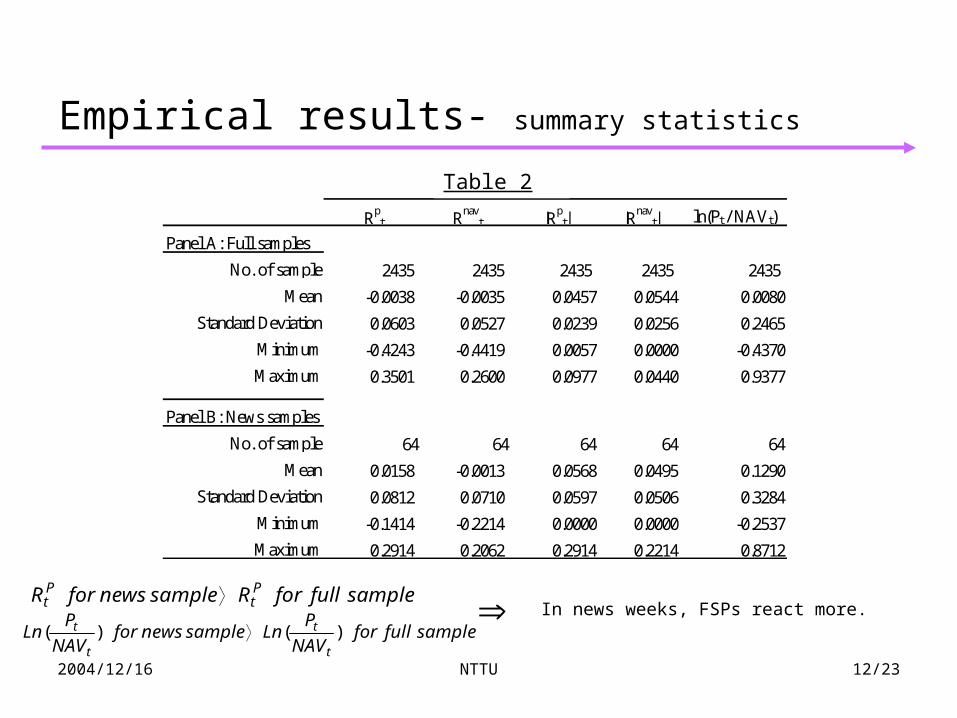
In news weeks, FSPs react more.samplefullforRsamplenewsforR P
tPt
samplefullforNAV
PLnsamplenewsfor
NAV
PLn
t
t
t
t )()(
Empirical results- summary statistics
Rpt Rnav
t |Rpt| |Rnav
t| ln(Pt / NAVt)
2435 2435 2435 2435 2435
-0.0038 -0.0035 0.0457 0.0544 0.0080
0.0603 0.0527 0.0239 0.0256 0.2465
-0.4243 -0.4419 0.0057 0.0000 -0.4370
0.3501 0.2600 0.0977 0.0440 0.9377
64 64 64 64 64
0.0158 -0.0013 0.0568 0.0495 0.1290
0.0812 0.0710 0.0597 0.0506 0.3284
-0.1414 -0.2214 0.0000 0.0000 -0.2537
0.2914 0.2062 0.2914 0.2214 0.8712
Table 3.2
Maximum
No. of sample
Mean
Standard Deviation
Minimum
Panel A: Full samples
Panel B: News samples
No. of sample
Mean
Standard Deviation
Minimum
Maximum
Table 2
2004/12/16 NTTU 13/23
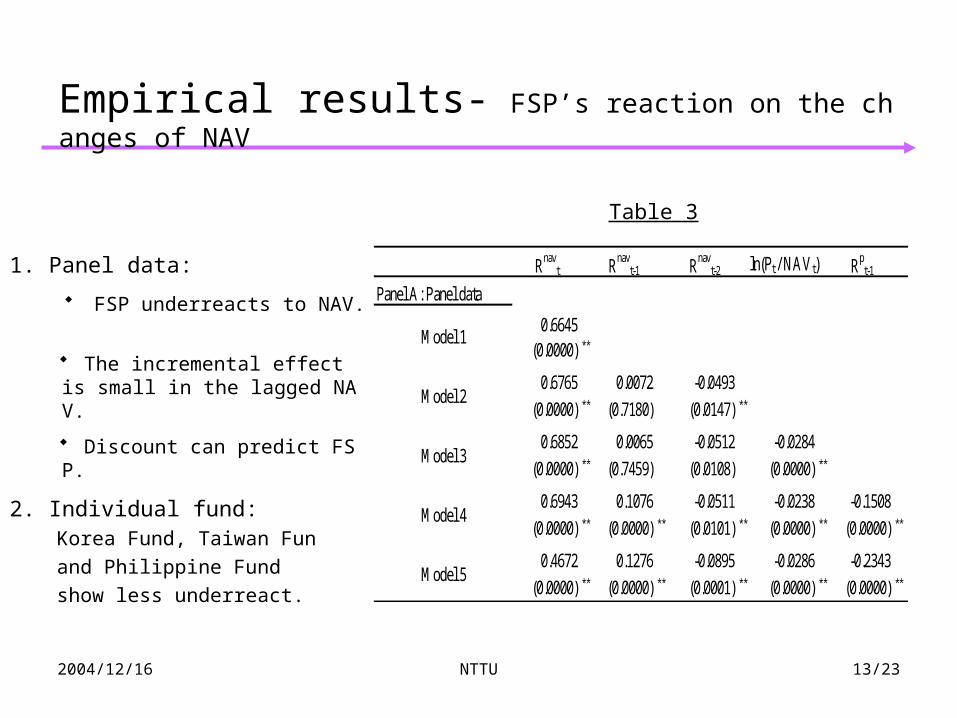
Empirical results- FSP’s reaction on the changes of NAV
1. Panel data:
◆ FSP underreacts to NAV.
◆ The incremental effect is small in the lagged NAV.
◆ Discount can predict FSP.
2. Individual fund: Korea Fund, Taiwan Fun
and Philippine Fund
show less underreact.
Rnavt Rnav
t-1 Rnavt-2 ln(Pt / NAVt) Rp
t-1
Panel A: Panel data
0.6645(0.0000) **
0.6765 0.0072 -0.0493
(0.0000) ** (0.7180) (0.0147) **
0.6852 0.0065 -0.0512 -0.0284
(0.0000) ** (0.7459) (0.0108) (0.0000) **
0.6943 0.1076 -0.0511 -0.0238 -0.1508
(0.0000) ** (0.0000) ** (0.0101) ** (0.0000) ** (0.0000) **
0.4672 0.1276 -0.0895 -0.0286 -0.2343
(0.0000) ** (0.0000) ** (0.0001) ** (0.0000) ** (0.0000) **Model 5
Model 1
Model 2
Model 3
Model 4
Table 3
2004/12/16 NTTU 14/23
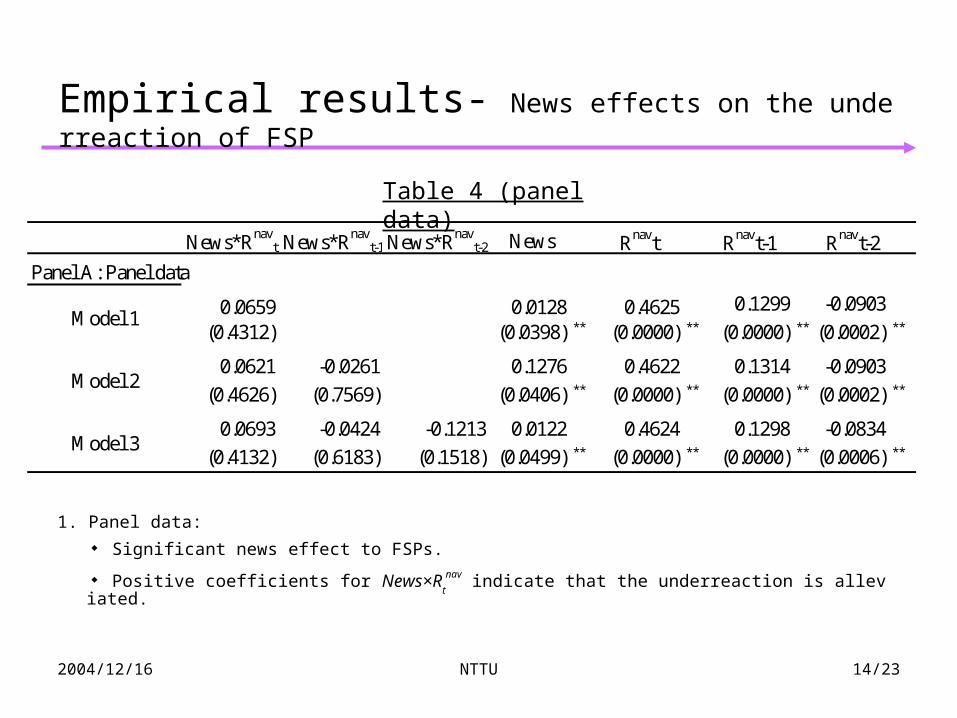
Empirical results- News effects on the underreaction of FSP
1. Panel data:
◆ Significant news effect to FSPs.
◆ Positive coefficients for News×Rt
nav indicate that the underreaction is alleviated.
News*Rnavt News*Rnav
t-1 News*Rnavt-2 News Rnavt Rnavt-1 Rnavt-2
Panel A: Panel data
0.0659 0.0128 0.4625 0.1299 -0.0903
(0.4312) (0.0398) ** (0.0000) ** (0.0000) ** (0.0002) **
0.0621 -0.0261 0.1276 0.4622 0.1314 -0.0903
(0.4626) (0.7569) (0.0406) ** (0.0000) ** (0.0000) ** (0.0002) **
0.0693 -0.0424 -0.1213 0.0122 0.4624 0.1298 -0.0834
(0.4132) (0.6183) (0.1518) (0.0499) ** (0.0000) ** (0.0000) ** (0.0006) **
Model 2
Model 3
Model 1
Table 4 (panel data)
2004/12/16 NTTU 15/23
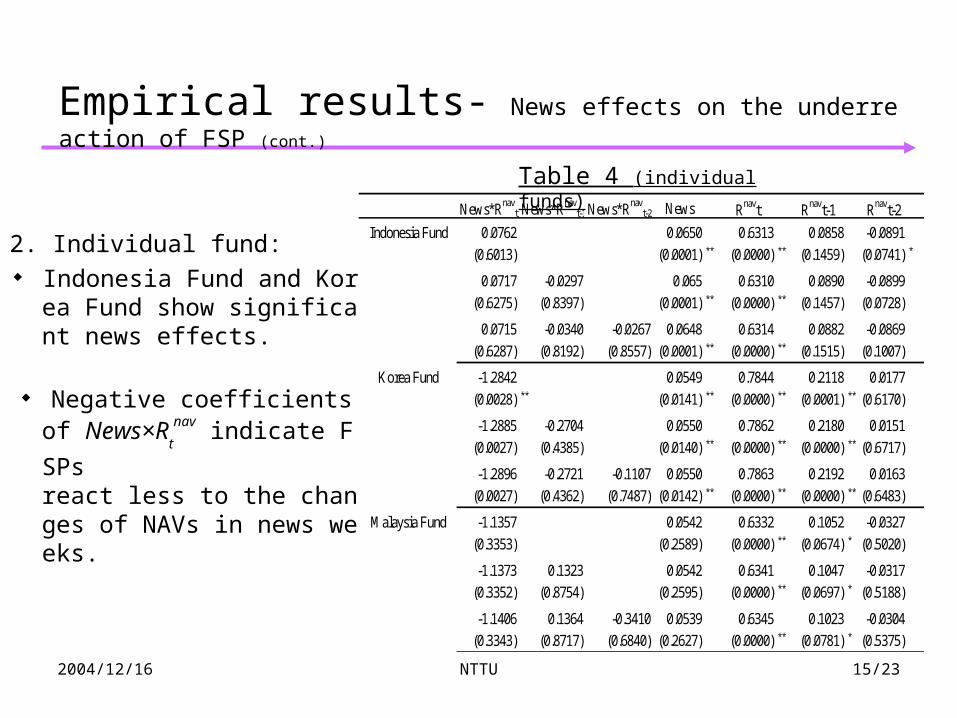
Empirical results- News effects on the underreaction of FSP (cont.)
2. Individual fund: ◆ Indonesia Fund and Korea
Fund show significant news effects.
◆ Negative coefficients of News×R
t
nav indicate FSPs
react less to the changes of NAVs in news weeks.
News*Rnavt News*Rnav
t-1 News*Rnavt-2 News Rnavt Rnavt-1 Rnavt-2
Indonesia Fund 0.0762 0.0650 0.6313 0.0858 -0.0891
(0.6013) (0.0001) ** (0.0000) ** (0.1459) (0.0741) *
0.0717 -0.0297 0.065 0.6310 0.0890 -0.0899
(0.6275) (0.8397) (0.0001) ** (0.0000) ** (0.1457) (0.0728)
0.0715 -0.0340 -0.0267 0.0648 0.6314 0.0882 -0.0869
(0.6287) (0.8192) (0.8557) (0.0001) ** (0.0000) ** (0.1515) (0.1007)
Korea Fund -1.2842 0.0549 0.7844 0.2118 0.0177
(0.0028) ** (0.0141) ** (0.0000) ** (0.0001) ** (0.6170)
-1.2885 -0.2704 0.0550 0.7862 0.2180 0.0151
(0.0027) ** (0.4385) (0.0140) ** (0.0000) ** (0.0000) ** (0.6717)
-1.2896 -0.2721 -0.1107 0.0550 0.7863 0.2192 0.0163
(0.0027) ** (0.4362) (0.7487) (0.0142) ** (0.0000) ** (0.0000) ** (0.6483)
Malaysia Fund -1.1357 0.0542 0.6332 0.1052 -0.0327
(0.3353) (0.2589) (0.0000) ** (0.0674) * (0.5020)
-1.1373 0.1323 0.0542 0.6341 0.1047 -0.0317
(0.3352) (0.8754) (0.2595) (0.0000) ** (0.0697) * (0.5188)
-1.1406 0.1364 -0.3410 0.0539 0.6345 0.1023 -0.0304
(0.3343) (0.8717) (0.6840) (0.2627) (0.0000) ** (0.0781) * (0.5375)
Table 4 (individual funds)
2004/12/16 NTTU 16/23
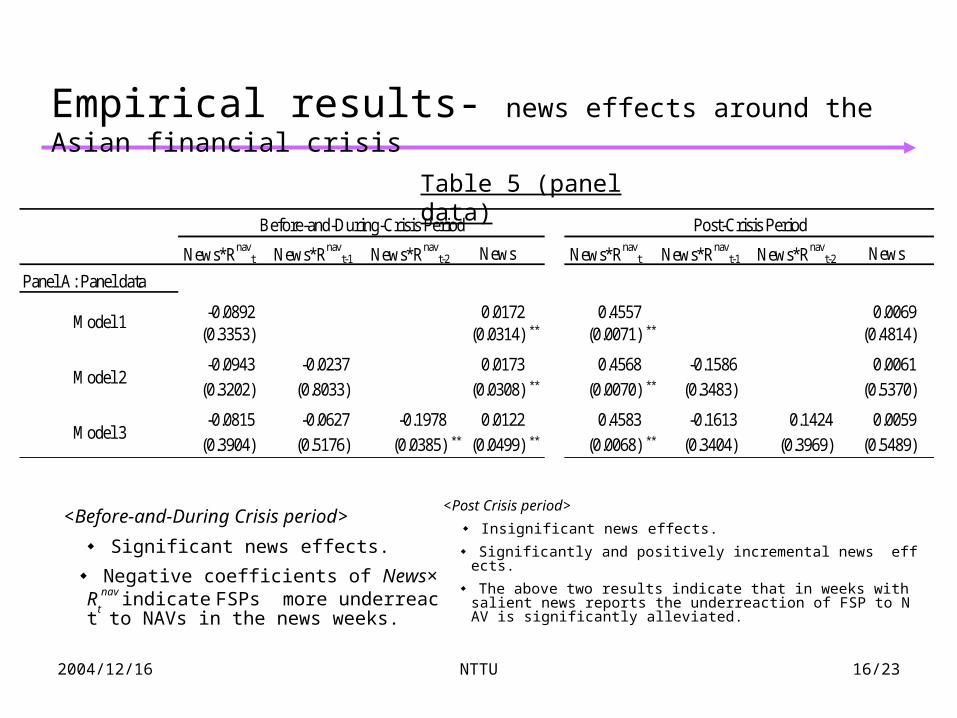
Empirical results- news effects around the Asian financial crisis
<Before-and-During Crisis period>
◆ Significant news effects.
◆ Negative coefficients of News×Rt
nav indicate FSPs more underreact to NAVs in the news weeks.
News*Rnavt News*Rnav
t-1 News*Rnavt-2 News News*Rnav
t News*Rnavt-1 News*Rnav
t-2 News
Panel A: Panel data
-0.0892 0.0172 0.4557 0.0069(0.3353) (0.0314) ** (0.0071) ** (0.4814)
-0.0943 -0.0237 0.0173 0.4568 -0.1586 0.0061
(0.3202) (0.8033) (0.0308) ** (0.0070) ** (0.3483) (0.5370)
-0.0815 -0.0627 -0.1978 0.0122 0.4583 -0.1613 0.1424 0.0059
(0.3904) (0.5176) (0.0385) ** (0.0499) ** (0.0068) ** (0.3404) (0.3969) (0.5489)Model 3
Before-and-During-Crisis Period Post-Crisis Period
Model 1
Model 2
<Post Crisis period>
◆ Insignificant news effects.
◆ Significantly and positively incremental news effects.
◆ The above two results indicate that in weeks with salient news reports the underreaction of FSP to NAV is significantly alleviated.
Table 5 (panel data)
2004/12/16 NTTU 17/23
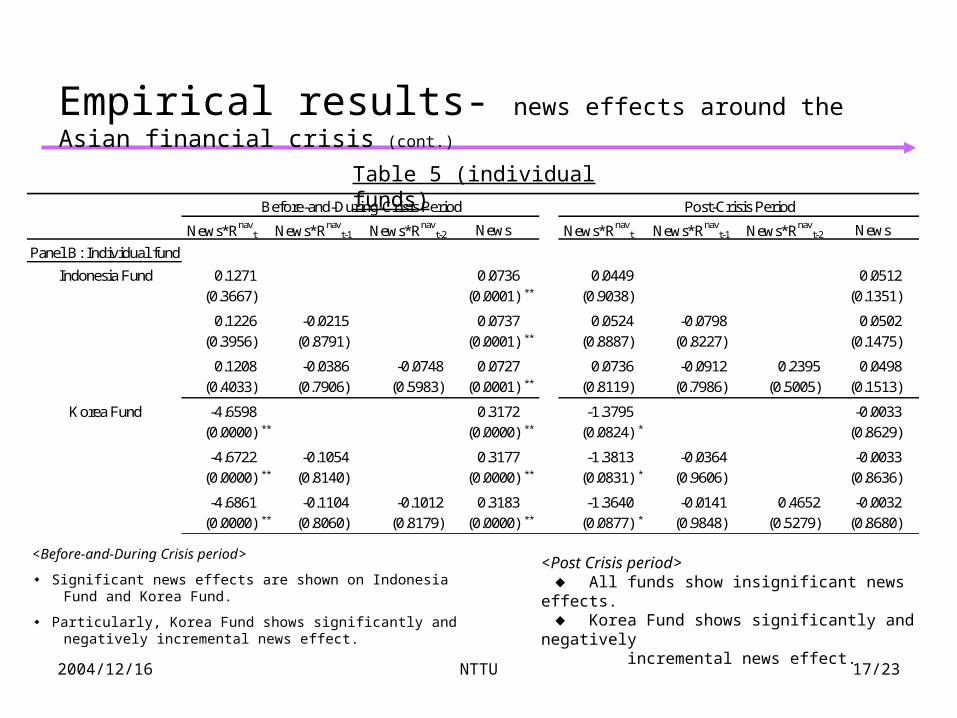
Empirical results- news effects around the Asian financial crisis (cont.)
<Before-and-During Crisis period>
◆ Significant news effects are shown on Indonesia Fund and Korea Fund.
◆ Particularly, Korea Fund shows significantly and negatively incremental news effect.
<Post Crisis period> ◆ All funds show insignificant news effects. ◆ Korea Fund shows significantly and negatively incremental news effect.
News*Rnavt News*Rnav
t-1 News*Rnavt-2 News News*Rnav
t News*Rnavt-1 News*Rnav
t-2 News
Panel B: Individual fund
Indonesia Fund 0.1271 0.0736 0.0449 0.0512
(0.3667) (0.0001) ** (0.9038) (0.1351)
0.1226 -0.0215 0.0737 0.0524 -0.0798 0.0502
(0.3956) (0.8791) (0.0001) ** (0.8887) (0.8227) (0.1475)
0.1208 -0.0386 -0.0748 0.0727 0.0736 -0.0912 0.2395 0.0498
(0.4033) (0.7906) (0.5983) (0.0001) ** (0.8119) (0.7986) (0.5005) (0.1513)
Korea Fund -4.6598 0.3172 -1.3795 -0.0033
(0.0000) ** (0.0000) ** (0.0824) * (0.8629)
-4.6722 -0.1054 0.3177 -1.3813 -0.0364 -0.0033
(0.0000) ** (0.8140) (0.0000) ** (0.0831) * (0.9606) (0.8636)
-4.6861 -0.1104 -0.1012 0.3183 -1.3640 -0.0141 0.4652 -0.0032
(0.0000) ** (0.8060) (0.8179) (0.0000) ** (0.0877) * (0.9848) (0.5279) (0.8680)
Before-and-During-Crisis Period Post-Crisis Period
Table 5 (individual funds)
2004/12/16 NTTU 18/23
To details
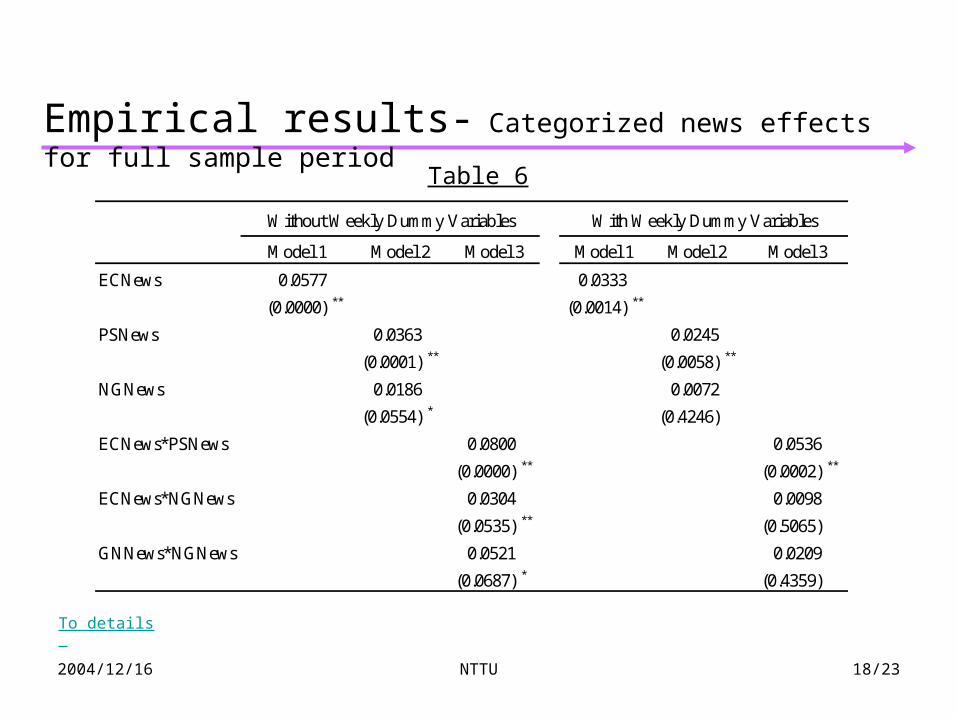
Empirical results- Categorized news effects for full sample period
ECNews 0.0577 0.0333
(0.0000) ** (0.0014) **
PSNews 0.0363 0.0245
(0.0001) ** (0.0058) **
NGNews 0.0186 0.0072
(0.0554) * (0.4246)
ECNews*PSNews 0.0800 0.0536
(0.0000) ** (0.0002) **
ECNews*NGNews 0.0304 0.0098
(0.0535) ** (0.5065)
GNNews*NGNews 0.0521 0.0209
(0.0687) * (0.4359)
Model 2 Model 3 Model 1 Model 2 Model 3
With Weekly Dummy VariablesWithout Weekly Dummy Variables
Model 1
Table 6
2004/12/16 NTTU 19/23
To detail
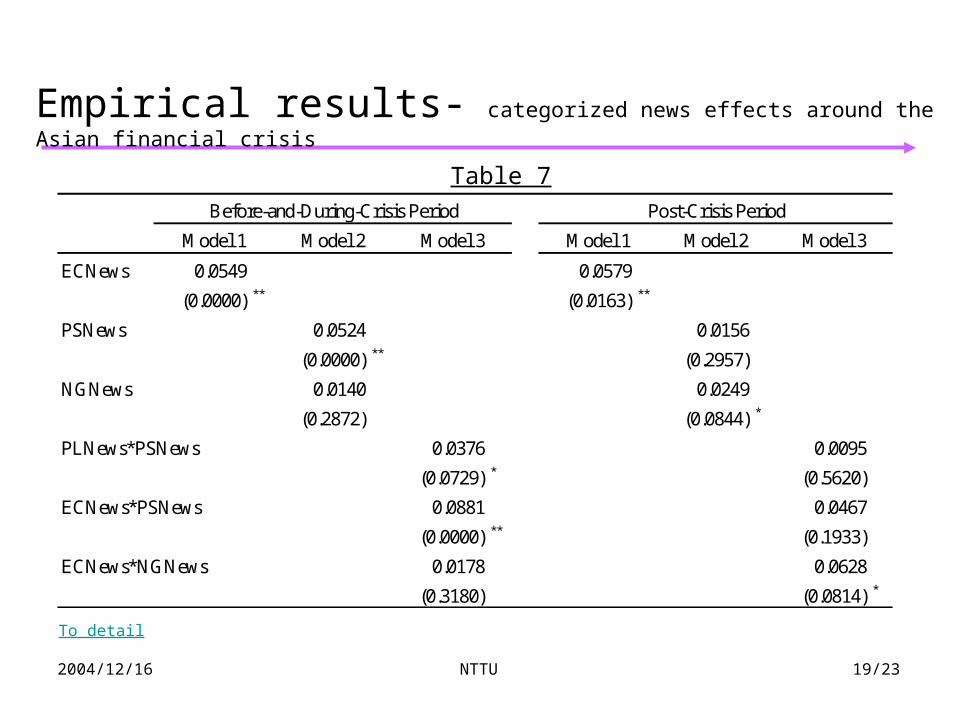
Empirical results- categorized news effects around the Asian financial crisis
Table 7
ECNews 0.0549 0.0579
(0.0000) ** (0.0163) **
PSNews 0.0524 0.0156
(0.0000) ** (0.2957)
NGNews 0.0140 0.0249
(0.2872) (0.0844) *
PLNews*PSNews 0.0376 0.0095
(0.0729) * (0.5620)
ECNews*PSNews 0.0881 0.0467
(0.0000) ** (0.1933)
ECNews*NGNews 0.0178 0.0628
(0.3180) (0.0814) *
Before-and-During-Crisis Period Post-Crisis Period
Model 1 Model 2 Model 3 Model 1 Model 2 Model 3
2004/12/16 NTTU 20/23
Implications:
During the crisis period, positive news is enhanced and perceived as news better than the news itself.
During the crisis period, the crisis itself is the lower bound for negative news.
Empirical results- implications
2004/12/16 NTTU 21/23
Consistent with Klibanoff (1998), FSPs underreact to the changes of NAVs in regular weeks.
In weeks with salient news, the results are consistent with the hypothesis that news events lead individual investors to react more quickly.
Economic news affect individual investors’ reaction more than other categories of news in our sample period.
Concluding remark
2004/12/16 NTTU 22/23
Salient news do play a role in the magnitude of investors’ reaction to changes in fundamental value.
Financial crisis itself is the lower bound for negative news.
Concluding remark (cont.)

2004/12/16 NTTU 23/23
The end
2004/12/16 NTTU 24/23
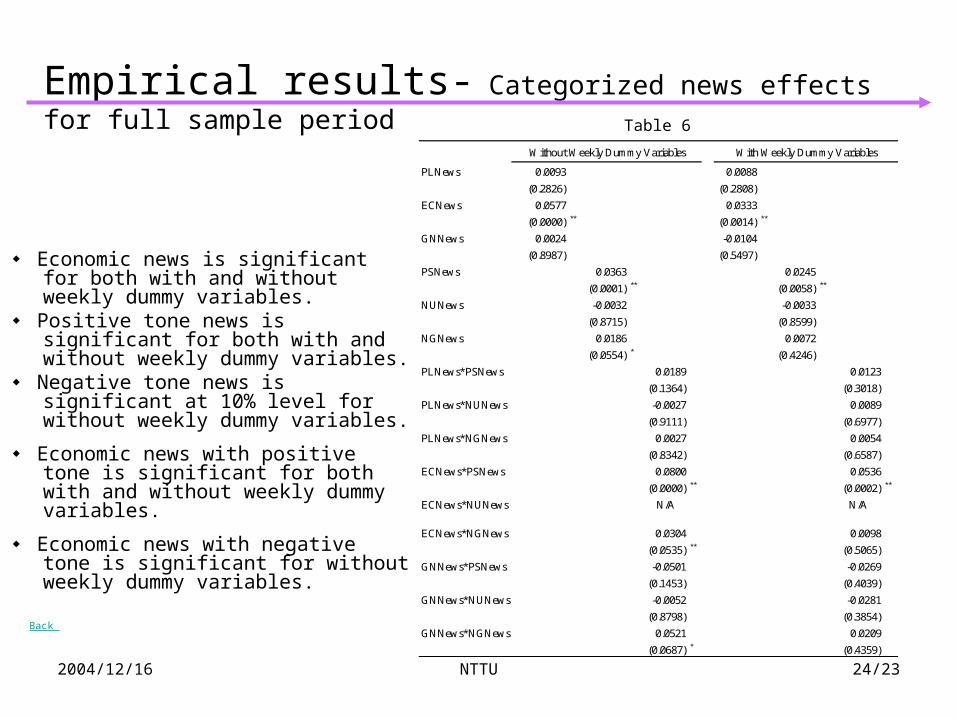
◆ Economic news is significant for both with and without weekly dummy variables.
◆ Positive tone news is significant for both with and without weekly dummy variables.
◆ Negative tone news is significant at 10% level for without weekly dummy variables.
◆ Economic news with positive tone is significant for both with and without weekly dummy variables.
◆ Economic news with negative tone is significant for without weekly dummy variables.
Back
PLNews 0.0093 0.0088
(0.2826) (0.2808)
ECNews 0.0577 0.0333
(0.0000) ** (0.0014) **
GNNews 0.0024 -0.0104
(0.8987) (0.5497)
PSNews 0.0363 0.0245
(0.0001) ** (0.0058) **
NUNews -0.0032 -0.0033
(0.8715) (0.8599)
NGNews 0.0186 0.0072
(0.0554) * (0.4246)
PLNews*PSNews 0.0189 0.0123
(0.1364) (0.3018)
PLNews*NUNews -0.0027 0.0089
(0.9111) (0.6977)
PLNews*NGNews 0.0027 0.0054
(0.8342) (0.6587)
ECNews*PSNews 0.0800 0.0536
(0.0000) ** (0.0002) **
ECNews*NUNews N/A N/A
ECNews*NGNews 0.0304 0.0098
(0.0535) ** (0.5065)
GNNews*PSNews -0.0501 -0.0269
(0.1453) (0.4039)
GNNews*NUNews -0.0052 -0.0281
(0.8798) (0.3854)
GNNews*NGNews 0.0521 0.0209
(0.0687) * (0.4359)
With Weekly Dummy VariablesWithout Weekly Dummy Variables
Empirical results- Categorized news effects for full sample periodTable 6
2004/12/16 NTTU 25/23
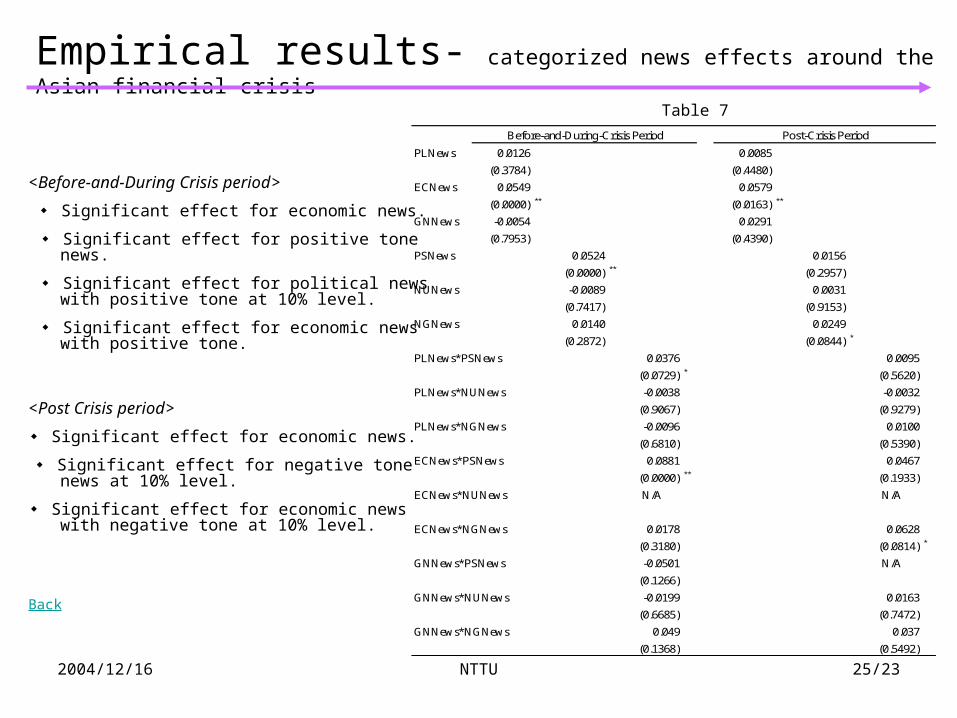
Empirical results- categorized news effects around the Asian financial crisis
<Before-and-During Crisis period>
◆ Significant effect for economic news.
◆ Significant effect for positive tone news.
◆ Significant effect for political news with positive tone at 10% level.
◆ Significant effect for economic news with positive tone.
<Post Crisis period>
◆ Significant effect for economic news.
◆ Significant effect for negative tone news at 10% level.
◆ Significant effect for economic news with negative tone at 10% level.
Back
PLNews 0.0126 0.0085
(0.3784) (0.4480)
ECNews 0.0549 0.0579
(0.0000) ** (0.0163) **
GNNews -0.0054 0.0291
(0.7953) (0.4390)
PSNews 0.0524 0.0156
(0.0000) ** (0.2957)
NUNews -0.0089 0.0031
(0.7417) (0.9153)
NGNews 0.0140 0.0249
(0.2872) (0.0844) *
PLNews*PSNews 0.0376 0.0095
(0.0729) * (0.5620)
PLNews*NUNews -0.0038 -0.0032
(0.9067) (0.9279)
PLNews*NGNews -0.0096 0.0100
(0.6810) (0.5390)
ECNews*PSNews 0.0881 0.0467
(0.0000) ** (0.1933)
ECNews*NUNews N/A N/A
ECNews*NGNews 0.0178 0.0628
(0.3180) (0.0814) *
GNNews*PSNews -0.0501 N/A
(0.1266)
GNNews*NUNews -0.0199 0.0163
(0.6685) (0.7472)
GNNews*NGNews 0.049 0.037
(0.1368) (0.5492)
Before-and-During-Crisis Period Post-Crisis Period
Table 7