Embed Size (px)
Citation preview
Water Disposal – An Assessment of Disposal Wells and Facilities Eric Peterson
Strategic Planning & Market AnalysisMay 2014
• Confidential & Proprietary• Confidential & Proprietary
Retail Propane
15%
Crude Logis-tics48%
Water Solu-tions23%
NGL14%
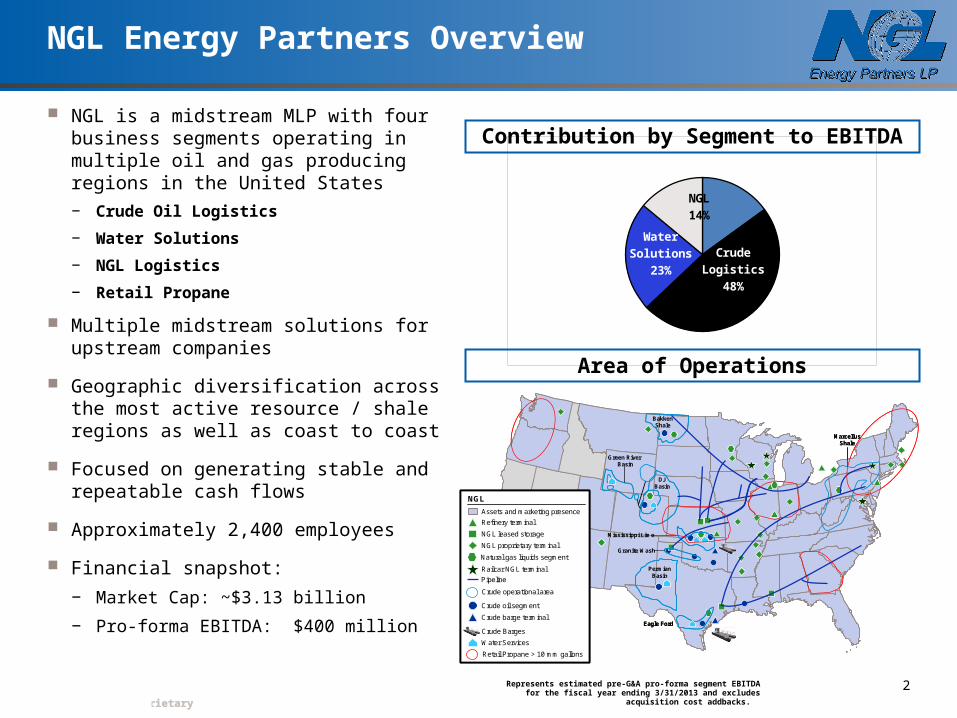
NGL Energy Partners Overview
NGL is a midstream MLP with four business segments operating in multiple oil and gas producing regions in the United States
− Crude Oil Logistics
− Water Solutions
− NGL Logistics
− Retail Propane
Multiple midstream solutions for upstream companies
Geographic diversification across the most active resource / shale regions as well as coast to coast
Focused on generating stable and repeatable cash flows
Approximately 2,400 employees
Financial snapshot:
− Market Cap: ~$3.13 billion
− Pro-forma EBITDA: $400 million
(1) Represents estimated pre-G&A pro-forma segment EBITDA for the fiscal year ending 3/31/2013 and excludes acquisition cost addbacks.
Area of Operations
Contribution by Segment to EBITDA
Eagle Ford
MarcellusShale
DJBasin
Green River Basin
BakkenShale
Mississippi Lime
Granite Wash
PermianBasin
Eagle Ford
MarcellusShale
DJBasin
Green River Basin
BakkenShale
Mississippi Lime
Granite Wash
PermianBasin
Crude Barges
Water Services
Railcar NGL terminal
Refinery terminal
NGL proprietary terminal
Natural gas liquids segment
NGL leased storage
Assets and marketing presence
Pipeline
Crude oil segment
Crude barge terminal
NGL
Retail Propane > 10 mm gallons
Crude operational area
Crude Barges
Water Services
Railcar NGL terminal
Refinery terminal
NGL proprietary terminal
Natural gas liquids segment
NGL leased storage
Assets and marketing presence
Pipeline
Crude oil segment
Crude barge terminal
NGL
Retail Propane > 10 mm gallons
Crude operational area
2
• Confidential & Proprietary• Confidential & Proprietary
Retail Propane
15%
Crude Logis-tics48%
Water Solu-tions23%
NGL14%
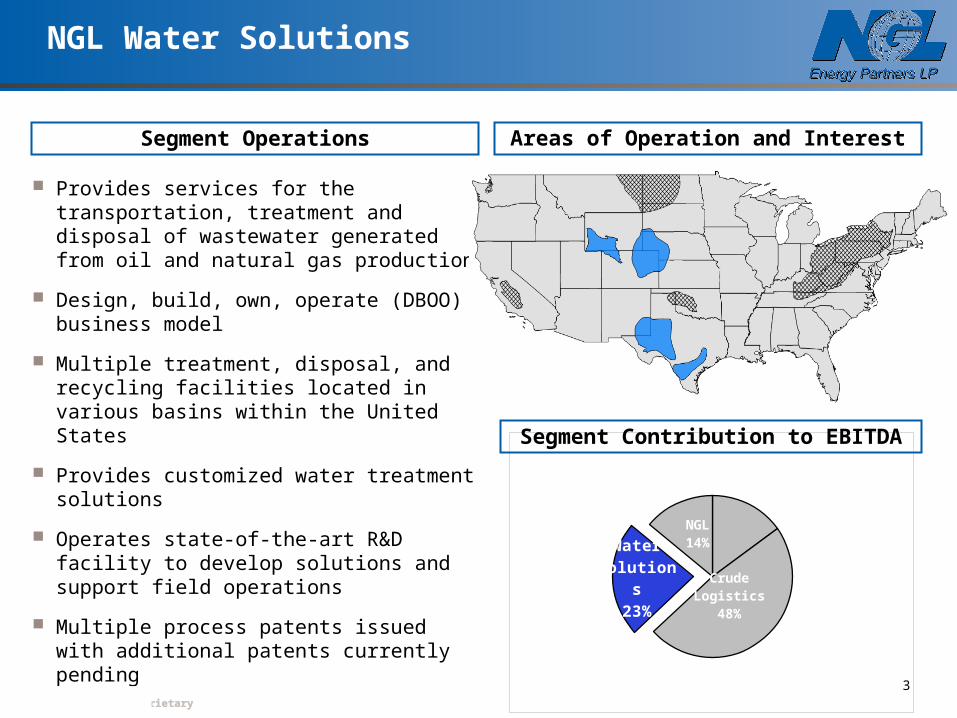
Segment Contribution to EBITDA
Areas of Operation and InterestSegment Operations
NGL Water Solutions
Provides services for the transportation, treatment and disposal of wastewater generated from oil and natural gas production
Design, build, own, operate (DBOO) business model
Multiple treatment, disposal, and recycling facilities located in various basins within the United States
Provides customized water treatment solutions
Operates state-of-the-art R&D facility to develop solutions and support field operations
Multiple process patents issued with additional patents currently pending
3
• Confidential & Proprietary• Confidential & Proprietary
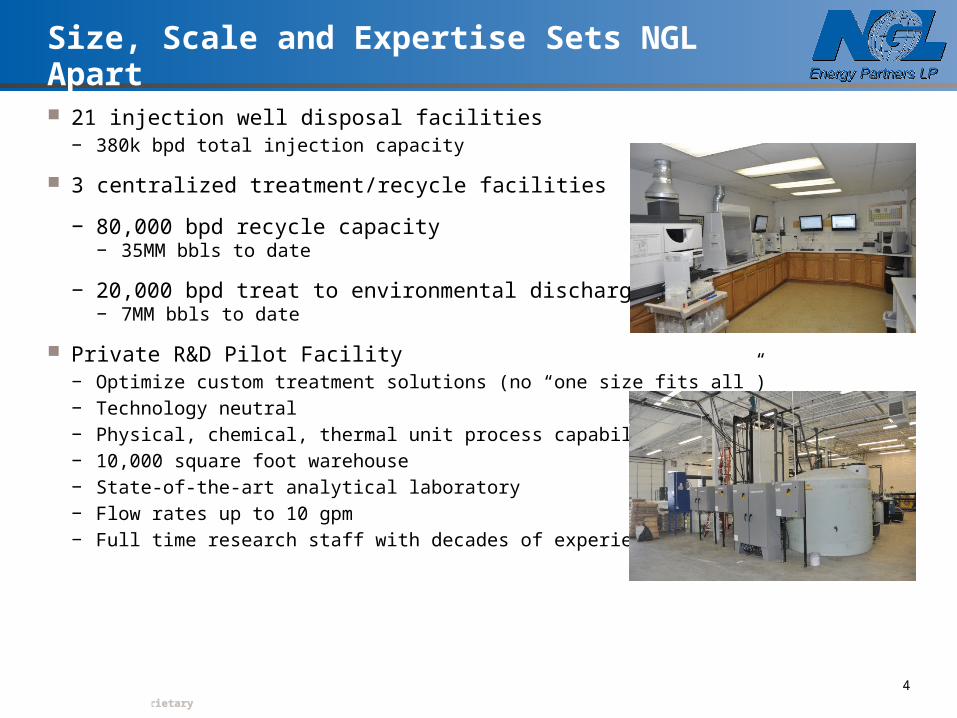
Size, Scale and Expertise Sets NGL Apart
21 injection well disposal facilities− 380k bpd total injection capacity
3 centralized treatment/recycle facilities
− 80,000 bpd recycle capacity− 35MM bbls to date
− 20,000 bpd treat to environmental discharge standard− 7MM bbls to date
Private R&D Pilot Facility− Optimize custom treatment solutions (no “one size fits all”)− Technology neutral− Physical, chemical, thermal unit process capabilities− 10,000 square foot warehouse− State-of-the-art analytical laboratory− Flow rates up to 10 gpm− Full time research staff with decades of experience
4
• Confidential & Proprietary• Confidential & Proprietary
Market Overview
5
• Confidential & Proprietary• Confidential & Proprietary
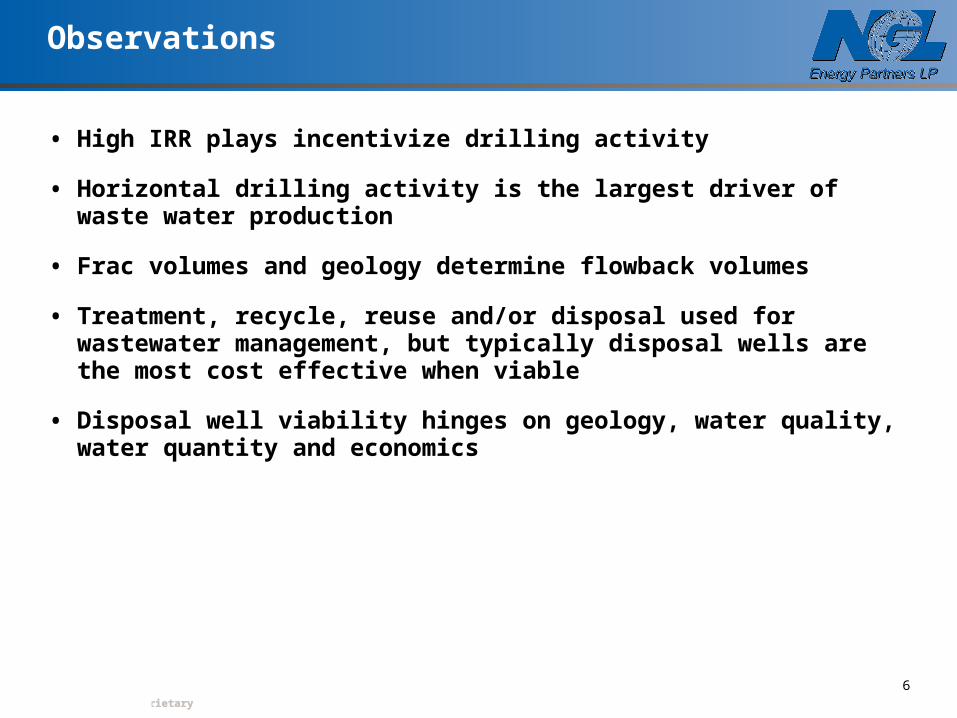
Observations
6
• High IRR plays incentivize drilling activity
• Horizontal drilling activity is the largest driver of waste water production
• Frac volumes and geology determine flowback volumes
• Treatment, recycle, reuse and/or disposal used for wastewater management, but typically disposal wells are the most cost effective when viable
• Disposal well viability hinges on geology, water quality, water quantity and economics
• Confidential & Proprietary• Confidential & Proprietary7
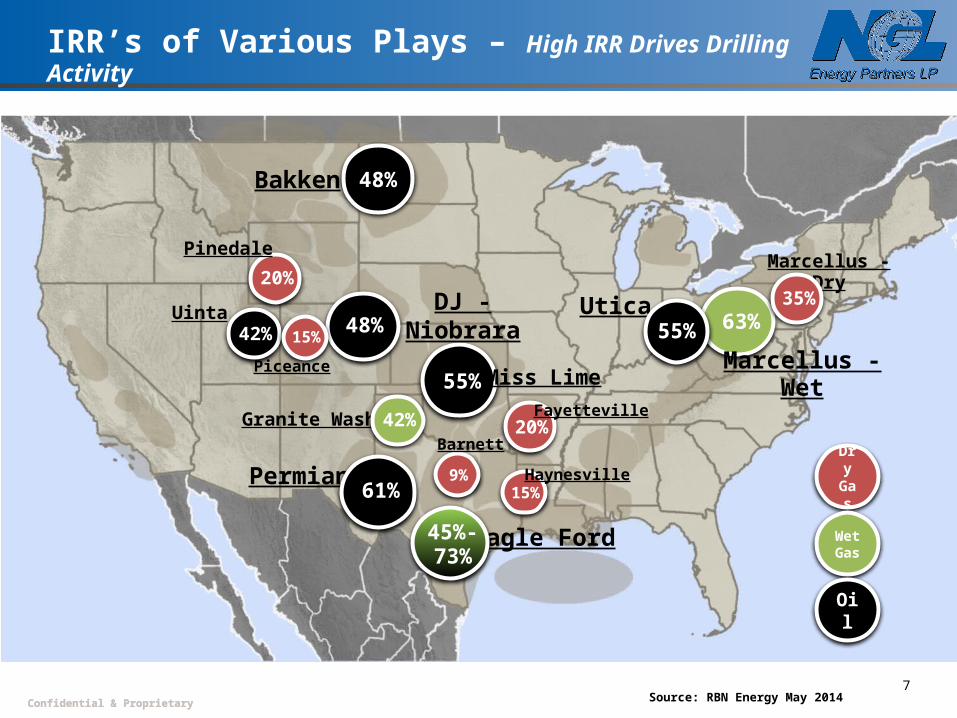
Source: RBN Energy May 2014
Utica
Marcellus - Dry
Uinta
Dry Gas
Wet Gas
Oil
20%
Piceance
Permian
Bakken
DJ -Niobrara
Eagle Ford
48%
Granite Wash
Miss Lime55%
42%
42%
Pinedale
IRR’s of Various Plays – High IRR Drives Drilling Activity
9%15%
15%
20%
48%35%
63%55%
45%-73%
61%Haynesville
Fayetteville
Barnett
Marcellus - Wet
• Confidential & Proprietary• Confidential & Proprietary
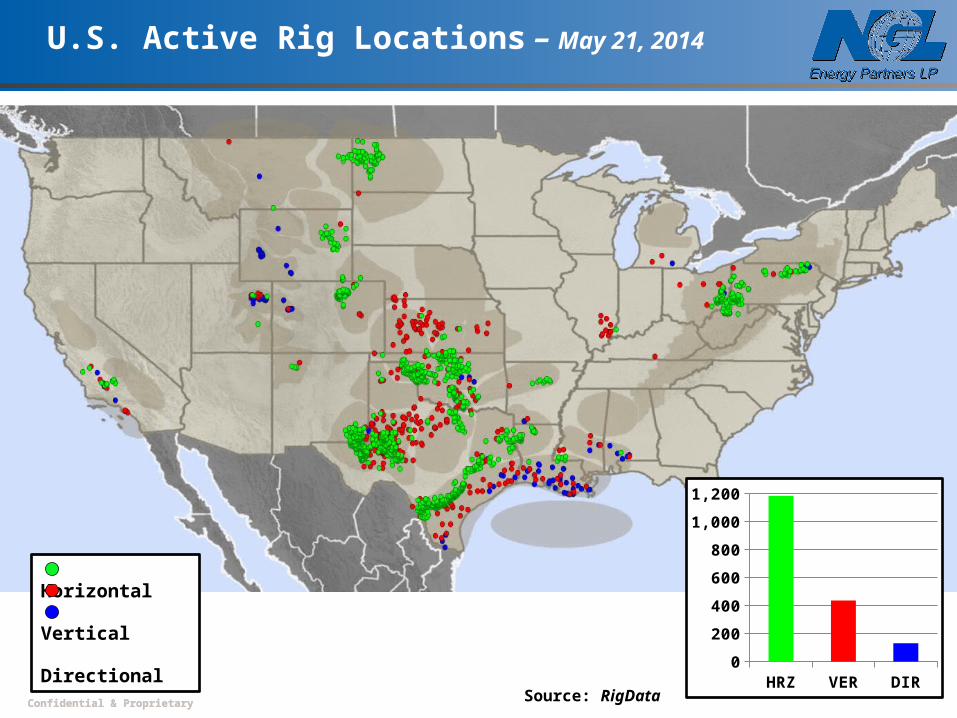
U.S. Active Rig Locations – May 21, 2014
Source: RigData
Horizontal Vertical Directional
HRZ VER DIR0
200
400
600
800
1,000
1,200
• Confidential & Proprietary• Confidential & Proprietary
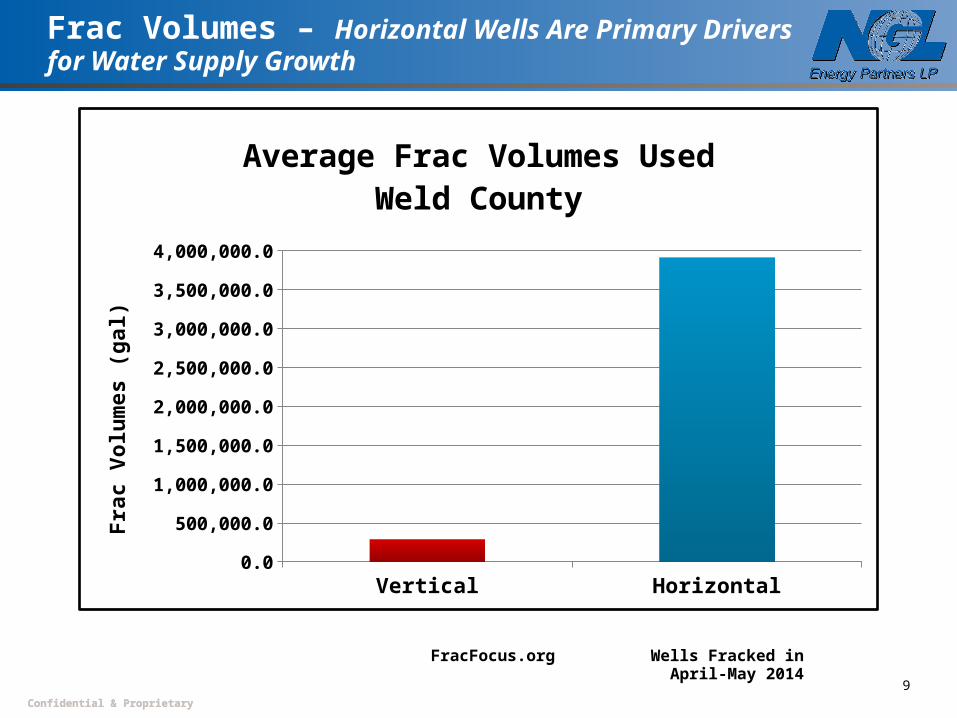
Frac Volumes – Horizontal Wells Are Primary Drivers for Water Supply Growth
9
FracFocus.org Wells Fracked in April-May 2014
Vertical Horizontal0.0
500,000.0
1,000,000.0
1,500,000.0
2,000,000.0
2,500,000.0
3,000,000.0
3,500,000.0
4,000,000.0
Average Frac Volumes UsedWeld County
Frac
Vol
umes
(gal
)
• Confidential & Proprietary• Confidential & Proprietary
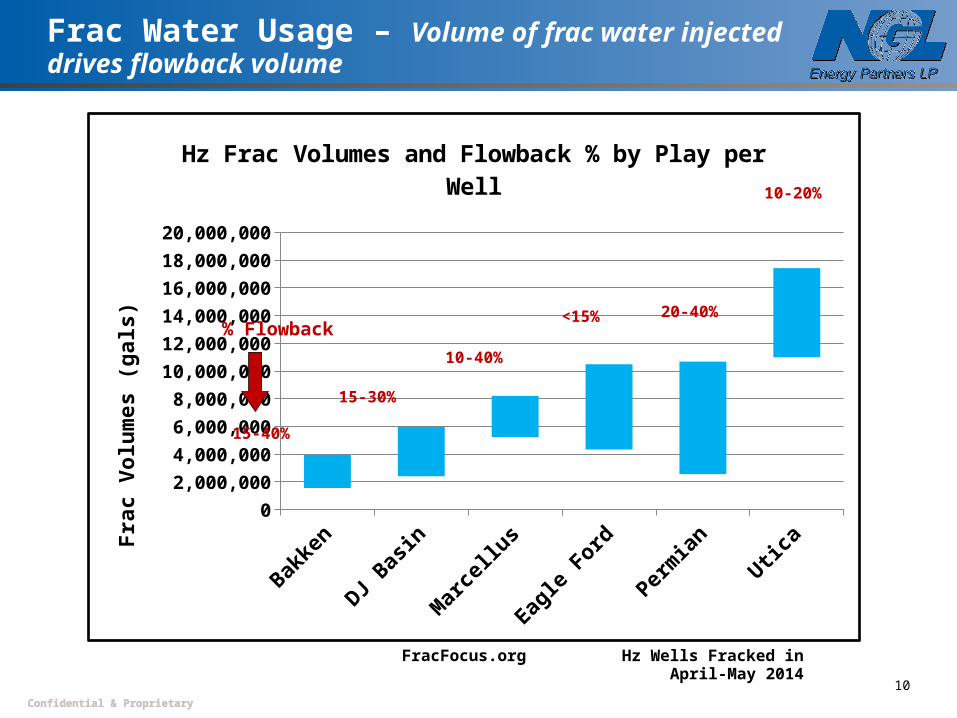
Frac Water Usage – Volume of frac water injected drives flowback volume
10
FracFocus.org Hz Wells Fracked in April-May 2014
Bakke
n
DJ Bas
in
Mar
cellu
s
Eagle
Ford
Perm
ian
Utica
0
2,000,000
4,000,000
6,000,000
8,000,000
10,000,000
12,000,000
14,000,000
16,000,000
18,000,000
20,000,000
Hz Frac Volumes and Flowback % by Play per WellF
rac
Vo
lum
es
(g
als
)
15-4
0%15
-30%
10-4
0%<1
5%20
-40%
10-2
0%
% Flowback
• Confidential & Proprietary• Confidential & Proprietary
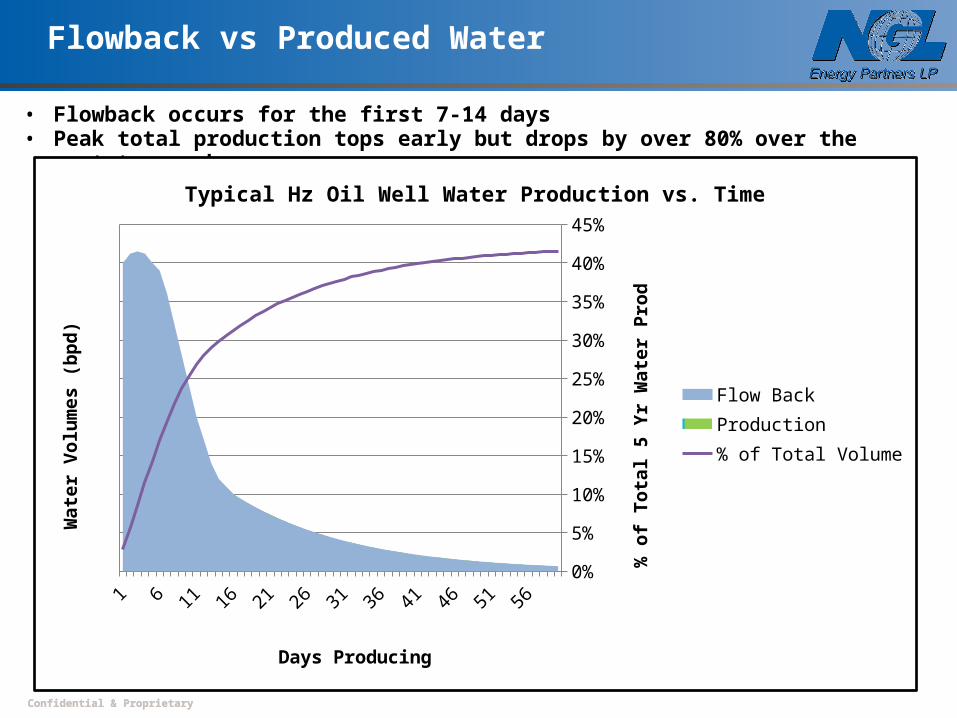
Flowback vs Produced Water
11
• Flowback occurs for the first 7-14 days• Peak total production tops early but drops by over 80% over the next two weeks
1 5 9 13 17 21 25 29 33 37 41 45 49 53 570%
5%
10%
15%
20%
25%
30%
35%
40%
45%
Typical Hz Oil Well Water Production vs. Time
Flow BackProduction% of Total Volume
Days Producing
Wa
ter
Vo
lum
es
(b
pd
)
% o
f T
ota
l 5 Y
r W
ate
r P
rod
• Confidential & Proprietary• Confidential & Proprietary
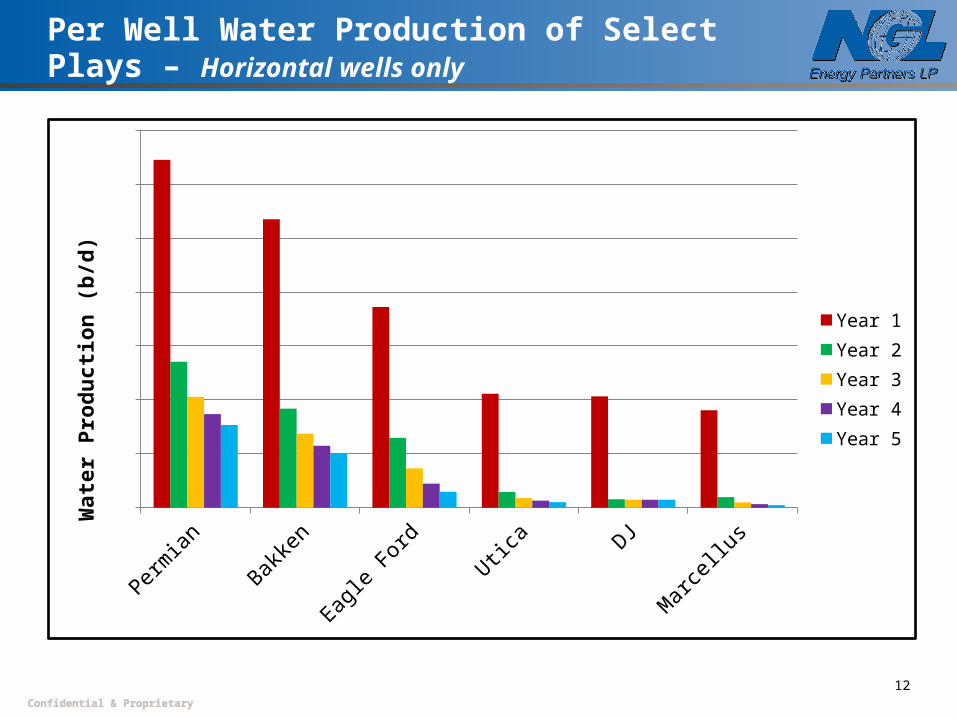
Per Well Water Production of Select Plays – Horizontal wells only
Year 1Year 2Year 3Year 4Year 5
Wa
ter
Pro
du
cti
on
(b
/d)
12
• Confidential & Proprietary• Confidential & Proprietary
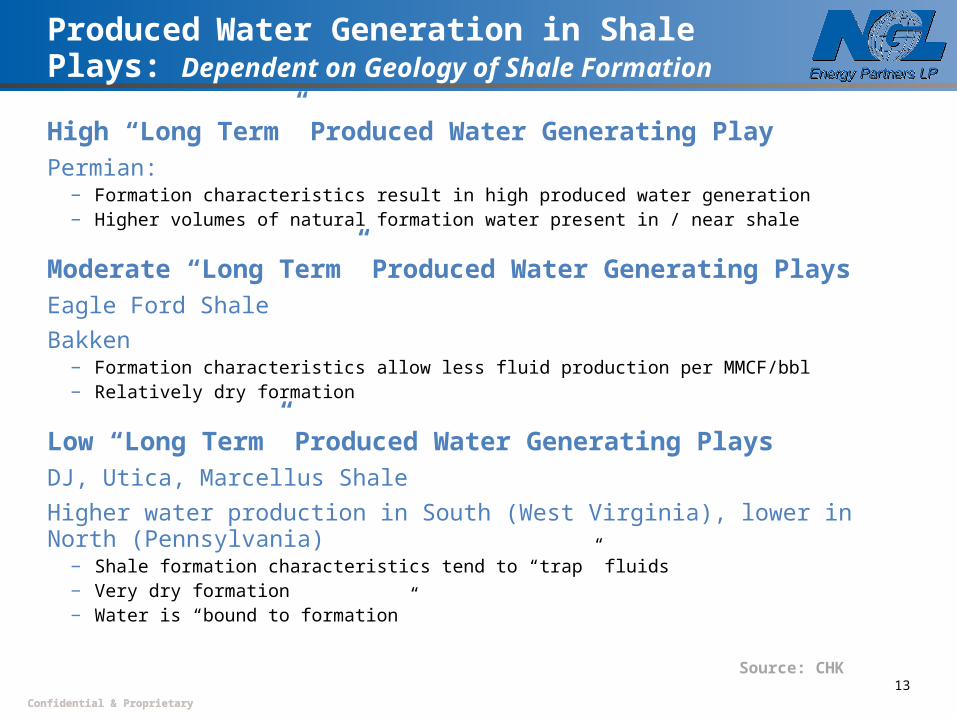
Produced Water Generation in Shale Plays: Dependent on Geology of Shale Formation
High “Long Term” Produced Water Generating PlayPermian:
− Formation characteristics result in high produced water generation− Higher volumes of natural formation water present in / near shale
Moderate “Long Term” Produced Water Generating PlaysEagle Ford Shale
Bakken− Formation characteristics allow less fluid production per MMCF/bbl− Relatively dry formation
Low “Long Term” Produced Water Generating PlaysDJ, Utica, Marcellus Shale
Higher water production in South (West Virginia), lower in North (Pennsylvania)− Shale formation characteristics tend to “trap” fluids− Very dry formation− Water is “bound to formation”
Source: CHK13
• Confidential & Proprietary• Confidential & Proprietary
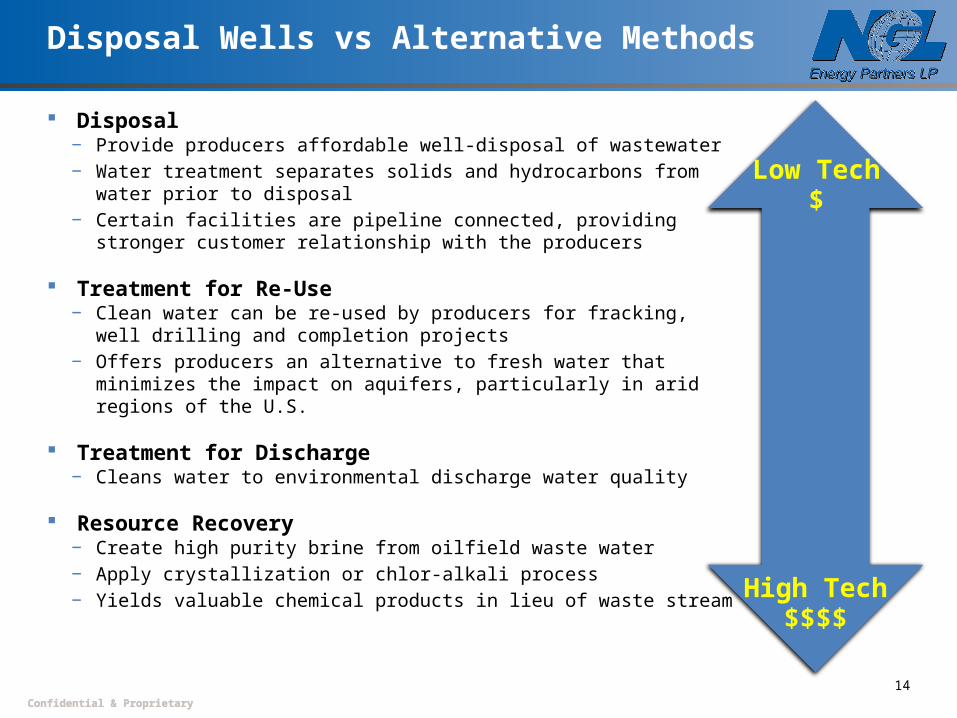
Disposal Wells vs Alternative Methods
Disposal− Provide producers affordable well-disposal of wastewater − Water treatment separates solids and hydrocarbons from water prior to
disposal− Certain facilities are pipeline connected, providing stronger customer
relationship with the producers
Treatment for Re-Use− Clean water can be re-used by producers for fracking, well drilling and
completion projects− Offers producers an alternative to fresh water that minimizes the impact on
aquifers, particularly in arid regions of the U.S.
Treatment for Discharge − Cleans water to environmental discharge water quality
Resource Recovery− Create high purity brine from oilfield waste water− Apply crystallization or chlor-alkali process− Yields valuable chemical products in lieu of waste stream
14
Low Tech$
High Tech$$$$
• Confidential & Proprietary• Confidential & Proprietary
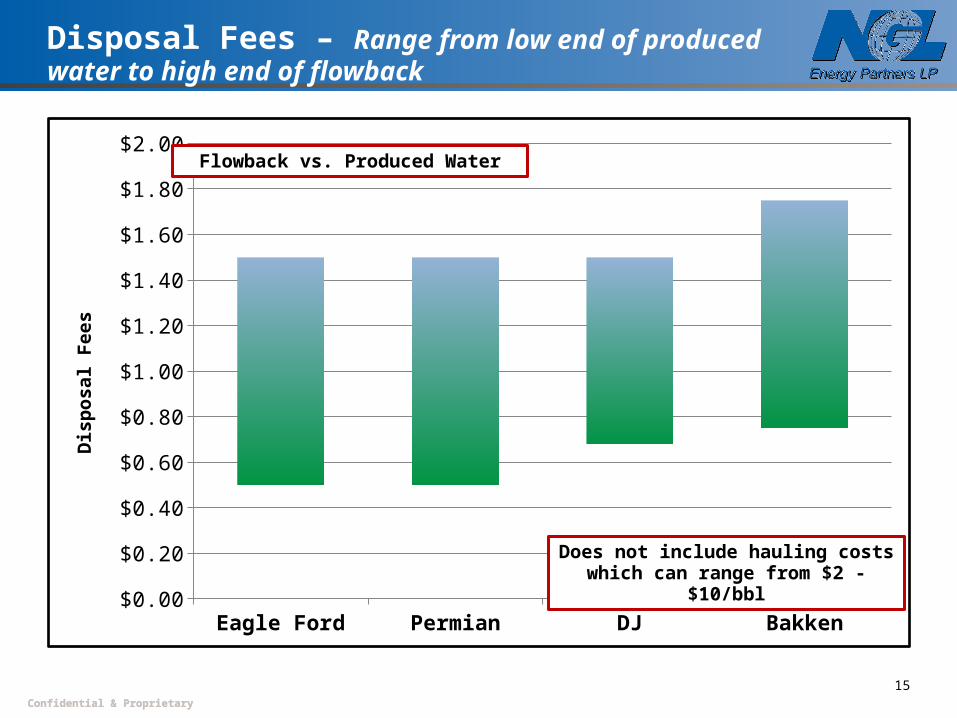
Disposal Fees – Range from low end of produced water to high end of flowback
15
Eagle Ford Permian DJ Bakken$0.00
$0.20
$0.40
$0.60
$0.80
$1.00
$1.20
$1.40
$1.60
$1.80
$2.00
Dis
po
sa
l Fe
es
Does not include hauling costs which can range from $2 - $10/bbl
Flowback vs. Produced Water
• Confidential & Proprietary• Confidential & Proprietary
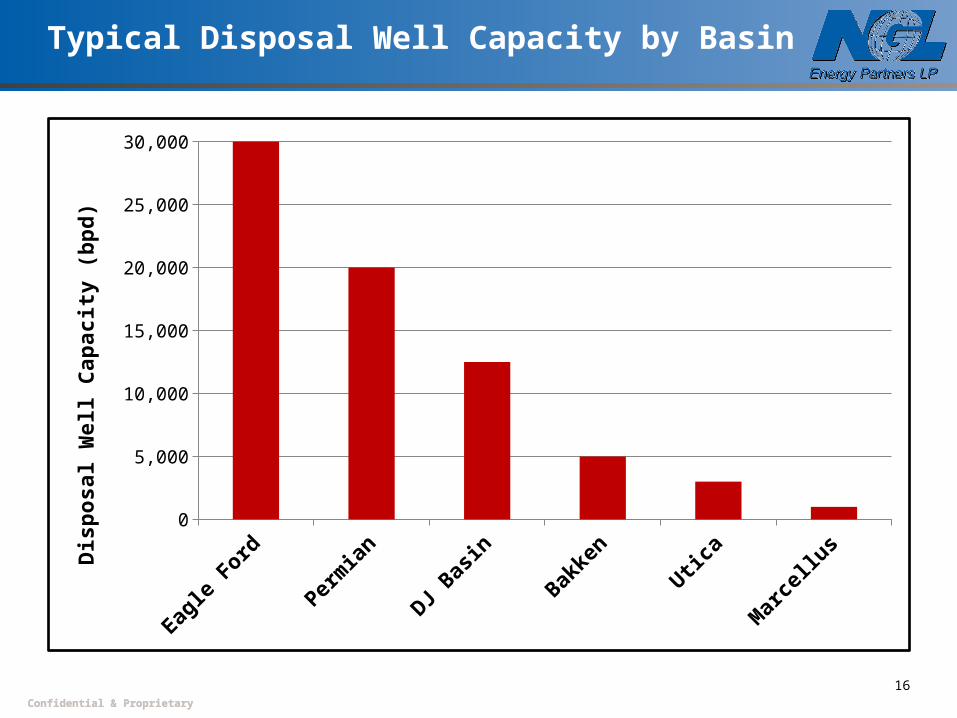
Typical Disposal Well Capacity by Basin
16
0
5,000
10,000
15,000
20,000
25,000
30,000
Dis
po
sa
l W
ell
Ca
pa
cit
y (
bp
d)
• Confidential & Proprietary• Confidential & Proprietary17
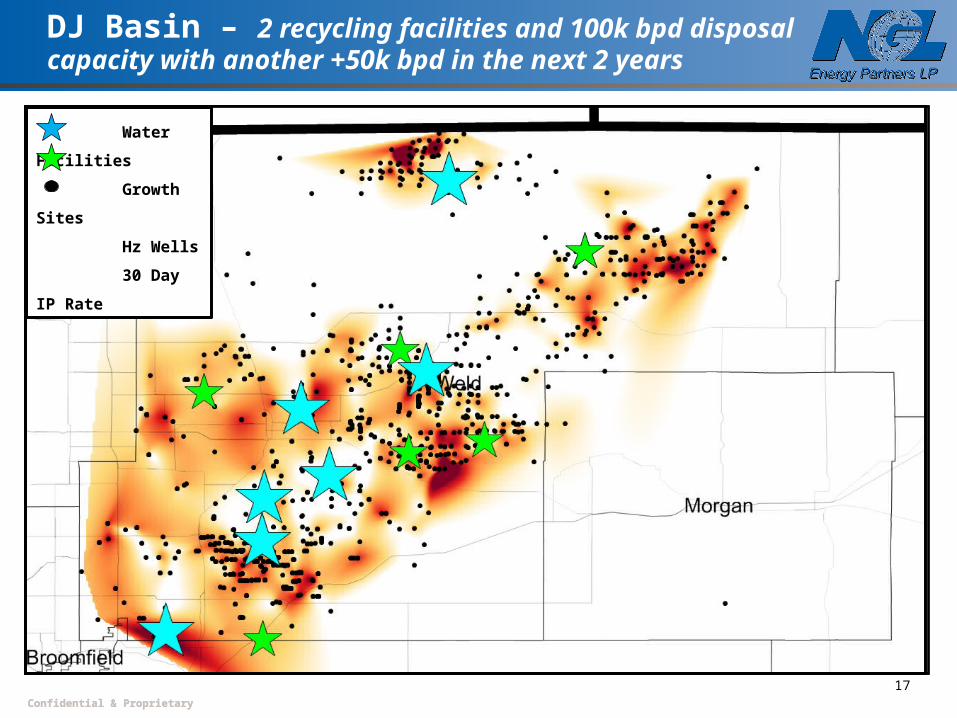
DJ Basin – 2 recycling facilities and 100k bpd disposal capacity with another +50k bpd in the next 2 years
Water Facilities
Growth Sites
Hz Wells
30 Day IP Rate
• Confidential & Proprietary• Confidential & Proprietary
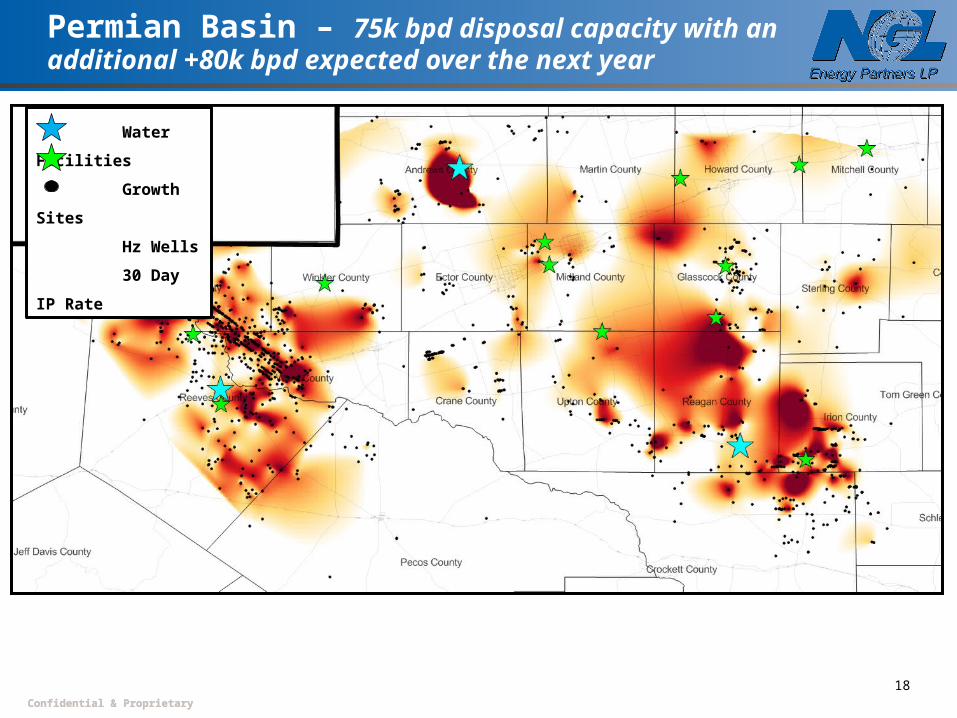
Permian Basin – 75k bpd disposal capacity with an additional +80k bpd expected over the next year
18
Water Facilities
Growth Sites
Hz Wells
30 Day IP Rate
• Confidential & Proprietary• Confidential & Proprietary
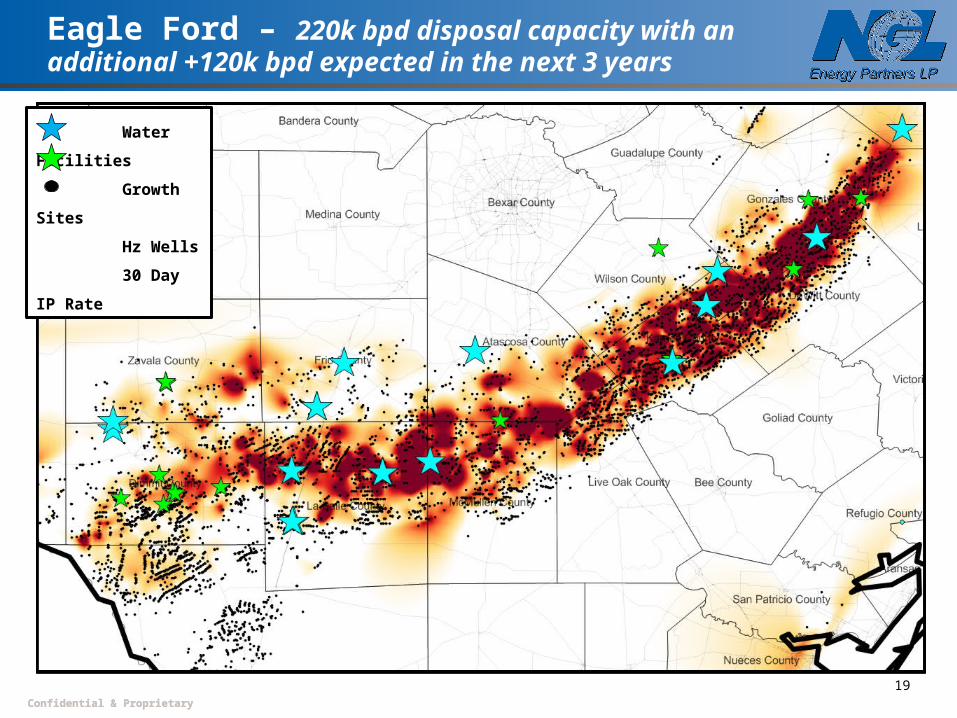
Eagle Ford – 220k bpd disposal capacity with an additional +120k bpd expected in the next 3 years
19
Water Facilities
Growth Sites
Hz Wells
30 Day IP Rate
• Confidential & Proprietary• Confidential & Proprietary
Conclusions
20
• High IRR plays incentivize drilling activity
• Horizontal drilling activity is the largest driver of waste water production
• Frac volumes and geology determine flowback volumes
• Treatment, recycle, reuse and/or disposal used for wastewater management, but typically disposal wells are the most cost effective when viable
• Disposal well viability hinges on geology, water quality, water quantity and economics
• NGL Water Solutions has a DBOO business model that provides customized wastewater management solutions
• Confidential & Proprietary• Confidential & Proprietary
Eric PetersonStrategic Planning & Market [email protected]
21
Contact Information
Greg BlaisVP – Business [email protected]