Embed Size (px)
Citation preview
POPULATION
GCSE Past Questions (2003-2014)Over time the global population increases and the population structures of
different countries change.
The exponential rate of world population growth.
1 (a) Study Figure 1 on the insert, a map showing the annual population change for all countries of the world in 2009.1 (a) (i) Which continent had the highest rate of annual population change in 2009? (1 mark) 20131 (a) (ii) What was the rate of annual population change in Germany in 2009? ............... %(1 mark) 20131 (a) (iii) Describe the world pattern of population change shown in Figure 1. (3 marks)2013
1 (c) Study Figures 4a, 4b and 4c on the insert.1 (c) (i) What type of map is shown in Figures 4b and 4c? Circle the correct answer.
Choropleth physical topological (1 mark) 2012
1 (c) (ii) Using Figures 4b and 4c, describe the link between annual population growth and the number of females who are illiterate (cannot read or write).(4 marks) 2012
1(a) (i) What is the meaning of the term ‘natural increase’ of population? (1 mark)2006
1(ii) Study Figure 1, a graph of world population growth.
Using Figure 1, describe the growth of population in LEDCs and MEDCs. (4 marks)2006
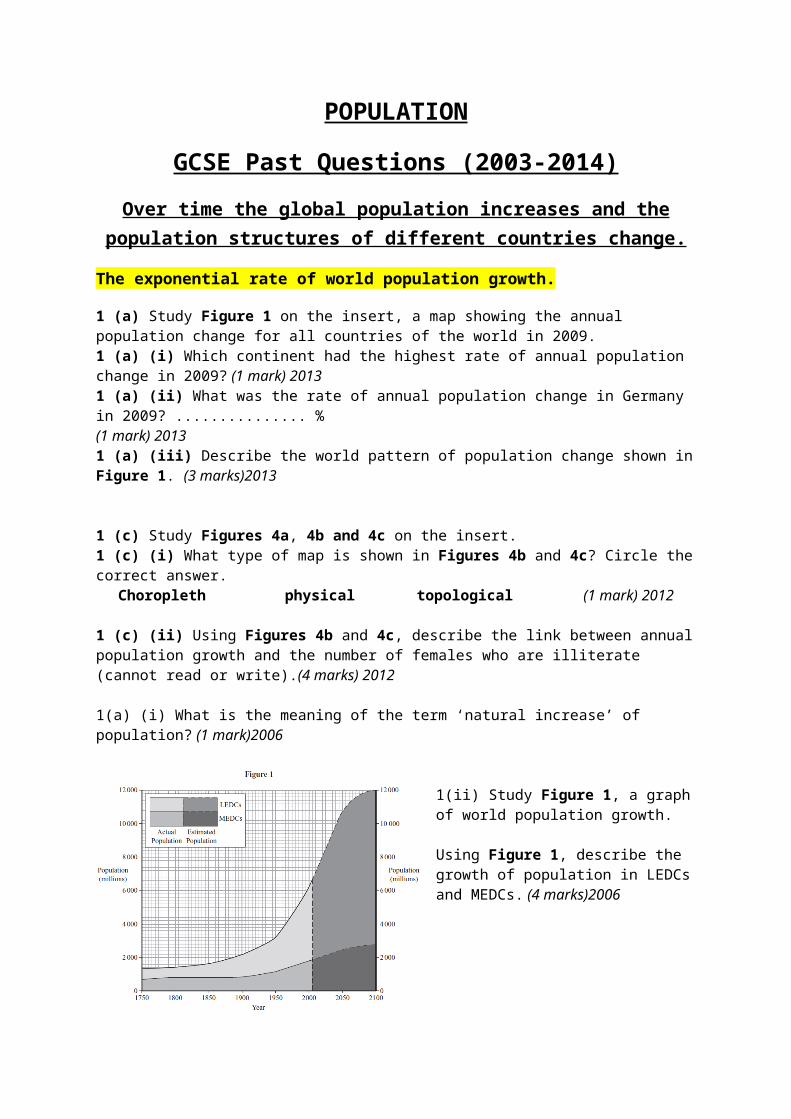
Describe the pattern of population density shown on the map. (4 marks) 2003
Countries pass through different stages of population growth as shown in the five stages of the Demographic Transition Model
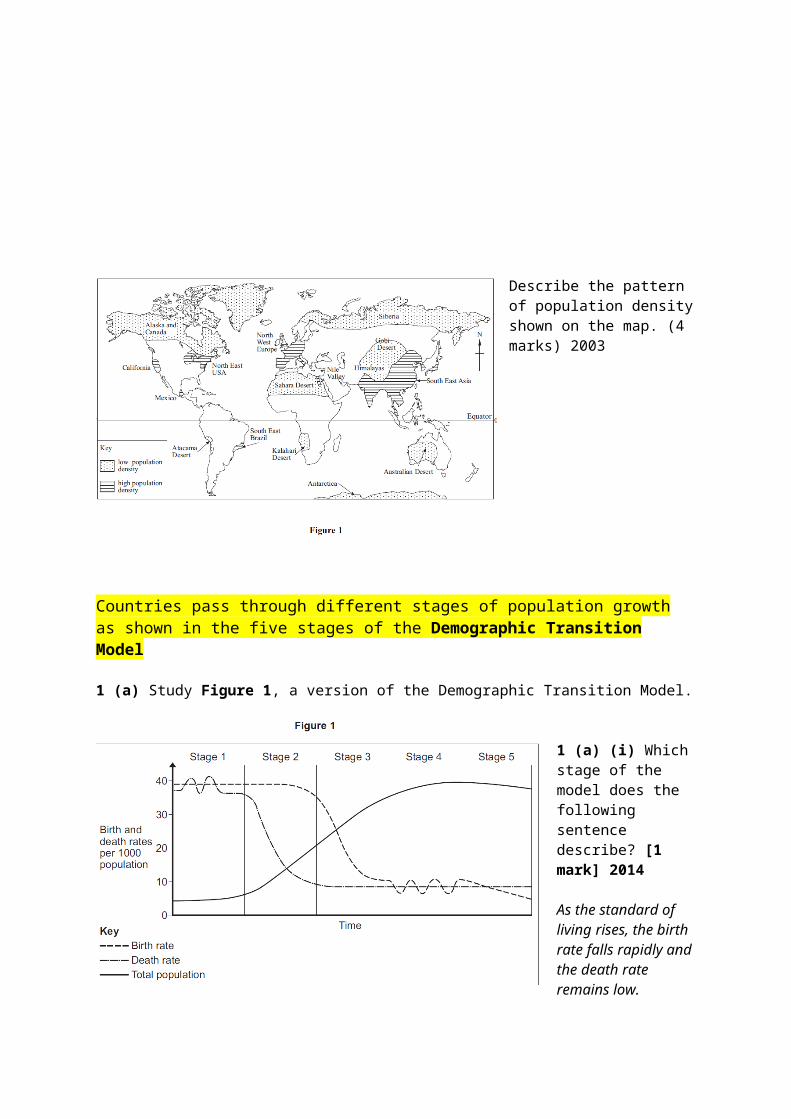
1 (a) Study Figure 1, a version of the Demographic Transition Model.
1 (a) (i) Which stage of the model does the following sentence describe? [1 mark] 2014
As the standard of living rises, the birth rate falls rapidly and the death rate remains low.
1 (a) (ii) Draw a labelled sketch of a population pyramid for a country in stage 2 of theDemographic Transition Model. [3 marks] 2014
1 (a) (iii) Describe how the structure of a country’s population changes between stages 2 and 4 of the Demographic Transition Model. [3 marks] 2014
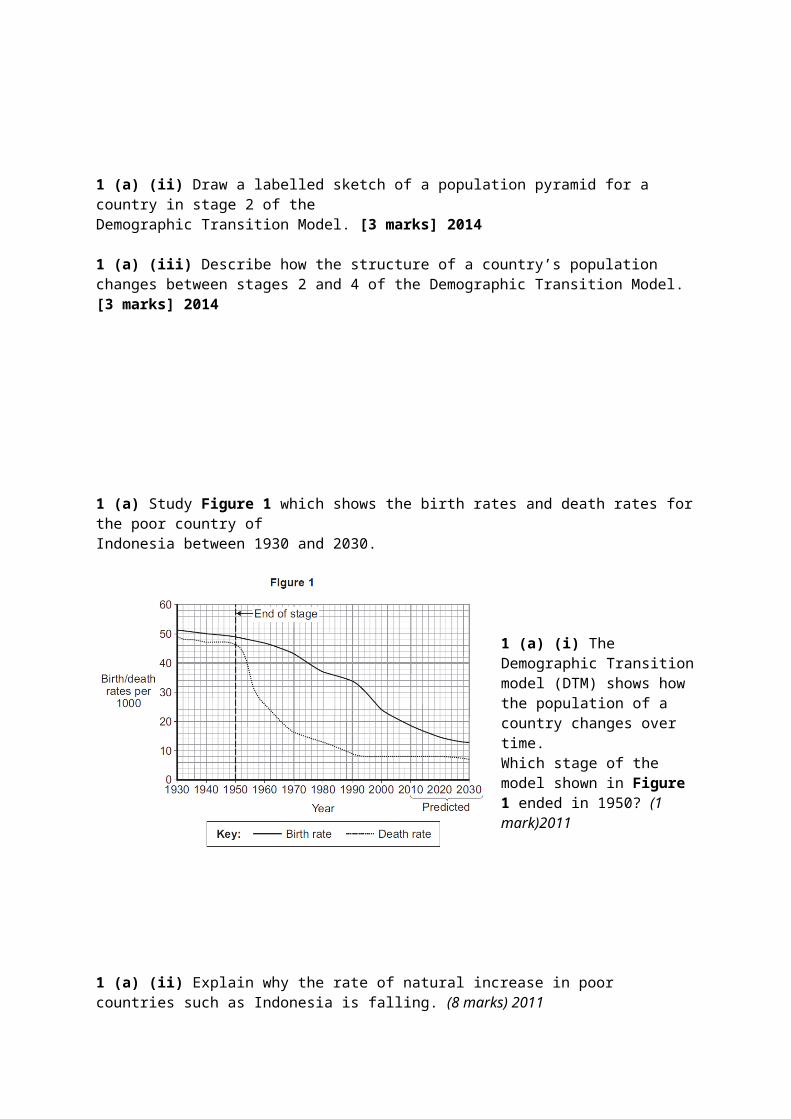
1 (a) Study Figure 1 which shows the birth rates and death rates for the poor country ofIndonesia between 1930 and 2030.
1 (a) (i) The Demographic Transition model (DTM) shows how the population of a country changes over time.Which stage of the model shown in Figure 1 ended in 1950? (1 mark)2011
1 (a) (ii) Explain why the rate of natural increase in poor countries such as Indonesia is falling. (8 marks) 2011
1 (a) Study the following table which shows the changes during the first four stages of the Demographic Transition Model.1 (a) (i) Complete the table by writing in the correct phrases. Choose your answers from the following list. (2009)
Falls rapidly Low and fluctuating Rises rapidly High and steady
1 (a) (ii) Explain birth rate changes over the four stages of the model. (4 marks 2009)1 (a) (iii) It is suggested that some countries have entered a stage 5 of the model.Explain why a stage 5 has been recognised in some countries. (2 marks)(2009)
1 (a) (iii) Give two ways that population structure changes when a country has entered Stage 5 of the Demographic Transition Model. (2 marks) 2008
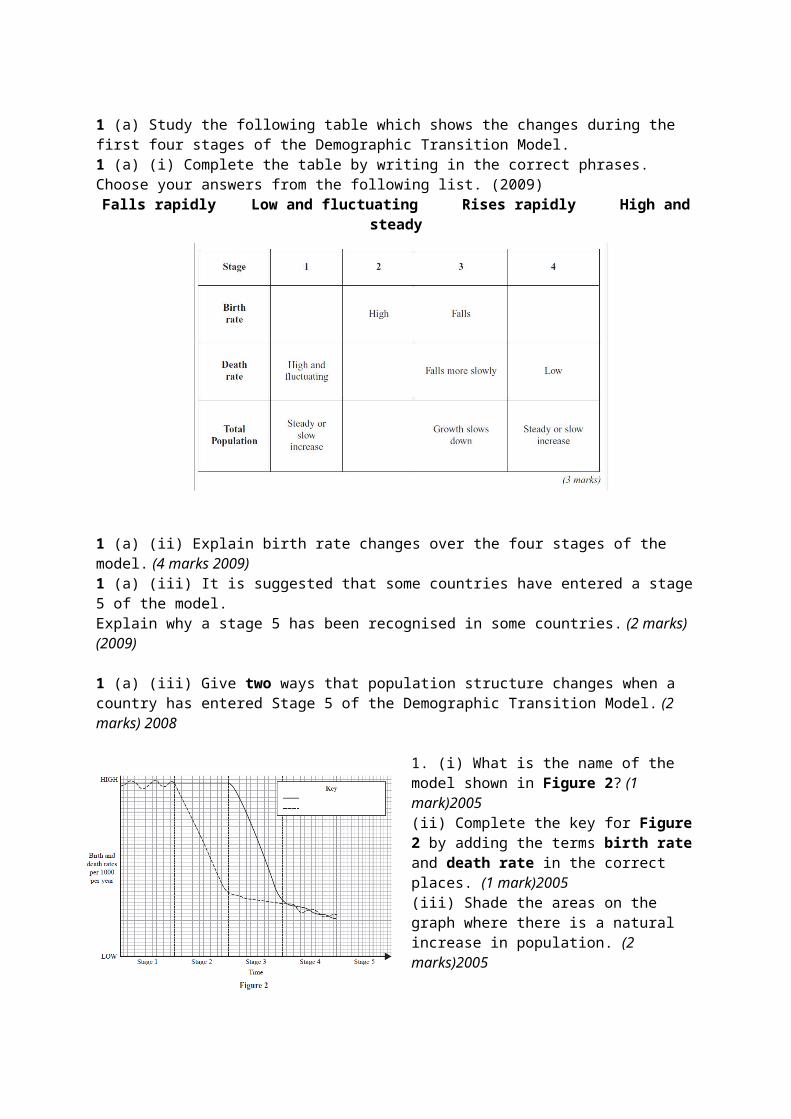
1. (i) What is the name of the model shown in Figure 2? (1 mark)2005(ii) Complete the key for Figure 2 by adding the terms birth rate and death rate in the correct places. (1 mark)2005(iii) Shade the areas on the graph where there is a natural increase in population. (2 marks)2005(iv) Explain how and why the natural increase in population changes in Stage 2 of the model. (4 marks)2005Some MEDCs are said to have entered Stage 5 of the model. Complete Figure 2 to show what happens to the birth rate and the death rate in
Stage 5. (2 marks) 2005
Changing population structure. (Population Pyramids)
1 (c) Study Figure 3 on the insert, a diagram showing the population structure of the UK in 2009 and 2050 (predicted). 1 (c) (i) Describe the changes in the UK population structure shown in Figure 3. (4 marks) 2013
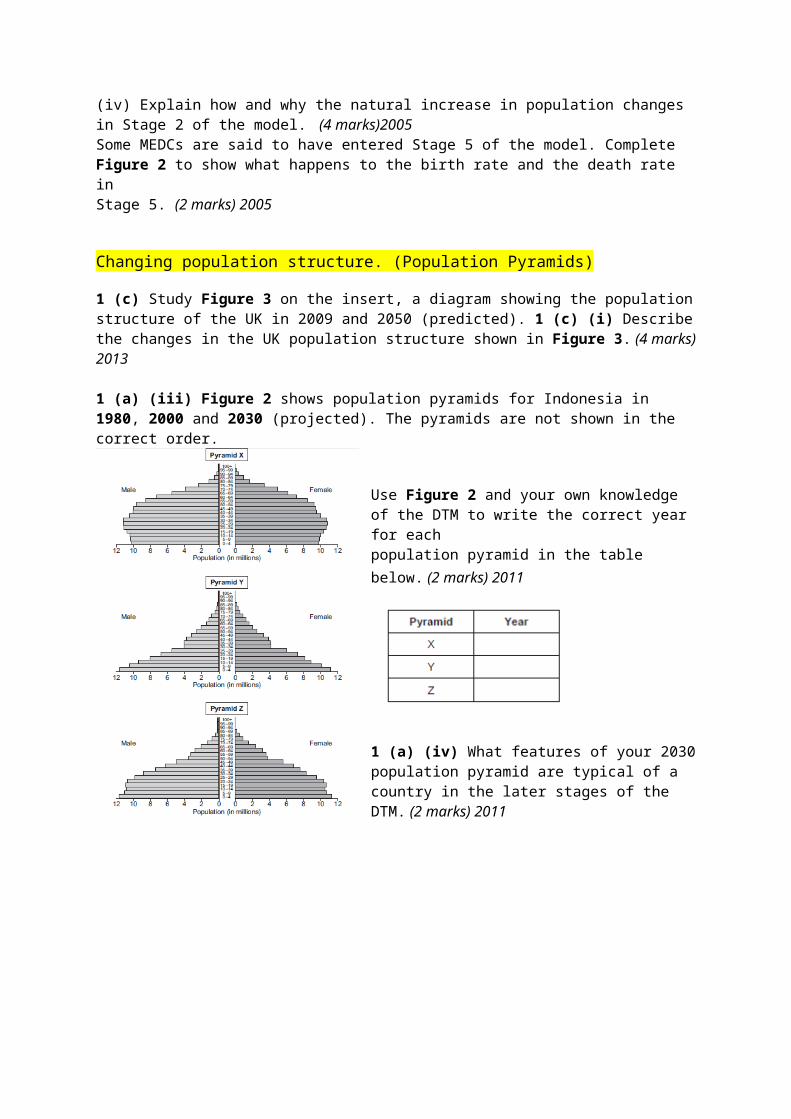
1 (a) (iii) Figure 2 shows population pyramids for Indonesia in 1980, 2000 and 2030 (projected). The pyramids are not shown in the correct order.
Use Figure 2 and your own knowledge of the DTM to write the correct year for eachpopulation pyramid in the table below. (2 marks) 2011
1 (a) (iv) What features of your 2030 population pyramid are typical of a country in the later stages of the DTM. (2 marks) 2011
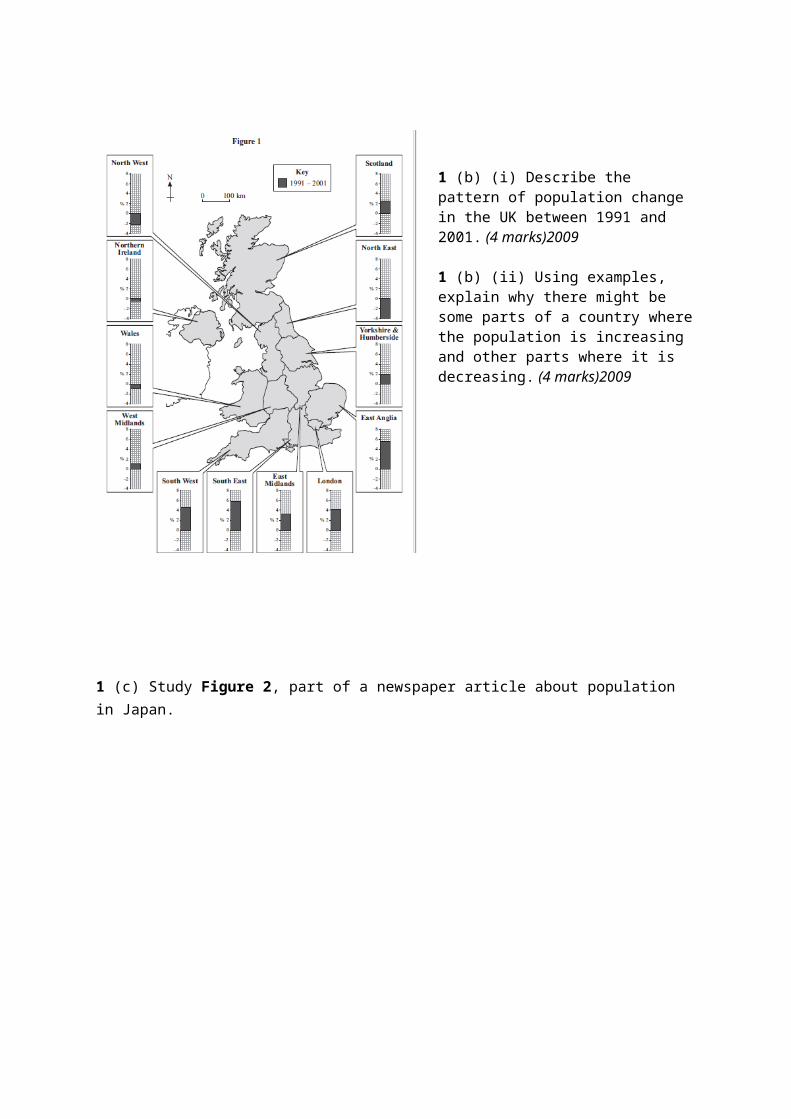
1 (b) (i) Describe the pattern of population change in the UK between 1991 and 2001. (4 marks)2009
1 (b) (ii) Using examples, explain why there might be some parts of a country where the population is increasing and other parts where it is decreasing. (4 marks)2009
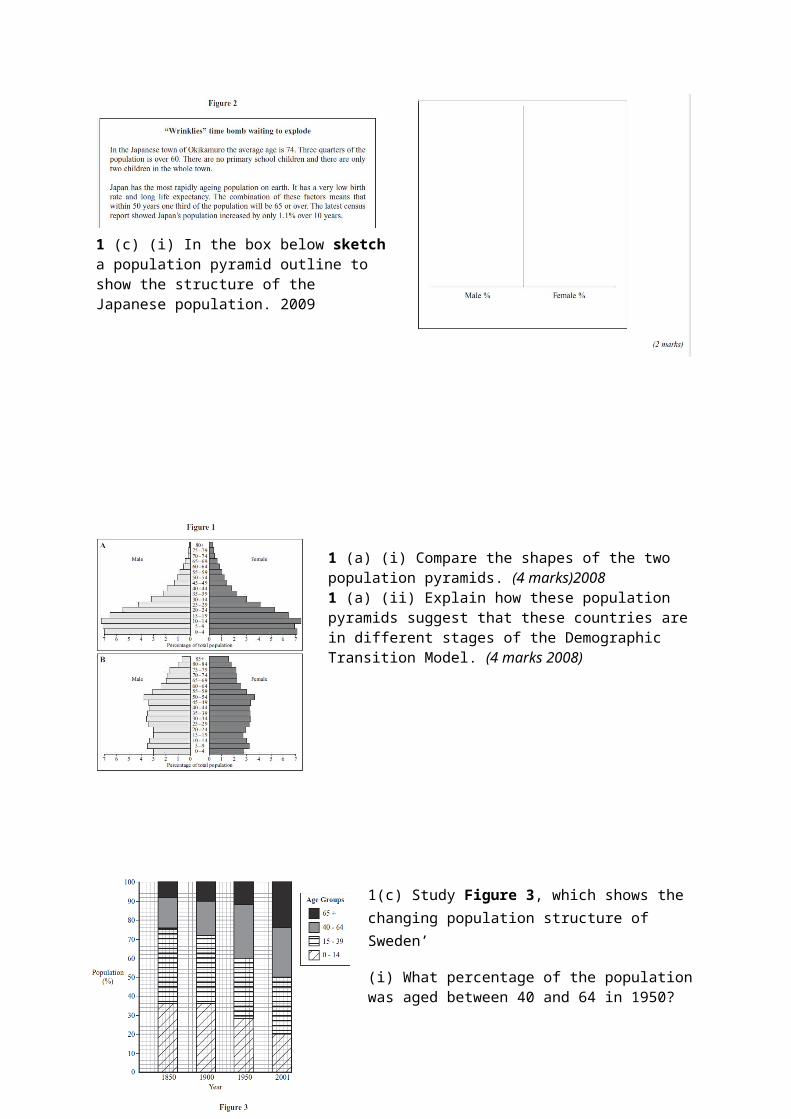
1 (c) Study Figure 2, part of a newspaper article about population in Japan.
1 (c) (i) In the box below sketch a population pyramid outline to show the structure of theJapanese population. 2009
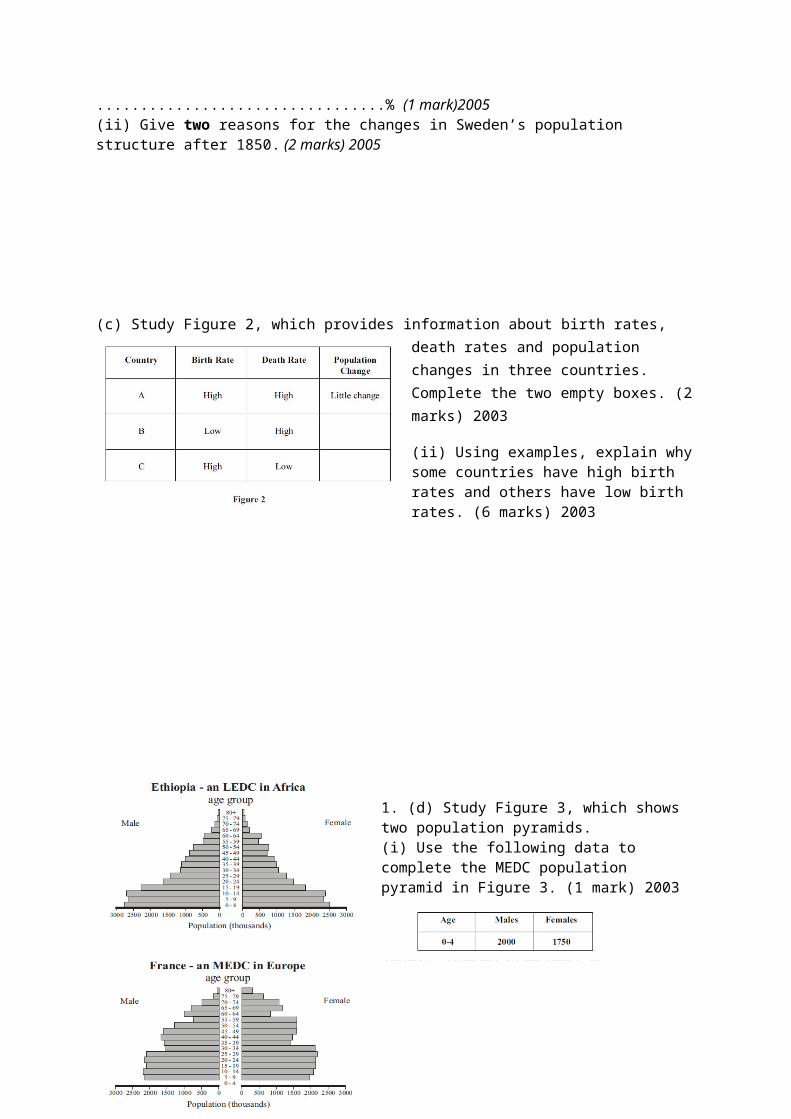
1 (a) (i) Compare the shapes of the two population pyramids. (4 marks)20081 (a) (ii) Explain how these population pyramids suggest that these countries are in different stages of the Demographic Transition Model. (4 marks 2008)
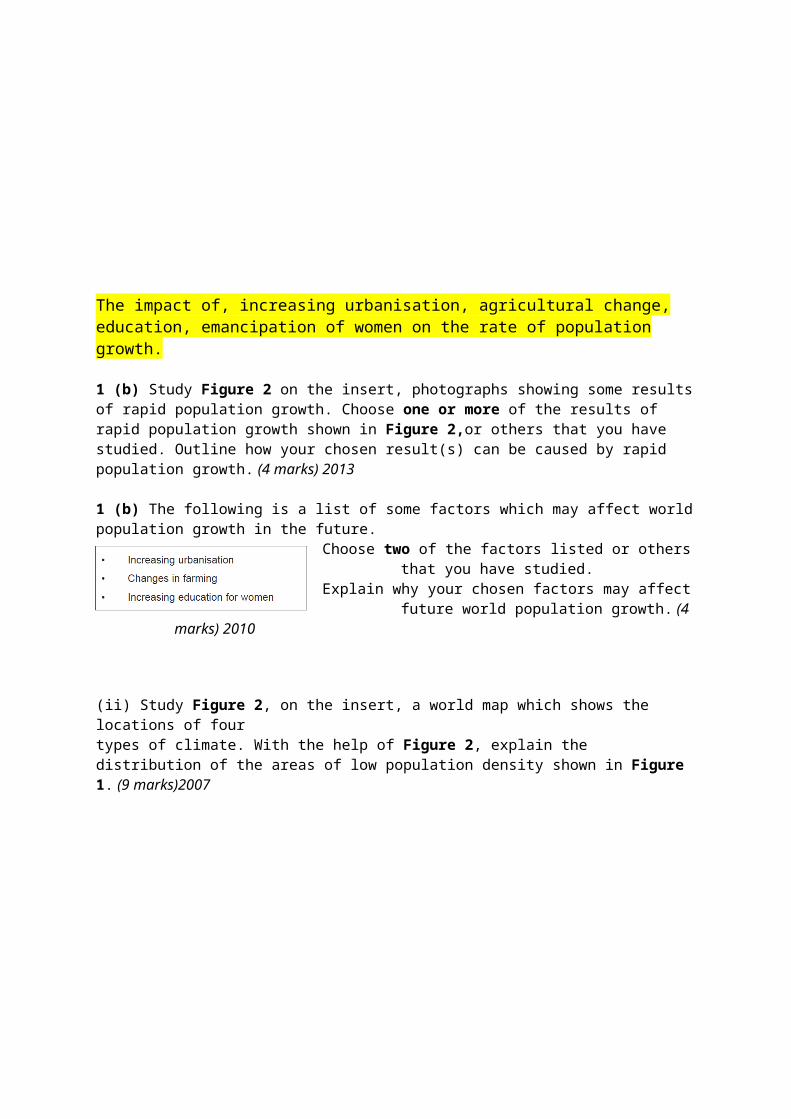
1(c) Study Figure 3, which shows the changing population structure of Sweden’
(i) What percentage of the population was aged between 40 and 64 in 1950?.................................% (1 mark)2005(ii) Give two reasons for the changes in Sweden’s population structure after 1850. (2 marks) 2005
(c) Study Figure 2, which provides information about birth rates, death rates and population changes in three countries. Complete the two empty boxes. (2 marks) 2003
(ii) Using examples, explain why some countries have high birth rates and others have low birth rates. (6 marks) 2003
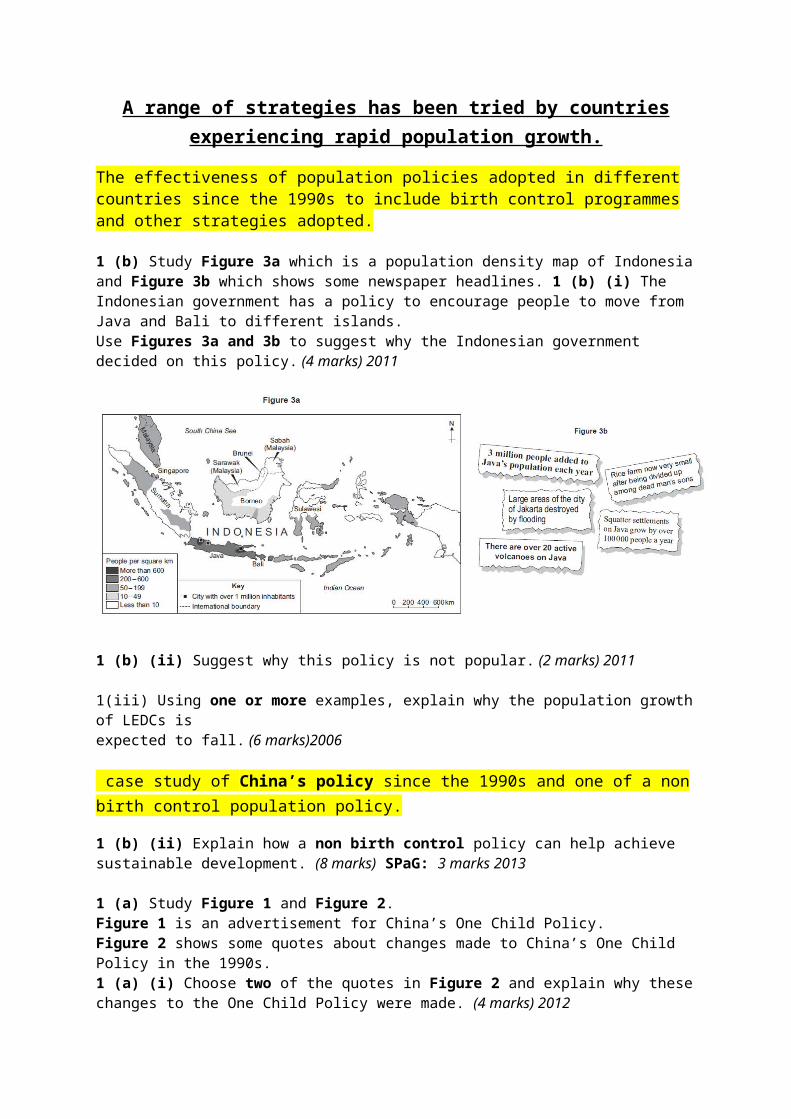
1. (d) Study Figure 3, which shows two population pyramids.(i) Use the following data to complete the MEDC population pyramid in Figure 3. (1 mark) 2003
The impact of, increasing urbanisation, agricultural change, education, emancipation of women on the rate of population growth.
1 (b) Study Figure 2 on the insert, photographs showing some results of rapid population growth. Choose one or more of the results of rapid population growth shown in Figure 2,or others that you
have studied. Outline how your chosen result(s) can be caused by rapid population growth. (4 marks) 2013
1 (b) The following is a list of some factors which may affect world population growth in the future. Choose two of the factors listed or others that you have
studied. Explain why your chosen factors may affect future world
population growth. (4 marks) 2010
(ii) Study Figure 2, on the insert, a world map which shows the locations of fourtypes of climate. With the help of Figure 2, explain the distribution of the areas of low population density shown in Figure 1. (9 marks)2007
A range of strategies has been tried by countries experiencing rapid population growth.
The effectiveness of population policies adopted in different countries since the 1990s to include birth control programmes and other strategies adopted.
1 (b) Study Figure 3a which is a population density map of Indonesia and Figure 3b which shows some newspaper headlines. 1 (b) (i) The Indonesian government has a policy to encourage people to move from Java and Bali to different islands.Use Figures 3a and 3b to suggest why the Indonesian government decided on this policy. (4 marks) 2011
1 (b) (ii) Suggest why this policy is not popular. (2 marks) 2011
1(iii) Using one or more examples, explain why the population growth of LEDCs isexpected to fall. (6 marks)2006
case study of China’s policy since the 1990s and one of a non birth control population policy.
1 (b) (ii) Explain how a non birth control policy can help achieve sustainable development. (8 marks) SPaG: 3 marks 2013
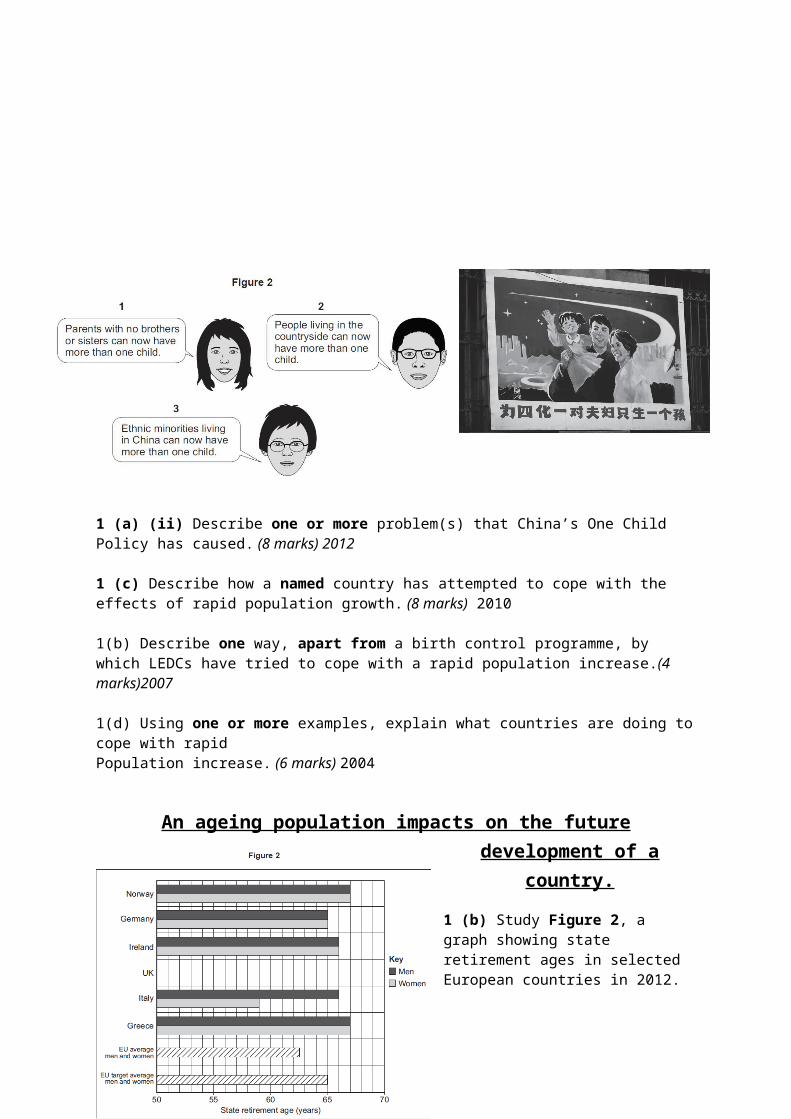
1 (a) Study Figure 1 and Figure 2.Figure 1 is an advertisement for China’s One Child Policy.Figure 2 shows some quotes about changes made to China’s One Child Policy in the 1990s.1 (a) (i) Choose two of the quotes in Figure 2 and explain why these changes to the One Child Policy were made. (4 marks) 2012
1 (a) (ii) Describe one or more problem(s) that China’s One Child Policy has caused. (8 marks) 2012
1 (c) Describe how a named country has attempted to cope with the effects of rapid population growth. (8 marks) 2010
1(b) Describe one way, apart from a birth control programme, by which LEDCs have tried to cope with a rapid population increase.(4 marks)2007
1(d) Using one or more examples, explain what countries are doing to cope with rapidPopulation increase. (6 marks) 2004
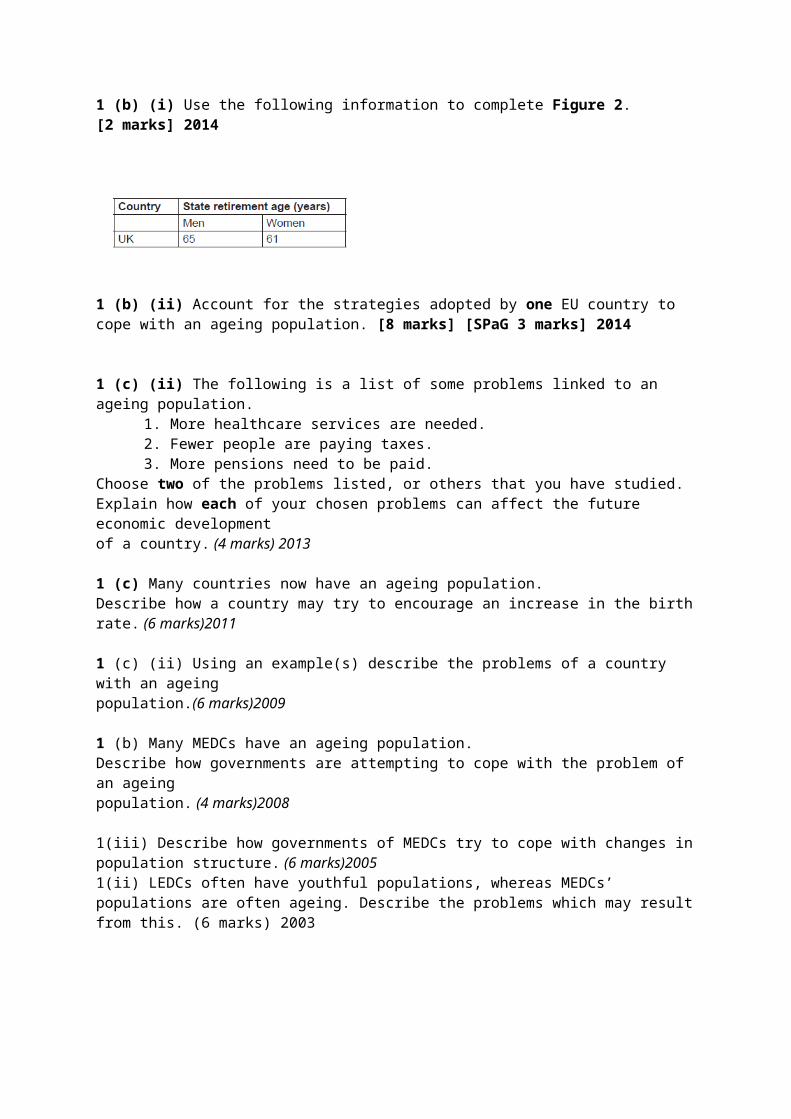
An ageing population impacts on the future development of a country.
1 (b) Study Figure 2, a graph showing state retirement ages in selected European countries in 2012.
1 (b) (i) Use the following information to complete Figure 2.[2 marks] 2014
1 (b) (ii) Account for the strategies adopted by one EU country to cope with an ageing population. [8 marks] [SPaG 3 marks] 2014
1 (c) (ii) The following is a list of some problems linked to an ageing population.1. More healthcare services are needed.2. Fewer people are paying taxes.3. More pensions need to be paid.
Choose two of the problems listed, or others that you have studied.Explain how each of your chosen problems can affect the future economic developmentof a country. (4 marks) 2013
1 (c) Many countries now have an ageing population.Describe how a country may try to encourage an increase in the birth rate. (6 marks)2011
1 (c) (ii) Using an example(s) describe the problems of a country with an ageingpopulation.(6 marks)2009
1 (b) Many MEDCs have an ageing population.Describe how governments are attempting to cope with the problem of an ageingpopulation. (4 marks)2008
1(iii) Describe how governments of MEDCs try to cope with changes in population structure. (6 marks)20051(ii) LEDCs often have youthful populations, whereas MEDCs’ populations are often ageing. Describe the problems which may result from this. (6 marks) 2003
Population movements impact on both the source regions of migrants and the receiving countries.
Migration is a result of decision making push and pull factors which can have positive and negative impacts.
1 (c) Study Figure 3, a cartoon about immigration and unemployment.
1 (c) (i) Explain the cartoon’s message about the impacts of migration on the receiving (host) country. [4 marks] 2014
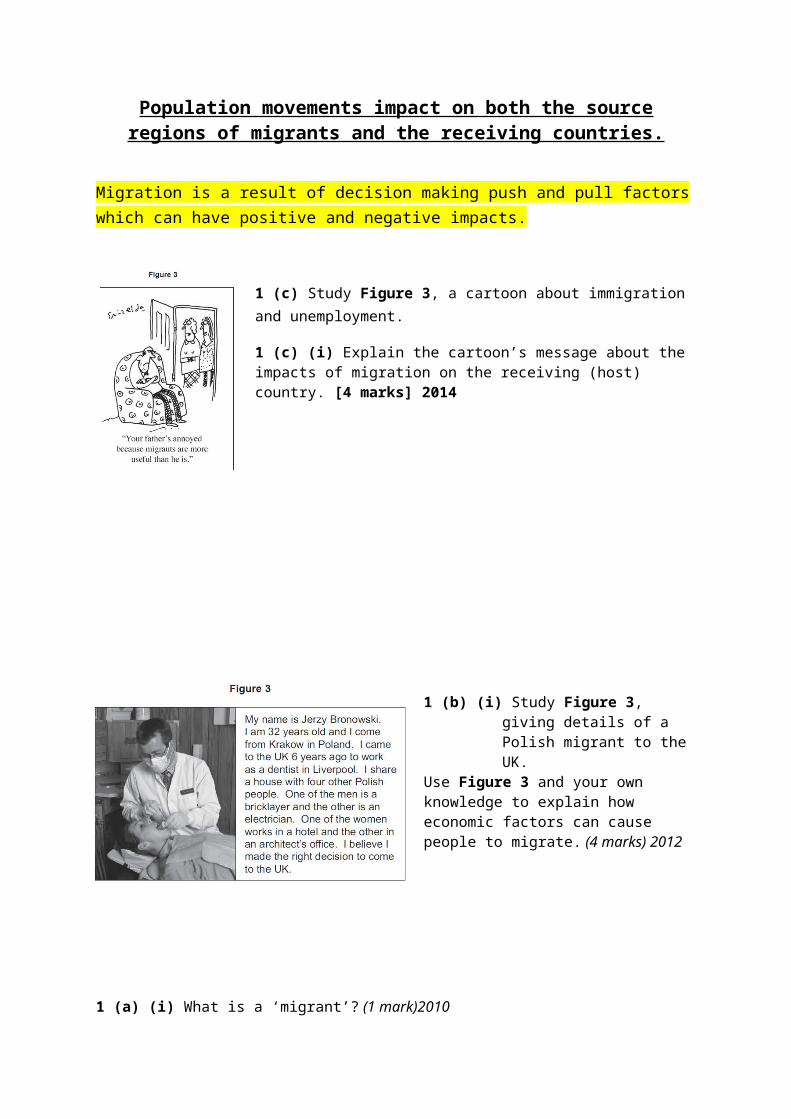
1 (b) (i) Study Figure 3, giving details of a Polish migrant to the UK.
Use Figure 3 and your own knowledge to explain how economic factors can cause people to migrate. (4 marks) 2012
1 (a) (i) What is a ‘migrant’? (1 mark)20101 (a) (ii) Study Figure 1, on the insert, a pie chart which shows the countries where migrant workers in Gloucestershire came from in 2007. Describe the pattern of the migrant workers’ home countries as shown in Figure 1. (4marks) 20101 (a) (iii) Explain the possible push factors and pull factors that encouraged these migrant workers to come to the UK. (4 marks)2010
1 (a) (i) With the help of examples, describe the following types of migration.Voluntary Forced (4 marks)2007
(i) Using Figure 2, give two push factors and two pull factors for the migration of people to Hong Kong since 1970.Push factors1 2 Pull factors1 2 (4 marks) 2006
(a) Study Figure 1, which shows migration in LEDCs
(i) Complete Boxes A and B by writing the correct labels in them from the following list:
Push factors to the city Push factors to the countryside Pull factors to the city Pull factors to the countryside
(2 marks) 2004
1. (ii) Describe some of the push factors that cause people to migrate to cities. (4 marks) 2004
Economic movements within the EU, refugee movements to the EU and the impacts of such movements.
1 (b) (ii) Describe two ways in which migration within the EU can have positive effects on
countries such as the UK. (4 marks) 2012
(a) (iv) Migration from a country may have positive and negative effects for that country. Describe these effects. (4 marks) 2010
(ii) Describe the advantages to migrants and their families of moving to a new country. (4 marks) 2007
1 (bii) Describe the advantages and disadvantages to a country or region of receiving immigrants. (6 marks)2006
1(b) People move from one country to another. Using examples, describe the advantages to the two countries involved. (6 marks) 2004