Embed Size (px)
Citation preview

HTA AND SAFETYSome results of the ATF / APF Project Group, an ongoing empirical investigation and some personal views
Tim FriedeDepartment of Medical StatisticsUniversity Medical Center GöttingenGöttingen, Germany

2
Joint project group "Analysis of adverse events at varying follow-up times in the context of benefit assessments“
Working Group Therapeutic Research (ATF) of the German Society for Medical Informatics, Biometrics and Epidemiology (GMDS)
Working Group Pharmaceutical Research (APF) of the German Region of the International Biometric Society (IBS-DR)
Members include statisticians from academia, pharmaceutical industry, BfArM and IQWiG
ATF / APF PROJECT GROUP
3
Worked commenced in Autumn 2016
Series of TC and F2F meetings
Output so far includes
Presentations
GMDS 2017 in Oldenburg
Biometric Colloquium 2018 in Frankfurt
Manuscript (almost final) draft
To be submitted to Pharmaceutical Statistics
ATF / APF PROJECT GROUP

4
PRESENTATION BIOMETRIC COLLOQUIUM 2018

5
DRAFT VERSION 15 MARCH 2018

6
Estimand frameworkEstimators: event probabilities and group comparisonsMeta-analysis
HIGHLIGHTS

7
ESTIMAND FRAMEWORK
DRAFT ICH E9 (R1) addendum

8
Classes of estimands proposed in the draft ICH E9 (R1) addendum
Treatment policy
Composite
Hypothetical
Principal stratum
While on treatment
Some criticism from HTA bodies …
CLASSES OF ESTIMANDS

9
Incidence proportion (# patients with AE within time t / n)
Underestimates AE probability in the presence of censoring
1 - Kaplan-Meier (censoring competing events)
Overestimates AE probability
Aalen-Johansen estimator of the cumulative incidence function
generalizes the KM estimator to multiple event types
Nelson-Aalen estimator of the cumulative hazard
cumulative nonparametric counterpart of commonly used incidence rate
ESTIMATING ADVERSE EVENT PROBABILITIES

10
Risk difference, relative risk or odds ratio of incidence proportion potentially misleading (comparing two quantities that both underestimate the probability of interest)
Alternatives include
Cox proportional hazards regression
Fine & Gray proportional subdistribution hazards model
Model not only the AE but also the censoring competing event
COMPARING TWO GROUPS

11
EXAMPLE

12
EXAMPLE

13
SIMPSON‘S PARADOX
http://en.wikipedia.org/wiki/Simpson%27s_paradox

14
In the context of HTA: Meta-analyses of (very) few studies common
Extent of between-trial heterogeneity
META-ANALYSES OF FEW STUDIES IN THE PRESENCE OF HETEROGENEITY
15
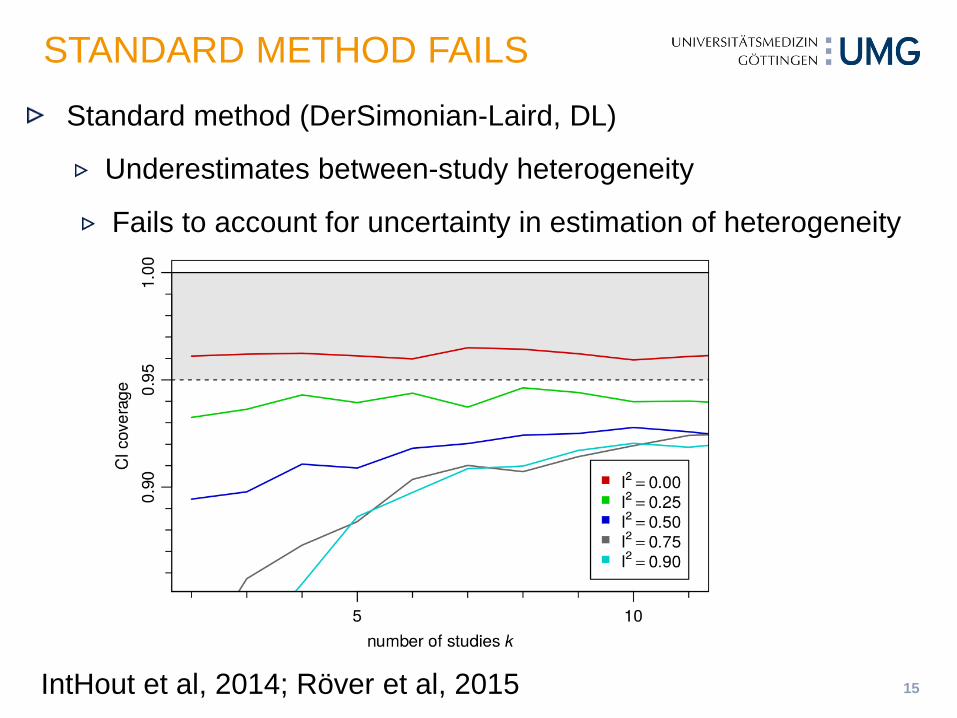
STANDARD METHOD FAILS
IntHout et al, 2014; Röver et al, 2015
Standard method (DerSimonian-Laird, DL)
Underestimates between-study heterogeneity
Fails to account for uncertainty in estimation of heterogeneity

16
97.5% quantile of t-distribution with 1 df = 12.7 !!!
Example from Friede et al (2017b)
WITH VERY FEW STUDIES: KNAPP-HARTUNGMETHOD DOES NOT SOLVE THE PROBLEM
HSJK: Hartung-Knapp-Sidik-Jonkman; mHK: modified Knapp-Hartung; normal: DL

17
Idea: Weakly informative prior on between-trial heterogeneity for meta-analysis with few studies (Spiegelhalter et al, 2004), with uninformative prior on treatment effect
Avoids zero estimates of between-trial heterogeneity
Accounts for uncertainty in the estimation
Easy to compute
Application of DIRECT algorithm (Röver & Friede, 2017a) (which is faster than MCMC sampling and does not require inspection of convergence diagnostics)
R package bayesmeta (available from CRAN)
BAYESIAN META-ANALYSIS

18
Bayesian intervals appear to be a reasonable compromise (supported by simulation studies in e.g. Friede et al, 2017a,b)
EXAMPLE REVISITED

19
Normal approximations of the distributions of effects, e.g. log HR or log OR, break down with low event rates
Particular problem: studies with no events (0 – 0 studies)
Proposed solutions
continuity corrections (Bradburn et al. 2007)
models of the counts such as binomial distributions fitted using likelihood or Bayesian methods (Spiegelhalter et al. 2004; Böhning et al. 2008; Kuß, 2015)
Few studies with rare events: Bayesian random-effects MA with weakly informative priors for between-study heterogeneity and treatment effects (Günhan et al, in preparation)
META-ANALYSES OF RARE EVENTS

ANALYSIS OF ADVERSE EVENTS WITH VARYING FOLLOW-UP TIMESProposal of an empirical investigation

21
Jan Beyersmann (Ulm)
Claudia Schmoor (Freiburg)
Tim Friede (Göttingen)
THE COLLABORATORS

22
Compare common (but biased or incomplete) analyses of AEs with methods accounting for competing risks in time-to-event studies and in terms of safety comparison between treatment groups.
For the present investigation, consider time-to-first AE (of a certain kind), observation of which may be precluded by death, some other time-to-event outcome under consideration or limited recording (censoring) of AEs over a restricted period of time.
The target quantity (estimand) in this investigation is the probability to acquire such an AE over the course of time in order to compare these probabilities between treatment groups.
The aim is to investigate in a large number of RCTs whether the different analyses of AEs lead to different decisions when comparing safety between groups.
OBJECTIVES
23
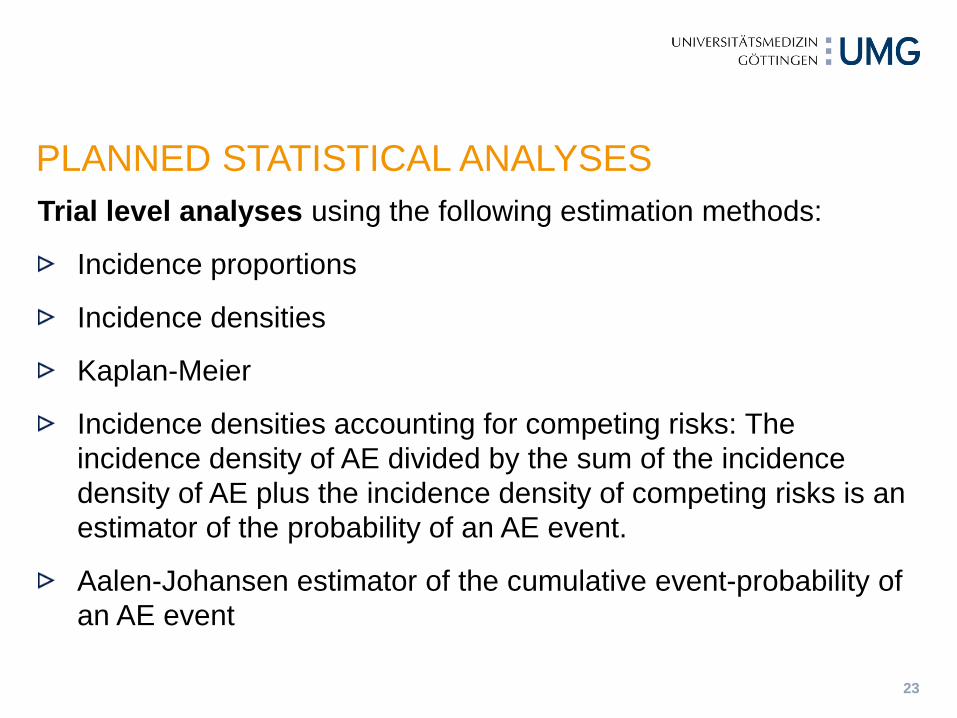
Trial level analyses using the following estimation methods:
Incidence proportions
Incidence densities
Kaplan-Meier
Incidence densities accounting for competing risks: The incidence density of AE divided by the sum of the incidence density of AE plus the incidence density of competing risks is an estimator of the probability of an AE event.
Aalen-Johansen estimator of the cumulative event-probability of an AE event
PLANNED STATISTICAL ANALYSES

24
Trial level analyses
All safety comparisons between treatment groups shall be based on confidence intervals using the difference and/or ratio of the respective estimators.
Additionally, the logrank test for the comparison of the event-specific hazards and the Gray test for the comparison of the cumulative AE probabilities will be investigated.
PLANNED STATISTICAL ANALYSES

25
Meta-analytic approach
Assessment of bias in scatterplots of (AE probability) risks, risk differences and (log) rate ratios obtained by the different methods against Aalen-Johansen approach as gold standard.
Comparison of conclusions derived from the various approaches including statistical significance, clinical relevance and benefit assessment criteria from the various approaches against the Aalen-Johansen approach as gold standard in frequency tables.
Assessment of precision: standard errors / width of confidence intervals against Aalen-Johansen approach as gold standard for those methods with at most small to moderate bias
More formal assessments in (random effects) meta-analyses / meta-regressions will be considered. Assessment and exploration of heterogeneity in (random effects) meta-analyses / meta-regressions (e.g. by indication), if indicated.
PLANNED STATISTICAL ANALYSES

26
The trial level analyses will be run within the sponsor company / organization using R or SAS code provided by the project collaborators.
Therefore it is not required to release any individual patient data to the project collaborators.
Only aggregated data summarizing the results of the analyses described above will be shared with the project collaborators.
Furthermore, some information on the studies including maximum time of AE follow-up, maximum follow-up time for primary efficacy endpoint and therapeutic area is requested.
REQUESTED (AGGREGATED) DATA

27
We expect to publish the results of this collaborative project in a peer-reviewed journal.
The results will also be presented at a conference.
EXPECTED OUTPUT

28
Commitment by companies / organizations
Identification of suitable clinical trials
Pseudonymization of study codes (confidentiality agreements)
Development of statistical analysis plan and data structure in collaboration with committed companies / organizations
Development of R and SAS codes
Validation and test runs
NEXT STEPS

29
Allignol A, Beyersmann J, Schmoor C. Statistical issues in the analysis of adverse events in time-to-event data. Pharmaceutical Statistics 2016, 15:297-305.
Beyersmann J, Allignol A, Schumacher M. Competing Risks and Multistate Models with R. Springer: New York, 2011.
Latouche A, Allignol A, Beyersmann J, Labopin M, Fine JP. A competing risks analysis should report results on all cause-specific hazards and cumulative incidence functions. Journal of Clinical Epidemiology 2013, 66:648–653.
Schmoor C, Schumacher M, Finke J, Beyersmann J. Competing risks and multistate models. Clinical Cancer Research 2013, 12:12–21.
SOME REFERENCES