Embed Size (px)
Citation preview

Methodology
What is the best imaging strategy for acute stroke?
JM Wardlaw, SL Keir, J Seymour, S Lewis, PAG Sandercock, MS Dennis and J Cairns
Health Technology Assessment 2004; Vol. 8: No. 1
HTAHealth Technology AssessmentNHS R&D HTA Programme
January 2004

How to obtain copies of this and other HTA Programme reports.An electronic version of this publication, in Adobe Acrobat format, is available for downloading free ofcharge for personal use from the HTA website (http://www.hta.ac.uk). A fully searchable CD-ROM isalso available (see below).
Printed copies of HTA monographs cost £20 each (post and packing free in the UK) to both public andprivate sector purchasers from our Despatch Agents.
Non-UK purchasers will have to pay a small fee for post and packing. For European countries the cost is£2 per monograph and for the rest of the world £3 per monograph.
You can order HTA monographs from our Despatch Agents:
– fax (with credit card or official purchase order) – post (with credit card or official purchase order or cheque)– phone during office hours (credit card only).
Additionally the HTA website allows you either to pay securely by credit card or to print out yourorder and then post or fax it.
Contact details are as follows:HTA Despatch Email: [email protected]/o Direct Mail Works Ltd Tel: 02392 492 0004 Oakwood Business Centre Fax: 02392 478 555Downley, HAVANT PO9 2NP, UK Fax from outside the UK: +44 2392 478 555
NHS libraries can subscribe free of charge. Public libraries can subscribe at a very reduced cost of £100 for each volume (normally comprising 30–40 titles). The commercial subscription rate is £300 per volume. Please see our website for details. Subscriptions can only be purchased for the current orforthcoming volume.
Payment methods
Paying by chequeIf you pay by cheque, the cheque must be in pounds sterling, made payable to Direct Mail Works Ltdand drawn on a bank with a UK address.
Paying by credit cardThe following cards are accepted by phone, fax, post or via the website ordering pages: Delta, Eurocard,Mastercard, Solo, Switch and Visa. We advise against sending credit card details in a plain email.
Paying by official purchase orderYou can post or fax these, but they must be from public bodies (i.e. NHS or universities) within the UK.We cannot at present accept purchase orders from commercial companies or from outside the UK.
How do I get a copy of HTA on CD?
Please use the form on the HTA website (www.hta.ac.uk/htacd.htm). Or contact Direct Mail Works (seecontact details above) by email, post, fax or phone. HTA on CD is currently free of charge worldwide.
The website also provides information about the HTA Programme and lists the membership of the variouscommittees.
HTA
What is the best imaging strategy foracute stroke?
JM Wardlaw,1* SL Keir,1 J Seymour,2 S Lewis,1
PAG Sandercock,1 MS Dennis1 and J Cairns2
1 Department of Clinical Neurosciences, Western General Hospital(University of Edinburgh), Edinburgh, UK
2 Health Economics Research Unit, University of Aberdeen, UK
* Corresponding author
Declared competing interests of authors: see Appendix 11.
Published January 2004
This report should be referenced as follows:
Wardlaw JM, Keir SL, Seymour J, Lewis S, Sandercock PAG, Dennis MS, et al. What is thebest imaging strategy for acute stroke? Health Technol Assess 2004;8(1).
Health Technology Assessment is indexed in Index Medicus/MEDLINE and Excerpta Medica/EMBASE.

NHS R&D HTA Programme
The NHS R&D Health Technology Assessment (HTA) Programme was set up in 1993 to ensure that high-quality research information on the costs, effectiveness and broader impact of health
technologies is produced in the most efficient way for those who use, manage and provide care in the NHS.
Initially, six HTA panels (pharmaceuticals, acute sector, primary and community care, diagnostics and imaging, population screening, methodology) helped to set the research priorities for the HTAProgramme. However, during the past few years there have been a number of changes in and aroundNHS R&D, such as the establishment of the National Institute for Clinical Excellence (NICE) and the creation of three new research programmes: Service Delivery and Organisation (SDO); New and Emerging Applications of Technology (NEAT); and the Methodology Programme.
This has meant that the HTA panels can now focus more explicitly on health technologies (‘health technologies’ are broadly defined to include all interventions used to promote health, prevent and treat disease, and improve rehabilitation and long-term care) rather than settings of care. Therefore the panel structure was replaced in 2000 by three new panels: Pharmaceuticals;Therapeutic Procedures (including devices and operations); and Diagnostic Technologies andScreening.
The HTA Programme will continue to commission both primary and secondary research. The HTACommissioning Board, supported by the National Coordinating Centre for Health TechnologyAssessment (NCCHTA), will consider and advise the Programme Director on the best research projects to pursue in order to address the research priorities identified by the three HTA panels.
The research reported in this monograph was funded as project number 96/08/01.
The views expressed in this publication are those of the authors and not necessarily those of the HTA Programme or the Department of Health. The editors wish to emphasise that funding andpublication of this research by the NHS should not be taken as implicit support for any recommendations made by the authors.
HTA Programme Director: Professor Tom WalleySeries Editors: Dr Ken Stein, Professor John Gabbay, Dr Ruairidh Milne,
Dr Chris Hyde and Dr Rob RiemsmaManaging Editors: Sally Bailey and Caroline Ciupek
The editors and publisher have tried to ensure the accuracy of this report but do not accept liabilityfor damages or losses arising from material published in this report. They would like to thank thereferees for their constructive comments on the draft document.
ISSN 1366-5278
© Queen’s Printer and Controller of HMSO 2004
This monograph may be freely reproduced for the purposes of private research and study and may be included in professional journals provided that suitable acknowledgement is made and the reproduction is not associated with any form of advertising.
Applications for commercial reproduction should be addressed to HMSO,The Copyright Unit, St Clements House, 2–16 Colegate, Norwich, NR3 1BQ.
Published by Gray Publishing, Tunbridge Wells, Kent, on behalf of NCCHTA.Printed on acid-free paper in the UK by St Edmundsbury Press Ltd, Bury St Edmunds, Suffolk.
Criteria for inclusion in the HTA monograph seriesReports are published in the HTA monograph series if (1) they have resulted from work commissioned for the HTA Programme, and (2) they are of a sufficiently high scientific quality as assessed by the referees and editors.
Reviews in Health Technology Assessment are termed ‘systematic’ when the account of the search,appraisal and synthesis methods (to minimise biases and random errors) would, in theory, permitthe replication of the review by others.
G

Objectives: To determine the cost-effectiveness ofcomputed tomographic (CT) scanning after acutestroke. To assess the contribution of brain imaging tothe diagnosis and management of stroke, and toestimate the costs, benefits and risks of differentimaging strategies in order to provide data to informnational and local policy on the use of brain imaging instroke.Design: A decision-analysis model was developed torepresent the pathway of care in acute stroke using‘scan all patients within 48 hours’ as the comparatoragainst which to cost 12 alternative scan strategies. Setting: Hospitals in Scotland. Participants: Subjects were patients admitted tohospital with a first stroke and those managed asoutpatients. Interventions: The effect on functional outcome afterischaemic or haemorrhagic stroke, tumours orinfections, of correctly administered antithrombotic orother treatment; of time to scan and stroke severity ondiagnosis by CT or MRI; on management, includinglength of stay, functional outcome, and quality-adjustedlife years (QALYs), of the diagnostic informationprovided by CT scanning; the cost-effectiveness (costversus QALYs) of different strategies for use of CTafter acute stroke. Main outcome measures: Death and functionaloutcome at long-term follow-up; accuracy of CT andMRI; cost of CT scanning by time of day and week;effect of CT diagnosis on change in health outcome,length of stay in hospital and QALYs; cost-effectivenessof various scanning strategies.Results: CT is very sensitive and specific forhaemorrhage within the first 8 days of stroke only.Suboptimal scanning used in epidemiology studies
suggests that the frequency of primary intracerebralhaemorrhage (PICH) has been underestimated. Aspirinincreases the risk of PICH. There were no reliable dataon functional outcome or on the effect ofantithrombotic treatment given long term after PICH.In 60% of patients with recurrent stroke after PICH,the cause is another PICH and mortality is high amongPICH patients. A specific MR sequence (gradient echo)is required to identify prior PICH reliably. CT scannerswere distributed unevenly in Scotland, 65% providedCT scanning within 48 hours of stroke, and 100%within 7 days for hospital-admitted patients, but accessout of hours was very variable, and for outpatients waspoor. The average cost of a CT brain scan for strokewas £30.23 to £89.56 in normal working hours and£55.05 to £173.46 out of hours. Average length of staywas greatest for severe strokes and those who survivedin a dependent state. For a cohort of 1000 patientsaged 70–74 years, the policy ‘scan all strokes within 48hours’, cost £10,279,728 and achieved 1982.3 QALYS.The most cost-effective strategy was ‘scan allimmediately’ (£9,993,676 and 1982.4 QALYS). Theleast cost-effective was to ‘scan patients onanticoagulants, in a life-threatening conditionimmediately and the rest within 14 days’.Conclusions: In general, strategies in which mostpatients were scanned immediately cost least andachieved the most QALYs, as the cost of providing CT(even out of hours) was less than the cost of inpatientcare. Increasing independent survival by even a smallproportion through early use of aspirin in the majoritywith ischaemic stroke, avoiding aspirin in those withhaemorrhagic stroke, and appropriate earlymanagement of those who have not had a stroke,reduced costs and increased QALYs.
Health Technology Assessment 2004; Vol. 8: No. 1
iii
© Queen’s Printer and Controller of HMSO 2004. All rights reserved.
Abstract
What is the best imaging strategy for acute stroke?
JM Wardlaw,1* SL Keir,1 J Seymour,2 S Lewis,1 PAG Sandercock,1 MS Dennis1 and J Cairns2
1 Department of Clinical Neurosciences, Western General Hospital (University of Edinburgh), Edinburgh, UK2 Health Economics Research Unit, University of Aberdeen, Aberdeen, UK* Corresponding author


Health Technology Assessment 2004; Vol. 8: No. 1
v
List of abbreviations .................................. vii
Executive summary .................................... ix
1 Background ................................................ 1The burden of stroke: death, disability and loss of quality of life ................................... 1The cost of stroke ....................................... 1Incidence of types of stroke and outcomes .. 2Current primary treatment and secondary prevention of stroke ................................... 3The need for brain imaging ...................... 4Reasons for the controversy over CT scanning ..................................................... 5Current standards of care and guidelines ................................................... 7The questions posed in this project ........... 8What information is required to determine whether CT is cost-effective or not? .......... 8Potential applications of these results ........ 9
2 The contribution of brain imaging to the diagnosis of stroke: a systematic review of the accuracy of the clinical diagnosis of stroke ......................................................... 11Background ................................................ 11Methods ...................................................... 12Details of included studies ......................... 13Details of excluded studies ......................... 15Results ........................................................ 15Discussion ................................................... 18Conclusions ................................................ 20
3 The reliability of imaging in the diagnosis of haemorrhage and infarction .................. 21Systematic descriptive study of the diagnosticaccuracy of CT and MR in stroke .............. 21Primary study comparing CT with MRI ............................................................ 39Discussion ................................................... 54Conclusions ................................................ 56
4 Contribution of brain imaging to therapeutic decision-making in stroke ..... 59Background ................................................ 59Methods ...................................................... 61Details of the included trials ...................... 62Results ........................................................ 65Discussion ................................................... 68Conclusions ................................................ 69
5 Cost-effectiveness of CT in stroke: a systematic review of the available evidence, detailed costings and decision modelling analysis ...................................... 71Systematic review of previous studies of the cost-effectiveness of CT in stroke ...................................................... 71Development of the cost-effectiveness model and decision tree, including devising a menu of representative scanning strategies ..................................................... 73Data for the model: probability table, outcomes and costs .................................... 78Current provision of CT scanning for stroke: questionnaire survey of CT scanning departments in Scotland linked to population distribution .............................. 100Results of the analysis of the cost-effectiveness model for CT scanning, and sensitivity analyses ............................... 109
6 Discussion ................................................... 113Robustness of the conclusions .................... 113Difficulties in undertaking this work ......... 114Limitations ................................................. 116Generalisability of the results ..................... 116Implications for healthcare ........................ 117Implications for research ........................... 118
Acknowledgements .................................... 121
References .................................................. 123
Appendix 1 Definitions ............................. 137
Appendix 2 Tables of information sought at start of project, likely sources and information contained therein ................... 139
Appendix 3 ICD-9 and ICD-10 codes ...... 143
Appendix 4 Search strategies for imaging and epidemiology ...................................... 145
Appendix 5 Search strategies: systematic review of cost-effectiveness of CT scanning for stroke .................................................... 149
Appendix 6 Questionnaire for Scottish CT scanning departments ................................ 151
Contents

Appendix 7 Current provision of CT scanners in Scotland .................................. 165
Appendix 8 Costings of CT scanning services from three hospitals in Scotland within normal working hours and out of hours ...................................................... 167
Appendix 9 Results of the sensitivity analysis ....................................................... 173
Appendix 10 Publications and presentations .............................................. 177
Appendix 11 Authors’ declared conflicts of interest ............................................................ 179
Health Technology Assessment reportspublished to date ....................................... 181
Health Technology Assessment Programme ................................................ 189
vi
Contents
ABN Association of British Neurologists
ACCP American College of ChestPhysicians
AF atrial fibrillation
ANOVA analysis of variance
APTT activated partial thromboplastintime
ARI Aberdeen Royal Infirmary
ATT Antithrombotic Trialists’Collaboration
BG basal ganglia
BGH Borders General Hospital
CAST Chinese Acute Stroke Trial
CCTR Cochrane Controlled Trials Register
CHD coronary heart disease
CI confidence interval
CMA Canadian Medical Association
CT computed tomography
DGH district general hospital
DWI diffusion-weighted imaging
DVT deep vein thrombosis
EAC equivalent annual cost
ECG electrocardiogram
FLAIR fluid-attenuated inversion recoverymagnetic resonance imaging
FSE T2 T2-weighted fast spin-echo
FSE fast spin-echo
GIS Geographical Information Service
GRE gradient echo magnetic resonanceimaging
GROS General Registers Office of Scotland
HI haemorrhagic infarction
HMCAS hyperdense middle cerebral arterysign
HRQoL health-related quality of life
HTI haemorrhagic transformation of aninfarct
ICH intracerebral haemorrhage
ISD Information and Statistics Divisionof the Scottish Office
IST International Stroke Trial
LACI lacunar infarction
LACS lacunar syndrome
LOS length of stay
LSR Lothian Stroke Register
MCA middle cerebral artery
MI myocardial infarction
MR magnetic resonance
MRI magnetic resonance imaging
mRS modified Rankin scale
NINDS National Institutes of NeurologicalDiseases and Stroke
NSAID non-steroidal anti-inflammatorydrug
OCSP Oxfordshire Community StrokeProject
OR odds ratio
PACI partial anterior circulationinfarction
PACS partial anterior circulationsyndrome
PD proton density-weighted magneticresonance imaging
PE pulmonary embolism
PHV prosthetic heart valve
PICH primary intracerebral haemorrhage
PMV prosthetic mitral valve
continued
Health Technology Assessment 2004; Vol. 8: No. 1
vii
© Queen’s Printer and Controller of HMSO 2004. All rights reserved.
List of abbreviations

viii
List of abbreviations
List of abbreviations continued
POCI posterior circulation infarction
POCS posterior circulation syndrome
QALY quality-adjusted life year
RCR Royal College of Radiologists
RCT randomised controlled trial
rt-PA recombinant tissue plasminogenactivator
SAH subarachnoid haemorrhage
SDH subdural haematoma
SHPIC Scottish Health PurchasingInformation Centre
SIGN Scottish Intercollegiate GuidelinesNetwork
SPECT single-photon emission computedtomography
SRI Stirling Royal Infirmary
STICH surgical treatment of intracerebralhaemorrhage
T1 T1-weighted magnetic resonanceimaging
T2 T2-weighted magnetic resonanceimaging
TACI total anterior circulation infarction
TACS total anterior circulation syndrome
TIA transient ischaemic attack
TTO time trade-off
WHO World Health Organization
WMHI white matter hyperintensities
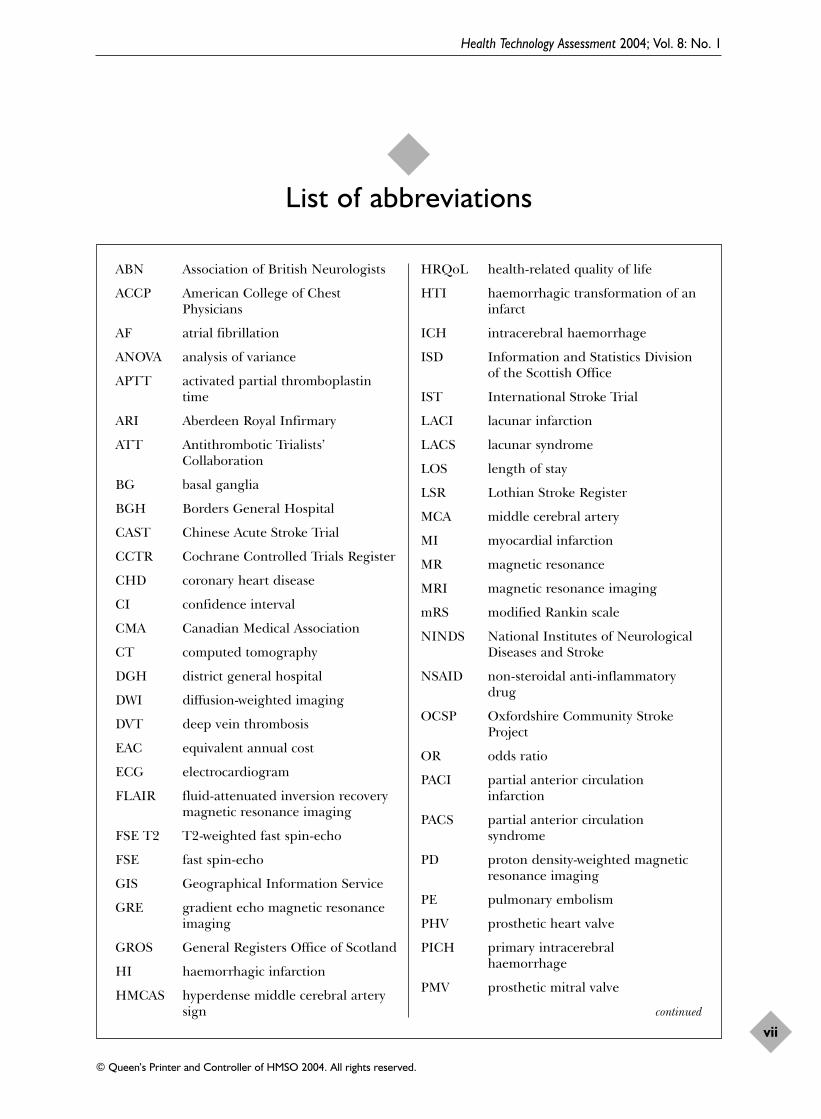
All abbreviations that have been used in this report are listed here unless the abbreviation is well known (e.g. NHS), or it has been used only once, or it is a non-standard abbreviation used only in figures/tables/appendices in which case the abbreviation is defined in the figure legend or at the end of the table.

Health Technology Assessment 2004; Vol. 8: No. 1
ix
© Queen’s Printer and Controller of HMSO 2004. All rights reserved.
Objectives� To determine the cost-effectiveness of computed
tomographic (CT) scanning after acute stroke. � To assess the contribution of brain imaging to
the diagnosis and management of stroke. � To estimate the costs, benefits and risks of
different imaging strategies. � To provide data to inform national and local
policy on the use of brain imaging in stroke.
MethodsA decision-analysis model was developed torepresent the pathway of care in acute stroke using‘scan all patients within 48 hours’ as thecomparator against which to cost 12 alternativescan strategies. Data were obtained from:systematic reviews of brain imaging,antithrombotic, anticoagulant and thrombolytictreatment, and cost-effectiveness of CT in stroke; a large UK hospital stroke registry; the Informationand Statistics Division of the Scottish Office; asurvey of all Scottish CT scanning departments;the Scottish Office; and a direct comparison of CTand magnetic resonance imaging (MRI).
The primary data for the model were generated inthe Department of Clinical Neurosciences inEdinburgh, drawing on: the teaching hospitalstroke registry (1990–9); the Cochrane StrokeReview Group; two multicentre international trials[the International Stroke Trial (IST) and theChinese Acute Stroke Trial (CAST) of 40,000patients conducted in 36 countries worldwide] andsubstudies on quality of life; a primary comparisonof CT with MRI; and expert clinical knowledgewhere data were lacking. Data on access to CT forstroke and costs came from three representativeScottish hospitals. The health economicsmodelling was conducted by the HealthEconomics Research Unit in Aberdeen. Systematicreviews were undertaken by both departments.
Subjects were patients admitted to hospital with afirst stroke and those managed as outpatients.
Interventions comprised the effect: on functionaloutcome after ischaemic or haemorrhagic stroke,
tumours or infections, of correctly administeredantithrombotic or other treatment; of time to scanand stroke severity on diagnosis by CT or MRI; onmanagement, including length of stay, functionaloutcome, and quality-adjusted life years (QALYs),of the diagnostic information provided by CTscanning; the cost-effectiveness (cost versusQALYs) of different strategies for use of CT afteracute stroke.
The main outcome measures were death andfunctional outcome at long-term follow-up (6 months, 1 year and 2 years); accuracy of CTand MRI; cost of CT scanning by time of day and week; effect of CT diagnosis on change inhealth outcome, length of stay in hospital andQALYs; cost-effectiveness of various scanningstrategies.
ResultsClinicians disagree on the clinical diagnosis ofstroke (versus not stroke) in about 20% of patients.It is impossible to differentiate infarct fromhaemorrhage by clinical examination. CT is verysensitive and specific for haemorrhage within thefirst 8 days of stroke only. Suboptimal scanningused in epidemiology studies suggests that thefrequency of primary intracerebral haemorrhage(PICH) has been underestimated.
Aspirin increases the risk of PICH. There was noevidence that a few doses of aspirin giveninadvertently to patients with acute PICHsignificantly increased the odds of death [oddsratio (OR) 0.96, 95% confidence interval (CI) 0.62to 1.5] or recurrent intracranial haemorrhage (OR1.02, 95% CI 0.5 to 1.8), so long as only a fewdoses were given. There were no reliable data onfunctional outcome or on the effect ofantithrombotic treatment given long term afterPICH. In 60% of patients with recurrent strokeafter PICH, the cause is another PICH andmortality is high among PICH patients.
Among 232 patients (mainly outpatients) withmild stroke, 3% had a PICH and 15% hadhaemorrhagic transformation of an infarct. CT didnot reliably detect PICH after 8 days. A specific
Executive summary

x
MR sequence (gradient echo) is required toidentify prior PICH reliably.
CT scanners were distributed unevenly in Scotland(0.8, range 0.05–0.36/10,000). A total of 65%provided CT scanning within 48 hours of stroke,and 100% within 7 days for hospital-admittedpatients, but access out of hours was very variable,and for outpatients was poor. The average cost ofa CT brain scan for stroke in the NHS in Scotlandranged from £30.23 to £89.56 during normalworking hours and from £55.05 to £173.46 out of hours.
Average length of stay was greatest for severestrokes and those who survived in a dependentstate (alive and independent, 14 days; dependent,51 days; and dead, 33 days).
For a cohort of 1000 patients aged 70–74 years,the policy ‘scan all strokes within 48 hours’ cost£10,279,728 and achieved 1982.3 QALYs. Themost cost-effective strategy (least overall cost andmost QALYs) was ‘scan all immediately’(£9,993,676 and 1982.4 QALYs). The least cost-effective was ‘scan patients on anticoagulants, in alife-threatening condition immediately and therest within 14 days’ (£12,592,666 and 1931.8QALYs). ‘Scan no patients’ (but treat on the basisof clinical diagnosis alone) reduced QALYs(1904.2) at increased cost (£10,544,000).
ConclusionsIn general, strategies in which most patients werescanned immediately cost least and achieved themost QALYs, as the cost of providing CT (even out
of hours) was less than the cost of inpatient care.Increasing independent survival by even a smallproportion through early use of aspirin in themajority with ischaemic stroke, avoiding aspirin inthose with haemorrhagic stroke, and appropriateearly management of those who have not had astroke, reduced costs and increased QALYs.Sensitivity analyses to vary the cost of scanning,different age ranges, proportions of infarcts,haemorrhages or tumours/infections, accuracy ofCT, utility weights, and length of stay assumptionsdid not alter the ranking of strategies. However,although, the model was sensitive to reducing thecost of inpatient care, ‘scan all immediately’remained the dominant strategy.
Recommendations for researchFuture research should obtain better data on:
• the use of antithrombotic treatment in acutePICH in patients at risk of DVT or ischaemicvascular events
• whether secondary prevention of ischaemicevents with antithrombotic treatment is safe andeffective in patients with prior PICH
• best management of acute PICH• the proportion of first and recurrent stroke
due to infarct or haemorrhage by age andseverity
• costs of stroke care in hospital and in thecommunity
• the accuracy of, and better methodology forassessing imaging
• improving accuracy of clinical diagnosis ofstroke.
• ways of streamlining CT scanning for stroke.
Executive summary

The purpose of this chapter is to provide a briefintroduction to the main research questions to
be covered in the report, to summarise theevidence already available and to outline thesources of information to be used. It is intended todescribe the contribution that brain imaging canmake to the management of stroke and why theremay be controversy about the use of brain imagingin stroke. It is therefore also intended to describe,from the perspective of the physician, radiologist,patient and carer, the important issues that theresults of this project could help to resolve.
The burden of stroke: death,disability and loss of quality of lifeStroke is a major cause of death and disability inboth the more developed and the less developedworld.1,2 Each year in the UK there are about125,000 strokes,1 causing about 10% of all deaths.About 25% of men and 20% of women can expectto suffer a stroke if they survive to 85 years.3 Theincidence and lifetime prevalence of stroke are farhigher than for any other neurological disorder.4
The incidence of first stroke is reported to be 2per 1000 population and the overall incidence ofstroke is 2.4 per 1000 population.5,6 Stroke iscurrently the second most common cause of deathin the UK.7 Although the numbers of deaths fromstroke are large, the major burden is chronicdisability.8 About one-third of stroke survivors arefunctionally dependent after 1 year;9 survival withany degree of stroke-related impairment is likelyto be associated with a reduction in health-relatedquality of life (HRQoL).10 In the UK, there areabout 250,000 disabled stroke survivors. Stroke isthe most common cause of neurological disabilityin the community.3,4,11
The burden of stroke is projected to increase. Inmost developed countries, stroke mortality hasdeclined since the early 1980s, but a largeproportion of this fall has been due to a reductionin case fatality, rather than incidence.12 In thecoming decades, with the proportion of olderpeople in the population set to rise, the total
number of new strokes each year is projected toincrease considerably.1,13,14 By the year 2020, inthe developed world, stroke is estimated toaccount for 6.2% of the total burden of illness.14
The cost of stroke Stroke consumes about 2–4% of total healthcarecosts (i.e. excluding social care and indirect costs)in Europe and the USA.15 The cost of stroke in the UK is high at £2300 million per year, andaccounts for about 6% of total NHS and SocialServices expenditure; this is nearly twice theamount spent on coronary heart disease(CHD).2,16 Despite this high disease burden onsociety and high cost, little is known about the keyaspects of managing stroke and how they affectthe outcome and the cost.17 Outcome after stroke,measured as case fatality rate, clearly differsbetween countries, and is high in the UKcompared with other European countries,although the reasons for this are unclear.8,17,18
There is evidence of differences between countriesat each stage in the assessment and treatment ofpatients with stroke.19 Such variations indicate lackof agreement about the optimum approach tostroke management. Such lack of agreementamong clinicians may indicate a lack of reliableresearch evidence. Despite the lack of evidence,less has been spent on research into strokeprevention, treatment and rehabilitation in theUK (and elsewhere) than on research intocardiovascular disease or cancer.2
Appropriate evidence-based strategies for the useof imaging in stroke patients could make patientcare more effective and efficient. Despite that,imaging for stroke has generally not beensubjected to formal economic evaluation. Thus, a systematic review of cost-effectiveness research instroke up to 1999 identified about 2000 potentialpublications, but only 26 studies met the eligibilitycriteria.20 Of the 26 studies in the review, only onerelated to acute stroke and it consideredthrombolytic treatment with recombinant tissueplasminogen activator (rt-PA).21 None were ofimaging strategies.
Health Technology Assessment 2004; Vol. 8: No. 1
1
© Queen’s Printer and Controller of HMSO 2004. All rights reserved.
Chapter 1
Background

Incidence of types of stroke andoutcomesStroke is a clinical syndrome22 and can be due toseveral different underlying pathologies. The twomost common underlying pathological processesare cerebral infarction (or ischaemic stroke), whichaccounts for about 80% of all stroke, andintracerebral haemorrhage [or primaryintracerebral haemorrhage (PICH)], whichaccounts for about 10–15% of all strokes.1,23,24
Cerebral infarction is usually caused by occlusionof an artery to the brain resulting in ischaemia orinfarction of the tissue supplied by that artery. Itresults from embolism (commonly from the heartor carotid atheroma in the neck) or in situthrombosis.25 PICH occurs as a result of a ruptureof an artery wall and escape of blood into thebrain parenchyma.26 The remaining haemorrhagicstrokes are due to subarachnoid haemorrhage(SAH).27,28 SAH is so different in terms of itsclinical features, immediate management andoutcome to stroke (cerebral infarction or PICH)that it will not be considered further in this report.Occasionally, a tumour or an infection can presentwith stroke-like symptoms. In most case series,about 4% of patients presenting as ‘strokes’ have anon-vascular underlying cause.5 Since thepathological processes underlying the clinicalsyndrome of stroke are very varied, it is notsurprising that investigation, treatment andoutcome of the different subtypes of stroke arealso very different. Unfortunately, this has notbeen widely recognised until quite recently.
Implications for management Thus, the management of a patient presentingwith the clinical syndrome of stroke is predicatedentirely on an accurate diagnosis of the underlyingpathological process. The first step is to identifythose few patients with a non-vascular cause (e.g.tumour, abscess, migraine, subdural haematoma,focal epilepsy). In such patients, surgery or biopsymay be required for treatment or to obtain apathological diagnosis. For the remainder withvascular pathology, brain imaging by computedtomography (CT) or magnetic resonance imaging(MRI) can provide an accurate diagnosis of thenature and extent of the cerebral vascularpathology, and whether it is primarily ischaemic orhaemorrhagic. Some aspects of the managementof stroke are common to all pathological types(e.g. sensible control of blood pressure), but thereare also key differences in the approach to primarytreatment, further investigation and secondaryprevention of patients with ischaemic andhaemorrhagic stroke.
Clinical classification of severity ofstrokeOn the basis of the symptoms and signs, stroke hasbeen classified clinically in a variety of ways. Manyof these classifications were developed to describethe severity of the neurological deficit, and requiredetailed neurological examination. They may beuseful for monitoring changes in the patient’sneurological status during treatment, but do noteasily relate to prognosis or risk of recurrent stroke,both of which are useful for clinical management.The Oxfordshire Community Stroke Project(OCSP) classification subdivides patients into fourcategories based on symptoms and signs, and thesecategories relate directly to prognosis, likelyunderlying aetiology and risk of recurrent stroke.9
It can be applied to patients with cerebralinfarction or haemorrhage and divides patientsinto total anterior circulation syndrome (TACS),partial anterior circulation syndrome (PACS),lacunar syndrome (LACS) and posterior circulationsyndrome (POCS). If the patient is knowndefinitely to have had an infarct (followingscanning), then the ‘syndrome’ is replaced by‘infarction’ (i.e. TACI, PACI, LACI, POCI). Ingeneral, patients with a TACS have had a severestroke and have high mortality, and very few returnto an independent existence; patients with a PACShave had a milder stroke, are less likely to die butare at greater risk of recurrent stroke soon after thefirst one; those with lacunar syndromes are unlikelyto die but often remain dependent, though are atlow risk of recurrence; patients with POCS vary inseverity and prognosis, but severe POCS cases areat risk of early death due to hydrocephalussecondary to compression of the ventriculardrainage system by the swollen cerebellar orbrainstem infarct or haemorrhage. Amongischaemic strokes, about 20% have a TACI, 25% aLACI, 35% a PACI and about 20% a POCI,although these proportions vary between hospitals.This is a useful and widely used classification thatwill be used to subgroup strokes in this project.
Is brain imaging really necessary todifferentiate ischaemic fromhaemorrhagic stroke?Several clinical scales have been developed for thispurpose, chiefly relying on the fact thathaemorrhagic strokes are more often associatedwith symptoms of severe stroke.29–31 Severalstudies have independently tested these scores,and none had sufficiently good sensitivity andspecificity to be used to guide managementdecisions (e.g. on the use of anticoagulants).32–35
Although patients with PICH may in general havemore severe stroke symptoms, PICH can also cause
Background
2

transient symptoms lasting for just a few hours[transient ischaemic attack (TIA)],36–39 or veryminor stroke.40 However, it is not known howfrequently PICH causes minor stroke or TIA. Asboth primary treatment and secondary prevention,investigation and treatment are quite different forischaemic and haemorrhagic strokes (indeed, sometreatments for ischaemic strokes are likely toworsen haemorrhagic strokes), on medical groundsit is important to distinguish one from the other atthe very beginning of management.
Current primary treatment andsecondary prevention of strokeIschaemic stroke: primary treatmentand secondary prevention strategiesAspirin, started within 48 hours of onset ofischaemic stroke, is the main primary treatmentfor patients with ischaemic stroke. Two large trialsof about 20,000 patients each have providedreliable evidence that with aspirin, for every 1000patients treated, nine avoid early death andrecurrent stroke, and about 13 avoid death ordependency at 6 months.41–43 The only otherpromising treatment is thrombolysis with rt-PA,which is now licensed for acute stroke treatment inthe USA, Canada, Germany, and the UK.However, where it does have a licence, it is onlyfor use in highly selected patients within 3 hoursof stroke onset, and there is continuing debateabout the proportion of patients that mightbenefit. Very few centres in the UK have theappropriate NHS infrastructure to deliverthrombolytic treatment safely and effectively topatients with acute ischaemic stroke.44–46 Althoughthrombolytic therapy is therefore essentially notavailable to patients in the UK, large-scale trialsare planned. Even if thrombolysis is not found tobe cost-effective in the NHS, better services(including imaging) for the diagnosis andmanagement of patients with acute stroke areneeded.44,45 In secondary prevention, long-termantiplatelet therapy (chiefly given as aspirin)reduces the risk of serious vascular events(recurrent stroke, myocardial infarction or vascular death).47,48 Other secondary preventionmeasures specific to ischaemic stroke includecarotid endarterectomy for patients with severe symptomatic carotid stenosis, andanticoagulants for patients in atrial fibrillation or with acquired thrombophilia. The role of statins in the prevention of recurrent ischaemicstroke was more controversial,49 but the results ofthe Medical Research Council (MRC) BritishHeart Foundation (BHF) Heart Protection Study
have provided clear evidence of the overallbenefits of cholesterol lowering.357 Other measures such as sensible blood pressure controlapply equally to ischaemic and haemorrhagicstroke.
Primary intracerebral haemorrhage:primary treatment and secondaryprevention Patients on anticoagulants who develop PICHusually require active reversal by intravenouscoagulation factors to prevent worsening of thehaemorrhage,50 although there are no randomisedtrials comparing active reversal of anticoagulantswith conservative management. At the start of thisproject, the effect of inadvertent administration ofantithrombotic agents to patients with PICH, ineither the short or the long term, was unclear. Forexample, antithrombotic agents may be given byaccident (thinking that the patient had had anischaemic stroke in the absence of appropriatebrain imaging) or deliberately because of theserious risk of myocardial infarction (MI) if theaspirin was stopped.
If PICH results in a large, space-occupyinghaematoma, then this may be surgicallyevacuated.51 A randomised trial of surgicalevacuation versus conservative treatment isunderway (STICH), but is not due to report forsome time to come.52 A second trial of endoscopicevacuation of intracerebral haematomas isunderway in India.51 A trial of stereotacticthrombolysis of intracerebral haematomas in theNetherlands is underway.51 PICH in thecerebellum may cause acute hydrocephalus bycompressing the ventricular drainage system,which is amenable to temporary surgical drainageof the ventricles (and of the haematoma itself, iflarge). These patients are rare but typically presentwith symptoms of a posterior fossa stroke and thendeteriorate neurologically over the next few hoursafter the stroke. (Note that patients with cerebellarinfarction may also develop secondaryhydrocephalus amenable to temporary ventriculardrainage and present in a similar way.)
Patients with PICH should avoid antithromboticand anticoagulant drugs in general, unless there issome particular high-risk indication (e.g. of MI, ifaspirin is discontinued), in which case the balanceof risk and benefit must be carefully assessed.Younger patients with a PICH may have anunderlying brain lesion such as a vascularmalformation that may require treatment bysurgery, radiotherapy or an interventionalneuroradiological procedure. However, in the
Health Technology Assessment 2004; Vol. 8: No. 1
3
© Queen’s Printer and Controller of HMSO 2004. All rights reserved.
typical PICH in the older patient this is not thecase. Apart from avoidance of drugs that increasebleeding tendency and control of blood pressure,53
there is currently no other secondary preventivemeasure.
As a result of these different treatment strategiesfor ischaemic and haemorrhagic stroke (bothprimary and secondary prevention), the use ofimaging investigations also differs betweenischaemic and haemorrhagic stroke. For example,following a diagnosis of cerebral infarction (withimaging), patients in atrial fibrillation would startanticoagulants. Those not in atrial fibrillationwould receive antiplatelet therapy and havecarotid Doppler imaging to identify those withsevere stenosis in the symptomatic artery whowould benefit from carotid surgery. Some of thosewithout carotid stenosis would undergoechocardiography to identify other possiblesources of emboli, or a thrombophilia screen toidentify coagulation abnormalities if indicated.None of these measures would be appropriate inpatients with PICH. Following a diagnosis of PICH(with imaging), those patients with a suggestion ofan underlying vascular lesion such as anarteriovenous malformation (or young patients)would undergo intra-arterial angiography andtreatment. All PICH patients should avoidantiplatelet agents and have their blood pressurecarefully controlled.
The need for brain imagingAs it is not possible to distinguish reliably betweencerebral infarction and haemorrhage on clinicalgrounds,34,35 or to identify those few patients withunderlying tumours or infections mimicking astroke, brain imaging with CT or magneticresonance (MR) is required. Acute haemorrhageon CT appears hyperdense (or white), whereasacute infarction appears hypodense (or dark)compared with normal brain parenchyma. Thus,the two major causes of stroke are easilydistinguished on CT in the acute phase. However,the haemorrhage gradually becomes isodense withnormal surrounding brain, and eventually darker(hypodense) than surrounding brain25 and so,from the point that the haematoma becomesisodense, it becomes indistinguishable from aninfarct. The ability of CT to detect haemorrhagelasts from the moment the PICH occurs54 for avariable period of up to 2 or 3 weeks dependingon the initial size of the haematoma: if large, theappearance lasts longer; if small, it disappearsquickly.55 However, as there have been no studieswhere patients with haematomas were CT scanned
serially to determine the point at which thehyperdensity disappears, the latest time when onecould expect to differentiate a PICH from aninfarct on CT is not precisely known. In particular,the minimum time to be able to detect a smallhaemorrhage reliably on CT is unknown.
Assessment of the extent of the lesionImaging assists the clinical management of strokein other ways. Determining the type of cerebralinfarct may help to prioritise use of limitedresources; for example, by aiding the clinicaldiagnosis of a lacunar versus a cortical infarct:patients with cortical infarcts have a higher risk ofearly recurrent stroke secondary to underlyingcarotid stenosis, so imaging allows theprioritisation of patient referral for Dopplerultrasound.56 Imaging added to clinical dataallows a more precise prediction of outcome thanclinical parameters alone.57 Imaging can diagnosethe cause of deteriorating neurological featuresafter stroke. For example, it might showhaemorrhagic transformation of the infarct, orinfarct swelling with midline shift, or a new infarctelsewhere in the brain, or hydrocephalus requiringdrainage. Following a PICH, the site, size andpattern of the haematoma on imaging may help toidentify the likely underlying cause (e.g.hypertensive or secondary to amyloidangiopathy).58 Imaging may identify the cause offurther neurological deterioration (e.g. furthernew bleeding, midline shift or hydrocephalus).
Brain imaging may provide other information forwhich it is more difficult to quantify the benefit.The exclusion of remediable disease such asinfection is crucial. Other benefits include thepossible comfort that a physician may provide torelatives of a patient with a severe stroke with theknowledge that the patient has had a massiveinfarct (or haemorrhage) from which they areunlikely to recover and there really is nothing elsethat can be done. Patients are well aware thatscanning is used to make the diagnosis of thecause of stroke, and may be distressed by a longwait for their test and the thought that the doctordoes not know what is wrong with them until thetest is done. This also may affect the time to starttreatment, which can also be distressing. They maybe reassured by being shown the scan and givenmore information about their disease and thechance of recovery.59 Sometimes the appearance ofthe infarct on CT may differ from that suggestedby the clinical syndrome. For example, a patientwith a lacunar syndrome may have a recentcortical infarct on their scan, in which case theirunderlying risk factors and likelihood of
Background
4

recurrence are much more like those of a corticalthan a lacunar syndrome.56 This means thatpatients can be fast-tracked through appropriate,although possibly limited, investigations such ascarotid Doppler ultrasound to prevent arecurrence.
Reasons for the controversy overCT scanning As stroke is a common condition, the averageregional stroke service for a population of250,000–300,000 or so will admit about one strokepatient per day, and may assess a further one ormore suspected strokes per day in their outpatientclinic. CT scanning (the machines, theradiologists, the radiographers) has been a scarceresource in the UK, which means that strokepatients must compete with patients with other,equally important conditions. In dealing with acommon disease such as stroke, it is importantthat well-organised care pathways are in place toavoid backlogs that make care less efficient. Strokehas traditionally been assigned a low priority. Asmost strokes are ischaemic, if one diagnosed‘ischaemic stroke’ in every stroke patient onewould be correct about 80% of the time. The harmthat may be caused to patients with haemorrhagicstroke by this policy, and the harm that may becaused to those with ischaemic stroke by failing toimplement treatment rapidly, have been unclear.Until fairly recently, there was no provenpharmacological treatment for acute stroke. Thebenefit of aspirin41 is seen as marginal for theindividual, which fails to recognise the benefits tothe population of this widely applicable andinexpensive treatment. Similarly, the potentiallylarge benefits of simply caring for patients withacute stroke in a coordinated and timely fashion,such as in stroke units, were overlooked andundervalued for a long time.60 It is therefore easyto appreciate why radiologists, hard pressed torespond to demands from many differentspecialities for CT investigations, might questionthe value of CT in stroke. The immediate benefitsof CT in stroke were not very clear. Theimportance of a more active approach toinvestigation of acute stroke was reflected in thefirst Stroke Association Survey in 1992. More than90% of physicians who cared for stroke patientssaid they would prefer to have a CT scanthemselves if they had a stroke, although they said that they would only request a CT in around50% of their patients.61 This double standardperhaps reflected an uncertainty among cliniciansabout the cost-effectiveness of CT, while realising
that they themselves would want a CT, irrespectiveof cost.
In radiology departments, stroke patients may beseen as disruptive to working schedules. They areoften unable to care for themselves, may not beaccompanied by a nurse who can care for themwhile in CT, and may be unable to transfer fromthe chair in which they were sent (it should havebeen a trolley) to CT, and so the hard-pressedradiographers have to find help to place thepatient on the scanning table. All of these factorsslow down the throughput in a busy CT departmentand can be avoided by good communicationbetween clinician and radiologist, althoughunfortunately this often appears to be lacking. Tohave this happening every day would be irritating,but it is inevitable as stroke is so common. It is easyto see how an accumulation of these factors couldrapidly induce resentment amongst radiologiststowards requests for scanning stroke patients,particularly if the subsequent treatment decisionswere seen to offer only very marginal benefits.
Perhaps a further major source of difficulty forradiologists in deciding on an appropriate priorityfor stroke is that none of the stroke guidelineswere produced with the input of radiologists;hence, they have been formulated withoutconsideration for their impact on radiologicalservices. The two national guidelines in the UK,produced by the Scottish IntercollegiateGuidelines Network (SIGN) and the Royal Collegeof Physicians, had no radiologist included in theauthorship.50,62 It is regrettable that bothguidelines have major implications forradiological workload but have not taken accountof how to manage the increased workload implicitin the guideline recommendations. Furthermore,of 22 guidelines on stroke identified through arecent literature and web search (Table 1), with atotal of at least 202 authors (among the guidelinesthat actually listed the number of authors; and asmany guidelines did not, the total authorship willbe much greater), there were only two radiologists(1%) as authors (both on the same guideline). Thisguideline was specifically about the investigationof TIA and stroke, the rest concerning themanagement of TIA or stroke but includingimaging investigations as part of the management.Involvement of each relevant discipline in theproduction of a guideline creates a feeling ofownership, which is a key component to ensuringthe guideline’s subsequent implementation.63–65 Itis of little surprise therefore that the provision ofCT for stroke has been perceived as suboptimal byclinicians in the UK.
Health Technology Assessment 2004; Vol. 8: No. 1
5
© Queen’s Printer and Controller of HMSO 2004. All rights reserved.
Background
6
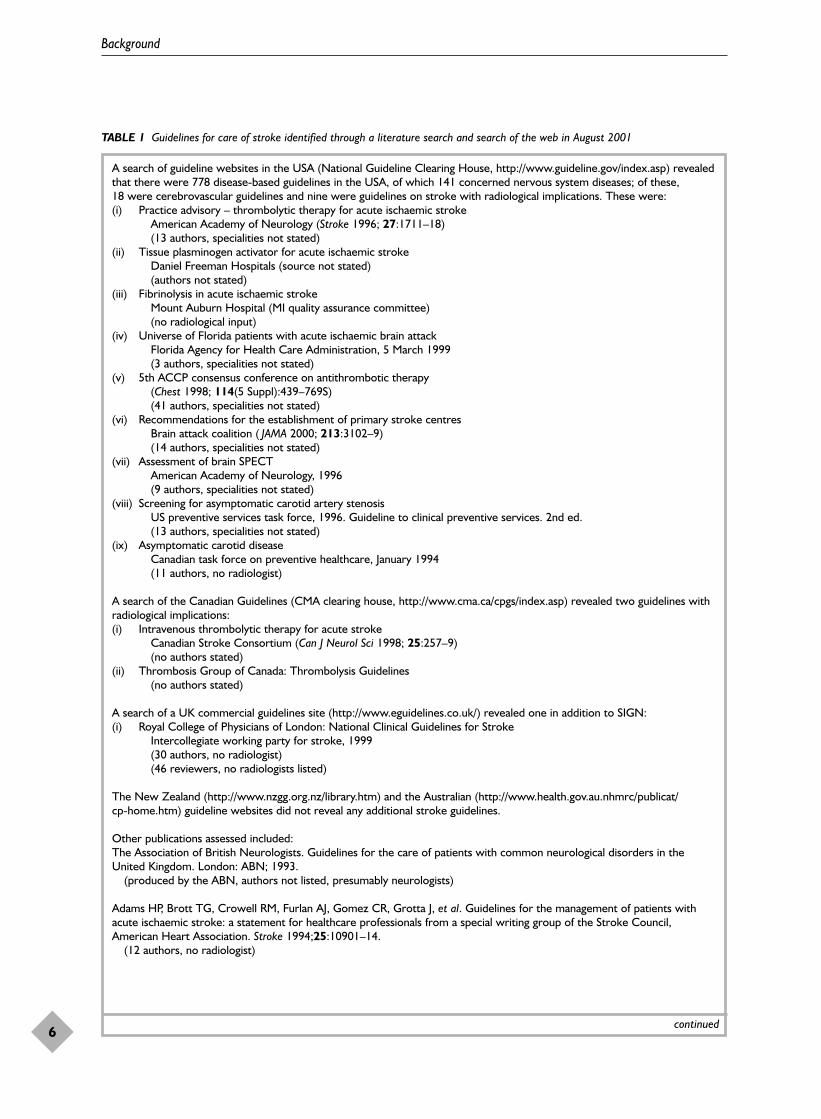
TABLE 1 Guidelines for care of stroke identified through a literature search and search of the web in August 2001
A search of guideline websites in the USA (National Guideline Clearing House, http://www.guideline.gov/index.asp) revealedthat there were 778 disease-based guidelines in the USA, of which 141 concerned nervous system diseases; of these, 18 were cerebrovascular guidelines and nine were guidelines on stroke with radiological implications. These were:(i) Practice advisory – thrombolytic therapy for acute ischaemic stroke
American Academy of Neurology (Stroke 1996; 27:1711–18)(13 authors, specialities not stated)
(ii) Tissue plasminogen activator for acute ischaemic strokeDaniel Freeman Hospitals (source not stated)(authors not stated)
(iii) Fibrinolysis in acute ischaemic strokeMount Auburn Hospital (MI quality assurance committee)(no radiological input)
(iv) Universe of Florida patients with acute ischaemic brain attackFlorida Agency for Health Care Administration, 5 March 1999(3 authors, specialities not stated)
(v) 5th ACCP consensus conference on antithrombotic therapy(Chest 1998; 114(5 Suppl):439–769S)(41 authors, specialities not stated)
(vi) Recommendations for the establishment of primary stroke centresBrain attack coalition ( JAMA 2000; 213:3102–9)(14 authors, specialities not stated)
(vii) Assessment of brain SPECTAmerican Academy of Neurology, 1996(9 authors, specialities not stated)
(viii) Screening for asymptomatic carotid artery stenosisUS preventive services task force, 1996. Guideline to clinical preventive services. 2nd ed.(13 authors, specialities not stated)
(ix) Asymptomatic carotid diseaseCanadian task force on preventive healthcare, January 1994(11 authors, no radiologist)
A search of the Canadian Guidelines (CMA clearing house, http://www.cma.ca/cpgs/index.asp) revealed two guidelines withradiological implications:(i) Intravenous thrombolytic therapy for acute stroke
Canadian Stroke Consortium (Can J Neurol Sci 1998; 25:257–9)(no authors stated)
(ii) Thrombosis Group of Canada: Thrombolysis Guidelines(no authors stated)
A search of a UK commercial guidelines site (http://www.eguidelines.co.uk/) revealed one in addition to SIGN:(i) Royal College of Physicians of London: National Clinical Guidelines for Stroke
Intercollegiate working party for stroke, 1999(30 authors, no radiologist)(46 reviewers, no radiologists listed)
The New Zealand (http://www.nzgg.org.nz/library.htm) and the Australian (http://www.health.gov.au.nhmrc/publicat/cp-home.htm) guideline websites did not reveal any additional stroke guidelines.
Other publications assessed included:The Association of British Neurologists. Guidelines for the care of patients with common neurological disorders in theUnited Kingdom. London: ABN; 1993.
(produced by the ABN, authors not listed, presumably neurologists)
Adams HP, Brott TG, Crowell RM, Furlan AJ, Gomez CR, Grotta J, et al. Guidelines for the management of patients withacute ischaemic stroke: a statement for healthcare professionals from a special writing group of the Stroke Council,American Heart Association. Stroke 1994;25:10901–14.
(12 authors, no radiologist)
continued
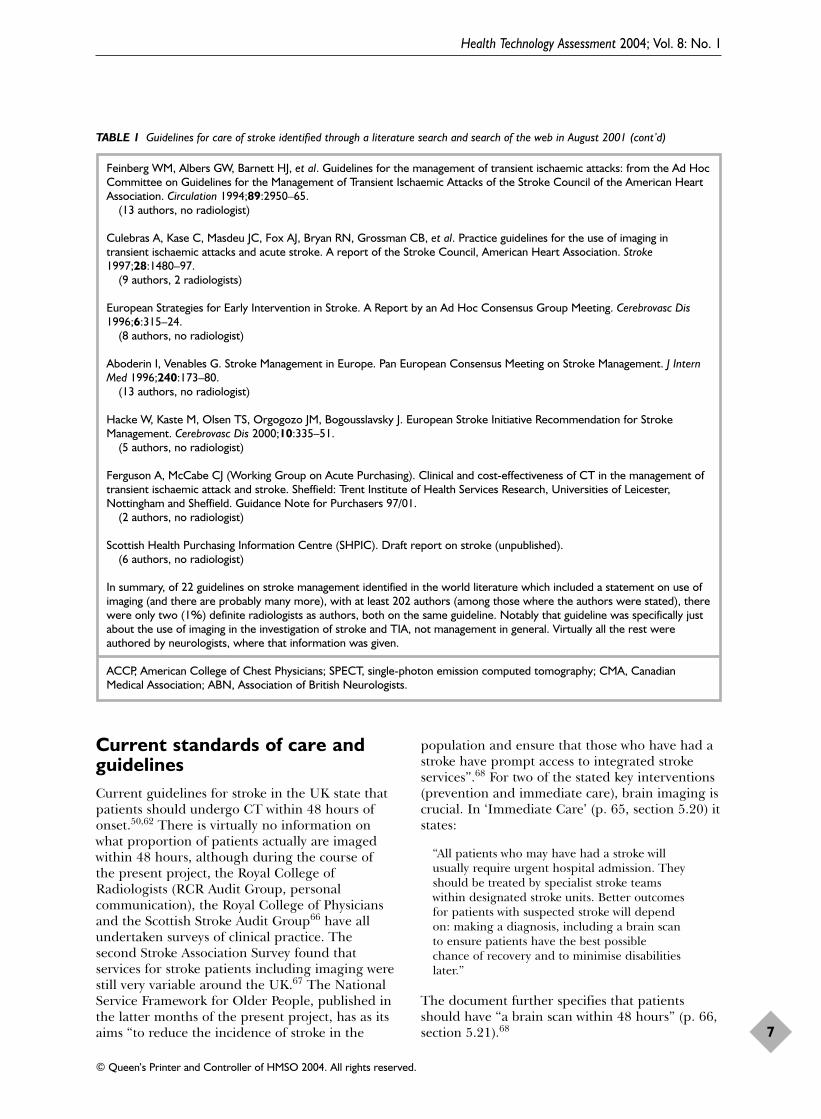
Current standards of care andguidelinesCurrent guidelines for stroke in the UK state thatpatients should undergo CT within 48 hours ofonset.50,62 There is virtually no information onwhat proportion of patients actually are imagedwithin 48 hours, although during the course of the present project, the Royal College ofRadiologists (RCR Audit Group, personalcommunication), the Royal College of Physiciansand the Scottish Stroke Audit Group66 have allundertaken surveys of clinical practice. Thesecond Stroke Association Survey found thatservices for stroke patients including imaging werestill very variable around the UK.67 The NationalService Framework for Older People, published inthe latter months of the present project, has as itsaims “to reduce the incidence of stroke in the
population and ensure that those who have had astroke have prompt access to integrated strokeservices”.68 For two of the stated key interventions(prevention and immediate care), brain imaging iscrucial. In ‘Immediate Care’ (p. 65, section 5.20) itstates:
“All patients who may have had a stroke will usually require urgent hospital admission. Theyshould be treated by specialist stroke teams within designated stroke units. Better outcomes for patients with suspected stroke will depend on: making a diagnosis, including a brain scan to ensure patients have the best possible chance of recovery and to minimise disabilities later.”
The document further specifies that patientsshould have “a brain scan within 48 hours” (p. 66,section 5.21).68
Health Technology Assessment 2004; Vol. 8: No. 1
7
© Queen’s Printer and Controller of HMSO 2004. All rights reserved.
TABLE 1 Guidelines for care of stroke identified through a literature search and search of the web in August 2001 (cont’d)
Feinberg WM, Albers GW, Barnett HJ, et al. Guidelines for the management of transient ischaemic attacks: from the Ad HocCommittee on Guidelines for the Management of Transient Ischaemic Attacks of the Stroke Council of the American HeartAssociation. Circulation 1994;89:2950–65.
(13 authors, no radiologist)
Culebras A, Kase C, Masdeu JC, Fox AJ, Bryan RN, Grossman CB, et al. Practice guidelines for the use of imaging intransient ischaemic attacks and acute stroke. A report of the Stroke Council, American Heart Association. Stroke1997;28:1480–97.
(9 authors, 2 radiologists)
European Strategies for Early Intervention in Stroke. A Report by an Ad Hoc Consensus Group Meeting. Cerebrovasc Dis1996;6:315–24.
(8 authors, no radiologist)
Aboderin I, Venables G. Stroke Management in Europe. Pan European Consensus Meeting on Stroke Management. J InternMed 1996;240:173–80.
(13 authors, no radiologist)
Hacke W, Kaste M, Olsen TS, Orgogozo JM, Bogousslavsky J. European Stroke Initiative Recommendation for StrokeManagement. Cerebrovasc Dis 2000;10:335–51.
(5 authors, no radiologist)
Ferguson A, McCabe CJ (Working Group on Acute Purchasing). Clinical and cost-effectiveness of CT in the management oftransient ischaemic attack and stroke. Sheffield: Trent Institute of Health Services Research, Universities of Leicester,Nottingham and Sheffield. Guidance Note for Purchasers 97/01.
(2 authors, no radiologist)
Scottish Health Purchasing Information Centre (SHPIC). Draft report on stroke (unpublished).(6 authors, no radiologist)
In summary, of 22 guidelines on stroke management identified in the world literature which included a statement on use ofimaging (and there are probably many more), with at least 202 authors (among those where the authors were stated), therewere only two (1%) definite radiologists as authors, both on the same guideline. Notably that guideline was specifically justabout the use of imaging in the investigation of stroke and TIA, not management in general. Virtually all the rest wereauthored by neurologists, where that information was given.
ACCP, American College of Chest Physicians; SPECT, single-photon emission computed tomography; CMA, CanadianMedical Association; ABN, Association of British Neurologists.

Brain imaging is a key component of themanagement of acute stroke, and it should be donein a timely fashion. It is, however, unclear preciselywhat the clinical benefits from CT scanning are,and whether the policy of CT for all strokepatients within 48 hours of onset is cost-effective.
The questions posed in thisprojectThe aims of the present project were therefore:
� to identify the clinical benefits from CTscanning in acute stroke within 48 hours ofstroke onset
� to outline a variety of strategies from whichhealth commissioners could choose the one thatbest suited their local resources and needs
� to give clear estimates in financial andpopulation terms of the cost of these differentstrategies and compare them by means of acost-effectiveness analysis
� to begin to determine in which patients evenmore expensive investigations such as MRmight be cost-effective.
What information is required to determine whether CT is cost-effective or not?The main determinants of the cost-effectiveness ofCT scanning are:
� the cost of doing the scanning itself (at differenttimes of the day, in different sorts of hospital)
� the length of stay (LOS) in hospital for patientswith stroke (of haemorrhagic or ischaemicstroke, and of different severities of stroke) andthe cost of that stay in different types of hospital
� the effect of treatment decisions arising fromknowledge provided by the CT scan(incorporating the effect of accuracy ofdiagnosis) on subsequent LOS (of haemorrhagicor ischaemic stroke and of different severities ofstroke), including the effect of giving the corrector wrong treatment to patients.
The information that was needed to be able tostart determining the impact of CT scanning ondiagnosis and subsequent treatment decisions isshown in Appendix 2.
The cost of scanning was determined by surveyingseveral hospitals in Scotland to obtain real data on
the cost of running a CT scanning service in ateaching and district general hospital.
LOS for different subtypes and severities of strokewas determined using data from the authors’hospital stroke registry, the Lothian StrokeRegister (LSR) (personal communication, 2000).This database was established to store data on allstrokes admitted to the Western General Hospitalin Edinburgh (a teaching hospital providing thestroke service for North Lothian with a catchmentpopulation of about 500,000 for stroke and1,500,000 for neurosciences). Clinical, laboratory,imaging, management and follow-up data to 2years after stroke have been recorded since 1990.Data on the cost of care in different types ofhospital were obtained from standard NHS tablesas these are more widely studied and standardreference tables of recently acquired data exist onthe cost of patient care in hospital.69
The data on the effect on outcome after differenttypes of stroke of making the right or wrongdiagnosis was obtained from systematic reviews ofthe literature. Existing systematic reviews wereused where relevant and up to date, and newreviews performed where necessary. The need fornew reviews was greatest in the assessment ofimaging, as there is little tradition of undertakingsystematic reviews of diagnostic tests and thesesorts of review are regarded as difficult, so themethodology is less well developed than fortreatment reviews.70–72 Thus, the study soughtestimates of the accuracy of the clinical diagnosisof stroke (versus not stroke), of infarct versushaemorrhage; of the frequency of non-vascularpathologies that can produce a stroke-like clinicalsyndrome (‘stroke mimics’), of infarct andhaemorrhage; of the prognosis of differentsubtypes of stroke (i.e. risk of recurrence andfunctional outcome); of the accuracy of CT andMRI for detecting haemorrhage and infarction; ofthe benefits of aspirin in patients with cerebralinfarction; of the hazard of aspirin in patients withintracerebral haemorrhage; of commonmanagement pathways in stroke; of other forms oftreatment for acute stroke such as thrombolysis forischaemic stroke and haematoma evacuation forhaemorrhagic stroke; of quality of life associatedwith different functional outcomes after stroke; ofhow time in hospital related to the patientcharacteristics such as the severity of the stroke; ofhow the effect of treatment expressed as a changein functional outcome at 6 months would maponto a change in LOS in hospital; of the costs ofCT scanning in different hospitals so as to be asgeneralisable as possible; of the cost of spending
Background
8
Health Technology Assessment 2004; Vol. 8: No. 1
9
© Queen’s Printer and Controller of HMSO 2004. All rights reserved.
time in different sorts of hospital; of theavailability of CT scanning and what additionalresource might be needed to increase access forstroke patients; and of how all this might fittogether into an economic model to determinehow the effect of CT and the treatment decisionsarising thereafter would affect both clinicaloutcome and cost of stroke care. These are listedin more detail in Appendix 2. Some of thisinformation was already available to the authors,some was sought through detailed systematicreviews, some was obtained from new primarystudies or by surveying NHS departments, andsome required educated estimates because therewere no useful data in the literature and it was notpossible to acquire these new data in the contextof the present project.
Potential applications of theseresultsThis information would be essential in practical,everyday situations in clinical medicine, forexample: the planning of new stroke units (theNational Service Framework has indicated thatorganised stroke services should be availableeverywhere); deciding where to site new CTscanners; guiding radiology departments on howquickly they need to scan stroke patients andtherefore the sort of service they need to providein terms of access during a 24-hour day andresponsiveness; and in hospitals without CT onsite, whether they should arrange transfer ofpatients for a scan. The intention was todetermine the cost of several strategies, rangingfrom ‘CT scan all stroke patients regardless ofseverity of stroke or time lapse from stroke onset’to ‘scan no strokes and manage patients usingclinical examination findings only’, so that thefinancial and human costs would be absolutelyclear, including the impact on hospital andcommunity services and families.


BackgroundIn order to model the process of the diagnosis andtreatment of stroke and the effect on outcome, itwas necessary to attribute diagnostic probabilitiesto each stage in the diagnostic and decision-making process. The first step was to determinethe accuracy of the clinical diagnosis of stroke inthe absence of imaging. This includes thediagnosis of stroke versus not stroke and ofhaemorrhagic versus ischaemic stroke. Later stagesin the decision model would then address theaccuracy of imaging (see Chapter 3), the effect oftreatment (with aspirin as the only proventreatment, Chapter 4) and then the outcomes. Thepresent chapter is concerned with the accuracy ofthe clinical diagnosis of stroke.
To obtain this information systematic reviews andsystematic descriptive studies of the relevantliterature on the clinical diagnosis of stroke, andon the use of imaging in epidemiology studies,were conducted to determine whether there wasany evidence that the incidence of PICH variedwith severity of stroke and other patientcharacteristics.
The clinical diagnosis of stroke versusnot stroke, and of infarct versushaemorrhageSeveral medical conditions can present withsymptoms similar or identical to those of stroke.For example, intracerebral neoplasm can presentwith sudden-onset hemiparesis, and vestibularneuronitis can present with sudden symptomssimilar to brainstem ischaemia. Differentiatingsuch conditions from a (vascular cause of) strokeon clinical examination can be difficult. Imagingwith CT will usually determine whether theunderlying lesion is vascular or non-vascular, suchas a neoplasm. However, to determine the cost-effectiveness of CT, it was necessary to knowprecisely how often the clinical diagnosis of stroke(versus not stroke) was correct. In particular, todetermine the cost-effectiveness of certainpathways of care, one needs to know whether
there is any clinical diagnostic pathway (e.g. beingexamined by a paramedic as opposed to a medical registrar) that performed differently toothers.
Distinguishing the pathological cause of stroke(i.e. ischaemic stroke or PICH) on clinicaljudgement alone is also difficult. Althoughpatients with PICH are said to be more likely to bedrowsy79 or hypertensive, or to vomit more oftenthan those with ischaemic stroke, it is well knownthat the distinction of infarct from haemorrhageon clinical grounds is unreliable. One study of ahospital population found the initial bedsidediagnosis of infarct versus haemorrhage byphysicians to be correct in only 69% of cases.73
To aid the clinical diagnosis of PICH, scoringsystems were developed that made use of thepresence or absence of factors found to beassociated with PICH in hospital studies. Two ofthe best-known examples are the Allen probability guide (also known as Guy’s HospitalScore)29 and Siriraj score.30 These are animprovement on unscored clinical judgementalone: using the Allen guide was said to improveclinician’s accuracy in correctly distinguishingischaemic stroke from PICH from 84% to 90%.29
The sensitivity of a Siriraj score of greater >1(indicating PICH) was 89.3%.30 However, furthertesting of these scores showed that they were muchless accurate when used in a stroke populationother than the one from which they werederived.34,35 In one study, the sensitivity of theAllen score (using a cut-off of >24 to indicate a high likelihood of haemorrhage) dropped to31% and the sensitivity of a Siriraj score of >1, to 48%.35
These scores are cumbersome as well as unreliable.For example, the Siriraj score uses the followingequation:
Score = (2.5 × Consciousness) + (2 × Vomiting)+ (2 × Headache) + (0.1 × Diastolicblood pressure) – (3 × Atheroma) – 12
Health Technology Assessment 2004; Vol. 8: No. 1
11
© Queen’s Printer and Controller of HMSO 2004. All rights reserved.
Chapter 2
The contribution of brain imaging to the diagnosis of stroke: a systematic review of the accuracy of
the clinical diagnosis of stroke

Consciousness: alert = 0, drowsy/ stupor = 1,semicoma/coma = 2Vomiting: no = 0, yes = 1Headache within 2 hours: no = 0, yes = 1Atheroma markers: none = 0, one or more = 1.
A value of > 1 indicates haemorrhage and < 1indicates infarction with a predictive accuracy of90.3% according to the original publication.However, according to Hawkins and colleagues,35
a patient with a 90% chance of having a PICH onthe Siriraj score still has a 50% chance of havingan infarct. In other words, because these scoreswere developed in hospital-admitted patients,their accuracy may have been compromised by thebias towards the more severe strokes seen inhospital-admitted cases compared with patientscared for in the community.
As CT scanning has become more available, theincidence of small PICHs causing stroke hasappeared to increase,74 but this is likely to be dueto better diagnosis rather than a true increase inincidence. With this has come increasingrealisation that patients with PICH do notnecessarily present with severe symptoms.34,79
Might this mean that the incidence of PICH hasbeen underestimated? As the signs ofhaemorrhage do not remain forever on CT(possibly not more than 10 days for smallhaemorrhages), patients should be scanned soonafter stroke to avoid misdiagnosing smallhaemorrhages as infarcts.
A systematic review was performed of studiesproviding data on lesions that mimicked stroke andthe agreement between clinicians for the clinicaldiagnosis of stroke. This gave a comprehensivepicture of the range of conditions that can mimicstroke, the proportions of a stroke population thatthey represent, and the relative importance ofneurological training in making a stroke diagnosis.
How reliable are the estimates ofPICH? Epidemiological studies of stroke incidencecommonly attempt to determine the relativeproportions of ischaemic stroke and PICH, as wellas the overall incidence of all stroke. The dataaccrued from such studies are then used in a widerange of health economics, clinical planning andresearch settings. Hospital-based studies aresubject to referral bias, in that more severe strokesare more likely to be admitted to hospital thanmild ones. This bias is less likely in community-based studies, in which all strokes occurring in ageographically defined population are counted.
The International Stroke Incidence Collaborationidentified comparable community incidencestudies, mostly from the 1980s and early 1990s,and found that 73–86% of strokes were ischaemic,8–15% were attributed to PICH and 1–5% tosubarachnoid haemorrhage.1 Some studiesincluded an ‘unknown’ category for cases wherethe cause was uncertain. ‘Unknown’ usually meantthat it was uncertain whether the patient had hada PICH or infarct because they had not had a CTscan, or a post-mortem if they had died. Themethods used to diagnose the cause of the strokevaried between studies, although most appeared touse brain CT scanning at least to some degree.However, the precise use of CT scanning (theproportion scanned, within what time interval),and the influence that this might have had on theproportion of strokes diagnosed as ischaemicstroke or PICH has not been reviewed. Therefore,the brain imaging used in the community strokeincidence studies were systematically reviewed todetermine the confidence limits around theestimate of the proportion due to infarct or PICH,and the relationship (if possible) with age, severityand other factors that may be useful in clinicalpractice.
MethodsObjectivesTo determine: � the proportion of patients presenting with
stroke-like symptoms who turn out to not tohave had a stroke (i.e. to have a non-vascularcause of their symptoms)
� the conditions that most commonly causestroke-like symptoms
� the frequency of stroke due to cerebralinfarction and PICH
� the accuracy of the estimate of the incidence of stroke due to PICH in epidemiologicalstudies.
Criteria for considering studiesFor the descriptive systematic review of theproportion of stroke mimics, stroke studies wereincluded if they provided values for the finalproportion of true strokes in a populationpresenting with stroke symptoms, and where itcould be determined which clinician or paramedicmade the first diagnosis. The review also includedstudies of populations presenting with strokesymptoms, in which the initial and finalproportions of patients with the diagnosis of stroke(compared with non-stroke) were given, as well asdetails of the nature of stroke mimics.
The contribution of brain imaging to the diagnosis of stroke
12

For the systematic review of imaging usage incommunity-based stroke incidence studies, allcommunity-based stroke incidence studies in whichthe actual proportion of ischaemic stroke andhaemorrhage was reported were included.Hospital-based studies were excluded, as werestudies that did not report the frequency of PICHseparately from ischaemic stroke (i.e. just reportedall ‘stroke’), studies that documented either PICHor ischaemic stroke only, or case fatality data only.
Search strategyTo identify studies for both descriptive systematicreviews, electronic searches of the medicaldatabases MEDLINE and EMBASE wereperformed (Appendix 4). To make the searches asinclusive as possible, an extended search strategywas used to identify articles relevant to stroke. Thisstrategy, pioneered by the Cochrane CollaborationStroke Research Group75 for the identification ofrandomised controlled trials (RCTs), identifiesmore relevant references than a standard searchthat uses subject headings and specific text words.Although this strategy has not been usedpreviously to identify observational studies, it wasused here as a starting point to maximise thenumber of references captured. Specificmethodological criteria for each review aredocumented separately below.
Data pertaining to the proportion of stroke mimicsin a population were found in studies with differingprimary purposes, so a number of searches wereundertaken to be sure of identifying all relevantstudies. In the electronic searches, title and textwords for ‘diagnosis’ were added to the CochraneLibrary extended stroke strategy. A separate searchusing title and text words for ‘timing’ and ‘delay’was also performed, as studies pertaining to thetiming of admission of patients with strokesymptoms to hospital, with reference to thepotential delivery of hyperacute stroke treatment,occasionally contained relevant data. Abstracts ofconference proceedings concerned with the timeof arrival of patients with stroke symptoms tohospital were identified and followed-up.
Stroke incidence studies identified for the systematicreview of scanning policies in epidemiologicalstudies were also sought by searching MEDLINEand EMBASE from January 1980 to April 1999,and adding the following text words to theCochrane Library extended search strategy:75
‘stroke register, stroke registry, incidence,community’ and subject heading ‘incidence’. Theelectronic search went no further back than 1980because, although CT was clinically available
before this time, its use in community incidencestudies was very limited. The authors alsoexamined reference lists and had discussions withother interested investigators, notably Dr CSudlow and Professor CP Warlow of theInternational Stroke Incidence Collaboration.1
Data extractionFor the study of stroke mimics, data were extractedon: the purpose and size of study, the professionand level of experience of the person making thediagnosis, the gold standard by which finaldiagnosis was made, the proportions of the studypopulation with final diagnosis of non-stroke,ischaemic stroke or PICH, values for sensitivity andspecificity of the diagnosis of stroke compared withnon-stroke, and ischaemic stroke compared withPICH. Data were analysed with simple descriptivestatistics. The mean sensitivity of diagnosis fordifferent healthcare providers was determinedwith 95% confidence intervals (CIs). Studies inwhich emergency physicians had access to CTresults (i.e. not truly testing clinical diagnosis onits own) were not included in these calculations.
For the systematic review of imaging in strokeincidence studies, data were extracted on year ofpublication and sample size of each study, themethod of diagnosing the pathological cause ofstroke, use of scanning, type of scanning, theproportion with ischaemic stroke or PICH, andany information on patients not scanned. Datawere entered into an Access database and analysedwith descriptive statistics. Patients withsubarachnoid haemorrhage were excluded fromboth the denominator and numerator, becausealthough there may be patients with overlappingsymptoms, this condition is generally distinct fromstroke due to infarction or intracerebralhaemorrhage.
Details of included studiesStroke mimicsElectronic searches captured 3794 references.Seventeen studies were identified that includeddata on the proportion of stroke mimics in apopulation presenting with stroke (Table 2). Thetotal number of patients presenting with strokesymptoms was 9316, and the median study sizewas 411.
The studies varied widely:
� seven (6228 patients) were stroke incidencestudies, in which the primary aim was not to
Health Technology Assessment 2004; Vol. 8: No. 1
13
© Queen’s Printer and Controller of HMSO 2004. All rights reserved.
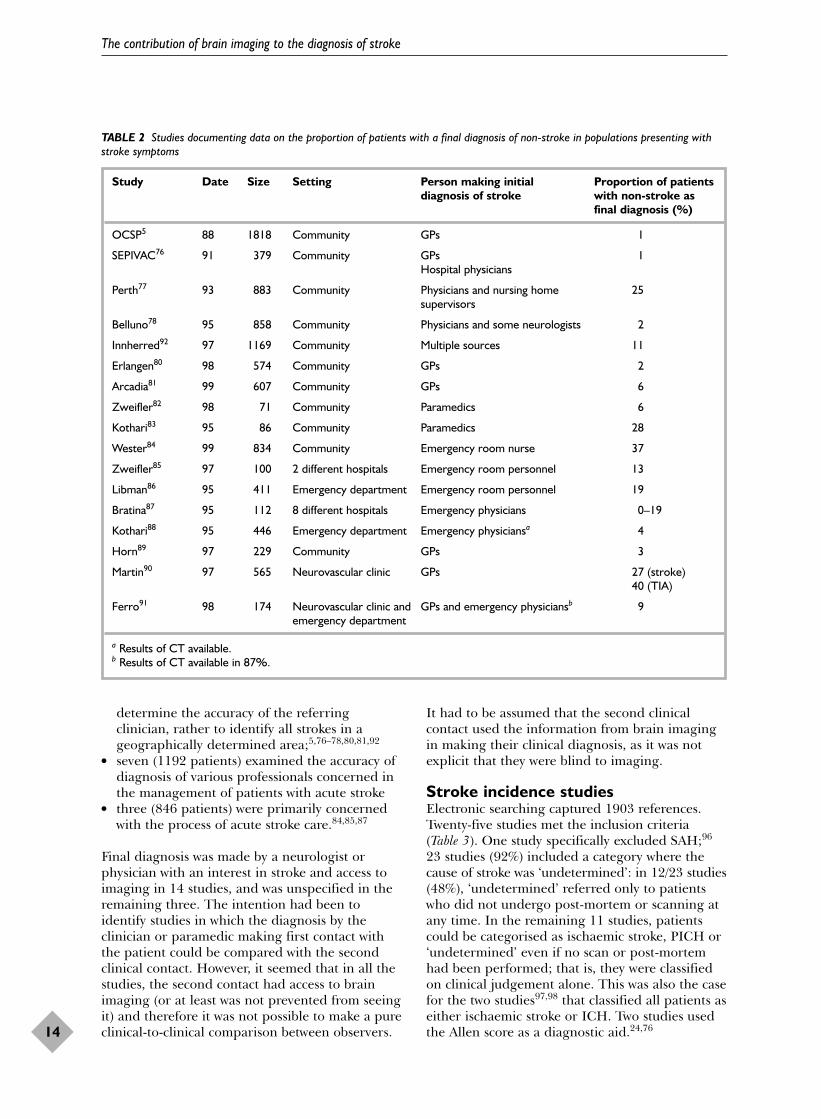
determine the accuracy of the referringclinician, rather to identify all strokes in ageographically determined area;5,76–78,80,81,92
� seven (1192 patients) examined the accuracy ofdiagnosis of various professionals concerned inthe management of patients with acute stroke
� three (846 patients) were primarily concernedwith the process of acute stroke care.84,85,87
Final diagnosis was made by a neurologist orphysician with an interest in stroke and access toimaging in 14 studies, and was unspecified in theremaining three. The intention had been toidentify studies in which the diagnosis by theclinician or paramedic making first contact withthe patient could be compared with the secondclinical contact. However, it seemed that in all thestudies, the second contact had access to brainimaging (or at least was not prevented from seeingit) and therefore it was not possible to make a pureclinical-to-clinical comparison between observers.
It had to be assumed that the second clinicalcontact used the information from brain imagingin making their clinical diagnosis, as it was notexplicit that they were blind to imaging.
Stroke incidence studiesElectronic searching captured 1903 references.Twenty-five studies met the inclusion criteria (Table 3). One study specifically excluded SAH;96
23 studies (92%) included a category where thecause of stroke was ‘undetermined’: in 12/23 studies(48%), ‘undetermined’ referred only to patientswho did not undergo post-mortem or scanning atany time. In the remaining 11 studies, patientscould be categorised as ischaemic stroke, PICH or‘undetermined’ even if no scan or post-mortemhad been performed; that is, they were classifiedon clinical judgement alone. This was also the casefor the two studies97,98 that classified all patients aseither ischaemic stroke or ICH. Two studies usedthe Allen score as a diagnostic aid.24,76
The contribution of brain imaging to the diagnosis of stroke
14
TABLE 2 Studies documenting data on the proportion of patients with a final diagnosis of non-stroke in populations presenting withstroke symptoms
Study Date Size Setting Person making initial Proportion of patients diagnosis of stroke with non-stroke as
final diagnosis (%)
OCSP5 88 1818 Community GPs 1
SEPIVAC76 91 379 Community GPs 1Hospital physicians
Perth77 93 883 Community Physicians and nursing home 25supervisors
Belluno78 95 858 Community Physicians and some neurologists 2
Innherred92 97 1169 Community Multiple sources 11
Erlangen80 98 574 Community GPs 2
Arcadia81 99 607 Community GPs 6
Zweifler82 98 71 Community Paramedics 6
Kothari83 95 86 Community Paramedics 28
Wester84 99 834 Community Emergency room nurse 37
Zweifler85 97 100 2 different hospitals Emergency room personnel 13
Libman86 95 411 Emergency department Emergency room personnel 19
Bratina87 95 112 8 different hospitals Emergency physicians 0–19
Kothari88 95 446 Emergency department Emergency physiciansa 4
Horn89 97 229 Community GPs 3
Martin90 97 565 Neurovascular clinic GPs 27 (stroke)40 (TIA)
Ferro91 98 174 Neurovascular clinic and GPs and emergency physiciansb 9emergency department
a Results of CT available.b Results of CT available in 87%.

Details of excluded studiesStroke mimicsStudies concerning the accuracy of emergencyphysicians unfortunately provided the results of aCT scan available at first point of contact andtherefore did not represent the clinical diagnosticaccuracy alone.88,91 These were excluded.
Stroke incidence studiesStudies that were not truly community based wereexcluded.
ResultsStroke mimicsThe proportion of the study population that waseventually diagnosed as having a condition otherthan stroke varied from 1 to 37% (mean 12.5%,95% CI 6.7 to 18.3, Table 2). Eighteen conditionswere identified that could mimic stroke oftenenough to be counted separately in these studies(Table 3). The most common stroke mimicsincluded primary (up to 3% of patients with‘stroke’) and secondary (up to 1.2%) cerebralneoplasms, seizures (up to 8%), systemic infections(up to 9%) and subdural haematoma (up to 2%).
Excluding the seven stroke incidence studies, themean sensitivities for the diagnosis of stroke bydifferent groups of health professionals at firstpoint of contact with the patient with strokesymptoms were: paramedics 74.9% (95% CI 68.8
to 81.0%), general practitioners (GPs) 87.7% (95%CI 84.7 to 90.8) and emergency room personnel71.1% (95% CI 68.6 to 73.6%), when comparedwith the reference standard of ‘neurologist orphysician with an interest in stroke’, the latteroperating with knowledge of the brain scan result.
Health Technology Assessment 2004; Vol. 8: No. 1
15
© Queen’s Printer and Controller of HMSO 2004. All rights reserved.
TABLE 3 Conditions presenting with stroke-like symptoms and the ranges of their relative frequency in the stroke populationsidentified
Final diagnosis Proportion of total stroke population (%) Study reference
Primary brain tumour 0.3–2.9 5, 76, 77, 80–82, 84, 86, 91–93Seizure 0.3–8.5 77, 82–86, 88, 90–93Toxic-metabolic state 0.2–3.9 77, 82–86, 88, 91, 93Subdural haemorrhage 0.3–1.9 5, 76, 77, 80, 84, 86, 88Systemic infection 0.5–9.3 83, 86, 91, 92, 94Cerebral infection 0.2–1.7 77, 80, 81, 86, 88, 93Migraine 0.4–3.0 77, 81, 82, 88, 90, 92, 93Vertigo/vestibular 0.2–4.0 77, 86, 88, 90–93Syncope 0.2–8.5 77, 83–85, 88, 91Psychogenic 0.2–2.7 77, 85, 86, 88, 90, 91, 95Peripheral neuropathy 0.5–9.3 81, 83, 85, 88, 91, 93Cerebral metastases 0.3–1.2 5, 76, 83, 91Transient global amnesia 0.1–1.2 77, 83, 86Cardiac 0.6–2.3 83, 86, 92Old stroke, nil new 1.0–1.5 84, 85Hypertensive encephalopathy 0.2–1.0 85, 86Dementia 0.5–0.8 81, 86Multiple sclerosis 0.2–1.7 80, 81, 86, 88, 90
TABLE 4 Included stroke incidence studies
Study Date Size
Tilburg, The Netherlands99 1980 152Hisayama, Japan100 1981 203Shibata, Japan101 1981 415Beijing, China102 1983 130Benghazi, Libya98 1986 329Moscow, Russia103 1988 1538Oxford, UK24 1990 675Akita, Japan104 1990 109Umbria, Italy76 1991 375Dijon, France105 1991 984Valle d’Aosta, Italy106 1992 254Frederiksberg, Denmark107 1992 262FINMONICA108 1992 3574Malmo, Sweden109 1992 524Perth, Australia77 1993 492Warsaw, Poland96 1994 462Brisbane, Australia110 1995 2056Belluno, Italy78 1995 474Rochester, USA97 1996 496L’Aquila, Italy111 1997 819Tartu, Estonia112 1997 829Innherred, Norway92 1997 432Erlangen, Germany80 1998 354London, UK113 1999 612Arcadia, Greece81 1999 555

Stroke incidence studiesIn the 25 included studies (Table 4), the details ofscanning rates, times of scanning and patientexclusions varied immensely; 5/25 (20%) studiesgave no scanning details at all.100–104 Of the 20that did give details, the proportion of patientsscanned (or who had a post-mortem) varied fromless than 30% to approaching 96% (Figure 1).Although these 20 studies indicated theproportion of patients scanned, only 13/25 (52%)mentioned the time interval from onset ofsymptoms to CT scanning (Figure 2).
Information on timing of scanning wasdocumented in a number of different ways; onestudy gave a mean time interval from onset ofsymptoms to scanning,106 and two studies gave themedian time interval from symptoms toscanning.81,111 The majority of studiesdocumented the proportion of patients scannedwithin a certain time interval, ranging from 7 days,98,105,109 to 21 days92 and 30 days.24,76,77,78,80,113
In no study was it possible to determine exactlywhat proportion of patients was scanned and when(i.e. within 1 week, 2 weeks, 3 weeks after stroke),making it impossible to estimate what proportionwere scanned outside the time when CT wouldhave distinguished infarct from haemorrhagereliably. Thus, it was not possible to calculate theconfidence limits on the incidence of PICH byextrapolating from those scanned within thecorrect time window (for CT) to those scannedoutside this (or not at all). Even studies that werepublished recently did not appear to have scanned a large proportion (i.e. > 90%) ofpatients within a time-frame that would definitelyallow distinction of infarct from haemorrhage (i.e.< 10 days).80,81,113
Nine studies provided information on whichpatients were least likely to be scanned. In thesenine studies, patients treated at home, those whodied very early after their stroke, and the elderlywere the groups most likely not to be scanned atall (Table 5). In the few studies that specifically
The contribution of brain imaging to the diagnosis of stroke
16
0000303132515260686974808282868888898989909096
Moscow103
Beijing102
Hisayama100
Shibata101
FINMONICA108
Brisbane110
Tartu112
Malmo109
Tilburg99
Akita104
Warsaw96
SEPIVAC76
Frederiksberg107
Benghazi98
d’Aosta106
Arcadia81
Perth77
Innherred92
London113
OCSP5
L’Aquila111
Dijon105
Belluno78
Rochester97
Erlangen80
Total
Proportion scanned/PM Study
0 10 20
% PICH
30 40 50
FIGURE 1 Stroke incidence studies ranked according to proportions of strokes scanned overall (point estimates of PICH with 95%CIs). Note: scans may have been greater than 2 weeks from stroke onset (see Figure 2 for timing).
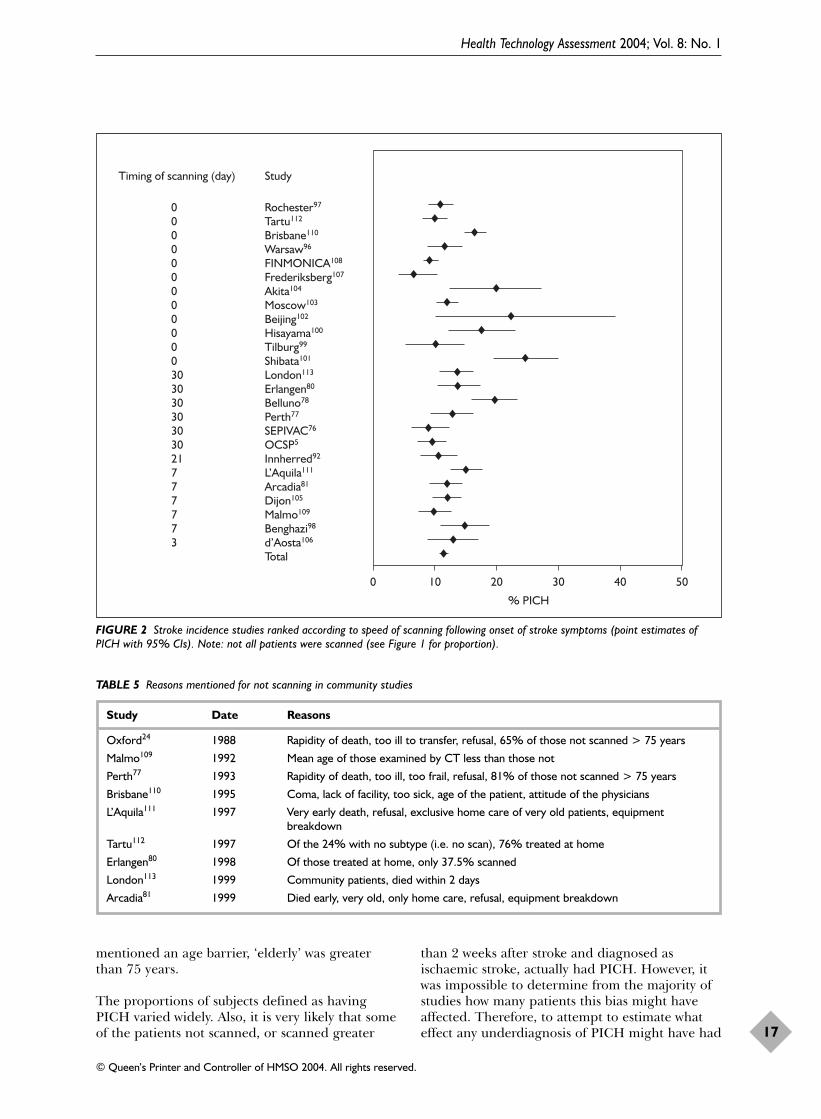
mentioned an age barrier, ‘elderly’ was greaterthan 75 years.
The proportions of subjects defined as havingPICH varied widely. Also, it is very likely that someof the patients not scanned, or scanned greater
than 2 weeks after stroke and diagnosed asischaemic stroke, actually had PICH. However, itwas impossible to determine from the majority ofstudies how many patients this bias might haveaffected. Therefore, to attempt to estimate whateffect any underdiagnosis of PICH might have had
Health Technology Assessment 2004; Vol. 8: No. 1
17
© Queen’s Printer and Controller of HMSO 2004. All rights reserved.
00000000000030303030303021777773
Rochester97
Tartu112
Brisbane110
Warsaw96
FINMONICA108
Frederiksberg107
Akita104
Moscow103
Beijing102
Hisayama100
Tilburg99
Shibata101
London113
Erlangen80
Belluno78
Perth77
SEPIVAC76
OCSP5
Innherred92
L’Aquila111
Arcadia81
Dijon105
Malmo109
Benghazi98
d’Aosta106
Total
Timing of scanning (day) Study
0 10 20
% PICH
30 40 50
FIGURE 2 Stroke incidence studies ranked according to speed of scanning following onset of stroke symptoms (point estimates ofPICH with 95% CIs). Note: not all patients were scanned (see Figure 1 for proportion).
TABLE 5 Reasons mentioned for not scanning in community studies
Study Date Reasons
Oxford24 1988 Rapidity of death, too ill to transfer, refusal, 65% of those not scanned > 75 years
Malmo109 1992 Mean age of those examined by CT less than those not
Perth77 1993 Rapidity of death, too ill, too frail, refusal, 81% of those not scanned > 75 years
Brisbane110 1995 Coma, lack of facility, too sick, age of the patient, attitude of the physicians
L’Aquila111 1997 Very early death, refusal, exclusive home care of very old patients, equipmentbreakdown
Tartu112 1997 Of the 24% with no subtype (i.e. no scan), 76% treated at home
Erlangen80 1998 Of those treated at home, only 37.5% scanned
London113 1999 Community patients, died within 2 days
Arcadia81 1999 Died early, very old, only home care, refusal, equipment breakdown

on the observed ratio of PICH/infarct, ‘best’ and‘worst’ case scenarios were estimated. To do this,only studies that scanned more than 30% ofpatients were used. In the best case scenario, it wasassumed that no patients in the uncertain (i.e.unscanned) category had PICH, and in the worstcase scenario that all patients in the uncertaincategory had PICH, as well as those actuallyclassified as PICH. The mean proportions perstudy (best and worst) and 95% confidence intervalswere calculated. The mean study sample size was529 and the proportion of PICH ranged from anestimated 13% to 25% (95% CI 10 to 29%).
DiscussionGeneralisability of the resultsThe descriptive systematic review of studies ofstroke mimics excluded virtually no studies. This isa poor quality literature. It is likely that thehospitals in which these studies were done hadpersonnel with a particular interest in stroke, sothat the proportion of misdiagnoses may havebeen less than might be seen in a district generalhospital where the staff have no particular interest in stroke. Thus, the estimate of theproportion of patients presenting as stroke, whoturn out subsequently not to have a stroke, isprobably low.
Not everybody presenting with strokesymptoms is having a stroke, but whodecides?No significant difference was found between theproportion of stroke mimics misdiagnosed byparamedics as opposed to medical registrars, forexample, but that may be because the studies weretoo small to expect to identify any significantdifference. General physicians seemed to be betterat making a correct diagnosis than paramedicsand emergency room personnel, althoughconfidence intervals were relatively wide.Intuitively, one would expect more experiencedphysicians with an interest in stroke to make fewermisdiagnoses than GPs who may only see a strokea few times a year. If nothing more, these studiesat least provide an estimate and confidenceintervals of the magnitude of disagreement amongdifferent observers examining stroke patients.Whether the differences are due to experience, ornew information becoming available as timepasses, or true fluctuation in symptoms and signs,or differences in the primary purpose of thesestudies and their methodology, is not known. Whatthese studies do highlight is that diagnosis byclinician alone, without a corroborative scan, will
be incorrect a significant proportion of the time.This proportion is less when scan results areavailable.88 If (as with thrombolysis) time topresentation to the acute stroke team is important,who makes the first referral is relativelyimmaterial.
Scanning policies in stroke incidencestudies are not comprehensiveNo community-based study of stroke incidenceachieved a 100% CT scan rate within a time-framethat would definitely allow distinction of PICHfrom ischaemic stroke (i.e. within 10 days at thevery most). In general, studies either scannedquickly enough but scanned relatively few patients,or scanned more patients but too late todistinguish PICH reliably. It is therefore very likelythat the incidence of PICH has beenunderestimated, particularly the incidence of smallhaemorrhages, but there is really not enoughinformation to determine by what degree. The‘best and worst’ estimate of 13% to 25% givessome indication of the potential scale of theproblem. Even in the latest community strokestudy from Melbourne, NEMESIS (published inAugust 2001, after the end of the study period forthe systematic review) neither made clear theprecise scanning policy, nor stated exactly whatproportion of patients were scanned within thefirst week, 2 weeks, and so on, of stroke.114 Theirmethods refer to the use of CT or MR within 28days of stroke; intracerebral haemorrhage wasdefined as a stroke in which a CT scandemonstrated an area of hyperdensity within thebrain, or for scans performed beyond 1 week, anarea of attenuation with ring enhancement afterinjection of contrast, or MR showed an area ofhypointensity or isointensity on T1 and markedhypointensity on T2-weighted images. However,although the results state that CT, MR or autopsywas performed “soon after stroke” in 91% of thosewith first events (95% CI 88 to 95%), nowhere dothe authors state what proportion were scannedwithin 1 or 2 or 3 or 4 weeks, with what modality,or anything about the proportion or timing ofscanning for recurrent strokes. The discussionrefers to confirmation of the pathological type ofstroke with “mainly CT”. They found that 14.5%of stroke was due to intracerebral haemorrhage(95% CI 10.3 to 18.6%). As with most other studiesthat provided the data, the majority of those notscanned at all (or autopsied) were aged over 75years (18/24 undetermined strokes of the total 276patients). The authors draw attention to the quitemarked variation in age- and gender-adjustedannual incidence rates of haemorrhagic strokebetween European stroke incidence studies, and
The contribution of brain imaging to the diagnosis of stroke
18

blame this on differences in the proportion ofstroke of undetermined cause. They suggest thathaemorrhagic strokes are likely to be over-represented in the ‘stroke of undetermined type’category, as evidenced by the high case fatalityrate in both the haemorrhage and the ‘stroke ofundetermined type’ categories. They also suggestthat the low power of the studies to detect the trueincidence of haemorrhagic stroke (as it is lessfrequent) may be a contributing factor. It is sadthat the failure to use a robust, clearly defined,imaging protocol has again gone unrecognised asa major contributing factor. Two other incidencestudies (Hisayama and Shiga), also published afterthe search period for the present systematicreview, failed even more than NEMESIS todescribe their scanning.115,116 One of these studiesattempted to determine subtypes of stroke andrisk factors for 32 years starting in 1961.116 Themethods refer only to ‘recent’ (no definition) brainimaging, but there is no indication of theproportion or time-frame for scanning.Unfortunately, it would appear that this seriousflaw in the design of epidemiology studiescontinues unrecognised. Scanning 70% of subjectsat some point might have been ‘ideal’ 10 or 15years ago,1 but is not adequate today, particularlywhen so much further stroke research, such asgenetic studies or public health planning, dependson correct information on the proportion ofischaemic and haemorrhagic strokes.
Why were scanning policiesinadequate?The studies included in the systematic review werecommunity based, and some of them madeexhaustive attempts to record all people in theregion under scrutiny who experienced stroke-likesymptoms. Some studies were performed as farback as 1980, when being able to distinguishwhether a stroke was ischaemic or haemorrhagicmade no difference to the management of thepatient. Access to CT for the investigation ofstroke has improved with time, but not uniformlythroughout the world, and this review includedstudies where access is still difficult (althoughWestern European and Australian studiespublished in the late 1990s have little excuse).
Could it be that PICH is beingoverdiagnosed?Very early haemorrhagic transformation of acerebral infarct can mimic PICH,117 but from thestudies reviewed here there is no way of knowinghow often this might have been the case. Whetherit is important to distinguish haemorrhagictransformation from PICH is unclear, as it is
unknown whether haemorrhagic transformationbehaves as a clinical entity differently fromcerebral infarction, or PICH, or whether itcorresponds in prognosis to one or the other.118
This can only be determined by more accuratecategorisation of the condition by early scanning.
Thus, in the stroke incidence studies, theunderdiagnosis of PICH is likely to be the correctcurrent position and to reflect the problem ofpatients presenting late to medical attention, andso missing the window of opportunity for CT todetect PICH, even when a local community studymight reasonably be expected to raise publicawareness of the importance of not ignoring strokesymptoms. There was no evidence of animprovement in scanning policy in more recentcompared with older studies, which is notencouraging.
Bias in scanning policiesA further bias has been introduced by theconspicuous lack of scanning in those patientsmanaged at home, those dying early or the‘elderly’. The median age for stroke to occur is 72 years; thus, roughly half of all the strokes in apopulation may not have been scanned inincidence studies that failed to scan the elderly.The incidence of amyloid angiopathy, a risk factorfor PICH, increases with age.119 Increasing use ofMRI has revealed that it is not uncommon to findevidence of old, apparently asymptomatichaemorrhages in the brains of olderpatients,120,121 It may be that older people areparticularly at risk of PICH, and thus there maybe an over-representation of PICH in this groupnot being scanned in incidence studies. Onecannot assume that the proportion of PICH toischaemic stroke remains constant across all ages.
The community incidence studies assessed theincidence of infarct and haemorrhage as causes offirst stroke. It would be wrong to assume that theproportion of PICH and infarct would be the samein recurrent stroke as in first stroke. A systematicreview of studies of survivors of PICH found thatPICH was a much more frequent cause ofrecurrent stroke than infarction.122 In this groupof patients from three community-based and sevenhospital-based studies, three-quarters of recurrentstrokes were due to PICH; 2.3% of patients had arecurrent stroke, 1.1% had a recurrent ischaemicstroke and 8.8% died per year of follow-up. Amore recent study in which 243 patients admittedto hospital with a PICH were followed-up for anaverage of 5.5 years found an average recurrenceof PICH of 2.1% and of vascular deaths 3.2%.
Health Technology Assessment 2004; Vol. 8: No. 1
19
© Queen’s Printer and Controller of HMSO 2004. All rights reserved.

Increasing age, male gender, and use ofanticoagulants increased the risk of recurrentPICH [hazard ratio (HR) for age 2.8, 95% CI 1.3to 6.1; for male gender HR 1.8, 95% CI 1.1 to 3.0,and anticoagulants HR 3.0, 95% CI 1.3 to 7.2].123
There are numerous reasons why is it important toknow the incidence of PICH and infarct correctly.These include (although this represents only a few):
� better understanding of the mechanism ofPICH
� better understanding of the epidemiology ofPICH, including for use in genetic studies
� better understanding of whether there is anyvariation in the proportion of stroke due tointracerebral haemorrhage with increasing age,or recurrent stroke
� improved prevention of PICH� improved avoidance of drugs that may worsen
outcome after PICH if given in the mistakenbelief that the patient has had an infarct
� better methods to detect PICH.
It is well known that CT scanning will notdifferentiate infarct from haemorrhage reliablyafter 10 days, routine immediate CT imaging isavailable in many parts of the world for stroke,and MR should be used to diagnose haemorrhageif the patient presents too late for CT. But thisfact, which is obvious to clinicians, appears to havebeen overlooked in the stroke epidemiologystudies, even the very recent ones.
ConclusionsImplications for healthcareAbout 20% of patients presenting to a hospitalservice with an initial diagnosis of stroke will, onfurther clinical assessment, turn out not to havehad a stroke. There are a wide variety of strokemimics, requiring very different management tostroke. The advent of thrombolysis highlights theproblem of increasingly sophisticated (andpotentially dangerous) management strategies thatdemand levels of diagnostic accuracy thatclinicians are not capable of achieving withoutneuroimaging. Furthermore, it is not possible todifferentiate stroke due to infarction fromhaemorrhage reliably on clinical grounds.
PICH has probably been underdiagnosed incommunity-based stroke incidence studies,especially in mild strokes, the elderly and those
who died soon after the event. The weakness ofscanning policies means that there is uncertaintyabout what proportion of strokes in variouscountries, or at various ages or severities, are dueto PICH rather than ischaemic stroke. As aconsequence, PICH may have beenunderestimated as a cause of mild stroke as thesepatients typically (in the UK) present asoutpatients late after the event.
Implications for future researchThere is little information on the observerreliability of clinical examination in the acute stageof stroke. More detailed information on thestability and reliability of symptoms and signs ofstroke might help to improve the accuracy ofclinical diagnosis of stroke versus not stroke. Thiswould reduce the proportion of patients at risk ofexposure to potentially risky treatments such asthrombolysis for whom there would be no benefit,as well as making more effective use of hospitalresources. Further studies should determine whichare the most robust signs of stroke, so that juniordoctors, paramedics and those who see strokerarely (such as GPs) can be given guidance onwhich signs are most reliable.
Community-based stroke incidence studies havebeen (and continue to be115,124–127) complacent intheir attitude to neuroimaging and, as aconsequence, any research relying on data fromthem, such as on the genetics of stroke, could beinherently flawed. The scanning policies used inany future stroke incidence studies should:
� be clearly described in terms of timing,proportion, etc.
� resort to MR with blood-sensitive sequences if itis more than 10 days after the stroke, ashaemorrhage will not be reliably detected onCT after that time.
Future stroke incidence studies should lookspecifically and prospectively to see whether theproportion of strokes due to infarct andhaemorrhage changes with age, with severity ofstroke, in those who remain at home as opposed tobeing admitted to hospital, and whether there is adifferent proportion of haemorrhagic or ischaemicstroke among recurrent strokes. Ideally, acommunity-based incidence study would alsocollect data on resource use, including LOS inhospital and outpatient resources, as this wouldprovide better data on which to plan futurehealthcare resources.
The contribution of brain imaging to the diagnosis of stroke
20

Systematic descriptive study ofthe diagnostic accuracy of CTand MR in strokeBackgroundDistinguishing haemorrhagic from ischaemicstroke is importantThe clinical diagnosis of the cause of stroke is oflimited accuracy. Therefore, imaging is required toidentify tumours or other non-vascular lesionspresenting with stroke-like symptoms and makethe distinction of infarct from haemorrhagereliably. Aspirin may be regarded as a ‘safe’ drug,but the long-term effects of aspirin, inadvertentlygiven to patients with a definite intracranialhaemorrhage, are unknown. Aspirin may causeless recurrent PICH than heparin following acutestroke128 but is associated with a small but definiterisk.48,129 Delivery of current best practice50,62 forprimary and secondary stroke prevention dependson the correct diagnosis of infarct orhaemorrhage, as well as the exclusion of tumoursand non-vascular lesions.
Furthermore, it may no longer be sufficient to useimaging simply to exclude the presence ofhaemorrhage or non-vascular lesion. The clinicaldiagnosis of stroke (versus not stroke) is difficult,as shown in Chapter 2, where about 20% ofpatients initially diagnosed as stroke on firstmedical contact were subsequently considered notto have had a stroke when seen later by a moreexperienced physician. Partly, this change indiagnosis with time reflects the difficulty of clinicalassessment in the acute phase when symptoms andsigns may truly fluctuate, the patient may bedysphasic, so unable to give a proper history, andjunior medical staff may lack confidence ineliciting or interpreting complicated neurologicalsigns. Regardless of the cause, increasingly,physicians are turning to imaging both to confirmthe diagnosis of stroke and to determine whichpart of the brain is affected. For example, thebenefits of thrombolysis may be much greater thanfor antiplatelet agents but, unfortunately, so arethe risks.130 Although the latest time window forthrombolysis is uncertain, it is probably only amatter of hours. Experience from the USA, where
thrombolysis has been licensed since 1996, showsthat only a small fraction of patients arriving inhospital in time and eligible for thrombolysis arereceiving it.131,132 Part of the reason for this maybe the reluctance of physicians to expose theirpatients to the (potentially fatal) risk ofthrombolysis if they are not certain that thepatient is definitely having a stroke. Thus, positiveidentification of an infarct increases the physician’sconfidence for the diagnosis of stroke andsubsequent actions such as the use of thrombolysis.
The use of further investigations (which maythemselves be of limited availability, e.g. carotidultrasound) to guide secondary prevention mayalso be influenced by increased confidence in thediagnosis of infarction and its site. For example, itwould not be appropriate to undertake carotidendarterectomy after mild non-disabling stroke ifthe infarct were in the vertebral territory ratherthan the carotid territory, yet with some minorstrokes it can be difficult to discriminate betweenposterior and anterior circulation events.133 Thereis also evidence that lacunar infarcts are less likelyto be due to carotid stenosis than corticalinfarcts,134 and less likely to recur quickly,56 sodemonstration of a small, deep infarct in a patientwho was a poor operative risk might tip thebalance between operating and not operating. Inpatients with previous stroke and a newneurological deterioration, it may be important toknow whether the deterioration is due to a newstroke or to some intercurrent illness such as aurinary tract infection. Identification of a newlesion on brain imaging is helpful in this situation.Thus, for a variety of reasons, positiveidentification of cerebral infarction is of increasingimportance.
CT or MRI: which is ‘better’?Although access to MR for stroke has increased,CT is still the most common form of brainimaging used.67,135 CT is widely available and easyto perform in stroke, so is likely to remain themost commonly used investigation after stroke forthe foreseeable future. Haemorrhage can bedemonstrated readily on CT as a hyperdense area(white) as soon as clinical symptoms appear.54
Health Technology Assessment 2004; Vol. 8: No. 1
21
© Queen’s Printer and Controller of HMSO 2004. All rights reserved.
Chapter 3
The reliability of imaging in the diagnosis of haemorrhage and infarction

However, the haemorrhage remains hyperdensefor only a finite amount of time.55,136 As thehaemorrhage is broken down, it loses itshyperdensity, becoming first isodense with normalbrain and eventually hypodense. From the pointwhere it loses the hyperdensity onwards, thehaemorrhage is indistinguishable from an infarct.The speed with which this occurs depends on thesize of the haematoma: the smaller the initialbleed, the faster it takes on the appearanceidentical to infarction. Thus, the issue of sensitivityof CT in the identification of PICH is less whetherit can distinguish acute PICH from ischaemicstroke, but rather the length of time for whichthese changes remain visible and can be reliablydifferentiated from ischaemic stroke.
Haemorrhage remains visible on MR for muchlonger, probably indefinitely in most people.137
However, MR is contraindicated for patients withpacemakers and metal implants such as intraocularmetallic foreign bodies and intracranial aneurysmclips. Patients may find MR unpleasant, or beunable to tolerate it at all, because ofclaustrophobia. The enclosing imaging tunnelmakes monitoring of sick patients difficult. MRtakes longer to acquire than a CT scan, so MR isless suited to restless, confused, ill stroke patients.MR costs more than CT and, in the UK and manyother countries, is less widely available. Thus,despite its increased sensitivity to haemorrhage,MR cannot simply be used in place of CT becauseof these practical difficulties.
Why do a systematic review of imaging studies instroke?In general, diagnostic tests have been much lesssubjected to critical systematic reviews thantreatments. There was no existing systematicreview of the use of CT or MR scanning in strokeat the start of this project. From the 1970s to theearly 1990s, when CT scanning for stroke was lessavailable than today, there was less perception ofthe need for precise estimates of its accuracy.When introduced, CT was clearly such a majoradvance that most publications were descriptivecase series and paid little attention to defining thesensitivity or specificity of imaging. Even sincethen, studies of imaging have tended to be small,with little likelihood of any one study providing adefinitive answer. CT is now more available, strokeis a common problem, which creates a majorpublic health burden, and there are nowtreatments that depend on knowing the cause ofthe stroke. Misuse of imaging could be very costlyto the health service. MR poses greater problems,as increasingly sophisticated and seemingly
advantageous techniques are developed.Therefore, a systematic review was undertaken ofthe use of CT and MR, either alone or incombination, to look at all the available evidencein the identification of haemorrhagic andischaemic stroke, not only to search for details onsensitivity, but also to assess the quality of themethodology of the studies performed.
Methods ObjectivesThe aims were to determine the sensitivity andspecificity of CT and MRI in the distinction ofinfarct from haemorrhage, in the positivediagnosis of infarct, and to identify the majorfactors that may affect the diagnostic accuracy.Specifically, the study aimed to determine:
� the sensitivity and specificity of CT in thediagnosis of acute PICH
� how the sensitivity and specificity of CT in thediagnosis of PICH change with time and size ofhaematoma
� the sensitivity and specificity of MR in thediagnosis of PICH
� how the sensitivity and specificity of MR changewith time and size of haematoma
� the sensitivity and specificity of CT in thepositive identification of the site and extent ofischaemic stroke
� the sensitivity and specificity of MR in thepositive identification of the site and extent ofischaemic stroke
� whether there was any evidence, from directcomparisons, that CT or MR was preferable insome situations.
Criteria for considering studies for the reviewAll studies on the accuracy of CT and/or MR inthe diagnosis of PICH or cerebral infarction weresought. These included studies where the primaryaim was to identify the sensitivity and specificity ofimaging, studies where the results of CT and MRimaging were reported for a group of strokepatients, and those where that was not the primaryaim but it was possible to extract informationrelating to the accuracy of brain imaging in strokepatients. Prospective and retrospective studieswere sought (there were concerns that there wouldbe few clearly prospective studies). A further aimwas to identify studies where it was clear that the‘stroke’ patients had been examined by a strokephysician or neurologist, to be certain that thepopulation was as clearly defined as possible. Thiswas particularly important for studies assessingimaging in the diagnosis of infarction. Any studiesconcerned with the observer reliability of the
The reliability of imaging in the diagnosis of haemorrhage and infarction
22
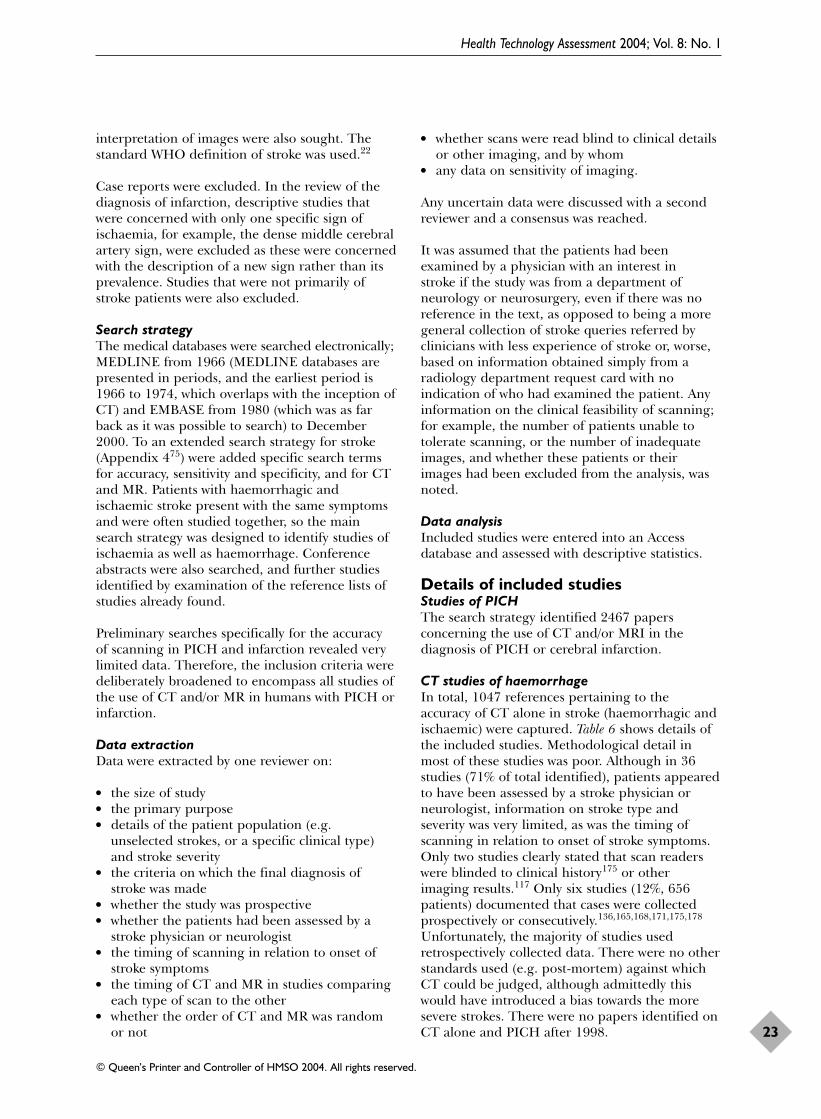
interpretation of images were also sought. Thestandard WHO definition of stroke was used.22
Case reports were excluded. In the review of thediagnosis of infarction, descriptive studies thatwere concerned with only one specific sign ofischaemia, for example, the dense middle cerebralartery sign, were excluded as these were concernedwith the description of a new sign rather than itsprevalence. Studies that were not primarily ofstroke patients were also excluded.
Search strategyThe medical databases were searched electronically;MEDLINE from 1966 (MEDLINE databases arepresented in periods, and the earliest period is1966 to 1974, which overlaps with the inception ofCT) and EMBASE from 1980 (which was as farback as it was possible to search) to December2000. To an extended search strategy for stroke(Appendix 475) were added specific search termsfor accuracy, sensitivity and specificity, and for CTand MR. Patients with haemorrhagic andischaemic stroke present with the same symptomsand were often studied together, so the mainsearch strategy was designed to identify studies ofischaemia as well as haemorrhage. Conferenceabstracts were also searched, and further studiesidentified by examination of the reference lists ofstudies already found.
Preliminary searches specifically for the accuracyof scanning in PICH and infarction revealed verylimited data. Therefore, the inclusion criteria weredeliberately broadened to encompass all studies ofthe use of CT and/or MR in humans with PICH orinfarction.
Data extractionData were extracted by one reviewer on:
� the size of study� the primary purpose� details of the patient population (e.g.
unselected strokes, or a specific clinical type)and stroke severity
� the criteria on which the final diagnosis ofstroke was made
� whether the study was prospective� whether the patients had been assessed by a
stroke physician or neurologist� the timing of scanning in relation to onset of
stroke symptoms� the timing of CT and MR in studies comparing
each type of scan to the other� whether the order of CT and MR was random
or not
� whether scans were read blind to clinical detailsor other imaging, and by whom
� any data on sensitivity of imaging.
Any uncertain data were discussed with a secondreviewer and a consensus was reached.
It was assumed that the patients had beenexamined by a physician with an interest in stroke if the study was from a department ofneurology or neurosurgery, even if there was noreference in the text, as opposed to being a moregeneral collection of stroke queries referred byclinicians with less experience of stroke or, worse,based on information obtained simply from aradiology department request card with noindication of who had examined the patient. Anyinformation on the clinical feasibility of scanning;for example, the number of patients unable totolerate scanning, or the number of inadequateimages, and whether these patients or theirimages had been excluded from the analysis, wasnoted.
Data analysisIncluded studies were entered into an Accessdatabase and assessed with descriptive statistics.
Details of included studiesStudies of PICHThe search strategy identified 2467 papersconcerning the use of CT and/or MRI in thediagnosis of PICH or cerebral infarction.
CT studies of haemorrhageIn total, 1047 references pertaining to theaccuracy of CT alone in stroke (haemorrhagic andischaemic) were captured. Table 6 shows details ofthe included studies. Methodological detail inmost of these studies was poor. Although in 36studies (71% of total identified), patients appearedto have been assessed by a stroke physician orneurologist, information on stroke type andseverity was very limited, as was the timing ofscanning in relation to onset of stroke symptoms.Only two studies clearly stated that scan readerswere blinded to clinical history175 or otherimaging results.117 Only six studies (12%, 656patients) documented that cases were collectedprospectively or consecutively.136,165,168,171,175,178
Unfortunately, the majority of studies usedretrospectively collected data. There were no otherstandards used (e.g. post-mortem) against whichCT could be judged, although admittedly thiswould have introduced a bias towards the moresevere strokes. There were no papers identified onCT alone and PICH after 1998.
Health Technology Assessment 2004; Vol. 8: No. 1
23
© Queen’s Printer and Controller of HMSO 2004. All rights reserved.

The reliability of imaging in the diagnosis of haemorrhage and infarction
24
TABLE 6 CT and intracerebral haemorrhage (ICH)
Study Year Size Purpose of study Assessed by Readings stroke physician? blinded?
Walshe138 1976 68 Clinicotopography No No
Greenberg139 1977 6 Clinicotopography No No
Lieberman140 1978 6 ICH in patients with prosthetic No Noheart valves – outcome
Scott141 1979 232 Clinicotopography (thalamic Yes Noganglionic)
Mizukami142 1981 17 Clinicotopography (putaminal) No No
Weisberg143 1981 12 Clinicotopography (multiple PICH) Yes No
Hungerbuhler144 1983 108 Clinicotopography No No
Mayr145 1983 100 Prognosis No No
Garde146 1983 100 Prognosis, clinicotopography No No
Helweg-Larsen147 1984 8 Prognosis Yes No
Stein148 1984 12 Clinicotopography (caudate) Yes No
Steiner149 1984 37 Prognosis Yes No
Weisberg150 1984 8 Clinicotopography (caudate) Yes No
Hung136 1985 31 Prognosis (and serial CT Yes Nocharacteristics)
Mori151 1985 174 Clinicotopography (lacunar) Yes No
Weisberg152 1985 50 Clinicotopography (subcortical lobar) Yes No
Tanaka153 1986 25 Prognosis Yes No
Gates154 1986 5 Clinicotopography Yes No
Carbonin155 1986 5 Clinicotopography No No
Dollberg156 1986 77 Clinicotopography No No
Weisberg157 1986 40 Clinicotopography (pontine) Yes No
Dennis55 1987 5 Serial CT characteristics
Fieschi158 1988 104 Prognosis Yes No
Darby159 1988 7 Clinicotopography (solitary Yes Nointraventricular haemorrhage)
Weisberg160 1988 18 Clinicotopography (occipital) Yes No
Iwasaki161 1988 10 Clinicotopography (lacunar) No No
Weisberg162 1989 25 Clinicotopography (parietal) Yes No
Astarloa163 1989 114 Prognosis Yes No
Jayakumar164 1989 15 Clinicotopography (solitary Yes Nointraventricular haemorrhage)
Schutz165 1990 100 Clinicotopography Yes No
Cerillo166 1990 83 Prognosis Yes No
Weisberg167 1990 100 Clinicotopography Yes No
Daverat168 1991 166 Prognosis Yes No
Bogousslavsky117 1991 15 CT characteristics (haemorrhagic No Yesa
transformation)
Kreel169 1991 120 CT characteristics (residual lesions) No No
Franke170 1991 42 CT characteristics (residual lesions) Yes No
Franke171 1992 157 Prognosis Yes No
Lisk172 1994 75 Prognosis Yes No
Berlit173 1994 326 Prognosis Yes No
continued
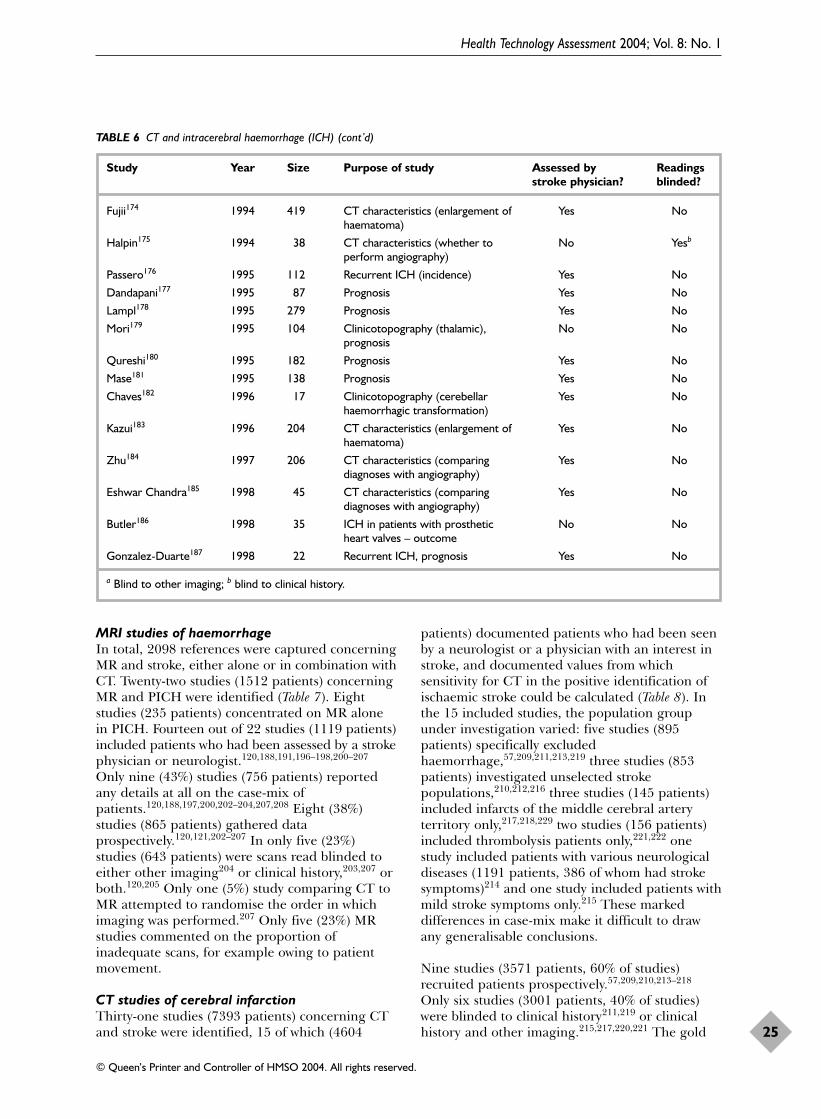
MRI studies of haemorrhageIn total, 2098 references were captured concerningMR and stroke, either alone or in combination withCT. Twenty-two studies (1512 patients) concerningMR and PICH were identified (Table 7). Eightstudies (235 patients) concentrated on MR alonein PICH. Fourteen out of 22 studies (1119 patients)included patients who had been assessed by a strokephysician or neurologist.120,188,191,196–198,200–207
Only nine (43%) studies (756 patients) reportedany details at all on the case-mix ofpatients.120,188,197,200,202–204,207,208 Eight (38%)studies (865 patients) gathered dataprospectively.120,121,202–207 In only five (23%)studies (643 patients) were scans read blinded toeither other imaging204 or clinical history,203,207 orboth.120,205 Only one (5%) study comparing CT toMR attempted to randomise the order in whichimaging was performed.207 Only five (23%) MRstudies commented on the proportion ofinadequate scans, for example owing to patientmovement.
CT studies of cerebral infarctionThirty-one studies (7393 patients) concerning CTand stroke were identified, 15 of which (4604
patients) documented patients who had been seenby a neurologist or a physician with an interest instroke, and documented values from whichsensitivity for CT in the positive identification ofischaemic stroke could be calculated (Table 8). Inthe 15 included studies, the population groupunder investigation varied: five studies (895patients) specifically excludedhaemorrhage,57,209,211,213,219 three studies (853patients) investigated unselected strokepopulations,210,212,216 three studies (145 patients)included infarcts of the middle cerebral arteryterritory only,217,218,229 two studies (156 patients)included thrombolysis patients only,221,222 onestudy included patients with various neurologicaldiseases (1191 patients, 386 of whom had strokesymptoms)214 and one study included patients withmild stroke symptoms only.215 These markeddifferences in case-mix make it difficult to drawany generalisable conclusions.
Nine studies (3571 patients, 60% of studies)recruited patients prospectively.57,209,210,213–218
Only six studies (3001 patients, 40% of studies)were blinded to clinical history211,219 or clinicalhistory and other imaging.215,217,220,221 The gold
Health Technology Assessment 2004; Vol. 8: No. 1
25
© Queen’s Printer and Controller of HMSO 2004. All rights reserved.
TABLE 6 CT and intracerebral haemorrhage (ICH) (cont’d)
Study Year Size Purpose of study Assessed by Readings stroke physician? blinded?
Fujii174 1994 419 CT characteristics (enlargement of Yes Nohaematoma)
Halpin175 1994 38 CT characteristics (whether to No Yesb
perform angiography)
Passero176 1995 112 Recurrent ICH (incidence) Yes No
Dandapani177 1995 87 Prognosis Yes No
Lampl178 1995 279 Prognosis Yes No
Mori179 1995 104 Clinicotopography (thalamic), No Noprognosis
Qureshi180 1995 182 Prognosis Yes No
Mase181 1995 138 Prognosis Yes No
Chaves182 1996 17 Clinicotopography (cerebellar Yes Nohaemorrhagic transformation)
Kazui183 1996 204 CT characteristics (enlargement of Yes Nohaematoma)
Zhu184 1997 206 CT characteristics (comparing Yes Nodiagnoses with angiography)
Eshwar Chandra185 1998 45 CT characteristics (comparing Yes Nodiagnoses with angiography)
Butler186 1998 35 ICH in patients with prosthetic No Noheart valves – outcome
Gonzalez-Duarte187 1998 22 Recurrent ICH, prognosis Yes No
a Blind to other imaging; b blind to clinical history.

standard by which the final diagnosis reached wasclinical progress in 11 studies (3334 patients, 73%of studies),57,210–214,216, 218–220,222 follow-up scan intwo studies (83 patients, 13% of studies),221,223 andundefined in three studies (1233 patients, 20% ofstudies).209,215,217
MRI studies of cerebral infarctionEighteen studies (1638 patients) were identifiedconcerning MR alone in stroke (Table 9); 15 (1560patients) included patients assessed at some stageby a neurologist or stroke physician. In only one ofthe four studies was imaging read blinded toclinical history.227 As with CT, the differences incase-mix, timing of scanning and small numbersmake these results of interest but difficult togeneralise.
CT and MRI in the positive diagnosis ofischaemic strokeTwenty-eight studies (1650 patients) comparingCT and MR directly in stroke were identified, ofwhich 18 studies (808 patients) included patientswho had been assessed by a neurologist or stroke
physician, and of those 12 studies (609 patients)documented the number of positive findings onscans performed (Table 10). As previously, thepatient groups under investigation differed (somestudies including more than one patient group):TIA (two studies, 41 patients),203,228 lacunar stroke(five studies, 166 patients),203,230,232,233,235
cerebellar stroke (one study 14 patients);229 lateralmedullary syndrome (one study, six patients)231
and unselected stroke (four studies, 356patients).204,206,207,234 Again, studies were uniformlysmall. Nine studies (75% of studies) collected dataprospectively,203,204,206,207,228,230,233–235 while sixstudies (50%) blinded readers of scans either toclinical history203,207,228,234,235 or to otherimaging.204 In only one study (0.8%) was the orderin which CT or MR was performed varied(although not randomised);207 two studiesperformed both scans on the same day but did notdocument the order in which they were done;228,232
in five studies, CT was always performed beforeMR.203,204,206,234,235 The extent of the difference intimes varied: in one study where all patients werescanned within 24 hours, CT was performed a
The reliability of imaging in the diagnosis of haemorrhage and infarction
26
TABLE 7 MRI and intracerebral haemorrhage (ICH)
Study Year Size Purpose of study CT also Assessed by Readings performed stroke blinded?
physician?
Linfante188 1999 5 Clinicotopography, hyperacute No Yes NoOffenbacher189 1996 120 Clinicotopography, asymptomatic No No No
haemorrhageMelhem190 1998 32 Technical (GRE sequence in No No No
haemorrhage)Edelman191 1986 16 Technical (modification of pulse) No Yes NoGomori192 1985 20 Technical No No NoZimmerman193 1988 37 Clinicotopography No No NoShimizu194 1992 4 Clinicotopography No No NoLiang195 1999 50 Technical (GRE sequence in haemorrhage) Yes No NoTanaka196 1999 89 Asymptomatic haemorrhage Yes Yes NoPatel197 1996 6 Visualise haemorrhage, clinicotopography Yes Yes NoGreenberg121 1996 25 Asymptomatic haemorrhage Yes No NoStaffen198 1998 100 Clinical differences between haemorrhagic Yes Yes No
transformation and PICHSteinbrich199 1990 129 Compare CT and MR Yes No NoTanaka200 1988 30 Compare CT and MR Yes Yes NoSchellinger201 1999 9 Visualise haemorrhage Yes Yes NoKinoshita202 2000 198 Asymptomatic haemorrhage Yes Yes NoKwa120 1998 221 Asymptomatic haemorrhage Yes Yes Yesc
Salgado203 1986 60 Compare CT and MR Yes Yes Yesb
Kertesz204 1987 175 Compare CT and MR Yes Yes Yesa
Mayer205 2000 36 Haemorrhagic transformation serially Yes Yes Yesc
Arias206 1992 70 Compare CT and MR Yes Yes NoMohr207 1995 80 Compare CT and MR Yes Yes Yesb
a Blind to other imaging; b blind to clinical history; c blind to both.
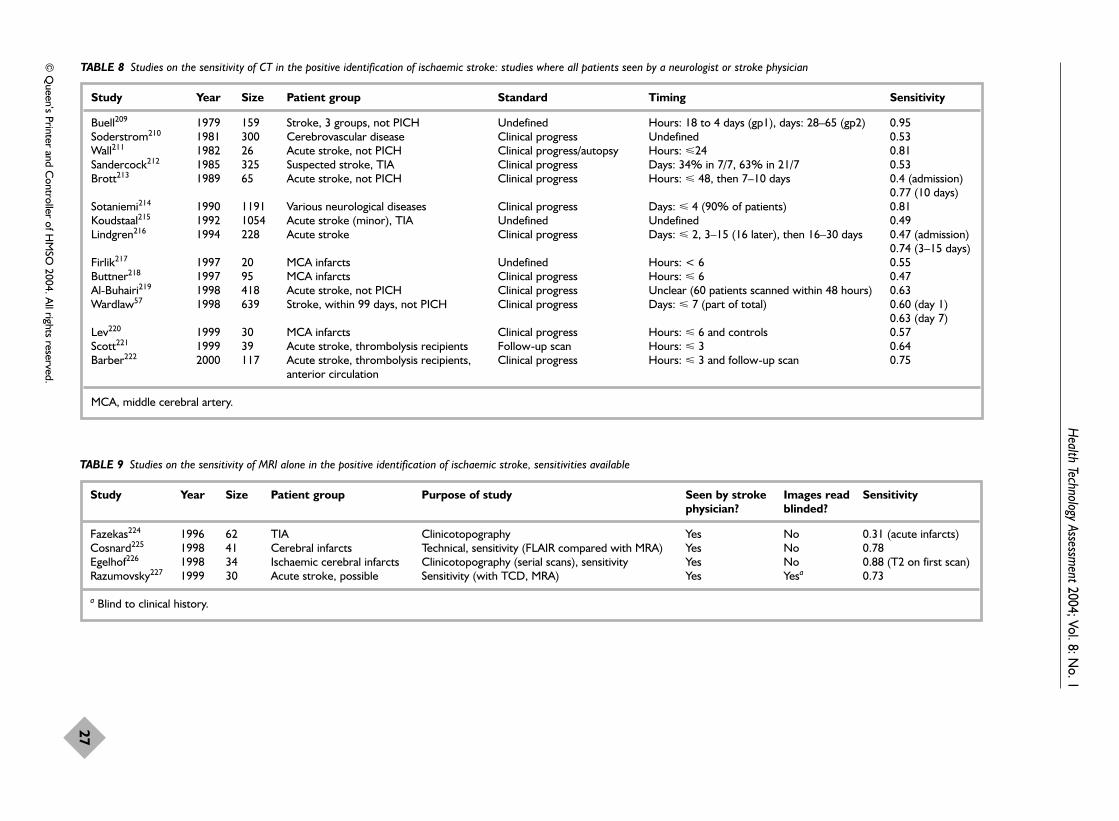
Health Technology Assessm
ent2004; Vol. 8: No. 1
27
© Q
ueen’s Printer and Controller of H
MSO
2004. All rights reserved.
TABLE 8 Studies on the sensitivity of CT in the positive identification of ischaemic stroke: studies where all patients seen by a neurologist or stroke physician
Study Year Size Patient group Standard Timing Sensitivity
Buell209 1979 159 Stroke, 3 groups, not PICH Undefined Hours: 18 to 4 days (gp1), days: 28–65 (gp2) 0.95Soderstrom210 1981 300 Cerebrovascular disease Clinical progress Undefined 0.53Wall211 1982 26 Acute stroke, not PICH Clinical progress/autopsy Hours: �24 0.81Sandercock212 1985 325 Suspected stroke, TIA Clinical progress Days: 34% in 7/7, 63% in 21/7 0.53Brott213 1989 65 Acute stroke, not PICH Clinical progress Hours: � 48, then 7–10 days 0.4 (admission)
0.77 (10 days)Sotaniemi214 1990 1191 Various neurological diseases Clinical progress Days: � 4 (90% of patients) 0.81Koudstaal215 1992 1054 Acute stroke (minor), TIA Undefined Undefined 0.49Lindgren216 1994 228 Acute stroke Clinical progress Days: � 2, 3–15 (16 later), then 16–30 days 0.47 (admission)
0.74 (3–15 days)Firlik217 1997 20 MCA infarcts Undefined Hours: < 6 0.55Buttner218 1997 95 MCA infarcts Clinical progress Hours: � 6 0.47Al-Buhairi219 1998 418 Acute stroke, not PICH Clinical progress Unclear (60 patients scanned within 48 hours) 0.63Wardlaw57 1998 639 Stroke, within 99 days, not PICH Clinical progress Days: � 7 (part of total) 0.60 (day 1)
0.63 (day 7)Lev220 1999 30 MCA infarcts Clinical progress Hours: � 6 and controls 0.57Scott221 1999 39 Acute stroke, thrombolysis recipients Follow-up scan Hours: � 3 0.64Barber222 2000 117 Acute stroke, thrombolysis recipients, Clinical progress Hours: � 3 and follow-up scan 0.75
anterior circulation
MCA, middle cerebral artery.
TABLE 9 Studies on the sensitivity of MRI alone in the positive identification of ischaemic stroke, sensitivities available
Study Year Size Patient group Purpose of study Seen by stroke Images read Sensitivityphysician? blinded?
Fazekas224 1996 62 TIA Clinicotopography Yes No 0.31 (acute infarcts)Cosnard225 1998 41 Cerebral infarcts Technical, sensitivity (FLAIR compared with MRA) Yes No 0.78Egelhof226 1998 34 Ischaemic cerebral infarcts Clinicotopography (serial scans), sensitivity Yes No 0.88 (T2 on first scan)Razumovsky227 1999 30 Acute stroke, possible Sensitivity (with TCD, MRA) Yes Yesa 0.73
a Blind to clinical history.

The reliability of imaging in the diagnosis of haem
orrhage and infarction
28
TABLE 10 Studies on the sensitivity of CT and MRI combined in the positive identification of ischaemic stroke
Study Year Size Study type Images read Patient group Timing Resultsblinded?
Salgado203 1986 60 Prospective Yesa TIA, lacunar or Days: median 12 (CT) 16 (MRI) (i) CT 4/19, MR 13/19, (ii) CT 18/29, non-lacunar infarct MR 21/29, (iii) CT 7/12, MR 10/12
Awad228 1986 22 Prospective Yesa TIA Weeks: < 4 from onset. Scans performed Clinically relevant lesions: MR only 3/22, on same or consecutive days CT better 2/22
Simmons229 1986 14 Retrospective No Cerebellar Days: within 14 in 12/14 CT findings on 6/14 (vs 14/14 on MR)infarction on MRI
Kertesz204 1987 175 Prospective Yesb Acute stroke Days and weeks: 5 groups see paper. week 1: MR 71/87, CT 44/87I gp CT/MR within 72 h
Rothrock230 1987 31 Prospective No Lacunar stroke Days to 2 years: 14 had scans same day (i) MR 11/12, CT 2/12, (iii) MR 8/13, (acute, subacute, chronic) CT 4/13
Hommel231 1988 6 Retrospective No Lateral medullary ? CT 2/6 vs MR 5/6infarction
Miyashita232 1988 9 Retrospective No Lacunar stroke, Days: 7–28 Enhanced MR 8/9, CT 4/9multiple infarcts
Arboix233 1990 60 Prospective No Lacunar infarcts Hours: 72 to 3 weeks (order unspecified) MR 78%, CT 30% positive
Bryan234 1991 31 Prospective Yesa Acute stroke (clinically Hours: < 24 (CT average 4 h earlier) Observer 1: MR 24/31, CT 15/31definite) Observer 2: MR 27/31, CT 21/31
Arias206 1992 70 Prospective No Acute stroke Days: CT at presentation then MR within MR normal in 1/52, CT normal in 25/521 week
Mohr207 1995 80 prospective Yesa Acute stroke Hours: 68 < 4, 12 < 24 (CT first 35, MR 31/61, CT 26/31 positive (not MR first 45) significant)
Stapf235 2000 54 prospective Yesa Lacunar stroke Days: CT < 2, MR 3–5 days after onset MR 51/54, CT 27/54
a Blind to clinical history; b blind to other imaging.

mean of 4 hours earlier,234 in another study ofimaging within the first 3 weeks of stroke, CT wasperformed a median of 4 days earlier,203 and inthree studies the order of scanning was notdefined.230,231,233
Details of excluded studiesStudies of PICHIn view of the disappointing quality of theliterature for CT and MR individually and thecomparisons, no studies that met the basicinclusion criteria outlined above were excluded forstudies concerning PICH.
Studies of cerebral infarctionStudies excluded from the analysis of CT are listedin Table 11. Studies were excluded from theanalysis of MR (Table 12) because the primarypurposes were: descriptions of clinicotopographyor specific MRI characteristics (eight studies, 990patients),253,254,256,259–261,263,264 explorations aroundthe use of contrast agent or imaging parameters(five studies, 167 patients),251,252,255,257,262 and onestudy (seven patients) highlighting the importantissue of negative MR scans in clinically definitestroke.258 Studies were excluded from the analysisof CT and MR because they failed to give detailson sensitivity or the patients were not examined bya stroke physician or neurologist (Table 13).
ResultsStudies of imaging in the diagnosis ofhaemorrhageCT and the identification of haemorrhageIn total, 1047 references pertaining to theaccuracy of CT alone in stroke (haemorrhagic andischaemic) were captured. Fifty-three studies(including a total of 4491 patients) specificallyconcerned with CT-confirmed PICH wereidentified (Table 6). Studies in which both CT andMR were performed at some stage were analysedseparately (see following pages). Studiesconcerning interobserver reliability of imageinterpretation (some of which included PICH) willbe addressed later.
Twenty-four studies (1310 patients) describedvarious characteristics of PICH in an anatomicallyspecific site, merely documenting the scan findingsin groups of patients with similar clinicalsymptoms (often retrospectively identified).Nineteen studies (2138 patients) attempted todetermine prognosis following PICH, usingclinical or imaging parameters. Both of thesegroups of studies used CT uncritically as the toolto identify haemorrhage, and as such provided noinformation on accuracy.
Studies concerning haemorrhage on CT atdiffering time-pointsSix studies (819 patients) documented CTcharacteristics of haemorrhage at different timesafter stroke.55,136,169,170,174,183 Two of these (623patients) reviewed a population with PICH andmultiple scans within the first few days afterstroke, to determine the proportion of patientswith haematoma enlargement. One study (204patients) found that 17% of haematomas continuedto expand after 6 hours, but that furtherenlargement after 24 hours was rare.183 The other(419 patients) found 14.3% of haematomas hadexpanded between the first CT (within 24 hours ofonset of symptoms) and second CT (within 24hours of admission).174 Both used retrospectivelycollected data and scans were not read blinded toeach other, but they highlight the important pointthat one scan of an acute haematoma is merely asnapshot in a dynamic process.
CT in the identification of haemorrhage lateafter strokeTwo studies (160 patients) investigated residuallesions late after PICH. Initial scans were takenwithin 1 week of onset of stroke symptoms andfollow-up scans over 2 months afterwards. Between17%170 and 27%169 of CT scans showed no residuallesions at all. Areas of hypodensity that would beindistinguishable from ischaemic stroke were foundin 37%169 to 52%.170 Focal calcification was foundin 5%170 to 10%.169 Slit-like hypodense lesions wereidentified in 14%170 to 25%169 at the site of previoushaemorrhage, but it is not clear whether thesewere only found following PICH, or how reliablythey would be recognised by a blinded observer.
Two studies (36 patients) commented on the time-course over which signs of haemorrhage coulddisappear. One study looking at smallhaemorrhages (< 20 mm diameter, comprising 6%of their PICH population) performed follow-upscanning between 6 days and 3 months in 8/31(26%) patients. They found that 2/8 (25%) wereisodense within 9 days of stroke.136 The otherstudy reported on five patients with PICH(maximum diameter 33 mm), identified as part ofa community stroke incidence study, in whom thehaematomas had become isodense on repeat CTwithin a few weeks of the original scan. Theearliest repeat CT had been performed 13 daysafter stroke, and it is possible that the haematomasmay have become isodense earlier.55
Studies of CT and haemorrhagic transformationOne study (15 patients) reported a case series ofpatients with ischaemic stroke who had undergone
Health Technology Assessment 2004; Vol. 8: No. 1
29
© Queen’s Printer and Controller of HMSO 2004. All rights reserved.
The reliability of imaging in the diagnosis of haem
orrhage and infarction
30
Table 11 Studies on the sensitivity of CT in the positive identification of ischaemic stroke: studies where patient groups were not seen by a stroke physician or were descriptive only
Study Year Size Patient group Images read Study design Standard Timing Sensitivity Seen by stroke blinded? physician
New236 1974 42 Various neurological No Retrospective Undefined Undefined ? Nodiseases
Jacobs237 1976 79 Various neurological No Unclear Autopsy Undefined ? Nodiseases
Toghi238 1981 87 Cerebrovascular disease Yesa Unclear Autopsy Days: � 110 ? No
Sipponen239 1984 11 Stroke, not PICH No Retrospective Undefined Days: 1 to 3 months ? No
Panzer240 1985 269 Acute stroke No Retrospective None stated Unclear (majority ? Noscanned within 24 h in RGH)
Wang241 1988 530 Suspected stroke, No Retrospective None stated Undefined 0.77 (infarcts only) NoCT scans
Horowitz242 1991 50 Acute stroke, not PICH No Prospective Undefined Hours: � 5, 0.56 initially, Nothen 5–7 days 0.74 on follow-up
Bendszus243 1997 45 MCA infarcts Yesa Retrospective Follow-up CT Hours: � 5 0.61 (without DDA) No0.96 with DDA
McAlister244 1997 177 Acute stroke No Retrospective Clinical progress Hours: � 24 (107), 0.23 (early), No> 24 (70) 0.58 (delayed scanning)
Johansson245 1984 181 Acute stroke, negative CT No Retrospective Clinical progress Days: > 3 ? Yes
Kinkel246 1976 111 Cerebrovascular disease No Retrospective Clinical progress Undefined ? Yes
Inoue247 1980 30 Acute stroke, positive No Prospective Undefined Days: � 5 ? Yesfinding on CT, not PICH
Moulin248 1996 100 MCA infarcts Yesa Retrospective Clinical progress Days: � 10 ? Yes
Toni249 2000 514 Lacunar infarcts No Retrospective Follow-up scan Hours: < 6 ? Yes(CT) at 1 week
Toni250 1995 517 Acute stroke (but No Retrospective Clinical progress Days: < 15 ? Yesinvestigating sensitivity for lacunar diagnosis)
a Blind to clinical history. RGH, regional general hospital.

Health Technology Assessm
ent2004; Vol. 8: No. 1
31
© Q
ueen’s Printer and Controller of H
MSO
2004. All rights reserved.
TABLE 12 Studies on the sensitivity of MRI alone in the positive identification of ischaemic stroke, sensitivities not available
Study Year Size Patient group Purpose Seen by stroke Images read Sensitivityphysician? blinded?
Bryan251 1983 9 Stroke Technical (exploratory) Yes No
Virapongse252 1986 20 Subacute and chronic stroke Technical (contrast) No No
Kinkel253 1986 350 Stroke, TIA Clinicotopography Yes No
Byrne254 1989 76 Brainstem lesions Clinicotopography Yes No
Crain255 1991 80 Acute stroke Technical (contrast) Yes No
Yuh256 1991 39 Acute ischaemic stroke Clinicotopography Yes No
Sato257 1991 8 Stroke Technical (contrast) No No
Alberts258 1992 7 Stroke, negative scan Negative MRI-clinical stroke Yes No
Shimosegawa259 1992 16 Stroke, embolic cerebral infarction Clinicotopography Yes No
Yin260 1994 81 Infratentorial stroke Clinicotopography Yes No
Kim261 1994 33 Lateral medullary stroke Clinicotopography Yes No
Brant-Zawadzki262 1996 50 Cerebrovascular accident Technical (FLAIR) No Yesa Overall FLAIR better in 10
Mantyla263 1999 395 Stroke, WMHI MR characteristics Yes No
Mantyla264 1999 395 Old stroke MR characteristics Yes Yes
aBlind to clinical history.WMHI, white matter hyperintensities.

The reliability of imaging in the diagnosis of haem
orrhage and infarction
32
TABLE 13 Studies on the sensitivity of CT and MRI combined in the positive identification of ischaemic stroke: patient groups not seen by a stroke physician or neurologist, descriptive only
Study Year Size Study type Images read Patient group Timing Resultsblinded?
Sipponen265 1983 7 Prospective No Acute stroke Days: four < 1; others, 7 and 14
Smith266 1985 55 Retrospective No Various neurological conditions Undefined MR 168 lesions vs CT 86, 55 patients
Steinbrich267 1986 55 Undefined No Acute stroke Undefined ‘MR demonstrated 11% more infarcts’
Kinkel253 1986 350 Retrospective No Cerebrovascular disease Undefined
Biller268 1986 10 Retrospective No Pontine infarction Hours: CT within few hours of CT 1/10, MR 9/10hospitalisation, MR unclear
Cirillo269 1988 192 Retrospective No Various neurological conditions Undefined MR identified 23 infarcts not seen onCT
Brown97 1988 21 Prospective + No ‘Lacunar TIAs or strokes of Days: ‘acute’ < 3/7, subacute TIAs: MR 24/25, CT 10/25, recent: Retrospective varying chronicity’ < 30/7, chronic > 3/12 MR 13/13, CT 0/12
Imakita270 1988 35 Prospective No Confirmed or suspected cerebral Hours: 4 to 27 months MR enhancement was ‘more obvious, infarction more extensive’
Hommel271 1990 100 Prospective No Lacunar stroke Days: CT within 4, MR on MR showed compatible lesions in 89%average 18 days after stroke
Shuaib272 1992 116 Retrospective No Acute stroke Days: both done within 10 MR changed management in 18.9%
Krivoshapkin273 1992 16 Prospective No Patients with EC–IC bypass Undefined
Boyko274 1992 12 Retrospective No Hyperintensities on T1 Undefined
Fiorelli275 1993 2 Prospective No Acute stroke Hours: < 4, scans within 1 h of each other
Maeda276 1999 1 Case report No Acute right hemiparesis Hours: < 3 Lesion seen on both
EC–IC, external cranial–intracranial artery bypass.
neuroimaging twice within the first 24 hours, thefirst scan negative and the second scan positive forhaemorrhage.117 They suggested that earlyhaemorrhagic transformation may present asprimary intracerebral haemorrhage if patients arenot scanned very early. Unfortunately, they wereunable to document the proportion of patients intheir population that this group represented. Thisstudy has not been repeated since.
Increasing use of CT and apparent change in theincidence of PICHTwo studies investigated the incidence andoutcome of cases of PICH compared with the useof CT. One study found that the incidence ofPICH in their institution paralleled the use ofCT,74 and both found that case fatality apparentlyfell with increasing use of CT;74,277 that is, smaller,less deadly PICH was being identified withincreased frequency as more patients were beingscanned with CT. This finding supports theobservation in Chapter 2 that PICH has probablybeen under-recognised as a cause of mild stroke inepidemiology studies.
Summary of studies of CT and PICHAcute PICH on CT is very characteristic andimmediately visible, but the only data on thelength of time these features last are anecdotal.No studies were found where the primary purposewas to establish the sensitivity of CT in theidentification of haemorrhage at specific time-points after stroke and by severity of stroke. Theremay be features characteristic of previoushaemorrhage on CT, but there are no data on howspecific they are or how reliably they can berecognised. Increased use of CT has led to therealisation that PICH can cause mild stroke. Thissuggests that the mortality associated with PICHhas probably been overestimated, owing to the useof data derived from studies with inaccuratediagnostic method and hospital-based series,hence the inherent weakness of clinical scores fordetermining the cause of stroke (Chapter 2).
MR and the identification of haemorrhageIn total, 2098 references were captured concerningMR and stroke, either alone or in combination withCT. Twenty-two studies (1512 patients) concerningMR and PICH were identified (Table 7). Eightstudies (235 patients) concentrated on MR alonein PICH.
Four studies were technical, investigating specificMR sequences and their use in PICH.190,191,195,235
Two of these (of 82 patients) demonstrated thesuperiority of the gradient echo (GRE) technique
in the identification of PICH.190,195 Five (of 47patients) were descriptive case studies, documentingthe clinical characteristics and signs seen onimaging of haemorrhage on MR.188,193,194,197,201,208
Six studies (427 patients), although including asmall number of patients with haemorrhage, wereprimarily concerned with comparing CT and MRIin ischaemic stroke, and thus little information onaccuracy or sensitivity or specificity could bedrawn from these.198,203,204,206,207,267 None of thesestudies documented the sensitivity of MR for theidentification of PICH. In 14 studies (1239patients), CT was also performed at some stage.No study set out to determine whether all PICHremained identifiable as such, indefinitely, on MR,or to examine the sensitivity or specificity ofdifferent imaging sequences.
MR and asymptomatic haemorrhageFive studies (653 patients) used MR to investigatethe incidence of previous (asymptomatic)haemorrhage, as demonstrated by the presence ofbreakdown products of haemoglobin120,121,189,196,202
(Table 14). The study populations varied in ageand clinical history, and included patients with ahistory of PICH and those without. In patientswith a history of PICH, MR scans were performed3 days to 2 years after the event. Signs ofasymptomatic haemorrhage on MR wereidentified in between 36% and 66% of patients.
Studies that directly compared CT and MRIn only two studies (165 patients) were MR andCT scanning performed at similar times, enabling some comparison of sensitivity to bemade (Table 15). One study (published in 2000)investigated the incidence of haemorrhagictransformation in cerebral infarction205 and theother (published in 1990) the sensitivity of bothmodes of scanning in intracranial haematoma.199
Imaging was performed in both studies ‘acutely’(less than 2 days), ‘subacutely’ (between 2 and 10days) and in the ‘chronic’ phase (over 10 days). Inonly one of the studies were images read blinded(to clinical details but not to other imaging205).These studies suggested that CT was moresensitive at identifying haemorrhage in the acutephase and MR was better in the chronic phase.One study used specific blood-sensitive sequences(GRE).199 Neither study mentioned the order inwhich scans were performed, or whether they wereperformed on the same day.
One small study (nine patients) thatretrospectively compared CT and MR in patientswith hyperacute PICH90 described how MRdemonstrated haemorrhage in all cases. The main
Health Technology Assessment 2004; Vol. 8: No. 1
33
© Queen’s Printer and Controller of HMSO 2004. All rights reserved.

The reliability of imaging in the diagnosis of haem
orrhage and infarction
34
TABLE 14 Studies investigating proportion of patients with asymptomatic haemorrhage as evidenced by haemosiderin deposits on MRI
Study Year Size Mean age Study population Time of MRI from MRI sequences Proportion of asymptomatic (years) onset on symptoms used haemorrhage (%)
Non-stroke ICH Ischaemic stroke
Greenberg121 1996 25 76 ‘Elderly’ patients with lobar Within 2 years T1, T2, PD 60haematomas
Offenbacher189 1996 120 60 Patients with ICH Within 4 weeks T1, T2, PD, GRE in 3338 patients
Kwa120 1998 221 62 Previous ischaemic stroke, Mean interval 6 months FSET2, multiplanar GRE 4 26MI or peripheral vascular disease
Tanaka196 1999 89 62 Patients with ICH Not specified FSET2, axial T2 EPI 25.4 56.7
Kinoshita202 2000 198 64 Haemorrhagic or multiple Within 4 weeks FSE T2, GRE-EPI* 5 66 68lacunar stroke
TABLE 15 Studies in which patients with ICH were scanned serially with both CT and MRI: proportion of scans with identified haemorrhage at each time stage
Year Acute phase (%) Subacute phase (%) Chronic phase (%)
CT MRI CT MRI CT MRI
Steinbrich199 1990 93 46 58 97 17 93(haematoma)
Mayer205 2000 0 0 33 38 37 80(haemorrhagic transformation)
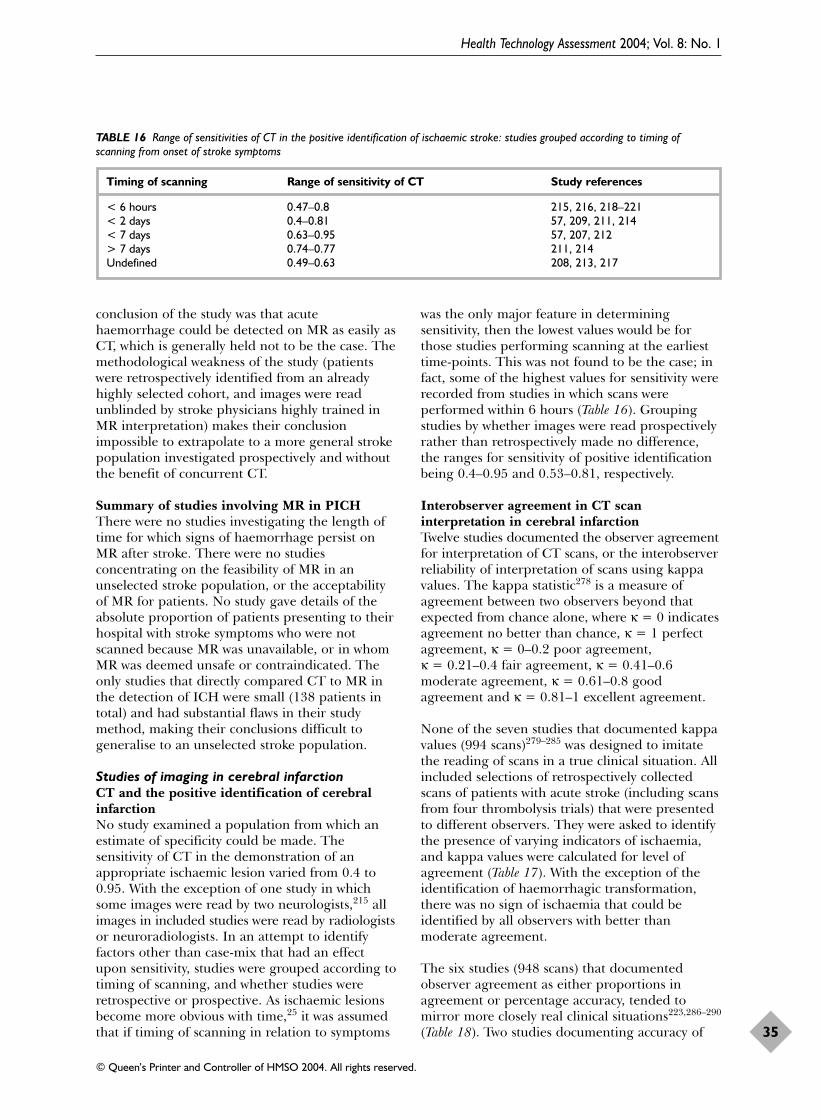
conclusion of the study was that acutehaemorrhage could be detected on MR as easily asCT, which is generally held not to be the case. Themethodological weakness of the study (patientswere retrospectively identified from an alreadyhighly selected cohort, and images were readunblinded by stroke physicians highly trained inMR interpretation) makes their conclusionimpossible to extrapolate to a more general strokepopulation investigated prospectively and withoutthe benefit of concurrent CT.
Summary of studies involving MR in PICHThere were no studies investigating the length oftime for which signs of haemorrhage persist onMR after stroke. There were no studiesconcentrating on the feasibility of MR in anunselected stroke population, or the acceptabilityof MR for patients. No study gave details of theabsolute proportion of patients presenting to theirhospital with stroke symptoms who were notscanned because MR was unavailable, or in whomMR was deemed unsafe or contraindicated. Theonly studies that directly compared CT to MR inthe detection of ICH were small (138 patients intotal) and had substantial flaws in their studymethod, making their conclusions difficult togeneralise to an unselected stroke population.
Studies of imaging in cerebral infarction CT and the positive identification of cerebralinfarctionNo study examined a population from which anestimate of specificity could be made. Thesensitivity of CT in the demonstration of anappropriate ischaemic lesion varied from 0.4 to0.95. With the exception of one study in whichsome images were read by two neurologists,215 allimages in included studies were read by radiologistsor neuroradiologists. In an attempt to identifyfactors other than case-mix that had an effectupon sensitivity, studies were grouped according totiming of scanning, and whether studies wereretrospective or prospective. As ischaemic lesionsbecome more obvious with time,25 it was assumedthat if timing of scanning in relation to symptoms
was the only major feature in determiningsensitivity, then the lowest values would be forthose studies performing scanning at the earliesttime-points. This was not found to be the case; infact, some of the highest values for sensitivity wererecorded from studies in which scans wereperformed within 6 hours (Table 16). Groupingstudies by whether images were read prospectivelyrather than retrospectively made no difference,the ranges for sensitivity of positive identificationbeing 0.4–0.95 and 0.53–0.81, respectively.
Interobserver agreement in CT scaninterpretation in cerebral infarctionTwelve studies documented the observer agreementfor interpretation of CT scans, or the interobserverreliability of interpretation of scans using kappavalues. The kappa statistic278 is a measure ofagreement between two observers beyond thatexpected from chance alone, where κ = 0 indicatesagreement no better than chance, κ = 1 perfectagreement, κ = 0–0.2 poor agreement, κ = 0.21–0.4 fair agreement, κ = 0.41–0.6moderate agreement, κ = 0.61–0.8 goodagreement and κ = 0.81–1 excellent agreement.
None of the seven studies that documented kappavalues (994 scans)279–285 was designed to imitatethe reading of scans in a true clinical situation. Allincluded selections of retrospectively collectedscans of patients with acute stroke (including scansfrom four thrombolysis trials) that were presentedto different observers. They were asked to identifythe presence of varying indicators of ischaemia,and kappa values were calculated for level ofagreement (Table 17). With the exception of theidentification of haemorrhagic transformation,there was no sign of ischaemia that could beidentified by all observers with better thanmoderate agreement.
The six studies (948 scans) that documentedobserver agreement as either proportions inagreement or percentage accuracy, tended tomirror more closely real clinical situations223,286–290
(Table 18). Two studies documenting accuracy of
Health Technology Assessment 2004; Vol. 8: No. 1
35
© Queen’s Printer and Controller of HMSO 2004. All rights reserved.
TABLE 16 Range of sensitivities of CT in the positive identification of ischaemic stroke: studies grouped according to timing ofscanning from onset of stroke symptoms
Timing of scanning Range of sensitivity of CT Study references
< 6 hours 0.47–0.8 215, 216, 218–221< 2 days 0.4–0.81 57, 209, 211, 214< 7 days 0.63–0.95 57, 207, 212> 7 days 0.74–0.77 211, 214Undefined 0.49–0.63 208, 213, 217

The reliability of imaging in the diagnosis of haem
orrhage and infarction
36
TABLE 17 Interobserver reliability of CT scan interpretation: kappa values
Study Year Size Type of CT scan (timing) No. of observers (type) Lesion on CT to Images read Resultsidentify blinded?
Schneider279 1991 74 Lacunar syndromes 10 (varying in expertise) Lacunar infarcts, leucoaraiosis, Yesa κ=0.64 (decreased (unspecified time) cerebral atrophy density), κ=0.45
(lacunar infarcts)
Wardlaw280 1994 119 Patients with acute stroke 8 (2 experts and 6 trainees) Infarct site, swelling, Yesb κ=0.78 (all scans), symptoms (2 h to 3 months) haemorrhagic transformation κ=0.87 (medium/
large), κ=0.59 (small),κ=0.8 (swelling),κ=0.3 (haemorrhagictransformation)
von Kummer281 1996 45 CTs with MCA infarct signs and 6 neuroradiologists HMCAS, swelling, parenchymal Yesb κ=0.62/0.57 (HMCAS normals (within 6 h of stroke) hypodensity L/R). κ=0.59/0.56
(swelling), κ=0.58/0.55 (parenchymalhypodensity)
von Kummer282 1997 603 CTs of patients randomised in 3 neuroradiologists Whether recent ischaemia; Yesa κ=0.34 (recent ECASS (within 6 h) amount of parenchymal ischaemia), κ=0.36
hypoattenuation (amount of swelling)
Besson283 1998 33 MAST-E scans (within 6 h) 3 neurologists Early infarct signs, intracranial Yesa κ=1.0 (haematoma), haematoma, haemorrhagic κ=1.0 (HTI), κ=0.43 transformation (early infarct signs)
Marks284 1999 50 CTs from patients randomised in 3 neuroradiologists Parenchymal hypodensity, Yesb κ=0.65, 0.44, 0.50 for ATLANTIS (thrombolysis), (within HMCAS each pair of observers 6 h) (hypodensity), κ=0.33,
0.2, 0.63 (HMCAS)
Grotta285 1999 70 CTs from NINDS thrombolysis 16 (emergency physicians, Early infarct signs Yesc κ=0.3 (parenchymal trial (within 3 h) neurologists, radiologists) hypodensity), κ=0.2
(hypodensity > 33%),κ=0.33 (any earlysign)
a Blind to clinical history, b blind to both, c blind to other imaging. ATLANTIS, Acute Thrombolysis in Ischaemic Stroke; ECASS, European Cooperative Acute Stroke Study; HMCAS: hyperdense middle cerebral artery sign; MAST-E, MulticenterAcute Stroke Trial – Europe; MCA, middle cerebral artery; NINDS, National Institutes of Neurological Disorders and Stroke.
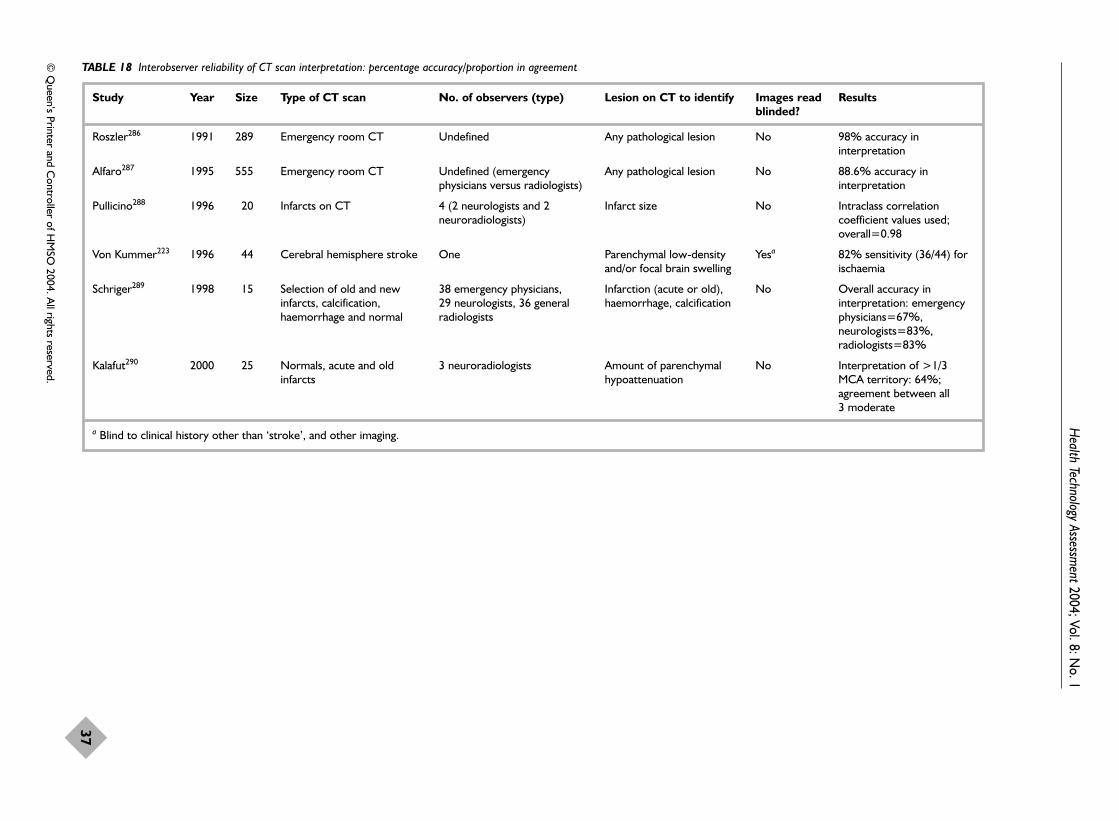
Health Technology Assessm
ent2004; Vol. 8: No. 1
37
© Q
ueen’s Printer and Controller of H
MSO
2004. All rights reserved.
TABLE 18 Interobserver reliability of CT scan interpretation: percentage accuracy/proportion in agreement
Study Year Size Type of CT scan No. of observers (type) Lesion on CT to identify Images read Resultsblinded?
Roszler286 1991 289 Emergency room CT Undefined Any pathological lesion No 98% accuracy ininterpretation
Alfaro287 1995 555 Emergency room CT Undefined (emergency Any pathological lesion No 88.6% accuracy in physicians versus radiologists) interpretation
Pullicino288 1996 20 Infarcts on CT 4 (2 neurologists and 2 Infarct size No Intraclass correlation neuroradiologists) coefficient values used;
overall=0.98
Von Kummer223 1996 44 Cerebral hemisphere stroke One Parenchymal low-density Yesa 82% sensitivity (36/44) for and/or focal brain swelling ischaemia
Schriger289 1998 15 Selection of old and new 38 emergency physicians, Infarction (acute or old), No Overall accuracy in infarcts, calcification, 29 neurologists, 36 general haemorrhage, calcification interpretation: emergency haemorrhage and normal radiologists physicians=67%,
neurologists=83%,radiologists=83%
Kalafut290 2000 25 Normals, acute and old 3 neuroradiologists Amount of parenchymal No Interpretation of >1/3 infarcts hypoattenuation MCA territory: 64%;
agreement between all 3 moderate
a Blind to clinical history other than ‘stroke’, and other imaging.
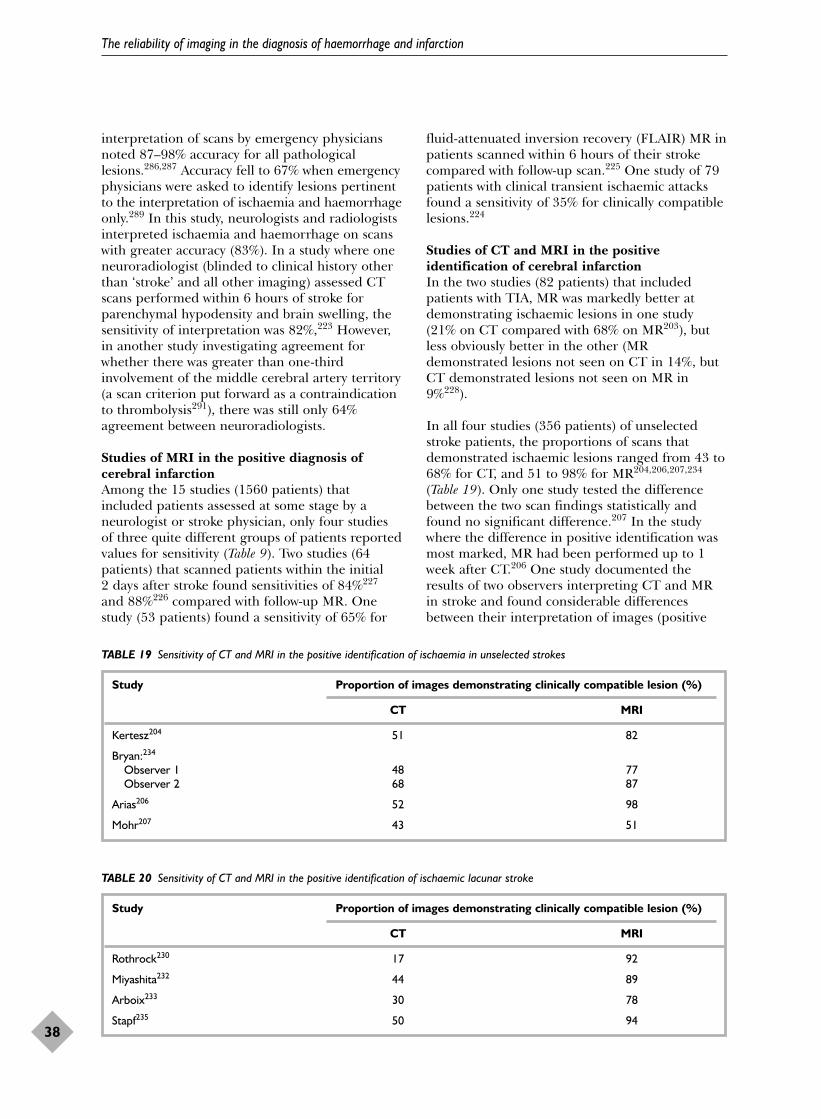
interpretation of scans by emergency physiciansnoted 87–98% accuracy for all pathologicallesions.286,287 Accuracy fell to 67% when emergencyphysicians were asked to identify lesions pertinentto the interpretation of ischaemia and haemorrhageonly.289 In this study, neurologists and radiologistsinterpreted ischaemia and haemorrhage on scanswith greater accuracy (83%). In a study where oneneuroradiologist (blinded to clinical history otherthan ‘stroke’ and all other imaging) assessed CTscans performed within 6 hours of stroke forparenchymal hypodensity and brain swelling, thesensitivity of interpretation was 82%,223 However,in another study investigating agreement forwhether there was greater than one-thirdinvolvement of the middle cerebral artery territory(a scan criterion put forward as a contraindicationto thrombolysis291), there was still only 64%agreement between neuroradiologists.
Studies of MRI in the positive diagnosis ofcerebral infarctionAmong the 15 studies (1560 patients) thatincluded patients assessed at some stage by aneurologist or stroke physician, only four studiesof three quite different groups of patients reportedvalues for sensitivity (Table 9). Two studies (64patients) that scanned patients within the initial 2 days after stroke found sensitivities of 84%227
and 88%226 compared with follow-up MR. Onestudy (53 patients) found a sensitivity of 65% for
fluid-attenuated inversion recovery (FLAIR) MR inpatients scanned within 6 hours of their strokecompared with follow-up scan.225 One study of 79patients with clinical transient ischaemic attacksfound a sensitivity of 35% for clinically compatiblelesions.224
Studies of CT and MRI in the positiveidentification of cerebral infarctionIn the two studies (82 patients) that includedpatients with TIA, MR was markedly better atdemonstrating ischaemic lesions in one study(21% on CT compared with 68% on MR203), butless obviously better in the other (MRdemonstrated lesions not seen on CT in 14%, butCT demonstrated lesions not seen on MR in9%228).
In all four studies (356 patients) of unselectedstroke patients, the proportions of scans thatdemonstrated ischaemic lesions ranged from 43 to68% for CT, and 51 to 98% for MR204,206,207,234
(Table 19). Only one study tested the differencebetween the two scan findings statistically andfound no significant difference.207 In the studywhere the difference in positive identification wasmost marked, MR had been performed up to 1week after CT.206 One study documented theresults of two observers interpreting CT and MRin stroke and found considerable differencesbetween their interpretation of images (positive
The reliability of imaging in the diagnosis of haemorrhage and infarction
38
TABLE 19 Sensitivity of CT and MRI in the positive identification of ischaemia in unselected strokes
Study Proportion of images demonstrating clinically compatible lesion (%)
CT MRI
Kertesz204 51 82
Bryan:234
Observer 1 48 77Observer 2 68 87
Arias206 52 98
Mohr207 43 51
TABLE 20 Sensitivity of CT and MRI in the positive identification of ischaemic lacunar stroke
Study Proportion of images demonstrating clinically compatible lesion (%)
CT MRI
Rothrock230 17 92
Miyashita232 44 89
Arboix233 30 78
Stapf235 50 94
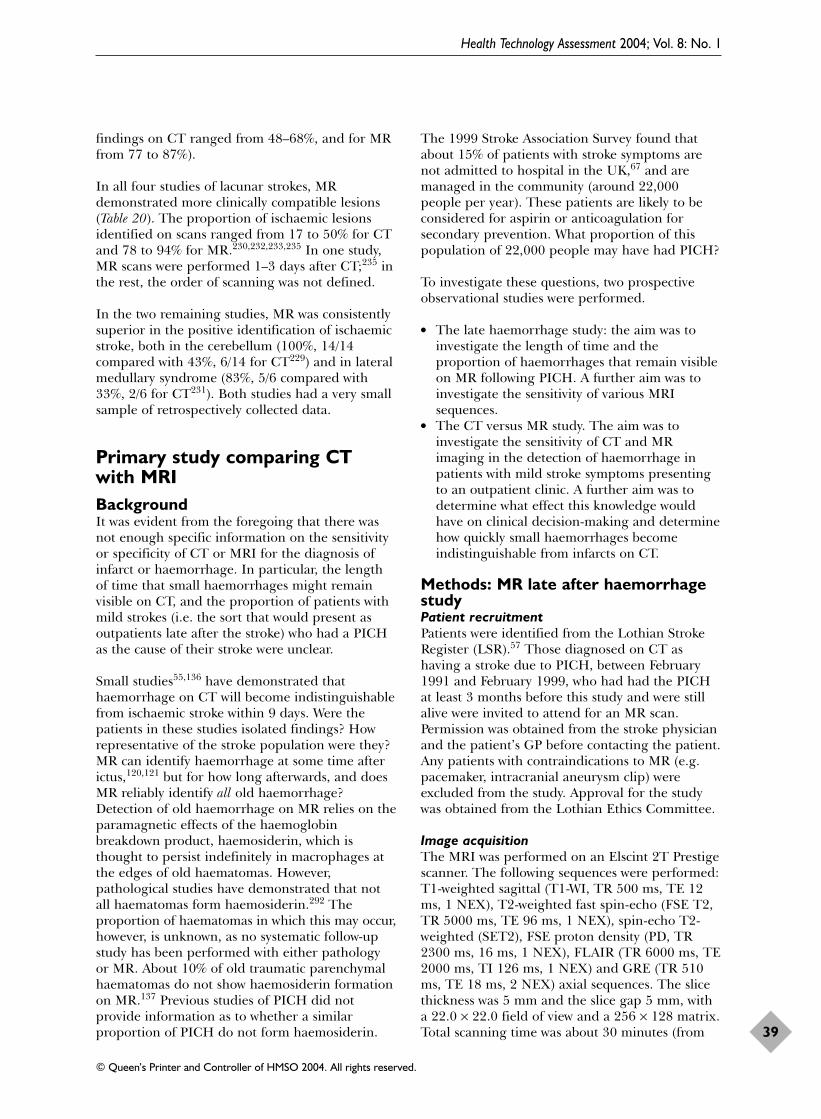
findings on CT ranged from 48–68%, and for MRfrom 77 to 87%).
In all four studies of lacunar strokes, MRdemonstrated more clinically compatible lesions(Table 20). The proportion of ischaemic lesionsidentified on scans ranged from 17 to 50% for CTand 78 to 94% for MR.230,232,233,235 In one study,MR scans were performed 1–3 days after CT;235 inthe rest, the order of scanning was not defined.
In the two remaining studies, MR was consistentlysuperior in the positive identification of ischaemicstroke, both in the cerebellum (100%, 14/14compared with 43%, 6/14 for CT229) and in lateralmedullary syndrome (83%, 5/6 compared with33%, 2/6 for CT231). Both studies had a very smallsample of retrospectively collected data.
Primary study comparing CTwith MRI BackgroundIt was evident from the foregoing that there wasnot enough specific information on the sensitivityor specificity of CT or MRI for the diagnosis ofinfarct or haemorrhage. In particular, the lengthof time that small haemorrhages might remainvisible on CT, and the proportion of patients withmild strokes (i.e. the sort that would present asoutpatients late after the stroke) who had a PICHas the cause of their stroke were unclear.
Small studies55,136 have demonstrated thathaemorrhage on CT will become indistinguishablefrom ischaemic stroke within 9 days. Were thepatients in these studies isolated findings? Howrepresentative of the stroke population were they?MR can identify haemorrhage at some time afterictus,120,121 but for how long afterwards, and doesMR reliably identify all old haemorrhage?Detection of old haemorrhage on MR relies on theparamagnetic effects of the haemoglobinbreakdown product, haemosiderin, which isthought to persist indefinitely in macrophages atthe edges of old haematomas. However,pathological studies have demonstrated that notall haematomas form haemosiderin.292 Theproportion of haematomas in which this may occur,however, is unknown, as no systematic follow-upstudy has been performed with either pathologyor MR. About 10% of old traumatic parenchymalhaematomas do not show haemosiderin formationon MR.137 Previous studies of PICH did notprovide information as to whether a similarproportion of PICH do not form haemosiderin.
The 1999 Stroke Association Survey found thatabout 15% of patients with stroke symptoms arenot admitted to hospital in the UK,67 and aremanaged in the community (around 22,000people per year). These patients are likely to beconsidered for aspirin or anticoagulation forsecondary prevention. What proportion of thispopulation of 22,000 people may have had PICH?
To investigate these questions, two prospectiveobservational studies were performed.
� The late haemorrhage study: the aim was toinvestigate the length of time and theproportion of haemorrhages that remain visibleon MR following PICH. A further aim was toinvestigate the sensitivity of various MRIsequences.
� The CT versus MR study. The aim was toinvestigate the sensitivity of CT and MRimaging in the detection of haemorrhage inpatients with mild stroke symptoms presentingto an outpatient clinic. A further aim was todetermine what effect this knowledge wouldhave on clinical decision-making and determinehow quickly small haemorrhages becomeindistinguishable from infarcts on CT.
Methods: MR late after haemorrhagestudyPatient recruitmentPatients were identified from the Lothian StrokeRegister (LSR).57 Those diagnosed on CT ashaving a stroke due to PICH, between February1991 and February 1999, who had had the PICHat least 3 months before this study and were stillalive were invited to attend for an MR scan.Permission was obtained from the stroke physicianand the patient’s GP before contacting the patient.Any patients with contraindications to MR (e.g.pacemaker, intracranial aneurysm clip) wereexcluded from the study. Approval for the studywas obtained from the Lothian Ethics Committee.
Image acquisitionThe MRI was performed on an Elscint 2T Prestigescanner. The following sequences were performed:T1-weighted sagittal (T1-WI, TR 500 ms, TE 12ms, 1 NEX), T2-weighted fast spin-echo (FSE T2,TR 5000 ms, TE 96 ms, 1 NEX), spin-echo T2-weighted (SET2), FSE proton density (PD, TR2300 ms, 16 ms, 1 NEX), FLAIR (TR 6000 ms, TE2000 ms, TI 126 ms, 1 NEX) and GRE (TR 510ms, TE 18 ms, 2 NEX) axial sequences. The slicethickness was 5 mm and the slice gap 5 mm, witha 22.0 × 22.0 field of view and a 256 × 128 matrix.Total scanning time was about 30 minutes (from
Health Technology Assessment 2004; Vol. 8: No. 1
39
© Queen’s Printer and Controller of HMSO 2004. All rights reserved.

the time the patient was put in the scanner tocoming out). The original CT scans from the timeof the PICH were retrieved from the X-raydepartment files.
Image analysisMR images were read by one neuroradiologist,blind to the patient’s clinical signs (other thanthey had had a PICH somewhere in the brain,sometime in the past) and baseline CT, or the timeelapsed from the original event. MR scans wereread independently of the original CT scan. MRsequences were read independently of each otherin batches of the same sequence, with a suitableinterval of time (minimum of 2 weeks) betweenbatches to prevent recall of the findings of othersequences. The baseline CT scans were read afterall the MR images had been read to identify thepresenting PICH.
Data recordedFrom the baseline CT scan, the following werenoted:
� the sites of the haematoma(s) (primary lesions)� the estimated volume of haematoma (maximum
length and width, multiplied by the slicethickness (mm) and the number of slices onwhich the haematoma was seen)
� any other findings (secondary lesions), forexample infarcts.
Lesions identified on follow-up MR sequenceswere coded as:
� visible as haemorrhage: if there was more thanone haematoma, the largest haematoma wasrecorded as the primary lesion; if there wasevidence of haematoma and infarct together,the lesion was documented as haematoma first, and other lesions were recorded assecondary
� visible as infarct: if there was more than oneinfarct, the largest infarct was recorded as theprimary infarct
� uncertain� not visible� scans were also coded for atrophy, leucoaraiosis,
enlarged perivascular spaces (on FSE T2),small-vessel disease in the white matter (FLAIR)and microhaemorrhage in the basal ganglia orelsewhere (GRE).
Once reading was complete the information fromCT and MR was matched. It was then possible todetermine whether any of the lesions seen on MR had developed in the interim between the
original index PICH and the MR. If an MR scandemonstrated multiple haematomas, it wascompared at this stage with the original CT toidentify which was the primary lesion and whichthe secondary lesion.
Data analysisResults were entered into a Microsoft Excelspreadsheet and an SPSS (Statistical Package forSocial Sciences) database, and analysed withsimple descriptive statistics.
Results: MR late after haemorrhagestudyPatients, tolerability and inadequate scansSeventy patients were identified in the LSR ashaving had a CT proven PICH between February1991 and February 1999, and known to be alive atthe last follow-up, but 17 were found to have diedin the interim. Thus, 53 patients with PICH onCT were invited to return for follow-up MRscanning. One patient died before attending, onehad aneurysm clips, 13 patients declined or wereunable to attend, 11 did not attend for theirappointments and one patient attended but wasclaustrophobic. A total of 26 people were scannedwith both CT and MR. Three people had twoprimary haematomas on their CT scan; therefore,the MR results of a total of 29 haematomas weredocumented. Of a total of 156 MR images, onlythree were uninterpretable (two FSE T2 sequences,one FLAIR sequence) owing to patient movementor because the imaging had to be discontinuedbecause of patient intolerance.
Baseline characteristicsThe mean age of patients was at time of scanning66.5 years (median 69 years, range 42–87 years).The mean time from PICH to follow-up MRscanning was 39.9 months (median 30.7 months,range 7.6–110.3 months). The mean haematomavolume was 23.9 cm3 (median 18 cm3, range 1–80 cm3) (Table 21). There were five frontal lobehaematomas, 10 in the basal ganglia, two in thethalamus, four in the parietal lobe, two in thetemporal lobe, three in the occipital lobe, one inthe occipitoparietal lobe, and two in thebrainstem/cerebellum.
Findings on follow-up MR sequencesThe proportion of haemorrhages identified variedbetween the five MR sequences. GRE identified allhaemorrhages (100%). Spin-echo T2 identifiedhaemorrhage on 28/29 (97%), FSE T2 identified27/29 (93%), PD identified 17/29 (59%) andFLAIR failed to identify any lesions as oldhaemorrhage (Table 22).
The reliability of imaging in the diagnosis of haemorrhage and infarction
40

The longest interval from CT to follow-up MR was8.4 years, and concerned a right hemisphere 1 cm3
basal ganglia lacunar haemorrhage that was stillvisible on T1, T2 and GRE sequences ashaemorrhage. No patient or brain imagingfeatures, such as timing of scan, age of patient orsize of haematoma, distinguished the haematomasthat did remain visible from those that did not onany of the sequences.
Any secondary lesions seen on initial CT aredocumented in Table 23, with the correspondingfindings on follow-up MR. In 19/26 patients(73%), an infarct not documented on the initialCT was seen on at least one sequence of follow-upMR. In 12/26 (46.2%), there was evidence ofdefinite new, presumably asymptomatichaemorrhage occurring since the original CT.
Other findings on follow-up MR are documentedin Table 24. GRE identified haemorrhagic ‘spots’in the basal ganglia and cortex in eight (28%)patients. FLAIR identified small-vessel disease on18 (62%). FSE T2 identified enlarged perivascularspaces on 16 (55%). Atrophy was identified on 20scans (69%).
Methods: the CT versus MR studyPatient recruitmentBetween August 1998 and July 2000, patientspresenting to the Western General Hospital withminor stroke symptoms (defined as symptomslasting for longer than 1 day but causing little orno diminishing of functional ability), or presentingmore than 5 days after onset of stroke symptomsregardless of stroke severity, were scanned on theday of presentation with CT and MRI. A few
patients in whom it was felt that the MRI couldcontribute specifically to diagnosis and whopresented within 1 day of onset of symptoms werealso included. The majority of the populationrecruited were outpatients presenting to aneurovascular clinic, and all were assessed beforescanning by a consultant stroke physician or aclinical research fellow in stroke medicine. Patientswere classified according to the OCSPclassification,9 and the Canadian NeurologicalScore (a neurological disability score ranging from1.5, indicating very severe stroke, to 10, indicatinglittle or no residual disability).299 Medicallyunstable patients, and patients withcontraindications to MRI (e.g. pacemaker,intraocular metal, intracranial aneurysm clips)were excluded.
Image acquisitionThe order of scanning was determined by theavailability of each scanner; that is, not randomly.CT was performed using a GE spiral scanner (17images, 5 mm slice thickness, total scan time frompatient going into the scanner to patient comingout the scanner was about 7 minutes). MRI wasperformed on two scanners; up to October 1999using an Elscint Prestige 2T scanner, and fromJanuary 2000, using a GE 1.5 Signa Horizon LXscanner. Patients underwent routine structuralMRI and the imaging parameters for the twoscanners were as follows: on the Elscint scanner,T1-weighted sagittal images (TR 500 ms, TE 12ms, 1 NEX), FSE T2 (TR 5000 ms, TE 96 ms, 1NEX), PD (TR 2300 ms, 16 ms, 1 NEX), FLAIR(TR 6000 ms, TE 2000 ms, TI 126 ms, 1 NEX)and GRE (TR 510 ms, TE 18 ms, 2 NEX) axialimages. The slice thickness was 5 mm and the slice
Health Technology Assessment 2004; Vol. 8: No. 1
41
© Queen’s Printer and Controller of HMSO 2004. All rights reserved.
TABLE 21 Late haemorrhage study: baseline characteristics
Mean Median Range SD
Age (years) 66.5 69 42–87 10.9Time from CT (months) 39.9 30.7 7.6–100.3 22.9Infarct volume (cm3) 23.9 18 1–80 22.9
TABLE 22 Late haemorrhage study: corresponding findings on different sequences at follow-up MRI
MRI sequence (%)
Scan finding Spin-echo T2 PD FSE T2 FLAIR GRE
Lesion visible as haemorrhage 28 (97) 17 (59) 27 (93) 0 29 (100)Lesion thought to be infarct 0 5 (17) 0 18 (62) 0Uncertain 0 2 (7) 0 1 (3) 0No residual lesion 1 (3) 5 (17) 0 9 (31) 0Scan uninterpretable 0 0 2 (7) 1 (3) 0
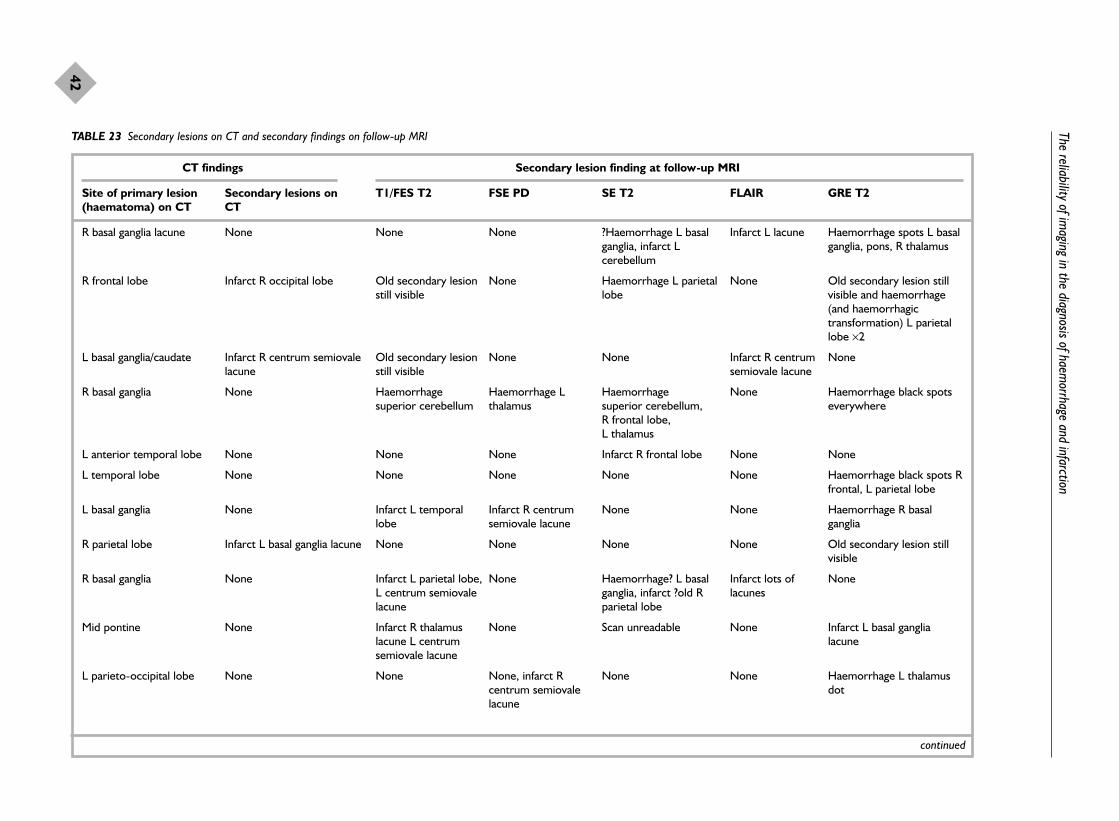
The reliability of imaging in the diagnosis of haem
orrhage and infarction
42
TABLE 23 Secondary lesions on CT and secondary findings on follow-up MRI
CT findings Secondary lesion finding at follow-up MRI
Site of primary lesion Secondary lesions on T1/FES T2 FSE PD SE T2 FLAIR GRE T2(haematoma) on CT CT
R basal ganglia lacune None None None ?Haemorrhage L basal Infarct L lacune Haemorrhage spots L basal ganglia, infarct L ganglia, pons, R thalamuscerebellum
R frontal lobe Infarct R occipital lobe Old secondary lesion None Haemorrhage L parietal None Old secondary lesion still still visible lobe visible and haemorrhage
(and haemorrhagictransformation) L parietallobe ×2
L basal ganglia/caudate Infarct R centrum semiovale Old secondary lesion None None Infarct R centrum Nonelacune still visible semiovale lacune
R basal ganglia None Haemorrhage Haemorrhage L Haemorrhage None Haemorrhage black spots superior cerebellum thalamus superior cerebellum, everywhere
R frontal lobe, L thalamus
L anterior temporal lobe None None None Infarct R frontal lobe None None
L temporal lobe None None None None None Haemorrhage black spots Rfrontal, L parietal lobe
L basal ganglia None Infarct L temporal Infarct R centrum None None Haemorrhage R basal lobe semiovale lacune ganglia
R parietal lobe Infarct L basal ganglia lacune None None None None Old secondary lesion stillvisible
R basal ganglia None Infarct L parietal lobe, None Haemorrhage? L basal Infarct lots of NoneL centrum semiovale ganglia, infarct ?old R lacunes lacune parietal lobe
Mid pontine None Infarct R thalamus None Scan unreadable None Infarct L basal ganglia lacune L centrum lacune semiovale lacune
L parieto-occipital lobe None None None, infarct R None None Haemorrhage L thalamus centrum semiovale dotlacune
continued

Health Technology Assessm
ent2004; Vol. 8: No. 1
43
© Q
ueen’s Printer and Controller of H
MSO
2004. All rights reserved.
TABLE 23 Secondary lesions on CT and secondary findings on follow-up MRI (cont’d)
CT findings Secondary lesion finding at follow-up MRI
Site of primary lesion Secondary lesions on T1/FES T2 FSE PD SE T2 FLAIR GRE T2(haematoma) on CT CT
R thalamus None Infarct R centrum None Scan unreadable None Haemorrhage black dots L semiovale lacune, thalamus, lentiform nucleusR thalamus lacune
L basal ganglia Infarct L MCA, R cerebellum Old secondary lesion None None Infarct L parietal still visible border zone
R frontal lobe and L Infarct R occipital lobe L cerebellum None Infarct L cerebellum Infarct L parietal Haemorrhage occipital lobe cortex R occipital lobe (not infarct
as on CT), L frontal, Rparietal dots
R cerebellum and R frontal None None None Haemorrhage R Infarct R centrum Haemorrhage R lobe temporal lobe, infarct semiovale lacune posterotemporal lobe,
R centrum semiovale infarct R centrum lacune semiovale lacune,
haemorrhage black dotseverywhere
L basal ganglia None None None Infarct L parieto- Infarct L parieto- Infarct L parieto-occipital occipital lobe occipital lobe lobe
R basal ganglia None Infarct none, None None None NoneL basal ganglia lacune
L basal ganglia None None None None None Haemorrhage R basalganglia
R occipital lobe and L None Infarct none, R None, None Infarct R Haemorrhage black parietal lobe cerebellum ?haemorrhage: tiny L cerebellum lacune spots everywhere
basal ganglia
L parietal lobe Infarct R fronto-parietal and Old secondary lesion Old secondary lesion Haemorrhage R frontal None Old secondary lesion still R occipital lobe still visible, infarct still visible (not infarct as on CT) visible, haemorrhage:black
L cerebellum spots everywhere
R, right; L, left.
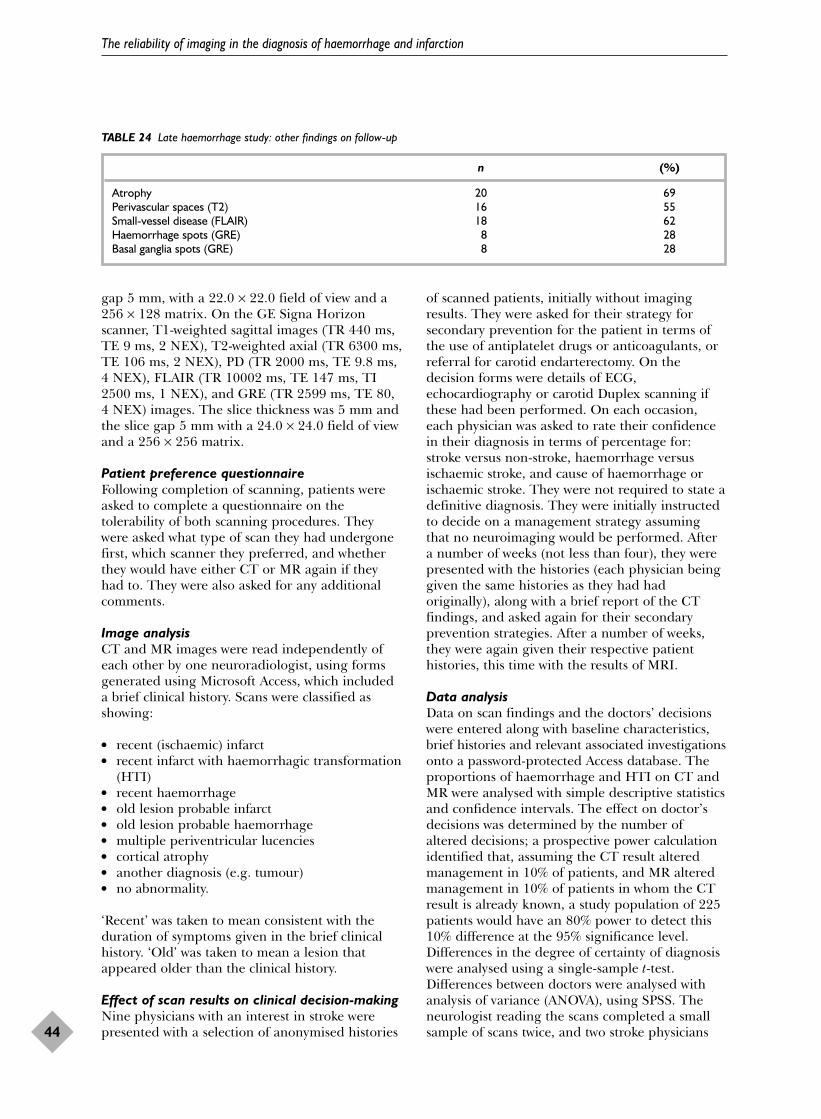
gap 5 mm, with a 22.0 × 22.0 field of view and a256 × 128 matrix. On the GE Signa Horizonscanner, T1-weighted sagittal images (TR 440 ms,TE 9 ms, 2 NEX), T2-weighted axial (TR 6300 ms,TE 106 ms, 2 NEX), PD (TR 2000 ms, TE 9.8 ms,4 NEX), FLAIR (TR 10002 ms, TE 147 ms, TI2500 ms, 1 NEX), and GRE (TR 2599 ms, TE 80,4 NEX) images. The slice thickness was 5 mm andthe slice gap 5 mm with a 24.0 × 24.0 field of viewand a 256 × 256 matrix.
Patient preference questionnaireFollowing completion of scanning, patients wereasked to complete a questionnaire on thetolerability of both scanning procedures. Theywere asked what type of scan they had undergonefirst, which scanner they preferred, and whetherthey would have either CT or MR again if theyhad to. They were also asked for any additionalcomments.
Image analysisCT and MR images were read independently ofeach other by one neuroradiologist, using formsgenerated using Microsoft Access, which includeda brief clinical history. Scans were classified asshowing:
� recent (ischaemic) infarct� recent infarct with haemorrhagic transformation
(HTI) � recent haemorrhage � old lesion probable infarct � old lesion probable haemorrhage � multiple periventricular lucencies � cortical atrophy� another diagnosis (e.g. tumour)� no abnormality.
‘Recent’ was taken to mean consistent with theduration of symptoms given in the brief clinicalhistory. ‘Old’ was taken to mean a lesion thatappeared older than the clinical history.
Effect of scan results on clinical decision-makingNine physicians with an interest in stroke werepresented with a selection of anonymised histories
of scanned patients, initially without imagingresults. They were asked for their strategy forsecondary prevention for the patient in terms ofthe use of antiplatelet drugs or anticoagulants, orreferral for carotid endarterectomy. On thedecision forms were details of ECG,echocardiography or carotid Duplex scanning ifthese had been performed. On each occasion,each physician was asked to rate their confidencein their diagnosis in terms of percentage for:stroke versus non-stroke, haemorrhage versusischaemic stroke, and cause of haemorrhage orischaemic stroke. They were not required to state adefinitive diagnosis. They were initially instructedto decide on a management strategy assumingthat no neuroimaging would be performed. Aftera number of weeks (not less than four), they werepresented with the histories (each physician beinggiven the same histories as they had hadoriginally), along with a brief report of the CTfindings, and asked again for their secondaryprevention strategies. After a number of weeks,they were again given their respective patienthistories, this time with the results of MRI.
Data analysisData on scan findings and the doctors’ decisionswere entered along with baseline characteristics,brief histories and relevant associated investigationsonto a password-protected Access database. Theproportions of haemorrhage and HTI on CT andMR were analysed with simple descriptive statisticsand confidence intervals. The effect on doctor’sdecisions was determined by the number ofaltered decisions; a prospective power calculationidentified that, assuming the CT result alteredmanagement in 10% of patients, and MR alteredmanagement in 10% of patients in whom the CTresult is already known, a study population of 225patients would have an 80% power to detect this10% difference at the 95% significance level.Differences in the degree of certainty of diagnosiswere analysed using a single-sample t-test.Differences between doctors were analysed withanalysis of variance (ANOVA), using SPSS. Theneurologist reading the scans completed a smallsample of scans twice, and two stroke physicians
The reliability of imaging in the diagnosis of haemorrhage and infarction
44
TABLE 24 Late haemorrhage study: other findings on follow-up
n (%)
Atrophy 20 69Perivascular spaces (T2) 16 55Small-vessel disease (FLAIR) 18 62Haemorrhage spots (GRE) 8 28Basal ganglia spots (GRE) 8 28

also completed a small sample of decisions twiceto check intraobserver variation.
Results: the CT versus MR studyPatient baseline characteristics and tolerabilityof scanningIn total, 232 patients were recruited; MR was notperformed in four patients (1.7%) (three patientswere claustrophobic, one was too large for thescanner). A total of 228 patients had both CT andMR. No images were uninterpretable.
The mean age of the population was 67.5 years(median 68 years, range 35–89 years). The meanCanadian Neurological Score was 9.5 (median 10,
range 5.5–10). The mean time from onset ofstroke symptoms to scanning was 21.5 days(median 20 days, range 1–112 days) (Table 25).According to the OCSP classification, there were95 (41.7%) PACS, 73 (32%) LACS, 36 (15.8%)POCS, and in 24 (10.5%) it was not possible todefine a subtype (Table 26). Before scanning (onpresentation), 144 (63.2%) were on aspirin, three(1.3%) were on warfarin and 10 (4.3%) were inatrial fibrillation.
Findings on CT and MRTable 27 documents the main findings on CT andMR. Note that more than one type of lesion couldbe found on the same scan (e.g. many scans with a
Health Technology Assessment 2004; Vol. 8: No. 1
45
© Queen’s Printer and Controller of HMSO 2004. All rights reserved.
TABLE 25 CT versus MRI study: baseline characteristics
Age (years) Time from onset of symptoms Canadian Neurological Score to scanning (days) at examination
Mean 67.5 21.5 9.5Median 68.0 20 9.5Range 35–89 1–112 5.5–10SD 9.9 15.3 1.0
TABLE 26 CT versus MRI study: distribution of stroke subtype according to the OCSP classification
Subtype n (%)
PACS 95 42LACS 73 32POCS 36 16Undefined 24 10Total 228 100
Table 27 CT versus MRI study: agreements, disagreements and corresponding findings on CT and MRI
CT findingsa
MRI findingsa RI HTI RH OLPI OLPH MPVL CA Normal Tumour Total
RI 86 1 0 8 0 7 7 12 1 122HTI 10 2 1 1 0 1 0 0 0 15RH 5 0 2 1 0 0 0 0 0 8OLPI 2 0 0 4 0 2 0 1 0 9OLPH 2 0 0 0 0 0 1 2 0 5MPVL 9 0 0 0 0 3 9 8 0 29CA 1 0 0 1 0 0 6 1 0 9Normal 4 0 0 2 0 0 3 19 0 28Other 0 0 0 0 0 0 0 0 3 3Total 119 3 3 17 0 13 26 43 4b 228
a Because of overlapping reporting of OLPI, OLPH and incidental meningioma with other more principal diagnoses, the onlyscans documented with this finding here are those where these were not associated with recent infarct, recenthaemorrhage or HTI.
b CT identified a further meningioma in a patient with a recent infarct, thus giving a total of five meningiomas identified.RI: recent infarct; HTI: haemorrhagic transformation; RH: recent haemorrhage; OLPI: old lesion probable infarct; OLPH, old lesion probable haemorrhage; MPVL, multiple periventricular lucencies; CA, cortical atrophy.

recent infarct also had cortical atrophy). Thefindings on the images of the 228 patients aredocumented in a hierarchy; that is, PICH, HTIand recent infarct are documented in favour ofany other diagnosis. Other diagnoses aredocumented in the table only if they were the onlysignificant finding on the scan. The findings withregard to haemorrhage and tumours are givenbelow.
Recent haemorrhageMR identified recent PICH in eight patients(3.5%, 95% CI 1.5 to 6.8%). CT agreed in only twopatients (0.9%, 95% CI 0.1 to 3.1%).
Corresponding findings on CT when recenthaemorrhage was not identified were: recentinfarct (five patients) and old lesion probableinfarct (one patient). Thus, in patients with recenthaemorrhage identified on MR, CT missed thediagnoses in 6/8 (75%) (Figures 3 and 4).
Recent infarct with HTIMR identified HTI in 15 patients (6.6%, 95% CI3.7 to 10.6%). The extent of haemorrhagicchanges seen varied from minor petechial spots tofrank haematoma. CT agreed in only two patients(0.9%, 95% CI 0.1 to 3.1%). Correspondingfindings on CT when HTI was not identified were:
The reliability of imaging in the diagnosis of haemorrhage and infarction
46
FIGURE 3 A 68-year-old man with right hemiparesis and dysphasia, with mild weakness persisting. (a) CT scan; (b) T2-weighted MRscan. Scans were taken at 11 days.
(a) (b)
FIGURE 4 A 60-year-old man with right hemiparesis and right facial numbness, with residual reduced fine finger movements. (a) CTscan; (b) T2-weighted MR scan; (c) GRE MR scan. Scans were taken 21 days after the onset of symptoms.
(a) (b) (c)

recent haemorrhage (one patient), recent infarct(10 patients), old lesion probable infarct (onepatient), multiple periventricular lucencies andcortical atrophy only (one patient). CT thereforemissed the haemorrhagic changes seen on MR in12/15 (80%). CT identified HTI on one scan thatwas interpreted as recent infarct only on MR. Onreview of both scans, the CT result was judged tobe incorrect, the changes seen on imaging beingdue to the contrast of normal cortex next toinfarct, as there was no evidence of haemorrhageon GRE MR.
Timing of scans identifying haemorrhageThe range of times from onset of symptoms to scanfor both CT and MR in patients found to have
either recent haemorrhage or HTI along withclinical presentation is documented in Table 28.The shortest time from onset of symptoms to scanwhen HTI was missed on CT was 4 days, and theshortest time PICH was missed on CT was 11 days(although this may have been sooner if scans wereperformed earlier). The two patients in whom CTcorrectly identified recent haemorrhage werescanned 9 and 14 days after stroke.
Old lesion, probable haemorrhageSigns suggestive of an old lesion that was probablyhaemorrhagic were seen on 15 MR scans (6.6%,95% CI 3.7 to 10.6%) but no CT scans. They werethe only significant findings in five patients(2.3%). In the remaining ten, these signs were
Health Technology Assessment 2004; Vol. 8: No. 1
47
© Queen’s Printer and Controller of HMSO 2004. All rights reserved.
TABLE 28 CT versus MRI study: scan findings in patients with haemorrhagic changes and timing of scanning in relation to onset ofsymptoms
Code Extent of Time from X-ray historyhaemorrhage scan (days)
3439 PICH 11 R hemiparesis and dysphasia, mild weakness persists
4336 PICH 13 Mild R haemiparesis including face, residual mild R facial weakness
4417 PICH 14 R arm and hand numbness lasted 2 days, persistent reduced fine fingermovements
4119 PICH 17 Ataxia, blurring of R field of vision, no residual neurological signs
4636 PICH 21 Right arm and leg weakness and facial numbness, residual reduced fine fingermovements
3995 PICH 28 Headache, scarred vision, persistent L inferior quadrantonopia
4548 HTI medium 6 Receptive and expressive dysphasia, R homonymous lower quadrantonopiaunresolved
3996 HTI medium 19 Expressive dysphasia, mostly improved
3043 HTI medium 20 Vomited, ataxia, falling to right, no residual neurological abnormality
3766 HTI medium 28 Probable R homonymous hemianopia, no residual signs, possibly migraine
4042 HTI medium 28 4 transient episodes of right facial numbness, one associated with right handparaesthesia
3654 HTI medium 56 20 minute episode of dysarthria followed by persistent L homonymous fielddeficit
4135 HTI trivial 5 R lower homonymous field defect, dysphasia, R inattention
4414 HTI trivial 14 Dysarthria, noted L facial weakness, still persists (mild)
4137 HTI trivial 21 Transient L hand weakness then following day R hand weakness; residualdecreased sensation R hand
3693 HTI trivial 28 Expressive dysphasia, almost back to normal; R arm weakness when tired forlast year
3824 HTI trivial 28 R arm weakness and expressive dysphasia, mostly resolved
824 HTI trivial 49 L homonymous field defect 3 days following thrombolysis for MI
4067 Seen on CT 4 Word-finding difficulty and difficulty with comprehension for 1 week
4113 Seen on CT 9 Left hand weakness, symptoms improving but still there
4403 Seen on CT 14 L hemiparesis (mild) and pins and needles; residual mild facial defect
4220 Seen on CT 17 Dysarthria, L arm sensory disturbance, L leg weakness, symptoms (mild)persist in leg
4581 Seen on CT 18 Headache followed by confusion, dressing apraxia, residual R homonymoushemianopia

seen alongside signs of recent infarction (eightpatients) and HTI (two patients).
Recent infarctionCT scanning identified a relevant recent infarctionin 119 (52.2%, 95% CI 45.7 to 58.7%). MR alsoshowed a relevant recent infarct in 86 patients(72.2%) (Table 29). In the patients where MR didnot agree with the CT diagnosis, the findings onMR were: HTI in 11 (9.2%), recent haemorrhagein three (2.5%), old lesion probable infarct in four(3.4%), old lesion probable haemorrhage in two(1.7%), multiple periventricular lucencies with orwithout cortical atrophy in 12 (10.1%) andnegative scan in four (3.4%).
MR identified a relevant recent infarction in 122patients (53.5%, 95% CI 47.0 to 60.0%) (Table 30).CT agreed in 86 patients (70.5%). In the patientswhere CT did not agree with MR diagnosis,findings on CT were: HTI in one (0.8%), oldlesion probable infarct in eight (6.6%), multipleperiventricular lucencies with or without corticalatrophy in 14 (11.5%), meningioma incidental tosymptoms in one (0.8%) and negative scan in 12(9.8%). Since the study was investigating the abilityof MR and CT to demonstrate ischaemic stroke,MR was not taken to be the gold standard againstwhich to make an estimate of sensitivity.
TumoursCT scans identified five tumours in 228 patients(1.7%): two intra-axial and three extra-axial (threemeningiomas; two of which were incidental, lessthan 1 cm in diameter and not responsible forsymptoms). MR also identified the two intra-axialtumours and the symptomatic meningioma, butnot the two incidental meningiomas.
Effect of CT and MRI on clinical decisionsIn total, 223 clinical histories with accompanyingrelevant clinical details were obtained. The ninestroke physicians (five consultants and four clinicalresearch fellows) were each given a selection ofhistories ranging in number from 11 to 44according to each physician’s time constraints.
Physicians’ diagnosesPhysicians were not asked to say definitivelywhether symptoms were due to stroke versus non-stroke, or infarct versus PICH. However, taking aphysician certainty of greater than 90% as adefinite diagnosis, the following diagnoses weremade.
� With information on clinical features,examination and general investigations (i.e. noscan findings), physicians made the diagnosis ofstroke (as opposed to non-stroke) in 153 cases(69%), of which 100% were felt to be due toinfarction (with greater than 90% certainty).
� When also given the corresponding findings onCT, the diagnosis of stroke was made in 166cases (74%), of which 153 (69%) were felt to bedue to infarction, two (1%) to be PICH and 11(5%) were equivocal (diagnosis could not bemade with greater than 90% certainty).
� When also given the findings on MR, thediagnosis of stroke was made in 169 cases(76%), of which 160 (72%) were felt to be due toinfarction, eight (4%) to PICH and one (0.5%)was equivocal.
Thus, a CT scan increased the certainty ofdiagnosis of stroke versus non-stroke beyond thatmade on clinical features alone (p = 0.006), MRless so (p = 0.5). However, MR greatly increased
The reliability of imaging in the diagnosis of haemorrhage and infarction
48
TABLE 29 CT versus MRI study: CT showed recent infarct,corresponding MR findings
Scan findings No. of findings on MR (%)
Recent infarct 86 (72.2)
Recent infarct and haemorrhagic 11 (9.2)transformation
Recent haemorrhage 3 (2.5)
Old lesion probable infarct 4 (3.4)
Old lesion probable haemorrhage 2 (1.7)
Multiple periventricular lucencies and/or 12 (10.1)cortical atrophy
Tumour 0 (0)
No abnormality 4 (3.4)
Total 119
TABLE 30 CT versus MRI study. MR showed recent infarct,corresponding CT findings
Scan findings No. of findings on CT (%)
Recent infarct 86 (70.5)
Recent infarct and haemorrhagic 1 (0.8)transformation
Recent haemorrhage 0 (0)
Old lesion probable infarct 8 (6.6)
Old lesion probable haemorrhage 0 (0)
Multiple periventricular lucencies and/or 14 (11.5)cortical atrophy
Tumour 1 (0.8)
No abnormality 12 (9.8)
Total 122

certainty in making a diagnosis of PICH (p < 0.001).
Decisions changed following scan resultsManagement decisions were changed followingknowledge of CT results in 38 cases overall (17%,95% CI 12 to 22%) (Table 31). With MR results, afurther 28 changes (13%, 95% CI 8 to 17%) weremade compared with decisions with CT findings(Table 32).
Decisions changed regarding the use of anantithrombotic drug in 17 patients (7.6%) whenhistories were reviewed with the CT results.Aspirin or another antiplatelet agent was startedin seven patients (who were not previously onantithrombotic therapy), stopped in six, andcontinued in four when they had been stopped onhistory alone). Decisions regarding warfarin werechanged in 12 (5.4%) patients (warfarin wasstarted in nine patients, stopped in two patients,and continued in one patient following CT resultswhen it had been stopped on history alone). If awarfarin decision was associated with anantiplatelet decision change, the latter was notcounted separately. Decisions regardingendarterectomy were changed in 10 patients(4.5%) when CT results were available (eightpatients were not referred, two patients werereferred).
Decisions regarding using an antithrombotic agentwere further altered in 14 (6.7%) patients with MRresults. Aspirin or another antiplatelet drug wasstarted in one patient and stopped in 13 patients.Decisions regarding warfarin were changed in fivepatients (2.2%) (warfarin was stopped in threepatients, all of whom had PICH or HTI, andstarted in two patients). Endarterectomy decisionswere changed in eight patients (3.6%) (six patientswere referred, two patients were not).
Table 33 documents how decisions changed inpatients with haemorrhage on their scans.
� In the two patients in whom PICH was also seenon CT, antithrombotic drugs were continued inone patient and another antiplatelet drug wasadded to aspirin in the other on history alone.These were discontinued when haemorrhagewas demonstrated on CT (and remaineddiscontinued following MR results).
� In the six patients in whom PICH was onlyidentified on MR, four had aspirin started, onecontinued aspirin, and in one patient warfarinwas stopped on history alone. With knowledgeof CT results, aspirin or another antiplatelet
agent was commenced or continued in fourpatients, and the one patient on warfarincontinued anticoagulation. Following MR resultsall antithrombotic drugs or warfarin werestopped or not commenced.
� In the three patients with HTI documented onCT, aspirin was started or continued in two, and stopped in one on history alone. FollowingCT results, aspirin was not started in onepatient, stopped in one and continued in one.Decisions were unchanged following MR results.
� In the 12 patients with HTI seen only on MR,describing the extent of HTI (as trivial ormoderate, no patients had extensive HTI)seemed to have no bearing on management.Aspirin or another antiplatelet drug wascommenced or continued in all 12 patients onhistory alone. With CT results, aspirin oranother antiplatelet agent was commenced inten patients, and warfarin commenced in two.With MR results, aspirin or another antiplateletdrug was started in all 12, and warfarin was notstarted in any patients.
Variability of scan reading and managementdecisionsThe neuroradiologist interpreting scans read 20scans twice with a gap of several weeks betweenreadings to ensure blinding to the previousdiagnosis. Diagnoses were identical in 17 (85%),and in no scans with haemorrhage was a differentdiagnosis reached. One stroke physician repeatedten decision forms, another repeated five.Decisions were consistent in 90% and 40%,respectively. An ANOVA on the certainty values ofthe different physicians making decisions showedsignificant variation ( p = 0.009).
Patient scan preference questionnaireQuestionnaires were available for 192 patients. Ofthese patients, 82 (43%) underwent CT first and110 (57%) underwent MR first. Altogether, 150patients (78%) preferred CT, compared with 13(7%) preferring MR and 29 (15%) expressing nopreference. All patients felt they would agree to afurther CT scan if they had to, and 99% wouldagree to an MR, although four patients added thatit would be under duress. Twenty-one patientscommented on the friendliness and helpfulness ofthe staff. Other comments included that the MRwas noisy (11 patients), claustrophobic (six), tooktoo long (five) and was frightening (two). Onepatient liked the noise of the MR scanner, whileone felt more secure in the MR scanner and foundit more relaxing than CT (they felt they would falloff the CT table).
Health Technology Assessment 2004; Vol. 8: No. 1
49
© Queen’s Printer and Controller of HMSO 2004. All rights reserved.

The reliability of imaging in the diagnosis of haem
orrhage and infarction
50
TABLE 31 Doctors’ decisions: change in decision between that based on clinical features alone and that made with CT results available
History with CT results
History alone Start aspirin Start aspirin Stop aspirin Continue Start another Continue aspirin Not applicable Scan required Totaland another aspirin antiplatelet and start another for another antiplatelet agent agent antiplatelet agent diagnosis
Start aspirin 44 1 0 3 3 0 3 0 54
Start aspirin and 0 0 0 0 0 0 0 0 0another antiplatelet agent
Stop aspirin 1 0 3a 3 0 1 0 0 8
Continue aspirin 8 0 7b 72 5 18 1a 1 112
Start another 2 0 0 2 8 0 1a 0 13antiplatelet agent
Continue aspirin 1 0 2a 2 11 5 0 0 21and start another antiplatelet agent
Not applicable 6 0 0 1 0 0 7 1 15
Scan required for 0 0 0 0 0 0 0 0 0another diagnosis
Total 62 1 12 83 27 24 12 2 223
Anticoagulation commenced in a one patient, b five patients.Overall, following CT, anticoagulation commenced in nine patients, not started in one patient when started following history only, and continued in one patient (in 9/11, changeswere also made to aspirin decisions).

Health Technology Assessm
ent2004; Vol. 8: No. 1
51
© Q
ueen’s Printer and Controller of H
MSO
2004. All rights reserved.
TABLE 32 Doctors’ decisions: change in decision between that made with CT results, and then with MRI results
History with CT results
History with CT Start aspirin Start aspirin Stop aspirin Continue Start another Continue aspirin Not applicable Scan required Totalresults and another aspirin antiplatelet and start another for another
antiplatelet agent agent antiplatelet agent diagnosis
Start aspirin 44 0 0 4 3 2 9 0 62
Start aspirin and 1 0 0 0 0 0 0 0 1another antiplatelet agent
Stop aspirin 0 0 10 1b 0 0 1 0 12
Continue aspirin 2 0 2a 69 6 2 2 0 83
Start another 2 0 1a 2 8 14 0 0 27antiplatelet agent
Continue aspirin and 0 1 0 9 2 12 0 0 24start another antiplatelet agent
Not applicable 1 0 2b 0 1 0 8b 0 12
Scan required for 0 0 0 0 0 0 0 2 2another diagnosis
Total 50 1 15 85 20 30 20 2 223
a Anticoagulation started in two patients; b anticoagulation stopped in three patients.
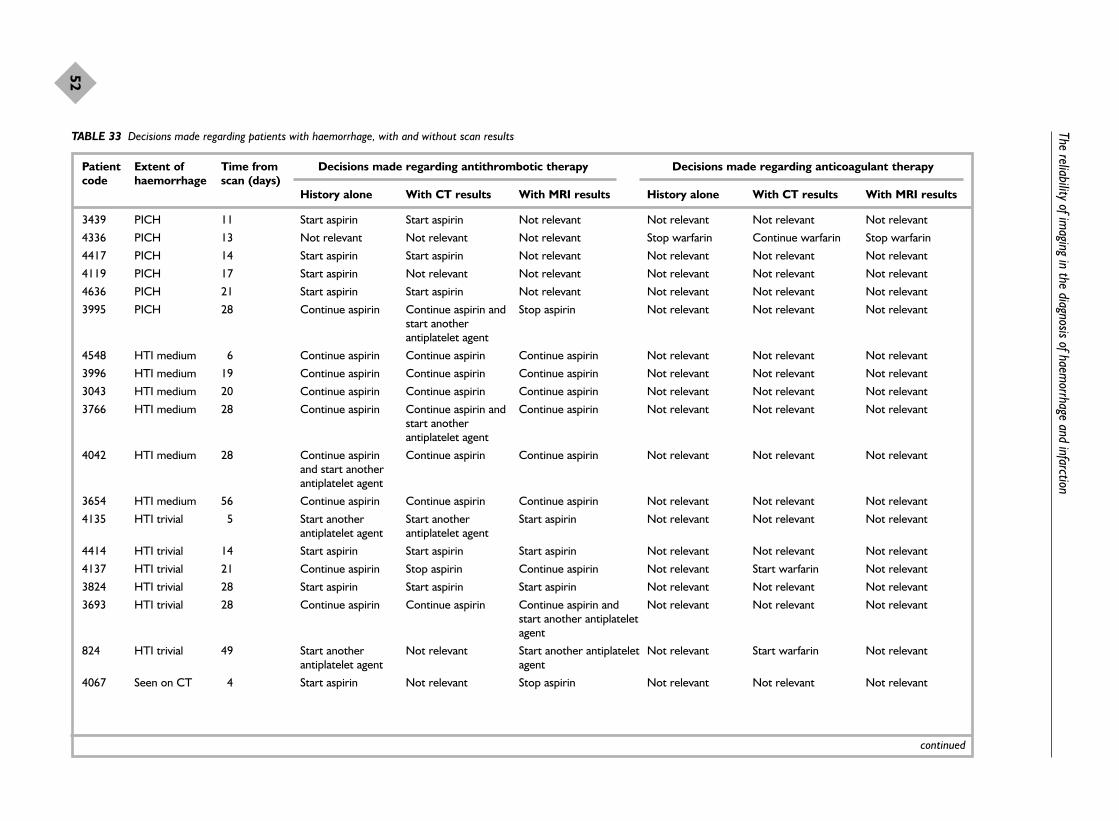
The reliability of imaging in the diagnosis of haem
orrhage and infarction
52
TABLE 33 Decisions made regarding patients with haemorrhage, with and without scan results
Patient Extent of Time from Decisions made regarding antithrombotic therapy Decisions made regarding anticoagulant therapycode haemorrhage scan (days)
History alone With CT results With MRI results History alone With CT results With MRI results
3439 PICH 11 Start aspirin Start aspirin Not relevant Not relevant Not relevant Not relevant
4336 PICH 13 Not relevant Not relevant Not relevant Stop warfarin Continue warfarin Stop warfarin
4417 PICH 14 Start aspirin Start aspirin Not relevant Not relevant Not relevant Not relevant
4119 PICH 17 Start aspirin Not relevant Not relevant Not relevant Not relevant Not relevant
4636 PICH 21 Start aspirin Start aspirin Not relevant Not relevant Not relevant Not relevant
3995 PICH 28 Continue aspirin Continue aspirin and Stop aspirin Not relevant Not relevant Not relevantstart another antiplatelet agent
4548 HTI medium 6 Continue aspirin Continue aspirin Continue aspirin Not relevant Not relevant Not relevant
3996 HTI medium 19 Continue aspirin Continue aspirin Continue aspirin Not relevant Not relevant Not relevant
3043 HTI medium 20 Continue aspirin Continue aspirin Continue aspirin Not relevant Not relevant Not relevant
3766 HTI medium 28 Continue aspirin Continue aspirin and Continue aspirin Not relevant Not relevant Not relevantstart another antiplatelet agent
4042 HTI medium 28 Continue aspirin Continue aspirin Continue aspirin Not relevant Not relevant Not relevantand start another antiplatelet agent
3654 HTI medium 56 Continue aspirin Continue aspirin Continue aspirin Not relevant Not relevant Not relevant
4135 HTI trivial 5 Start another Start another Start aspirin Not relevant Not relevant Not relevantantiplatelet agent antiplatelet agent
4414 HTI trivial 14 Start aspirin Start aspirin Start aspirin Not relevant Not relevant Not relevant
4137 HTI trivial 21 Continue aspirin Stop aspirin Continue aspirin Not relevant Start warfarin Not relevant
3824 HTI trivial 28 Start aspirin Start aspirin Start aspirin Not relevant Not relevant Not relevant
3693 HTI trivial 28 Continue aspirin Continue aspirin Continue aspirin and Not relevant Not relevant Not relevantstart another antiplatelet agent
824 HTI trivial 49 Start another Not relevant Start another antiplatelet Not relevant Start warfarin Not relevantantiplatelet agent agent
4067 Seen on CT 4 Start aspirin Not relevant Stop aspirin Not relevant Not relevant Not relevant
continued
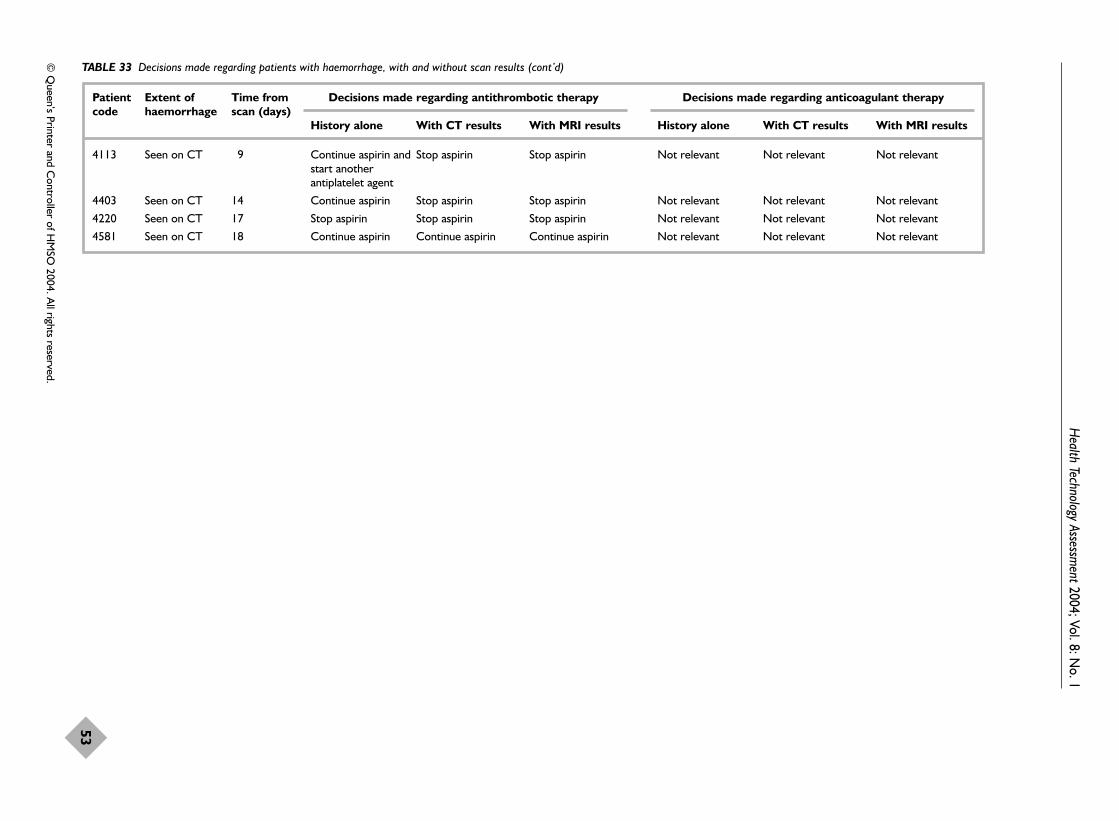
Health Technology Assessm
ent2004; Vol. 8: No. 1
53
© Q
ueen’s Printer and Controller of H
MSO
2004. All rights reserved.
TABLE 33 Decisions made regarding patients with haemorrhage, with and without scan results (cont’d)
Patient Extent of Time from Decisions made regarding antithrombotic therapy Decisions made regarding anticoagulant therapycode haemorrhage scan (days)
History alone With CT results With MRI results History alone With CT results With MRI results
4113 Seen on CT 9 Continue aspirin and Stop aspirin Stop aspirin Not relevant Not relevant Not relevantstart another antiplatelet agent
4403 Seen on CT 14 Continue aspirin Stop aspirin Stop aspirin Not relevant Not relevant Not relevant
4220 Seen on CT 17 Stop aspirin Stop aspirin Stop aspirin Not relevant Not relevant Not relevant
4581 Seen on CT 18 Continue aspirin Continue aspirin Continue aspirin Not relevant Not relevant Not relevant

Discussion
CT identifies PICH but it is notpossible to derive its sensitivityPublished studies demonstrate that PICH on CTappears acutely as an area of obvious hyperdensity,but the duration of its appearance is timedependent. Moderately sized haematomas canbecome isodense within 14 days55 and smaller oneswithin 9 days,136 but previous studies had failed todetermine the latest reliable time to use CT.Although features of old haemorrhage have beendescribed on CT (such as slit-like cavities and ahyperdense edge), these were not demonstrated tobe reliable in the identification of haemorrhagelate after stroke.169,170 It was not possible from thepublished studies to derive a value for thesensitivity of CT in the identification of PICH, andthere is little information on observer reliability.Two studies that investigated interobserverreliability in the identification of PICH on CTshowed that not all clinicians and radiologists wereequally proficient.289,294 Therefore, although it islikely that, in good hands, CT can identify most, ifnot all, PICH within a few days of ictus, the rapidchange in appearance over time may confusediagnosis, meaning that the sensitivity of CT isunlikely to be 100%. However, the difficulty offinding a gold standard against which to judge CTin the acute phase of stroke (MR is likely to bemore difficult to interpret in this phase, and post-mortem introduces selection bias towards the moresevere strokes) may mean that determining itssensitivity is an impossible task. Theepidemiological ideal is careful clinical assessmentby an experienced stroke physician, CT in theacute phase, careful clinical follow-up to ensurethat the patient behaves like a stroke, and a finalconsensus diagnosis following a panel discussion.However it was not evident that such an approachhad been used in any of the identified studies.
The study comparing CT and MR in latepresenting mild stroke identified that CT reliablyidentified small haemorrhages only up to 8 daysafter stroke. MR identified more haemorrhagethan CT. A higher than normal field-strength MRscanner (2T) was used for many of the patients inthis study (normal clinical scanners are usually 1.0or 1.5T) but this will not have made any materialdifference to the assessment of MR and CT withthe sequences used. MR proved superior in thedetection of both PICH and HTI. CT did notidentify any cases of haemorrhage that were notalso identified on MRI. There are no criteriaagainst which to judge MR, but assuming MR tobe the gold standard (a reasonable assumption
and the best we have at present), the sensitivity ofCT in the detection of PICH and HTI in thisgroup of patients was 50% and 20%, respectively.The patients with PICH made up 3.5% of the totalgroup and 2.6% were misdiagnosed on CT asinfarcts. This would result in 26 patients beingmismanaged as ischaemic strokes per 1000 strokepatients presenting to the neurovascular clinic.This group of patients represented a typicalpopulation presenting to a neurovascular clinicand were scanned an average of 3 weeks aftertheir stroke. A major delay before scanning wasthe time to presentation to the GP, as there wasonly a short delay once referred. This time delaydefinitely has a detrimental effect on thesensitivity of CT in the detection of PICH.199,205
In this study, CT missed 19/23 (74%) of allhaemorrhage identified on MR. The earliest time-point at which a PICH was missed on CT was 11days (and because the scan was not performed anyearlier, it is impossible to say precisely the earliesttime-point at which this PICH would have beenmissed). The latest time PICH was identified onCT was 14 days. These timings, both ofpresentation to scan and CT findings highlight animportant point. It is highly questionable toperform a CT more than 8–10 days after onset ofstroke symptoms if the only reason for performingthe investigation is to rule out the possibility ofhaemorrhage (as opposed to identifying a non-stroke lesion).
Can we derive the sensitivity of MR forhaemorrhage?The appearance of PICH on MR is morecomplicated than with CT. The change inappearance of PICH over time and the differentappearance on each sequence are very confusing.Not all sequences are equally sensitive to PICH.Previous studies suggested that GRE sequences(which are not routinely used) are highly effectiveat demonstrating PICH, probablyindefinitely,120,121,190,195 but failed to demonstratewhether all haemorrhages remained identifiable assuch. In the present study it was demonstratedthat all 29 PICHs remained visible ashaemosiderin in all 26 patients when scanned withMR up to 8 years after the stroke. Spin-echo T2was shown to be the next most sensitive (97%),followed by fast spin-echo T2, on which about 93%of old PICH is identifiable. Although it wasdisappointing that only 26 patients actuallyunderwent imaging, this is the largest (in factonly) study of its kind. The majority of thepatients that we identified as still alive after theindex PICH were either too disabled or had died,reflecting the high morbidity and mortality of
The reliability of imaging in the diagnosis of haemorrhage and infarction
54

PICH. However the findings are in keeping withone other relevant study, although the proportionof former PICH still identifiable as such wasslightly higher than in the one previous study,which examined the late MR appearance oftraumatic intracerebral haemorrhage. This studyfound that haemosiderin was still visible in 90% ofpatients on spin-echo T2 up to 5 years aftertrauma.135 Thus, for truly reliable identification offormer PICH, a GRE sequence is required. Thereis less information on the reliability of MR in theidentification of hyperacute haemorrhage. Thetwo studies that have attempted to do so so far,both in academic stroke centres, are thereforeimportant, but do not provide generalisableconclusions as the sample sizes were verysmall.199,205 These studies also failed to mentionthe additional problems encountered with MR, ofpatient tolerability and contraindications, makingit difficult to gauge the usefulness of MR in a non-selected stroke population. Therefore, for thepresent, there is reasonable (if a modest amountof) evidence that MR is very sensitive and specificfor haemorrhage late after stroke.
CT in the positive identification ofischaemic stroke: values for sensitivityvary widelyStudies documenting the sensitivity of CT in theidentification of ischaemic stroke demonstrate thathigh levels of sensitivity can be achieved, but notconsistently. The range of sensitivities was wide andconfounded by the variety of stroke populationsinvestigated, as well as timing of scanning inrelation to onset of stroke symptoms, and level ofexperience of the person interpreting the images.For instance, grouping studies according to timingof scanning (Table 16) did not reveal that scaninterpretation was necessarily less accurate in thehyperacute stage. Neuroradiologists weregenerally more accurate in their interpretation ofCT changes than were emergency physicians.289,295
However, the more impressive results associatedwith (highly trained) neuroradiologists were fromretrospective studies. Neuroradiologists may notalways be available, especially within 6 hours, andhence it may not be possible to reproduce theseresults in real life. A good example of howdifferent those results could be is the practiceaudit by general physicians in a Canadian hospitalof the sensitivity of CT scanning in demonstratinga diagnostic lesion at 24 hours, where it was foundto be only 23%.244 When CT was first introduced,early investigators were content merely to describeclinicotopographical findings.236,296 In the presentera of increasingly sophisticated strokemanagement, such as the use of thrombolysis, it
may be necessary accurately (and reliably) todemonstrate an infarct. If a sign on CT cannot bedistinguished reliably by multiple observers withvarying levels of ability, it is of no use as a markeron which to base clinical decisions (e.g. whether ornot to give thrombolysis). So far, it seems thatsigns of early ischaemia on CT are too subtle formultiple observers to identify reliably andconsistently.
Is MR really more sensitive than CT inthe positive identification of ischaemicstroke?Few studies so far have compared the sensitivitiesof CT and MR, and those that have been donewere concerned with the identification of aninfarct in the first few days. Those published so farseem to demonstrate that routine structural MR isconsistently more sensitive in the positiveidentification of ischaemic stroke. This is probablythe case, but inadequacies in the methodology ofthe studies make it unsafe to draw very robustconclusions. Sample sizes were small, and CTusually preceded MR by up to several hours, soincreasing the chance that MR would show aninfarct when CT did not. To derive the mostaccurate measure of sensitivity, scans should at thevery least be performed on the same day, andideally (especially in the hyperacute and acutestages) the order in which they are performedshould be randomised. Blinding the interpreter ofimages to clinical history or other imaging isimportant to prevent bias; only 58% of studieswere blinded. Only one study tested anydifferences found statistically (and found nodifference).207
To the authors’ knowledge, the present study isthe only one to compare CT with MR in laterpresenting mild stroke. In this study, scans wereperformed on the same day. In view of the lengthof time from stroke to scanning (median 20 days),randomisation of the order of scanning was lessimportant than in hyperacute studies. Thepatients in the study had mild strokes (medianCanadian Neurological Score of 9.5) and manyhad few residual signs. CT and MR seemed ofequal efficacy in demonstrating a recent infarct(about 50% of patients) and agreed with eachother in a similar proportion (about 70%). Thisstudy was relatively large and prospective, theimaging assessment was blinded to other imaging,and the impacts on clinical decision-making andpatient tolerability were systematically assessed.The MR scanning, although less liked than CT,was well tolerated by this group of older patientswith stroke. CT or MR increased the clinician’s
Health Technology Assessment 2004; Vol. 8: No. 1
55
© Queen’s Printer and Controller of HMSO 2004. All rights reserved.

confidence of the diagnosis of stroke in about 5%of patients, and MR more than CT allowed thediscrimination of infarct from haemorrhage. CTaltered management in 17% and MR in 13%. Thedata are likely to be generalisable to hospitalselsewhere in the UK offering a similarneurovascular service.
How many minor strokes may havehad haemorrhage in the generalpopulation?The estimated number of patients being treated inthe community is about 22,000 per year in theUK.67 The use of aspirin increased dramaticallyduring the 1990s61,67 and stroke physicians areexhorted to consider warfarin in increasingly olderpopulations of patients with atrial fibrillation.297,298
The incidence of PICH in this study populationwas 3.5% and of HTI was 6.6%. From StrokeAssociation Survey estimates of patients in thecommunity presenting with stroke symptoms,these would represent around 2200 patients peryear in whom antithrombotic or anticoagulanttreatment would be offered inappropriately.
What is the true incidence ofasymptomatic haemorrhage?Follow-up MRI identified evidence of newhaemorrhage in 12/26 patients (46.2%) in the latehaemorrhage study, which was presumedasymptomatic as there was no history of anyfurther event in the interim. Signs of oldasymptomatic haemorrhage were also found onMR in the CT versus MR study, but in far fewerpatients (15/228, 6.6%). Although in patients withrecent haemorrhage or haemorrhagictransformation in the CT versus MR study theproportion with asymptomatic haemorrhage wasslightly higher (8.9%), it was still far from thevalues of up to 68% given in previous studieslooking for asymptomatic haemorrhagespecifically.120,121,199,202 The most likely reasons forthe large differences between the present studiesand the previously published work are thedifference in case-mix and timing of scanning.
Do imaging results really matter?It may be that patients with PICH found only onMR would have come to no harm had theirantithrombotic treatment been continued. In thisstudy, knowledge of scan results made a differenceto clinical management in 17% of cases followingCT, and in a further 12% following MR. Whetherthe proportion of changes is large enough to alterscanning policy is debatable. Although cliniciansprefer to have scans (certainty of diagnosis wasincreased) and patients prefer to have scans
(personal observation), if access to imaging isrelatively limited, figures such as found in heremay not prove convincing enough to justify a ‘scaneveryone’ policy. The variability within andbetween doctors’ decisions in this study makes itimpossible to say that these figures are definitive,but they do help to quantify the contribution ofimaging to the overall management of the patient.
Should we be using MR more?To be sure that a patient presenting with mildstroke symptoms more than 8–10 days after theevent has not had a haemorrhagic stroke, MR isrequired. Access to MR is limited in the UK,67 withmany weeks’ wait for a scan. If we were to wait forMR before treating all patients presenting after 10days (assuming it was possible to obtain access toan MR machine), this would create an unacceptablelevel of delay in commencement of secondaryprevention for the majority of patients. ‘Salvage’by MR, because it is too late to CT, is not really acredible option. Patients should be encouraged toseek medical attention early after any stroke, andhospital clinics and imaging departments shouldoffer responsive and rapid access to medical andCT assessment.
ConclusionsImplications for practice� Patients should be encouraged to seek medical
attention rapidly after suspected stroke. � GPs should refer patients rapidly to hospital for
further assessment and imaging on an in-patient or out-patient basis.
� Rapid access to CT should be considered;otherwise small PICHs will be misdiagnosed asinfarcts and managed inappropriately. The datafrom the authors’ neurovascular outpatientclinic suggest that about 26 per 1000 patientswill be misdiagnosed and managedinappropriately if CT scanning is delayed tomore than 8 days after stroke.
� In patients with mild stroke, CT and MRpositively identify a similar proportion of recentinfarcts.
� A GRE MR scan is required to exclude priorPICH reliably. If GRE is not available, then aspin-echo T2 sequence is nearly as sensitive asthe GRE.
Implications for future research� There are specific signs for old haemorrhage on
CT (slit-like cavities with a hyperdense edge).Future studies should determine the sensitivityand specificity of these signs, as improved
The reliability of imaging in the diagnosis of haemorrhage and infarction
56

awareness of them may lead to better detectionof prior haemorrhage on CT, so perhapsavoiding the need to resort to MR in somecases.
� The proportion of patients with minor PICHwill certainly have been underestimated inprevious epidemiological studies. There will beabout 26 per 1000 more PICHs than originallythought, and possibly more, as the studycomparing CT with MR presented here was notcommunity based.
� Future epidemiology studies should adopt more rapid scanning if using CT, or use MRinstead.
� More data are required to determine thesensitivity and specificity of MR forhaemorrhage early after stroke.
� More data are needed on how to improve thedetection of hyperacute infarcts on CT.
� Radiologists should improve the methodologyof studies to assess the accuracy or utility of newimaging modalities. They should resist pursuingnew techniques when important questionsremain unanswered about existing techniques.The domination of the neuroimaging literatureby studies concerning more advancedneuroimaging strategies such as diffusion MRimaging, to the neglect of better understanding
of the basic techniques, is a typical example.This suggests a trend towards the publication ofwhat is ‘fashionable’ rather than important, andsimply fuels the argument that allocation ofradiological resources should not be left in thehands of clinicians and radiologists.
� Specific points to be improved in future imagingstudies include accumulating a large enoughprospective case series of well-characterisedpatients, with blinded interpretation of images,and assessment of the impact on decision-making and patient tolerability.
� Asymptomatic microhaemorrhage appears to becommon in patients presenting with ahaemorrhagic stroke.
� Future epidemiology studies should alsoexamine the frequency of PICH by age and byrecurrent compared with first stroke.
� As patients with PICH are more likely to haveanother PICH than an infarct (than patientswith an infarct as their first stroke), if they havea recurrence, it is possible that the incidence ofPICH is different in recurrent stroke than infirst stroke.
� In particular, the influence of antithromboticdrugs on the frequency of asymptomatichaemorrhage and on PICH as a cause ofrecurrent stroke needs to be assessed.
Health Technology Assessment 2004; Vol. 8: No. 1
57
© Queen’s Printer and Controller of HMSO 2004. All rights reserved.


This chapter presents a systematic review of the harm that may arise from failing to
diagnose haemorrhage correctly and discussesantithrombotic treatment in patients withintracranial haemorrhage.
BackgroundThe dilemma of startingantithrombotic treatment afterintracranial haemorrhageIntracranial haemorrhage, either intracerebral orsubarachnoid, is usually considered an absolutecontraindication to the use of antihaemostaticagents such as antiplatelet drugs oranticoagulants. However, in clinical practice, thereare occasions when it is appropriate to considerusing these agents in patients with definite (orpossible) intracranial haemorrhage. For example,should a patient, recently started on aspirinfollowing coronary artery bypass surgery, nowadmitted with a stroke due to intracerebralhaemorrhage, stop or continue the aspirin?Should a patient, immobilised after an SAH, begiven heparin for prophylaxis of deep veinthrombosis (DVT)? What should be done if thepatient with SAH developed a clinically evidentDVT before definitive treatment of any underlyinganeurysm? It would be helpful to know thebalance of risks and benefits in these types ofpatients.
A second problem is that the only way to distinguishstroke due to cerebral infarction from that due tointracerebral haemorrhage is by brain imaging withCT or MRI.35,299 The International Stroke Trial(IST) and the Chinese Acute Stroke Trial (CAST)demonstrated the benefit of aspirin if given within48 hours of stroke onset.128 Consequently, theremay be pressure to commence aspirin treatment assoon as possible if the clinical features suggest thatthe stroke was unlikely to be haemorrhagic, even ifintracerebral haemorrhage has not been ruled out.For example, if brain imaging is not immediatelyavailable (or not available at all – a problemencountered in poorly resourced healthcaresettings), it may well be worth starting aspirin
treatment even though haemorrhagic stroke hasnot been reliably ruled out if the benefits for themajority with ischaemic stroke are likely tooutweigh the risks in those with haemorrhagicstroke, while waiting for the brain scan.
There are numerous anecdotal reports in theliterature of patients with intracranial haemorrhagewho were given antithrombotic or anticoagulantdrugs, for example for DVT or pulmonaryembolism (PE), without apparent deterioration intheir neurological status (Table 34). However, it isnot possible to use this information to determinethe risks or benefits of antithrombotic oranticoagulant treatment in patients with intracranialhaemorrhage, either in patients with a clearindication for it, or in patients in whom one mightwant to start or continue aspirin while waiting for aCT scan but who could have an intracranialhaemorrhage. It is only possible to determine thetrue risk to benefit ratio from an RCT in whichpatients with intracranial haemorrhage wererandomly allocated to antithrombotic (oranticoagulant) treatment, for example for treatmentof DVT. Fortunately, DVT and PE seem to berelatively rare among patients with PICH, but thismakes the conduct of such a trial almost impossiblebecause it would take so long to accrue an adequatesample size.
However, it is of serious concern that antithromboticor anticoagulant drugs would increase the risk offurther bleeding in the brain, thus worseningoutcome. Meta-analyses of primary and secondaryprevention studies in ischaemic stroke, TIA orischaemic eye retinal symptoms, in patients withno prior history of intracerebral haemorrhage,have demonstrated a small but real increased riskof intracerebral haemorrhage in those givenaspirin48,129 or warfarin or heparin.311 Patientswho survive a prior intracranial haemorrhage to 1 month are also at increased risk of recurrentintracranial haemorrhage if they have anotherstroke.122 In a systematic review of studiesreporting recurrent stroke in survivors of PICH,the aggregate rate of all stroke was 4.3% (95% CI3.5 to 5.4%) per patient year (higher incommunity-based studies at 6.2% versus 4.0% in
Health Technology Assessment 2004; Vol. 8: No. 1
59
© Queen’s Printer and Controller of HMSO 2004. All rights reserved.
Chapter 4
Contribution of brain imaging to therapeutic decision-making in stroke

hospital studies); about three-quarters of recurrentstrokes were intracranial haemorrhage, anaggregate rate of 2.3% (95% CI 1.9 to 2.7%) perpatient year; the subsequent ischaemic stroke ratewas 1.1% (95% CI 0.8 to 1.7%) per patient year;and mortality was 8.8% (95% CI 5.2 to 11.0%) perpatient year. It is therefore likely that aspirin oranticoagulants would increase the risk of recurrentbleeding in those who have already had anintracranial bleed, particularly in the acute phase.It would, therefore, be helpful to know the effect
of antithrombotic drugs or anticoagulants onPICH in view of the occasional need to considertheir use to treat DVT, and to determine whetherit might be safe to use them before CT scanning inpatients with suspected ischaemic stroke (but whomay turn out to have a haemorrhagic stroke).
Although the primary analysis of the IST41 did notsuggest any increased risk of haemorrhage inthose who started aspirin before CT scanning(some of whom were found to have an intracranial
Contribution of brain imaging to therapeutic decision-making in stroke
60
TABLE 34 Observational studies of continuing antithrombotic treatment in patients with acute intracerebral haemorrhage
Study Year No. of Study type Bleed type Notespatients
Leker300 1998 4 Prospective ICH in PMV Warfarin reversed and all put on i.v. heparin, APTT 1.5.One patient had surgery for evacuation of haematoma,then heparin 36 h later
Boeer301 1991 68 Prospective ICH (including Heparin 5000 t.d.s. for DVT/PE prophylaxis starting on angioma and days 2, 4 and 10. Extra group added on to an earlier aneurysm) trial. No increased risk of further bleed
Butler186 1998 35 Retrospective ICH and All had AC reversed then 10/35 restarted on heparin; intraspinal only 2 had therapeutic levels, no information on haematomas in outcomePHV
Wijdicks302 1998 39 Retrospective SAH/SDH/ICH AC stopped following bleed. AC resumed at varying in PMV times (some < 3/7). ‘No haemorrhagic complication on
resumption of AC’
Chaves182 1996 17 Retrospective Cerebellar HI Notes pooled from Boston, Paris and Korea. All initialinfarct, 9 on AC (6 heparin, 3 warfarin), 8 continuedAC, no problems
Chamorro303 1995 5 Retrospective HI Looked at 171 infarcts who had heparin within 72 h. 5had HI, 1 showed increasing size on follow-up CT, butnone had clinical deterioration
Nakagawa304 1995 4 Retrospective ICH/SDH in From abstract: all had warfarin reversed, 3 given i.v. PMV heparin with no problems. One did not receive heparin
because of massive bleeding
Pessin305 1993 12 Retrospective HI Mentions then excludes 2 who died of massive ICHafter starting heparin for embolic stroke. AC notinterrupted in 8, no problems
Kapp306 1987 161 Retrospective SAH 3 groups who had adjusted-dose heparin either within48 h of surgery (104) or after developing ischaemicdeficit or not at all. Those with early heparin had fewerrebleeds and less ischaemia
Cerebral307 1984 30 Retrospective ICH/HI Of 30, 19 on AC. 16 stopped AC. 3 continued, no Embolism problemsStudy Group
Wang308 1995 1 Case report SAH Heparin given 13 days after event, no rebleeding
Brick309 1991 1 Case report HI in PMV Warfarin reversed, heparin started without bolus on day2, warfarin restarted day 8.
Rothrock310 1989 1 Case report HI 1/121 infarct had HI and given AC anyway (mild stroke),no problems
APTT, activated partial thromboplastin time; AC, anticoagulants; HI, haemorrhagic infarction; ICH, intracerebral haemorrhage;PHV, prosthetic heart valve; PMV, prosthetic mitral valve; SAH, subarachnoid haemorrhage; SDH, subdural haematoma.

haemorrhage when subsequently scanned), therewas little information in the original publication asto how much aspirin or heparin the patientsreceived, or how representative they were of thegenerality of strokes in the IST, and so what therisk of giving aspirin to acute PICH might actuallybe. It was also unclear whether there were otherstudies that might provide useful data to give amore robust estimate of the effect ofantithrombotic treatment on patients withintracranial haemorrhage. Therefore, to provide amore precise estimate of how much harm (if any)or benefit might be caused by the administrationof antithrombotic drugs or anticoagulants topatients with recent intracerebral haemorrhage, asystematic review of the available information onthis subject was undertaken.
MethodsObjectivesThe study aimed to determine the effect ofantithrombotic or anticoagulant treatment givento patients with definite intracranial haemorrhageon outcome, including deaths, recurrentintracranial haemorrhage and death ordependency.
Criteria for considering studies for thereview Types of studyThe authors sought to identify all reports ofrandomised trials (or observational studies with aconcurrent comparison group), both publishedand unpublished, comparing antiplatelet oranticoagulant therapy with control following recent(CT or MRI confirmed) intracranial haemorrhage.Single case reports and studies with no concurrentcomparison group were excluded (Table 34).
Types of participantPatients had acute CT- or MR-proven intracranialhaemorrhage, due to subarachnoid or acuteintraparenchymal cerebral haemorrhage (whichcould be either PICH or HTI, i.e. any form ofbleeding inside the cranial cavity).
Types of interventionAspirin or heparin (subcutaneous or intravenous)started within the acute period of the stroke (i.e.within the first few days) was compared withplacebo or control.
Types of outcome measureOutcome measures comprised deaths during thescheduled treatment period and at the end of
follow-up; recurrent intracranial haemorrhage,recurrent ischaemic stroke, DVT or pulmonaryembolus, and dependency, defined as a score of3–5 on the modified Rankin scale (6 being dead).312
Search strategy The electronic databases MEDLINE and EMBASEwere screened from January 1984 to April 2001.The Cochrane Controlled Trials Register (CCTR)was also searched, and reference lists in all articlesfound were consulted and cross-checked forfurther references. The extended electronic searchstrategy for stroke was used (Appendix 4),combined with medical subject headings:‘anticoagulant’, ‘anticoagulant agent’, ‘aspirin’,‘acetyl salicylic acid’, and text words ‘aspirin’ and‘acetyl salicylic acid’. The search was deliberatelykept broad so as to avoid missing any relevantstudies in this obscure area. The search went backno further than 1984 because before that year CTscanning to identify haemorrhagic stroke correctlywas not readily available.
Data extractionFrom the included studies, two reviewers,independently and blind to each other, sought andextracted data on the number and type of patientsin the study, the mode of randomisation, thenumber allocated to active or control treatment,the type and dose of drug used, the duration oftreatment (scheduled treatment period), thetiming of latest follow-up, early (during theschedule treatment period) and late (at the end offollow-up) mortality, recurrent intracranialhaemorrhage and recurrent ischaemic stroke, andfunctional outcome at the end of follow-up. Forrecurrent intracranial haemorrhage, theresearchers sought the method by which thehaemorrhage was identified, whether it wassymptomatic (i.e. temporally associated with aworsening of neurological status) and the timewhen it occurred (i.e. within the scheduledtreatment period or by the end of follow-up). Anydisagreements regarding data extraction wereresolved by discussion.
Additional individual patient dataHaving identified that there were very few relevantstudies in the literature, it was apparent that themajority of data would therefore come from the twolargest acute stroke trials: the IST (n = 19,435)41
and the CAST (n = 21,106),42 both of whichinvestigated the use of antithrombotic therapywithin 48 hours of acute stroke. In these trials,about 17% of patients were randomised within 6hours and 33% within 12 hours. Patients could berandomised before CT scanning if the clinical
Health Technology Assessment 2004; Vol. 8: No. 1
61
© Queen’s Printer and Controller of HMSO 2004. All rights reserved.

suspicion of acute intracerebral haemorrhage waslow and the CT scan was likely to be delayed. As aresult, a small proportion of patients who wererandomised without a CT scan and started thetrial treatment were found to have had an acuteintracerebral haemorrhage when scannedsubsequently (n = 773). These patients weredescribed as having ‘haemorrhagic stroke’ on thetrial data forms. Before analysing the individualpatient data, the researchers reviewed theindividual original IST record forms to extract anyadditional information on the nature or timing ofthe intracranial haemorrhage and the duration oftrial treatment (i.e. whether it was discontinuedearly or not). The IST was initiated andcoordinated from Edinburgh and the CAST fromthe Clinical Trials Service Unit in Oxford. The ISTdata were housed in Clinical Neurosciences andthe original data forms were therefore accessibledirectly. The CAST individual patient data, butnot the original forms, were made available to theauthors for this study.
AnalysesFirst, all trials were analysed together (i.e. inpatients with any intracranial haemorrhage), thena subgroup analysis was performed of thosepatients with intraparenchymal cerebralhaemorrhage. The effect of aspirin, heparin andother antiplatelet agents was examined at variousearly and late outcomes. Individual patient datawere used when available. RevMan75 software (asused in the Cochrane Database of SystematicReviews) was used to provide an estimate oftreatment effect, using the Peto odds ratio (OR),fixed effects method and 95% confidence limits.In view of the paucity of data, it did not seemappropriate to undertake further sensitivityanalyses or to attempt to give the studies a qualityscore. Rather, the study focused on ensuring thatrandomised studies genuinely used randomtreatment allocation, and on details of follow-upand outcome, to ensure a basic minimumstandard.
Details of the included trialsThe search strategy (Appendix 4) identified 2779papers on antithrombotic or anticoagulanttreatment or intracranial haemorrhage, but ofthese, only nine described a trial of antithromboticor anticoagulant treatment in patients withintracranial haemorrhage, and two describedretrospective observational studies with aconcurrent ‘control’ group. Of the nine trials(2043 patients) of antiplatelet drugs (1997
patients) or anticoagulants (645 patients) givenafter acute intracranial haemorrhage that wereidentified, including the IST and CAST42,313–319
(Tables 35 and 36), eight were randomisedtrials41,42,314–316,318–320 and one was a double-blind comparative study that gave noinformation on whether treatment allocation wasrandomised or not317. However, on balance, adecision was made to include it. An additionalpublication that added an extra group of patientsto a trial already included in the review316 wasexcluded.321
The intracranial haemorrhage was due to SAH insix trials (1224 patients),313–315,317–319 a mixture ofacute intraparenchymal cerebral haemorrhage andhaemorrhagic transformation of cerebralinfarction in two trials (773 patients)41,42 andproven PICH in one trial (46 patients).316 In twoof the SAH trials, the antiplatelet trial drugs weregiven after the aneurysms had been surgicallyclipped to prevent rebleeding;318,319 in one theantiplatelet trial drugs were definitely started beforeany clipping of the aneurysm;315 and in threetrials there was no indication as to whether theaneurysm had been securely treated beforestarting the antiplatelet trial drugs.313,314,317
The duration of the scheduled treatment periodranged from 8 days318 to 3 months,315 and threestudies did not clearly specify the duration oftreatment.313,314,316 The length of follow-up rangedfrom 1 month42,318 to 6 months,41,314 and onestudy did not specify the length of follow-up.316
The primary outcome was (Tables 35 and 36):
� death in four studies: within the scheduledtreatment period in two studies,41,42 within thefollow-up period of 6 months in one study314
and the period was not specified in one study316
� ‘neurological disability’ measured by GlasgowOutcome Score in two studies,315,318 theJapanese Coma Scale in one study317 andunspecified in two studies313,314
� functional outcome (i.e. Rankin or simplifiedequivalent) in three studies41,42,319 andpulmonary embolus and deep vein thrombosisin one study.316
Three studies (466 patients; two in SAH and onein intraparenchymal cerebral haemorrhage)systematically scanned patients at repeated timeintervals,313,316,317 but did not define whether anyrecurrent intracranial haemorrhage that occurredhad been identified by routine scanning or
Contribution of brain imaging to therapeutic decision-making in stroke
62

Health Technology Assessm
ent2004; Vol. 8: No. 1
63
© Q
ueen’s Printer and Controller of H
MSO
2004. All rights reserved.
TABLE 35 Characteristics of randomised trials of antithrombotic agents given after SAH primarily for the prevention of delayed ischaemic neurological deficit
Study Year No. of Intervention Methods Scheduled Duration of Primary Commentspatients treatment follow-up outcome
period (months)
(a) Trial treatment started before surgical treatment of the aneurysm
Shaw315 1985 677 Dipyridamole 100 mg p.o., Randomised open trial 3 months 3 Neurological Patients randomised immediately on or 10 mg i.v., o.d. disability admission, before investigations
(b) Uncertain whether aneurysms treated before start of trial treatment
Mendelow314 1982 53 Aspirin 300 mg p.o. b.d. or Randomised placebo- 3 days after 6 Death All patients received tranexamic acid placebo controlled trial admission Neurological p.o. or i.v.
until discharge disability
Ono313 1984 135 Ticlopidine 100 mg p.o. t.d.s. Randomised double-blind Not stated 3 Neurological No specific data on recurrent or placebo placebo-controlled trial disability haemorrhage although quoted ‘no
significant increase in haemorrhagiccomplications occurred’
Suzuki317 1989 285 OKY-046a 80 mg i.v. b.d., Multicentre double-blind 10–14 days 3 Neurological No information on method of 400 mg i.v. b.d., or placebo comparative study disability treatment allocation. Aspirin avoided
(Japan Coma during treatment scheduleScore)
(c) Trial treatment started after surgical treatment to prevent aneurysm rebleeding
Tokiyoshi318 1991 24 Cataclota,b 1 �g/kg/min vs Randomised trial, post- 8–14 days 1 Neurological No information on blindingplacebo aneurysm treatment disability
(GOS)
Hop319 2000 50 Acetylsalicylic acid (ASA) Randomised pilot trial, 21 days 4 Rankin Pilot study 100 mg p.r. vs placebo post-aneurysm treatment
a Thromboxane synthetase inhibitor.b Sodium (E)-3-[p-(1H-imidazol-1-ylmethyl) phenyl]-2-propenoate.GOS, Glasgow Outcome Score.

Contribution of brain imaging to therapeutic decision-m
aking in stroke
64
TABLE 36 Characteristics of randomised trials of antithrombotic agents given after haemorrhagic stroke or primary intracerebral haemorrhage
Study Year No. of Intervention Methods Scheduled Duration of Primary Commentspatients treatment follow-up outcome
period (months)
Dickmann316 1988 46 Heparin 5000 U s.c. t.d.s. vs Randomised, open trial in Not specified Not specified Death, DVT, Heparin given from day 4, control patients with intracerebral PE, rebleeding compared with control
haemorrhage. (heparin started day 10).
IST41 1997 599 Aspirin 300 mg p.o./p.r. heparin Randomised, open trial in 14 days 6 Death within Patients could be (12,500 U b.d. 25,000 U s.c.), patients with acute stroke; 14 days death randomised before CT both or neither blinded outcome assessment or dependency scanning if there was a low
at 6 months clinical suspicion ofintracerebral haemorrhage.Total trial size: 19,435patients
CAST42 1997 174 Aspirin 160 mg p.o. vs control Randomised placebo- Up to 4 weeks Until discharge Death or Same CT scanning policy as controlled trial in patients (average 4 dependency IST. Total trial size 21,106 with acute stroke weeks) at discharge patients

because of clinical deterioration. Only two studies(773 patients) documented that recurrentintracranial haemorrhage occurred during thescheduled treatment period.41,42 The remainingstudies did not specify whether recurrentintracranial haemorrhage occurred within thescheduled treatment period or by the end offollow-up. It was therefore assumed that anyrecurrent intracranial haemorrhages reported hadsimply occurred at some point within the periodof follow-up.
Additional individual patient dataThe IST and CAST randomised 40,541 patients,of whom 7758 (19%) first underwent CT scansafter randomisation. Of these patients, 773 (10%)were found to have an acute intracerebralhaemorrhage when scanned, of whom 398patients had been allocated to aspirin (375 tocontrol) and 310 to heparin (289 to control). Onreview of the 599 individual IST forms, someadditional information was gleaned in 136, but therest added no further information. The finaldiagnosis of the intracerebral haemorrhages wastherefore 58% PICH and 42% HTI. In general,these patients were older (68% were over 70 yearsof age) and had more severe strokes (30% weredrowsy or comatose, 31% had a TACS, and 44%had five or more neurological deficits) than wasthe average in the IST. The trial treatment wasstopped after the post-randomisation CT scan in65% of these patients who therefore only receiveda few doses of aspirin or heparin. In the CAST, the trial treatment was discontinued in 80% ofpatients found to have a haemorrhagic stroke. Itwas not possible to compare outcomes in thepatients who received only a few doses ofantithrombotic treatment with those who receivedmore antithrombotic treatment, because thesample size was too small and confidence intervalswere already too wide to provide reliableconclusions (see below). Therefore, all 773 patients were included in the present analysis. The effect of time to randomisation on treatment could not be examined for the samereasons.
Details of excluded studiesDetails of excluded studies are given in Table37.306,322 These studies were excluded becausethey were observational without a control group.Two observational studies that had a non-randomised but concurrent ‘control’ group wereconsidered to provide useful information and aredescribed at the end of the Results section. Thesestudies did not, however, contribute data to themeta-analysis.
ResultsEffect of antiplatelet treatment onoutcome after acute intracranialhaemorrhage (i.e. subarachnoid orintraparenchymal cerebralhaemorrhage) and afterintraparenchymal cerebralhaemorrhage aloneAll recorded deathsIn patients with any acute intracranialhaemorrhage (1997 patients), the OR for deathamong patients allocated to antiplatelet treatmentcompared with control was 0.85 (95% CI 0.63 to1.15) (Figure 5).
In patients with just intraparenchymal cerebralhaemorrhage (773 patients), the OR for deathamong patients allocated to antiplatelet treatmentcompared with control was 0.96 (95% CI 0.62 to1.50) (Figure 5).
Recurrent intracranial haemorrhageIn patients with any acute intracranialhaemorrhage, the OR for recurrent intracranialhaemorrhage among patients allocatedantiplatelet treatment compared with control was1.00 (95% CI 0.73 to 1.37) (Figure 6).
In patients with just intraparenchymal cerebralhaemorrhage (773 patients), the OR for recurrentintracranial haemorrhage among patientsallocated to antiplatelet treatment compared withcontrol was 1.02 (95% CI 0.58 to 1.8).
Functional outcomeData on functional outcome at 6 months were onlyavailable from the IST41 (599 patients). Althoughdata on functional outcome were collected in theCAST,42 this was only at 1 month and thereforewas regarded as being too short term. The OR forbeing dead or dependent among patients withintracranial parenchymal haemorrhage allocatedto antiplatelet treatment compared with controlwas 0.68 (95% CI 0.46 to 1.02). However, 65% ofpatients allocated to aspirin treatment received nomore than a few doses of aspirin, so this does notreflect the effect of full-dose aspirin. In any case,42% were considered to be HTI, in which caseaspirin may have had some beneficial effect.
Effect of anticoagulant treatment onoutcome after acute intraparenchymalcerebral haemorrhage There were no data on the use of anticoagulantsafter SAH.
Health Technology Assessment 2004; Vol. 8: No. 1
65
© Queen’s Printer and Controller of HMSO 2004. All rights reserved.

All recorded deathsIn patients with any acute intraparenchymalcerebral haemorrhage (645 patients), comparingthose allocated to heparin with control, the OR fordeath in the scheduled treatment period was 0.96(95% CI 0.38 to 2.40) (Figure 7). For the 599/645patients from the IST included in this analysis, theheparin was stopped after a few doses in 65% ondiscovering the intracranial haemorrhage.
Recurrent intracranial haemorrhageIn patients with acute intraparenchymal cerebralhaemorrhage, the OR for recurrent intracranialhaemorrhage among patients allocated heparincompared with control was 2.0 (95% CI 0.86 to4.70) (Figure 8).
Functional outcomeIn patients with acute intraparenchymal cerebral
Contribution of brain imaging to therapeutic decision-making in stroke
66
TABLE 37 Non-randomised studies
Study Year No. of Methods Commentspatients
Kapp306 1987 161 Retrospective observational study in patients Recurrent intracranial haemorrhage: with SAH undergoing gradual carotid ligation. prophylactic heparin or heparin after
115 had heparin (2500 –3500 U, dose deficit 11/115 (9.6%), no heparin 12/46
adjusted), 46 had no heparin (26%)
Juvela322 1995 291 Observational study on retrospective use of aspirin and NSAIDs before or after SAH
62 had taken aspirin before or within 7 days of SAH, 144 had no aspirin/NSAIDs (control)
Aspirin No aspirin(n = 62) (n = 144)
Death in 18% 23%study periodRecurrent 19% 31%haemorrhage
Study
Subarachnoid haemorrhageHop319
Mendelow314
Ono313
Shaw315
Tokiyoshi318
Subtotal (95% CI)χ2 = 2.45 (df = 4), p = 0.78; Z = –1.29, p = 0.2
Haemorrhagic strokeCAST42
IST41
Subtotal (95% CI)χ2 = 1.29 (df = 1), p = 0.52; Z = –0.18, p = 0.9
Total (95% CI)χ2 = 4.29 (df = 6), p = 0.75; Z = –1.07, p = 0.3
Treatmentn/N
Controln/N
Peto OR(95% CI fixed)
Weight(%)
Peto OR(95% CI fixed)
1/245/273/65
36/336 1/13
46/465
3/90 42/30845/398
91/863
2/26 5/26 9/68
41/341 2/11
59/472
6/84 38/291 44/375
103/847
1.7 4.8 6.4 39.9 1.6 54.5
5.0 40.5 45.5
100.0
0.54 (0.05 to 5.47)0.96 (0.24 to 3.74)0.35 (0.11 to 1.15)0.88 (0.55 to 1.41)0.40 (0.04 to 4.30)0.77 (0.51 to 1.15)
0.46 (0.12 to 1.76)1.05 (0.66 to 1.68)0.96 (0.62 to 1.50)
0.85 (0.63 to 1.14)
10510.20.1Favours treatment Favours control
FIGURE 5 Effect of antiplatelet treatment on death in patients with recent intracranial haemorrhage: systematic review ofrandomised trials comparing antiplatelet agent with control in patients with recent SAH or intracerebral haemorrhage. Treatment:patients allocated to antiplatelets; Control: patients allocated control; n: number of patients with event; N: number of patientsallocated to that treatment; Peto OR: odds ratio calculated using the Peto method; Weight: proportion of the total amount ofinformation in the whole review attributable to this study; 95% CI (fixed): 95% confidence intervals using a fixed effects model.
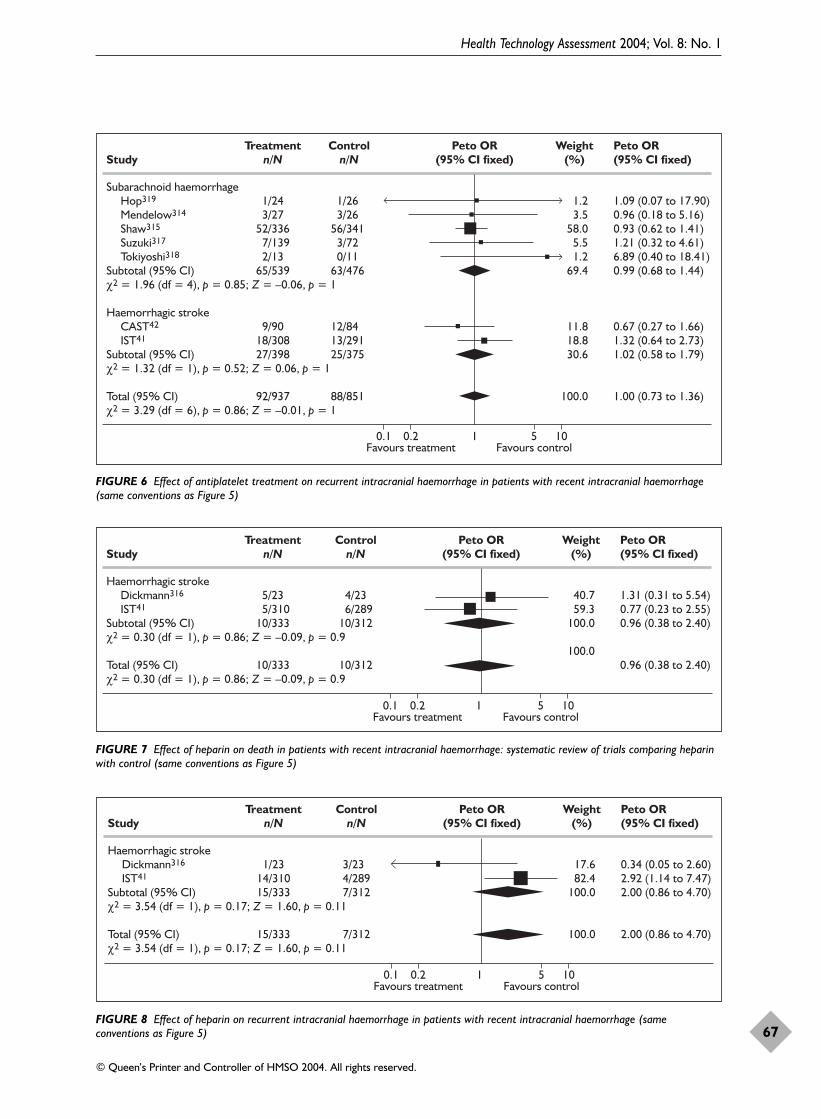
Health Technology Assessment 2004; Vol. 8: No. 1
67
© Queen’s Printer and Controller of HMSO 2004. All rights reserved.
Study
Subarachnoid haemorrhageHop319
Mendelow314
Shaw315
Suzuki317
Tokiyoshi318
Subtotal (95% CI)χ2 = 1.96 (df = 4), p = 0.85; Z = –0.06, p = 1
Haemorrhagic strokeCAST42
IST41
Subtotal (95% CI)χ2 = 1.32 (df = 1), p = 0.52; Z = 0.06, p = 1
Total (95% CI)χ2 = 3.29 (df = 6), p = 0.86; Z = –0.01, p = 1
Treatmentn/N
Controln/N
Peto OR(95% CI fixed)
Weight(%)
Peto OR(95% CI fixed)
1/243/27
52/336 7/139 2/13 65/539
9/90 18/30827/398
92/937
1/26 3/26
56/341 3/72 0/11
63/476
12/84 13/291 25/375
88/851
1.2 3.5 58.0 5.5 1.2 69.4
11.8 18.8 30.6
100.0
1.09 (0.07 to 17.90)0.96 (0.18 to 5.16)0.93 (0.62 to 1.41)1.21 (0.32 to 4.61)6.89 (0.40 to 18.41)0.99 (0.68 to 1.44)
0.67 (0.27 to 1.66)1.32 (0.64 to 2.73)1.02 (0.58 to 1.79)
1.00 (0.73 to 1.36)
10510.20.1Favours treatment Favours control
FIGURE 6 Effect of antiplatelet treatment on recurrent intracranial haemorrhage in patients with recent intracranial haemorrhage(same conventions as Figure 5)
Study
Haemorrhagic strokeDickmann316
IST41
Subtotal (95% CI)χ2 = 0.30 (df = 1), p = 0.86; Z = –0.09, p = 0.9
Total (95% CI)χ2 = 0.30 (df = 1), p = 0.86; Z = –0.09, p = 0.9
Treatmentn/N
Controln/N
Peto OR(95% CI fixed)
Weight(%)
Peto OR(95% CI fixed)
5/23 5/31010/333
10/333
4/23 6/28910/312
10/312
40.7 59.3100.0
100.0
1.31 (0.31 to 5.54)0.77 (0.23 to 2.55)0.96 (0.38 to 2.40)
0.96 (0.38 to 2.40)
10510.20.1Favours treatment Favours control
FIGURE 7 Effect of heparin on death in patients with recent intracranial haemorrhage: systematic review of trials comparing heparinwith control (same conventions as Figure 5)
Study
Haemorrhagic strokeDickmann316
IST41
Subtotal (95% CI)χ2 = 3.54 (df = 1), p = 0.17; Z = 1.60, p = 0.11
Total (95% CI)χ2 = 3.54 (df = 1), p = 0.17; Z = 1.60, p = 0.11
Treatmentn/N
Controln/N
Peto OR(95% CI fixed)
Weight(%)
Peto OR(95% CI fixed)
1/23 14/31015/333
15/333
3/23 4/2897/312
7/312
17.6 82.4100.0
100.0
0.34 (0.05 to 2.60)2.92 (1.14 to 7.47)2.00 (0.86 to 4.70)
2.00 (0.86 to 4.70)
10510.20.1Favours treatment Favours control
FIGURE 8 Effect of heparin on recurrent intracranial haemorrhage in patients with recent intracranial haemorrhage (sameconventions as Figure 5)

haemorrhage, data were available only from theIST for functional outcome at 6 months (n = 599).41
The OR for being dead or dependent amongpatients allocated heparin compared with controlwas 0.97 (95% CI 0.66 to 1.43).
Effect of antithrombotic treatment onDVT and PEThere were no data on the use of antiplateletagents or anticoagulants to treat DVT or PE. Onetrial examined the effect of subcutaneous heparinin the prevention of DVT and PE afterintraparenchymal cerebral haemorrhage.316
However, it was not clear that the trial was trulyrandomised (see earlier results) and it onlyincluded 46 patients. There were eight DVTs andfive PEs in the heparin-allocated patients,compared with ten DVTs and nine PEs in thecontrol patients (p = not significant), Nine patientsdied, five in the heparin-treated group and four inthe controls. The effects of aspirin and heparin inpreventing DVT or PE in the IST and CAST havebeen reported previously in the main trialpublications. There was no evidence that aspirin orheparin performed differently in the prevention ofDVT/PE in patients with intraparenchymal cerebralhaemorrhage as opposed to ischaemic stroke.
There were no data from randomised trials on theuse of intravenous heparin to treat DVT/PE afterintracranial haemorrhage. The trials in patientswith SAH did not report the occurrence of DVT/PE.
Data from observational studiesTwo observational studies were also identified(Table 37), both concerning patients with SAH.One retrospectively examined the effect of heparingiven during surgery if a neurological deficitoccurred, or after surgery as prophylaxis, comparedwith patients with SAH who were not givenheparin.306 In this study, there were fewer patientswith recurrent haemorrhage in the group treatedwith heparin (9.6% versus 26.1% for controls). Thestudy by Juvela retrospectively assessed the use ofaspirin or other non-steroidal anti-inflammatorydrugs (NSAIDs) before and after SAH.322 Since theprimary mode of action of NSAIDs is notantiplatelet, analyses were restricted to the aspirinand no-aspirin groups. There were fewer deathsand fewer recurrent haemorrhages among patientsreceiving aspirin than among controls.
DiscussionThis review summarises the totality of theevidence from randomised trials, or studies with a
comparative control group, on antithrombotic oranticoagulant drugs administered (for whateverreason) after acute intracranial haemorrhage.
For antiplatelet drugs, the point estimates of effecton death and recurrent intracranial haemorrhagefor patients with any intracranial haemorrhage areneutral or favourable. The estimate of treatmenteffect is less favourable if just patients withintraparenchymal cerebral haemorrhage areexamined (the group relevant to haemorrhagicstroke). The wide confidence intervals cannot ruleout modest harm, but equally they are alsoconsistent with moderate benefit. The low risk offurther intracranial bleeding in patients withintracranial haemorrhage given aspirin isconsistent with the low intracerebral bleeding riskwith these agents observed in other settings,although the fact that 65%–80% of patientsdiscontinued treatment after only a few doses isvery important. Thus, in certain situations, the useof an antiplatelet agent soon after acuteintracranial haemorrhage would perhaps bejustified if the patient were at particularly highrisk of cardiac ischaemic events, as a result of arecent MI or had a history of unstable angina.48
The data do not allow us to answer the questionabout the use of antithrombotic drugs in patientswith a new ischaemic cerebral event who have hada known intracranial haemorrhage at some pointin the more remote past, or about the long-termeffects in patients with recent intracranialhaemorrhage if required for prevention ortreatment of some other vascular complication.
Almost all of the data (94%) on the effects ofheparin in acute intraparenchymal cerebralhaemorrhage come from the IST. These were ahighly selected group of patients in that it wasonly possible to randomise patients into the ISTbefore CT scanning if the local investigator feltthat the stroke was unlikely to be haemorrhagic onclinical grounds (these would generally be mildstrokes). Of 7758 patients randomised before CT,only 773 (10%) turned out to haveintraparenchymal cerebral haemorrhage on CT.Thus, this group of patients is not likely to berepresentative of intracranial haemorrhage ingeneral and conclusions must be drawn with greatcaution. In fact, in the IST, about one-third of thepatients randomised without CT were drowsy andhad a severe stroke. There are severalinterpretations of this pattern of behaviour amongrandomising doctors, but one possibility is thatthey regarded aspirin and heparin as benigndrugs that were unlikely to harm patients withintracerebral haemorrhage.
Contribution of brain imaging to therapeutic decision-making in stroke
68

What are the limitations of these data?The data are scant and have limitations. Sixty percent of the data on antiplatelet agents came frompatients with SAH rather than intracerebral (i.e.brain parenchymal) haemorrhage, and at leastsome (it is not clear from the papers how many) ofthose patients had received definitive treatment oftheir aneurysm to prevent rebleeding beforestarting the antiplatelet trial treatment. The SAHdata are of very limited relevance to patients withprimary intraparenchymal cerebral haemorrhage.The patients with SAH are usually younger, withless co-morbidity, and the antithrombotictreatment was in general given to preventischaemic neurological deficit.
For the data on patients with intraparenchymalcerebral haemorrhage, the extent to whichconclusions may be drawn on the safety ofantithrombotic treatment are limited by the factthat in the majority (65% IST, 80% CAST), theaspirin or heparin was discontinued after only afew doses upon the discovery that the stroke washaemorrhagic. Therefore, the data do not describea situation where full-dose aspirin (or heparin) wasgiven to patients with intraparenchymal cerebralhaemorrhage for 2 weeks in the acute stage. Nordo they describe the effect of administeringantithrombotic treatment indefinitely, as mighthappen in error if a stroke was thought to beischaemic (either in the absence of scanning, orscanning too late to discriminate infarct fromhaemorrhage).
The risks associated with heparin were onlyassessed for subcutaneous, not intravenous heparin,and only in patients with intraparenchymalcerebral haemorrhage. While the lack of effect ofheparin on deaths from all causes was reassuring,the non-significant trend to a doubling of the riskof recurrent intracranial haemorrhage withheparin is a concern. Yet, patients withintracranial haemorrhage do develop indicationsfor the use of heparin, such as symptomatic DVT.It would be useful to know precisely the balance ofrisk and benefit of giving heparin, and whetherthe reductions in venous thromboembolism areoffset by an increase in intracranial haemorrhage.Given the uncertainties about the safety ofheparin, it seems reasonable to encourage the useof other methods of DVT prevention (such as earlymobilisation and graded compression stockings) toavoid the need for prophylactic low-dose heparinuntil further data from randomised trials areavailable. No trial has yet examined the effect ofanticoagulants as a treatment for established DVTfollowing acute intraparenchymal cerebral
haemorrhage, and such a trial would be difficult todo as, fortunately, DVT after intracerebralhaemorrhage is unusual. There is good evidencethat the risk of intracerebral haemorrhage withheparin is dose related.323 The risk of intravenousheparin is easier to justify if the risk of fatal PE ishigh (e.g. if the patient has DVT extendingproximally or there is already clinically apparentPE). Where the risk of intracranial bleeding withheparin is considered too high in relation to therisk of thromboembolism, the placement of aninferior vena caval filter may be an option, buteven this has drawbacks.324 Decision-making aboutthe balance of risk and benefit in patients withrecent haemorrhage and symptomatic DVT or PEwill therefore continue to be difficult.
Do these data aid scanning policy?These data support the policy, in centres whereCT resources are limited, as in parts of thedeveloping world, of ‘start aspirin pending CT ifacute intracerebral haemorrhage is unlikely onclinical grounds’ and ‘stop the aspirin if thepatient turns out to have a haemorrhage whenscanned’, provided the CT scan is obtained withina day or so of starting treatment. The value ofaspirin where CT scanning is not performed until5–7 days later (or more), or not at all, is notassessed by these data. A policy of widespread useof aspirin without prior imaging – a suboptimalpolicy – in places where CT scanning is available isnot supported by these data. In places where CTscanning is not available at all, widespread use ofaspirin among patients with a high probability ofhaving an ischaemic stroke (e.g. selected with aclinical scoring system such as the Siriraj score30)may well be reasonable, as the population benefitsof aspirin outweigh the risks. However, such apolicy would require further testing and these datacertainly provide no more than modest supportfor such an approach.
ConclusionsThe data on the effects of aspirin given to patients with acute intracerebral parenchymalhaemorrhage are insufficient to provide more than cautious guidance on patient management.This aspect of stroke management has beenoverlooked. However, it is likely that occasionalpatients with acute intracerebral haemorrhage will need antithrombotic treatment, that scanning will not always be immediately availableeven in well-resourced health services, and thatintracerebral haemorrhage as a cause of stroke has been under-recognised (especially as a
Health Technology Assessment 2004; Vol. 8: No. 1
69
© Queen’s Printer and Controller of HMSO 2004. All rights reserved.

cause of mild stroke). Therefore, there is a need to make the best use of the data available atpresent to guide management, and to obtain datain future studies to inform these areas ofuncertainty.
Implications for healthcareAspirin and heparin should be avoided in patientswith known acute intracerebral haemorrhage untilfurther data are available better to define thebalance of risk and benefit of antithrombotictreatment (for whatever reason).
There are numerous anecdotal reports of patientswith intracranial haemorrhage and venousthrombosis and/or pulmonary embolism receivinganticoagulant treatment and not deterioratingneurologically, but it must be emphasised thatthere are no randomised comparisons oftreatments in this difficult clinical situation, andthe literature on anecdotal case reports may beextremely biased.
Where CT scanning resources are scarce, a policyof ‘start aspirin pending the CT scan, butdiscontinue it immediately should the CT show ahaemorrhage’ is unlikely to be harmful as long asthe patient is thought unlikely to have had a
haemorrhagic stroke on clinical grounds using ascoring system, and the wait for the CT is unlikelyto be more than a day or so.
Where CT scanning is available, it would ingeneral be advisable not to commence aspirin foracute stroke until after the CT has excludedintracranial haemorrhage. However, the absenceof a time-dependent gradient of treatment effectfor aspirin within the first 48 hours after strokesuggests that scanning outside normal workinghours would not normally be justified in patientswho arrive at hospital in the evening if the CT canbe done the following morning and then aspirinstarted.
Implications for further researchFurther research is required to determine, inpatients with a past history of definite intracranialhaemorrhage, the risks and benefits of aspirin,heparin and warfarin given for:
� secondary prevention of a further cerebral,myocardial or peripheral vascular ischaemicevent
� primary or secondary prevention of cerebralinfarct in patients with atrial fibrillation
� treatment of symptomatic DVT and/or PE.
Contribution of brain imaging to therapeutic decision-making in stroke
70

Systematic review of previousstudies of the cost-effectivenessof CT in strokeThe purpose of this systematic review was todetermine what work had been done previously onthe cost-effectiveness of CT scanning for stroke. Inparticular, the aim was to ascertain where newinformation was needed and what approaches hadbeen used in the past. If indeed previous studieshad shown CT to be cost-effective in stroke, thenwhy the continuing controversy over provision ofCT services for stroke?
Search strategyA two-step process was used to identify economicevaluations of CT scanning for the diagnosis ofstroke in the published literature. First, anelectronic search of the literature was undertakenbetween 1986 and September 2001 using a seriesof databases including MEDLINE, EMBASE,Social Science Citation Index, Science CitationIndex, NHS Economic Evaluation Database(NEED), DARE, Cochrane Library and the HTAdatabase. A combination of MeSH headings andfree text terms was used to conduct the search.Full details of the MEDLINE search are containedin Appendix 5. The syntax and search terms inthe MEDLINE search were modified for therequirements of the other databases. A broadsearch was undertaken to maximise the number ofrelevant references identified for consideration forinclusion in the review. This search wassupplemented with a handsearch of previoussystematic reviews of the cost-effectiveness ofstroke diagnosis and treatment of stroke.
Inclusion and exclusion criteriaTo select the highest quality evidence in this area,inclusion and exclusion criteria were developed.Studies that met the following criteria wereincluded:
� full economic evaluations
� evaluating diagnostic strategies involving CTscanning for stroke patients
� published in English (resources were notavailable for translation)
� published in peer-reviewed journals.
It was acknowledged that while partial economicevaluations can provide important information onthe costs and consequences of healthcareinterventions, they do not address the question ofefficiency and therefore were excluded from thereview.325 Only studies that met all the inclusioncriteria were included.
Study selection processThe references identified in the electronic searchwere initially screened on the basis of the titlesand abstracts of articles by one reviewer (JS). Thereferences from the electronic search, togetherwith those from the handsearch, were thenexamined on the basis of the titles and abstracts ofarticles by two reviewers (JS and JC). Fullmanuscripts of potentially relevant references fromthe electronic search were obtained. Finaldecisions regarding inclusion and exclusion weremade on the basis of the full manuscript (JS).
ResultsThe electronic search identified 531 references(excluding replicate references). The initialscreening identified 82 potential studiesevaluating the cost-effectiveness of CT scanningfor the diagnosis of stroke. Of these, 127 wereidentified from MEDLINE, 111 from EMBASE,241 from the Social Science Citation Index andScience Citation Index, nine from the CochraneDatabase, and 43 from the DARE, NEED andHTA databases.
Two prior systematic reviews were also identified.The first, undertaken by Holloway and co-workersin 1999, examined the cost-effectiveness of arange of diagnostic, preventive or therapeuticinterventions for stroke, and included studies that
Health Technology Assessment 2004; Vol. 8: No. 1
71
© Queen’s Printer and Controller of HMSO 2004. All rights reserved.
Chapter 5
Cost-effectiveness of CT in stroke: a systematicreview of the available evidence, detailed costings and decision modelling analysis

were full economic evaluations in which benefitswere measured in quality-adjusted life years(QALYs).20 This study identified 26 economicevaluations of a range of stroke-related screeningand treatment interventions, but no studiesevaluating CT scanning for stroke.
The second systematic review, by Evers and co-workers in 2000, examined the status and qualityof economic evaluations conducted in the area ofcerebrovascular disease.326 This review differedfrom the previous review as it only included fulleconomic evaluations in the field of strokeresearch using data obtained from randomisedtrials, and included studies where benefits wereassessed using measures other than QALYs. Thepurpose of the review was to examinesystematically the methodological quality of theepidemiology and the economics of economicevaluations conducted in this area. This studyidentified a total of 23 economic evaluations thatsatisfied the inclusion criteria, of which threestudies evaluated the cost-effectiveness of CTscanning for stroke.327–329
Therefore, 85 references (82 from the electronicliterature search and three from the handsearch ofprevious reviews) were assessed for the presentsystematic review and full manuscripts wereobtained for all 17 potential economic evaluations.Each manuscript was read and three were eachconsidered to satisfy the inclusion criteria.
Economic evaluations of CT scanningfor the diagnosis of strokeThe three studies that satisfied the inclusioncriteria are summarised below.
Larson and colleagues evaluated CT scanning forpatients with cerebrovascular disease as part of anassessment of the costs of diagnostic procedures,speed of work-up, institution of therapy, LOS inhospital, discharge diagnosis and follow-upplans.328 Three groups of patients were compared,one before the installation of an EMI CT 1000 CTscanner and two groups after the CT scanner hadbeen installed (total n = 157) in a general/referralhospital in the USA. The costs of procedures andLOS were estimated on the basis of 1976 billingcharges in US dollars. There were no differencesin LOS, speed of diagnostic work-up, treatmentand discharge plans between the groups. Theintroduction of CT scanning, however, resulted inmore specific discharge diagnoses, a reduction inthe frequency of lumbar puncture and radioisotopebrain scans, and an increase in the level ofaggregate charges for diagnostic procedures.
While this study satisfied the inclusion criteria forthe present review, the results of the study are oflimited use given advances in treatment for strokesince 1974 and CT scanning technology. There isalso concern regarding the costs, which were basedon charges that are unlikely to reflect the trueopportunity cost of resource use.325
Britton and co-workers compared a range ofdiagnostic procedures for suspected stroke withCT scanning (or routine autopsy whereappropriate) among 419 consecutive patientsadmitted to a stroke unit in Sweden between 1976and 1979.329 These procedures included: bedsidemethods; cerebrospinal fluid analysis, radioisotopescanning and CT scanning. The diagnostic validityof each strategy was assessed and costs werecompared. The costs were expressed in terms of1984 US dollars, but the methods used to estimatethe costs were not reported. Results wereexpressed in terms of the rate of correct diagnosisachieved with each strategy. This study indicatedthat the most cost-effective strategy would be touse CT scanning as the sole method ofinvestigation.
More recently, van der Meulen and co-workerscompared costs and outcomes associated with CTscanning and secondary prevention withantiplatelet treatment after stroke using decisionanalysis.330 Within this study a ‘quality weight’ wasdeveloped using decision analysis and publishedevidence on the excess risk of vascular events inthe first 2 years after stroke compared with anoptimal strategy (CT brain scan all patients andgive aspirin for cerebral infarction). Secondly,these weights were applied in a follow-up study of738 stroke patients aged over 45 years, and thedata extrapolated to the whole of TheNetherlands using 1991 hospital dischargestatistics. No details were provided on the methodsused to estimate the costs. The results wereexpressed as the national impact of the strategy.The investigators found that only 6% of patientshad not had a CT scan anyway, and only 14% ofeligible patients did not receive aspirin at hospitaldischarge, and therefore only a further 74 eventsper annum might be prevented by improvingcurrent practice. This would be equivalent to a 3%reduction in new vascular events in the first 2years after stroke, at a total additional cost of 0.2%(250 million Dutch guilders) of the total annualhospital cost for acute stroke in The Netherlands.
SummaryThis systematic review, undertaken to assess theevidence available in the published literature on
Cost-effectiveness of CT in stroke
72

the cost-effectiveness of CT scanning for acutestroke, found that there was very little evidenceregarding the cost-effectiveness of CT scanning forstroke. Only three studies met the entry criteria,but none determined the impact of CT on cost ofstroke, or examined in any detail the effect offailing to diagnose intracranial haemorrhage,tumours or infection. It is therefore not possible to draw any conclusions from this reviewabout the cost-effectiveness of CT scanning forstroke.
Several points about the studies identified in thisreview are worthy of note. First, none of thestudies reported the methods used to estimatecosts. The costs in one study were based onhospital billing charges328 (which is not consideredgood practice for economic evaluations), and theremaining studies reported very little if anycosting methodology.329,330 Secondly, two of thestudies were of limited relevance owing tosubsequent advances in treatment and preventionof stroke and in CT technology.329,330 In addition, both of these latter studies were really asking whether CT could replace otherdiagnostic methods available and in commonusage around the time that CT was introduced,and did not actually model the impact on cost and health.
The electronic search may have overlooked somestudies. However, a broad search strategy was usedand previous systematic reviews in the area onlyidentified a few papers, so this is consideredunlikely. Therefore, one conclusion of this reviewis that there is very little evidence on the cost-effectiveness of CT scanning for stroke.
Only full economic evaluations were considered,so cost analyses were excluded from the review.This decision was made because only fulleconomic evaluations are able to address questionsof efficiency and so provide the most valuablefindings. It could be argued that cost analyses canprovide information about efficiency if it isassumed that the cheaper option is also likely tobe the better one, and therefore an interventionthat saves resources is more likely to be cost-effective. While this may be true, it can be stronglyargued that available resources should be allocatedto those interventions that are known to be botheffective and cost-effective. However, in the case ofCT in stroke, as there is no other way apart fromscanning to diagnose the cause of stroke reliably,and as all treatments are diagnosis specific, itwould be morally and ethically indefensible not toCT scan stroke patients. Therefore, although
doing a scan obviously costs more than not doinga scan (in terms of scan costs) it may actually costmore not to scan if inappropriate treatmentdecisions result in increased dependency and LOSin hospital.
Although not full economic evaluations there werea number of studies of potential relevance.Gleason et al. considered the cost savings in theUSA which would result from the implementationof a CT angiography–CT perfusion protocol.331
While they did not include clinical outcomes, themain mechanism of incurring additional scanningcost in order to reduce length of inpatient stay wassimilar to that in the current study. Heller et al., incontrast, compared different CT scanningstrategies in their paper but only considered deathand dependency at 6 months and not the resourceimplications of the different strategies.332 Finally,Grieve et al. developed a method for costing themanagement of stroke and applied it to 13 centresin 11 European countries.333 The UK sample was,however, small and the level at which data werereported was too aggregate for useful comparisonwith the current study.
None of three economic evaluations identified wasundertaken in the UK. Cerebrovascular disease isa major concern in the UK. It is thereforeimportant to determine the cost-effectiveness of avariety of ways of using CT scanning for stroke toensure that resources are used efficiently tooptimise outcome after stroke.
Development of the cost-effectiveness model and decisiontree, including devising a menu ofrepresentative scanningstrategiesThis section describes the model developed toexamine the effect of CT scanning of strokepatients in terms of costs and patient outcomes,then outlines the challenges faced in thedevelopment of the model and discusses theoptions that were available to resolve them.
How could the cost-effectiveness ofone component (imaging) in themanagement of a complex diseasesuch as stroke be assessed? The assessment of cost-effectiveness of diagnostictests is inherently more difficult than assessmentsof therapeutic interventions. The difficulties stemfrom uncertainty about the relation between the
Health Technology Assessment 2004; Vol. 8: No. 1
73
© Queen’s Printer and Controller of HMSO 2004. All rights reserved.
diagnosis and the end results (outcomes) of care.70
However, a diagnostic test is usually a crucial firststep in establishing the diagnosis, and it maysubstantially influence the choice of treatment.The degree to which a particular test influencesoutcome (and cost) will depend on the clinicalcontext and the current level of service provisionof that test.
One way to assess the effectiveness or cost-effectiveness of an intervention is to conduct anRCT comparing costs and outcomes among thosewho do and do not receive the diagnostic tests.There were two main reasons why an RCT was nota feasible approach to assessing CT scanning instroke. First, it was estimated that to conduct anRCT with sufficient power to detect a clinicallyimportant difference in death or recurrent stroke,the study would require a sample of more than40,000 patients. Secondly, it would now beconsidered unethical to randomise patients towhether or not they should have a CT beforestarting antiplatelet therapy.41–43,334
Therefore, modelling techniques were used toestimate the expected benefits and costs associatedwith different CT scanning policies. The modelspecifies parameters at each decision point in thecare of the patient using available evidence fromsystematic reviews wherever possible. Thisapproach involves developing a decision tree,incorporating key decisions and the probability ofdifferent events that can occur over time. Themore detailed the model (and hence the moreclosely it reflects real life) and the more evidence(rather than assumptions) it contains, the morelikely it will be to provide information relevant tocurrent practice. The model provides estimates ofthe impact of different CT scanning strategies ontreatment decisions and the consequent effects oncosts and health outcomes. This enables not onlythe effect of each strategy on clinical outcome butalso the relative cost-effectiveness of each of thescanning strategies to be assessed and thestrategies to be ranked to identify, in this case,what is the best imaging strategy for stroke.
What type of model was appropriate?The cost-effectiveness of a range of routine CTimaging strategies was examined using adeterministic model and a conventional approachto decision analysis. Data were gathered for thesystematic reviews of imaging, clinical evaluationand treatment in Chapters 2–4, then the modelwas developed. The clinical and radiologicalexpert authors were therefore able to identifyareas where data were either unavailable or
inconclusive. Thus, given the limitations of thedata and the complex nature of the clinicalscenario, it was constructed appropriate to use asimple, custom-designed model, rather than tobuild a conventional Markov model.
Identification of typical imagingstrategies for strokeDiscussion among the clinical authors (aneuroradiologist, a stroke physician and aneurologist) and the health economists focused onthe information required in order to evaluatescanning policies and led to the identification of 12different strategies for CT scanning in acute stroke.These were drawn up by the expert authors fromtheir own experience and from published studieson stroke research, audit and clinical practice inthe UK. The resulting strategies had to besufficiently different to each other to be useful, andhad to reflect the fact that certain patients mighthave priority if CT resources were limited. Afurther constraint was that data should be availablefor most of the decision points (Table 38). Thestrategies were intended to reflect, broadly, thetypical patterns of use of CT in different sorts ofhospital with varying degrees of access to CT forstroke. At best, CT would be available immediatelyon site, and at worst only available at anotherhospital after a considerable delay. However, thedifferent strategies were also designed so that theywould still be relevant over the next 5 years ormore. For example, rt-PA, or some otherhyperacute treatment requiring CT before use,might be licensed in future for use within 3 hoursof stroke, placing new pressure on CT services andleading to altered requirements and costs.
There were four main types of CT scanningstrategy. The first strategy (S1) was a broad policyrequiring all patients admitted to hospitalsuspected of having suffered an acute stroke to bescanned immediately on arrival. Strategies S2–S9involved scanning only selected patients, selectingpatients on a number of patient-based criteria andthen applying a deadline by which time all eligiblepatients were to be scanned. The criteria includedseverity of the stroke, ‘high-risk’ patients in moreurgent need of an immediate managementdecision (e.g. patients on anticoagulants at thetime of the stroke, who might require reversal ofthe anticoagulation if the stroke were due to ahaemorrhage) or candidates for hyperacutetherapies such as thrombolysis.130 Althoughthrombolytic therapy was not licensed in the UKat the start of this project (it is now), tPA islicensed in the USA, Canada and Germany, andsome centres in the UK administer it to selected
Cost-effectiveness of CT in stroke
74

patients within 3 hours of stroke. Scanningstrategies S10 and S11 involved scanning selectgroups of patients within 7 days of admission tohospital. In the final strategy (S12), patientssuspected of having suffered a stroke would not bescanned at all, and treatment was with aspirinbased on clinical diagnosis alone.
Two major national guidelines for stroke in theUK were published during the project: the SIGN50
and the RCPE.62 A further SIGN guideline on theuse of antithrombotic treatment guideline was alsorelevant.335 Both stroke guidelines were for theassessment, investigation, immediate managementand secondary prevention of stroke. Bothguidelines used the results of the IST and CASTwhich showed that aspirin commenced within 48hours of ischaemic stroke reduced early deathsand long-term death or dependency.41,42 Thus,both guidelines recommend that patients admittedto hospital with suspected stroke should be CTscanned within 48 hours of stroke. Even thoughthis ideal may not be achieved in all hospitals inthe UK,67 in the present study, these guidelinesare assumed to represent ‘best current practice’and were therefore used as the main comparatorin the model. The National Service Framework for
Older People,68 subsection on stroke published in2001, also stipulated that a brain scan should beperformed within 48 hours; therefore, a basecomparator of ‘scan all within 48 hours of stroke’seemed reasonable.
A number of difficulties were encountered inrefining the list of potential CT scanningstrategies. Access to CT for stroke varies aroundthe UK.66,67,336 There was a clear need for thestrategies not only to reflect these differences inavailability, but also to take account of the widevariety of problems posed by acute stroke patients,and the different case mix in different hospitalsserving different populations.337 However, therewas also a need to keep the list of strategies fairlysimple. A final problem was to ensure thatsufficient data were available to evaluate theexpected costs and outcomes associated with eachstrategy. More precise estimates of some data (i.e. apoint estimate and 95% confidence interval ratherthan a general estimate) only became availableafter some primary data collection.
In addition, it was apparent that some scanningstrategies would not be relevant for some hospitalsin the UK. For example, strategies that require
Health Technology Assessment 2004; Vol. 8: No. 1
75
© Queen’s Printer and Controller of HMSO 2004. All rights reserved.
TABLE 38 CT scanning strategies
Strategy Imaging strategy
Comparator Scan all within 48 hours of admission to hospital
S1 Scan all immediately
S2 Scan patients on anticoagulants or in a life-threatening condition immediately and scan all remainingpatients within 24 hours of admission to hospital
S3 Scan patients on anticoagulants or in a life-threatening condition immediately and scan all remainingpatients within 48 hours of admission to hospital
S4 Scan patients on anticoagulants or in a life-threatening condition immediately and scan all remainingpatients within 7 days of admission to hospital
S5 Scan patients on anticoagulants or in a life-threatening condition immediately and scan all remainingpatients within 14 days of admission to hospital
S6 Scan patients on anticoagulants, those in a life-threatening condition or are candidates for hyperacutetreatment immediately and scan all remaining patients within 24 hours
S7 Scan patients on anticoagulants, those in a life-threatening condition or are candidates for hyperacutetreatment immediately and scan all remaining patients within 48 hours
S8 Scan patients on anticoagulants, those in a life-threatening condition or are candidates for hyperacutetreatment immediately and scan all remaining patients within 7 days
S9 Scan patients on anticoagulants, those in a life-threatening condition or are candidates for hyperacutetreatment immediately and scan all remaining patients within 14 days
S10 Scan only patients in atrial fibrillation, on anticoagulants or on antiplatelet drugs within 7 days ofadmission to hospital
S11 Scan only patients with a life-threatening stroke or anticoagulants within 7 days of admission to hospital
S12 Do not scan anyone
A life-threatening stroke is defined in terms of the severity of the stroke (TACS) with an impaired level of consciousness.
patients to be scanned either immediately orwithin a very short period assume that radiologicaldepartments have the resources to undertakeemergency or out-of-hours CT scanning.336 Whilethis may be feasible for radiological departmentsin large teaching hospitals, smaller hospitals mayoften not have the resources to offer this service,while other hospitals do not have CT scanningfacilities on site. Furthermore, hospitals with adedicated neuroradiology department may be ableto offer immediate brain CT, whereas hospitalswhere the brain CT is performed in the generalradiology department have to slot in brain CTbetween more complex body CT examinations.Body CT often takes longer than a simple brainCT, and requires the use of intravenous and oralcontrast, and so timing of scanning (and notinterrupting it) makes immediate access for a‘quick brain CT’ more difficult. All of these factorsaffect how quickly an individual stroke patient maygain access to CT scanning.
A survey of access to imaging facilities for patientssuspected of having suffered a stroke in Scotlandwas undertaken to inform the modelling (see later),because there were no comprehensive data oncurrent access to CT for stroke patients. There weredata on parts of the access process, for example in asurvey of UK casualty departments,26 or in thesurvey of services for stroke provided in Scottishhospitals.66 However, stroke patients may beadmitted under non-stroke physicians and so wouldnot have been included in the latter audit. In anycase, both the audit and casualty department surveywere based on data from at least 3 years ago.During the course of the present project, the RoyalCollege of Radiologists undertook a survey ofradiology departments in England and Wales, butthese data were not available at the time of themodelling (Squires, Royal College of RadiologistsAudit Committee, personal communication). Therewere no data at all on what additional resourceswould be required to increase the access to CT forstroke patients. The survey also sought to classifyhospitals in terms of their access to CT scanningfacilities, and to determine the likely scale of extraresource required to bring the service up to thelevel required by the ‘optimal’ CT scanning strategydefined by this work. The different CT scanningstrategies would then be reviewed in the light ofthis classification.
Model structureA decision tree was constructed to model theexpected costs and outcomes associated with thestrategy to ‘CT scan all patients suspected ofhaving suffered a stroke within 48 hours’. This tree
was then modified to assess the effect of each ofthe scanning strategies listed in Table 38. Giventhat some CT scanning strategies are similar innature, a detailed tree was required to ensure thateven small differences in the costs and outcomespotentially could be identified in the analysis. Thetree incorporated key decisions and events such asCT scanning, the sensitivity and specificity ofscans, diagnosis, treatment options, and the effecton costs and patient outcomes. The developmentof the tree required considerable discussionamong the clinical, radiological and healtheconomics authors to think through carefully theimplications of what might happen to patientscorrectly or incorrectly diagnosed at each node inthe tree. This required several iterations before afinal structure was agreed on.
The decision tree was constructed in accordancewith a number of conventions used in decisionanalysis.338 The tree depicted patients admitted tohospital with first ever stroke (but with appropriateadjustment, the model could also apply torecurrent stroke as the basic decision nodes wouldbe the same). The main tree is displayed in Figure9 and the treatment and outcome subtrees areshown in Figures 10 and 11. A brief description ofthe tree is given below.
In Figure 9, chance nodes 1 and 2 represent thepatient’s true clinical status. Of the patientsadmitted to hospital with a suspected first stroke, aproportion would have truly had a stroke and aproportion would not (Chapter 2 and chance node1). At chance node 2, of the patients who truly hada stroke, a proportion would have had a PICH anda proportion would have had a cerebral infarct(Chapter 2).
Stroke severity (chance nodes 3 and 4) wascategorised with the Bamford classification system.9
It includes four clinical subtypes: PACS, LACS,TACS, POCS. Of these, TACS is considered to bethe most severe and these patients have the highestcase fatality and worst long-term outcome. Thefewer patients with a PICH (only about 15–20% ofall stroke) were categorised as either TACS or non-TACS. A more detailed sub-classification of PICHwould have reduced the sample sizes even furtherand not improved the outputs from the model.
In the base comparator, all patients in the modelwere CT scanned within 48 hours of stroke. Adiagnosis was then made on the basis ofinformation provided by the scan and a clinicalexamination. Therefore, sensitivity and specificityof the CT scans is incorporated at nodes 5–11
Cost-effectiveness of CT in stroke
76

Health Technology Assessment 2004; Vol. 8: No. 1
77
© Queen’s Printer and Controller of HMSO 2004. All rights reserved.
Diagnosis PICH
Diagnosis cerebral infarct
Diagnosis non-stroke
5CTTACS
Diagnosis PICH
Diagnosis cerebral infarct
Diagnosis non-stroke
6CTNon-TACS
Diagnosis PICH
Diagnosis cerebral infarct
Diagnosis non-stroke
7CTTACS2
1
Stroke
3PICH
4Cerebral infarction
Diagnosis PICH
Diagnosis cerebral infarct
Diagnosis non-stroke
8CTLACS
Diagnosis PICH
Diagnosis cerebral infarct
Diagnosis non-stroke
9CTPACS
Diagnosis PICH
Diagnosis cerebral infarct
Diagnosis non-stroke
10CTPOCS
Diagnosis PICH
Diagnosis cerebral infarct
Diagnosis non-stroke
11CT
Non-stroke
FIGURE 9 Main decision tree for the diagnosis of patients suspected of having suffered a stroke
No change in antihaemostatic treatment
No active treatment
Treatment – surgery, radiotherapy or steroids
No active treatment
Treatment – antibiotics
No active treatment
Treatment – antieplieptic agents
No active treatment
Treatment – further investigations and treatments
Stop anticoagulation
Stop aspirin
Commence aspirin immediately and continue after 2 weeks
No change in treatment (continue aspirin or anticoagulation)
Commence aspirin immediately and change to anticoagulation after 2 weeks
Stop anticoagulation
Diagnosis tumour
Diagnosis infection
Diagnosis post seizure
Diagnosis other
15
16
17
18
Thrombolysis
Diagnosis PICH 12
Diagnosiscerebral infarction 13
CT
Diagnosisnon-stroke 14
FIGURE 10 Treatment options for patients suspected of having suffered a stroke

(Chapter 3). For example, at node 5 patients whosuffer a PICH could be given one of three possiblediagnoses. First, a proportion of patients would becorrectly diagnosed as having suffered a PICH.Some patients would be incorrectly diagnosed (aseither a cerebral infarction or a non-stroke lesion)because the scan was misinterpreted and the PICHeither overlooked or misdiagnosed as a tumour oranother lesion.287,292 If the scan had been donelate (8 or more days after stroke) and thecharacteristic features of PICH on CT had resolvedrapidly, then what was truly a PICH would bemisdiagnosed as an infarct on CT (Chapter 3).Similarly, patients are diagnosed on the basis of theinformation provided by the CT at nodes 6–11.
A subtree was constructed to incorporate decisionsregarding primary treatment (see Figure 10 andChapters 1 and 4). At node 12, patients diagnosedas having suffered a PICH would either have nochange in antihaemostatic treatment, or be takenoff anticoagulation or aspirin. Patients diagnosedas having an ischaemic stroke (node 13) wouldeither:
� have no change in treatment � commence aspirin immediately and continue
this treatment after a period of 2 weeks � commence aspirin immediately and then
anticoagulation after 2 weeks � have anticoagulation stopped � or commence a hyperacute treatment such as
thrombolysis.
At node 14, patients diagnosed as non-stroke werecategorised as either: tumours (primary orsecondary); infections such as meningitis,encephalitis or abscesses; epilepsy/postictal; or‘other’, including non-vascular transientneurological events. Treatment decisions for thesepatients were incorporated at nodes 15, 16, 17and 18. Patients with a tumour could have surgery,radiotherapy, steroids or no active treatment.Those suffering from infections would be treatedwith antibiotics or no active treatment. Patientswho suffered a seizure would be treated with anti-epileptic agents. Finally, patients in the ‘other’group were likely to receive further investigations
to identify the cause of the event and have theappropriate treatment administered. Possibletreatments include stopping or starting drugs, orprocedures such as inserting a pacemaker.
Clinical outcomes were incorporated into the modelin Figure 11. The modified Rankin scale (mRS) wasused to assess the dependency of strokesurvivors.312,339 The mRS is an instrument used tomeasure the functional ability of stroke patients ona scale from 0 to 6. The scores of the mRS werecollapsed to give three main categories: alive andindependent (mRS 0–2), alive and dependent (mRS3–5), and dead (mRS 6). Outcome was assessed at6, 12 and 24 months after stroke. The mRS iswidely used in research to assess outcome afterstroke.10,312,340–342) One concern with using thisinstrument in the present analysis was whether itwould be sufficiently sensitive to detect changes inoutcome. However, there appeared to be littlealternative, as the mRS is widely used, and it wasthe outcome measure that was available for many ofthe primary data that were available for the model.
Summary of the development of themodelThis section provides an overview of the modeldeveloped to assess the cost-effectiveness of CTscanning patients with suspected stroke. We havehighlighted a number of challenges, such asidentifying the appropriate imaging strategies toreflect likely practice, developing a model detailedenough to satisfy clinicians’ awareness of the varietyof acute stroke management decisions, to detectsmall differences in costs and outcomes between thestrategies, and selecting appropriate methods tomodel the changes in outcomes. The next sectiondescribes the data collected to use in the model.
Data for the model: probabilitytable, outcomes and costsThe purpose of this section is to describe the datarequired to analyse the model. The data includethe estimates of the parameters for the maindecision tree and the costs and outcomes
Cost-effectiveness of CT in stroke
78
Dead (mRS 6)
Alive and dependent (mRS 3–5)
Alive and independent (mRS 0–2)
Outcomes
FIGURE 11 Stroke outcomes

associated with the comparator in the economicevaluation, that is, CT scan all patients suspectedof having suffered a stroke within 48 hours. Thedata comprised survival data, quality-of-life data,cost information from three Scottish hospitals andresource use from the LSR.
Parameters for the main decision tree:probability tablesThe parameter estimates for the main tree (Figure 9) were obtained from many sources. Theseincluded a series of systematic reviews of theclinical diagnosis of stroke, of CT scanning and ofthe effect of inadvertent administration ofantithrombotic treatment to patients with PICH(see Chapters 2–4), individual studies from theliterature and expert clinical opinion (only wheredata from primary studies or systematic reviewswere lacking and it was not feasible to obtain thedata in the present study). These estimates weresupplemented with additional information fromour own data, such as the LSR. Tables 39–41contain the base values for each of the parametersin the model.
Once the parameter estimates for the main treehad been identified, one of the main challenges in
the study was to determine the way in which theseestimates would be altered under the 12 differentimaging strategies identified in the previous section(‘Development of the cost-effectiveness model anddecision tree’, p. 73) (Table 39). The change inoutcome was estimated with data from systematicreviews of randomised trials or from singlerandomised trials where possible. If this was notpossible, expert clinical opinion was relied upon toprovide an estimate of the change in outcome ofless frequent problems for stroke and cerebraltumours, infections or other non-vascular causes ofstroke. For example, in strategy 1 (scan all patientsimmediately) there were data from a systematicreview to estimate change in outcome for thoseeligible for thrombolysis,130 but not for those withcerebellar haematoma, or with massive PICH whichmight benefit from drainage of the haematoma,51
or patients on anticoagulants who suffer a PICH, orthose with tumours or infections. Therefore, for allof these latter patients, expert clinical opinion wasused to interpret available data on incidence ofthese sorts of patient, the proportion who mighthave their haematoma drained, for example, andthe likely effect on outcome. Patients with cerebellarhaematoma and secondary hydrocephalus are athigh risk of dying unless the hydrocephalus is
Health Technology Assessment 2004; Vol. 8: No. 1
79
TABLE 39 Parameter estimates including the probability of stroke, non-stroke and clinical subtypes
Variable Probability Source
Baseline (%) 95% CI (%) Range (%)
StrokeProportion of actual stroke in a population 81 77–84 73–100 Systematic review (Chapter 2)presenting with stroke-like symptoms
Proportion of haemorrhagic stroke (PICH) in 14.7 14.1–15.3 7.7–28.8 Systematic review (Chapter 2)patients with true stroke
Proportion of cerebral infarctions in patients 85.3 84.7–85.9 71.2–92.3 Systematic review (Chapter 2)with true stroke
Non-strokeProportion of primary brain tumours 15 8–26.3 2–15.2 Systematic review (Chapter 2)
Proportion of systemic infections 17 9–28.4 3–48.9 Systematic review (Chapter 2)
Proportion of post-seizures 17 9–28.4 2–44.7 Systematic review (Chapter 2)
Proportion of other diagnoses 51 37–68.4 Systematic review (Chapter 2)
Clinical subtypesPICH
TACS 29 22–36 LSR, 2000Non-TACS 71 64–78 LSR, 2000
Cerebral infarctionTACS 13 11–15 13–17 LSR, 2000LACS 28 25–30 21.3–28 LSR, 2000PACS 42 40–45 34–52.8 LSR, 2000POCS 17 15–19 9.4–24 LSR, 2000
© Queen’s Printer and Controller of HMSO 2004. All rights reserved.

drained (in which case they have a reasonablechance of making a reasonable recovery). Mostclinicians would correct the haemostaticabnormality in patients on anticoagulants who havea PICH, to prevent the neurological deficit fromdeteriorating owing to increasing haematoma, andguidelines recommend this.50,335 However, it is less
clear that evacuating supratentorial haematomas isbeneficial.51 There are ongoing trials of evacuationversus best medical therapy for acuteintraparenchymal haematomas,51,52 but otherwiseas yet no reliable evidence on specific treatment forPICH. Therefore, estimates of the proportion ofpatients with these types of stroke were obtained
Cost-effectiveness of CT in stroke
80
TABLE 40 Parameter estimates including the sensitivity and specificity of CT scans and stroke treatments
Variable Probability Source
Baseline (%) 95% CI (%) Range (%)
Sensitivity of CT scansVascular versus non-vascular 0.90 0.88–0.95 Systematic review (Chapter 3)
PICH versus cerebral infarctionExpert 1.0 Systematic review (Chapter 3)Non-expert 0.77 0.6–0.8
Specificity of CT scansVascular versus non-vascular 0.98 0.95–1.0 Systematic review (Chapter 3)
PICH versus cerebral infarctExpert 1.0 Systematic review (Chapter 3)Non-expert 0.8 0.6–0.9
Stroke treatmentsPICH
No change in antihaemostatic treatment 66.1 59.4–72.9 LSR, 2000Stop anticoagulation 7.4 4.1–12.1 LSR, 2000Stop aspirin 26.5 20.2–32.7 LSR, 2000
InfarctNo change (continue aspirin or 32.45 LSR, 2000
anticoagulation)Commence aspirin immediately and 61.70 LSR, 2000
continue after 2 weeksCommence aspirin immediately and change 5.32 LSR, 2000
to anticoagulation after 2 weeksStop anticoagulation 0.53 LSR, expert clinical opinionThrombolysis 0 0–10 LSR, expert clinical opinion
TABLE 41 Parameter estimates for non-stroke treatments
Variable Probability Source
Baseline (%) 95% CI (%) Range (%)
Non-stroke treatmentsTumour
Surgery, radiotherapy, steroids 100 Expert clinical opinionNo active treatment 0
InfectionsAntibiotics 100 Expert clinical opinionNo active treatment 0
Post-seizureAntiepileptic agents 100 Expert clinical opinionNo active treatment 0
Other diagnosesFurther investigations and treatment 100 Expert clinical opinionNo active treatment 0

from the literature, the LSR and expert opinion(Tables 39–41), but the effect on outcome had to beestimated mainly from expert opinion. However,collectively these latter patients make up only asmall proportion of total strokes. While the lack ofreliable evidence to indicate how outcomes afterPICH might change with treatment introduceduncertainty, the majority of the more frequentstroke scenarios were covered by good evidence.These uncertainties in the model were exploredusing sensitivity analysis based on the upper andlower 95% confidence intervals for the pointestimates of change where available or, where notavailable, the range of expert opinion, and theresults are presented later in this chapter (‘Resultsof the analysis of the cost-effectiveness model forCT scanning, and sensitivity analyses’, p. 109).
OutcomesThe number of life years was estimated bymodelling survival using 5 year survival data fromthe LSR (Table 42). Survival was modelled basedon age and severity of the stroke using 6 monthlyintervals over a 5 year period for 1854 first everstroke patients using Cox’s proportional hazardsregression analysis. These patients represented allpatients entered into the LSR with a first strokebetween November 1990 and April 1999. In termsof the mRS, 83% of patients remained in the samestate, 5.2% of patients improved, 8.6% of patientsdeteriorated, and 3.3% of patients had missingdata between 12 months and 24 months afterstroke. The number of years of survival wascalculated, taking into consideration the agedistribution, for stroke patients aged 45–89 years,
in terms of 5 year age bands and severity (TACS,LACS, PACS and POCS) for a 5 year period (Table 43). Five year survival was initially calculatedon the basis of individual years. However, it wasconsidered to contribute very little additionalinformation and therefore survival was aggregatedin 5 year age bands.
Although modelling 5 year survival using datafrom the large LSR dataset has the advantage ofproviding a greater degree of precision, there weresome limitations. For example, there was a largerproportion of milder strokes in the LSR than insome of the other Scottish hospitals for whichcomparable data were available337 although,unfortunately, not in the detail that was requiredfor the present study. There has been a majorinterest in stroke in the Western General Hospital(where the LSR is based) since the late 1980s,whereas other hospitals in the UK may not havehad such highly developed stroke services duringthat time. However, that also means that the LSRdata are more relevant to the immediate future aspractice is changing in many hospitals in the UKin which stroke services are only now becomingmore developed.66,67 Very detailed informationabout treatments and management decisions wasnot recorded in the LSR. Although most patientswith ischaemic stroke received aspirin from 1996onwards, following publication of the IST, virtuallynone received thrombolysis at any time, or anyneuroprotective treatment.
Clinical outcomes were assessed at 6, 12 and 24months using data from the LSR (Table 42 shows
Health Technology Assessment 2004; Vol. 8: No. 1
81
© Queen’s Printer and Controller of HMSO 2004. All rights reserved.
TABLE 42 Outcomes after stroke, at 6, 12 and 24 months by clinical subtype in terms of the mRS
Outcome Cerebral infarction (%) PICH (%)
TACS LACS PACS POCS TACS Non-TACS
60–64 yearsAlive and independent (mRS 0–2) 15.9 70.18 57.35 53.13 20.00 54.55Alive and dependent (mRS 3–5) 47.37 19.30 20.59 37.50 20.00 27.27Dead (mRS 6) 36.84 10.53 22.06 9.38 60.00 18.18
70–74 yearsAlive and independent (mRS 0–2) 8.3 64.87 54.16 65.91 0 42.86Alive and dependent (mRS 3–5) 33.3 18.92 26.04 11.36 14.29 28.57Dead (mRS 6) 58.3 16.22 19.79 22.73 85.71 28.57
80–84 yearsAlive and independent (mRS 0–2) 3.03 63.33 34.62 42.11 20.00 18.18Alive and dependent (mRS 3–5) 24.24 20.00 25.64 21.05 60.00 36.36Dead (mRS 6) 72.73 16.67 39.74 36.84 20.00 45.46
Source: LSR, 2000.

the percentages alive and independent, alive anddependent, and dead at 24 months after firststroke). While the LSR provided data on clinicaloutcomes at these points in time, there was noinformation beyond 2 years after stroke. Thismodel examined the effect of scanning on survivalover a 5 year period and therefore it was assumedthat clinical outcomes remained static from 2 to 5years after stroke. Given that there was insufficientevidence available to suggest how outcomes varybetween year 2 and year 5 after stroke, thisassumption was considered to be acceptable. Table43 shows mean survival in years over the 5 yearsafter first stroke in the 1854 patients with firststroke in the LSR, divided into 5 year age bandsaccording to the patient’s age at the time of thestroke and by the clinical subtype of stroke.
Estimation of quality of lifeUtility weights were derived to reflect the patients’opinion of the quality of life associated with‘independent survival after stroke’ and ‘dependentsurvival after stroke’ health states. The utilityweight is a score between 0 and 1 which reflects thequality of life associated with the health state,where 0 = death and 1 = full health. Thisinformation can reflect the opinion of the patient,carer, physician, public health doctor orgovernment planner,343 but the present study useddata obtained previously in a survey of UK patientsrandomised in the IST.10 The EQ5D health state at18 months following stroke is known for thesepatients as is their modified mRS at 12 and 24months (from the LSR) (Table 44).344,345 Byrestricting attention to the 83% of patients whosemRS did not change, the relationship betweenEQ5D health state and independent anddependent survival following stroke was identified.The final step involved applying the scores thathave been estimated for the relevant EQ5D statesusing the time trade off (TTO) tariff derived forthe UK population.346 Given that a significant
proportion of stroke patients are aged 60 years andover, the TTO values for older people are used inthe present study. The resulting estimated EQ5Dscores for independent and dependent survivalfollowing stroke are shown in Table 45 for allpatients and those who remained in the same statebetween the two periods to remove any effect ofthe differential timing.
These data enabled the expected number ofQALYs to be calculated by multiplying utilityweights, which reflect the quality of life associatedwith each of the health states after stroke (aliveand independent, alive and dependent and dead)by the number of life years resulting from aparticular treatment strategy.
A combination of evidence from the literature andexpert clinical opinion was used to determinewhether, and how, clinical outcomes (mRS healthstates) and or survival are altered in terms of eachof the 12 CT imaging strategies. These results arepresented later in this chapter (‘Results of theanalysis of the cost-effectiveness model for CTscanning, and sensitivity analyses’, p. 109).
CostsThe costs in this model were estimated from theperspective of the health service. Key areas of
Cost-effectiveness of CT in stroke
82
TABLE 43 Mean survival (years) over the 5 years following a stroke by age and stroke severity (life years) (LSR and ISD)
Clinical subtype
Age (years) TACS PACS LACS POCS
45–49 3.997 4.613 4.764 4.64850–54 3.704 4.487 4.685 4.53355–59 3.347 4.323 4.581 4.38260–64 2.929 4.114 4.445 4.19065–69 2.457 3.850 4.269 3.94470–74 1.955 3.135 4.045 3.64075–79 1.457 3.135 3.764 3.27180–84 1.003 2.686 3.420 2.84185–89 0.629 2.195 3.013 2.362
TABLE 44 mRS health states for IST patients who were also inthe LSR at 12 and 24 months after stroke10
mRS 12 months 24 months
n 149 145
Alive and independent 98 (65.8%) 92 (63.4%)(mRS 0–2)
Alive and dependent 51 (33.3%) 49 (33.8%)(mRS 3–5)
Dead (mRS 6) 0 4 (2.8%)

resource use include CT scans, primary treatment(which consists of primary intervention and LOSfor the first episode of care) and subsequent stroke-related hospital admissions within 5 years. Thesedata were collected from a number of sources.
Information on LOS in hospital was obtained fromthe General Acute inpatient and day-casedischarge data set (SMR01) from the ISD,Scotland (National Health Service in ScotlandInformation and Statistics Division). Data on LOSfollowing a stroke were requested for the sample of1854 first ever stroke patients from the LSR. LOSdata were obtained for the period of 5 years afterthe first stroke, across different hospital settings,taking into account the type and severity of stroke.
To obtain the data from ISD, it was necessary toapply to the ISD Privacy Advisory Committee forpermission to use the data, to supply ISD with adataset containing sufficient identifiers to enabletheir statisticians to match with their data, and todecode their return dataset. This was complex, asthe admissions for each patient were not alreadylinked together and had to be matched manuallyto obtain total LOS. For example, if a patient hadbeen admitted to the Western General Hospitaland then transferred for rehabilitation to theadjacent hospital, this would have been recordedas two separate admissions by ISD, despite itsbeing part of the one disease-related admission.
The ISD record linkage provided data on 1778patients (95.9%) from the original dataset. Of the1778 patients identified by the linkage, 1241patients (69.8%) had at least one continuousinpatient stay for the 5 year period. The LSR
records indicate that 644 of the original 1854patients (34.7%) were not admitted to the WesternGeneral Hospital when the stroke was diagnosedand were managed as outpatients. These patientswere excluded from the analysis of LOS.
The mean and median LOS for the first episodeof care by type and severity of stroke are reportedin Table 46. It is interesting to note the markeddifference in LOS between patients who were aliveand independent at 6 months and those who weredependent. The implication would be that a smallshift in the proportion of patients from dependentto independent at 6 months would have a markedeffect on reducing overall LOS. Table 47 presentsthe total average LOS for subsequent stroke-related hospital admissions over the 5 year period.In both tables, LOS is presented in terms ofadmissions to teaching hospitals, large generalhospitals and long-stay hospitals. Five observationswere excluded from this analysis, where LOS ofindividual hospital admissions was greater than365 days. In terms of the first episode of care, forboth PICH and cerebral infarction, the averageLOS was influenced by the severity of the stroke,as patients who had suffered a TACS generallyhad longer hospital admissions than those whosuffered a less severe stroke. This difference wasless apparent in terms of subsequent stroke-relatedhospital admissions over the 5 year period, butwas still greater for the TACS than non-TACS.Note that although the majority of subsequentadmissions were to the Western General Hospitalor one of the immediate surrounding hospitals,patients were also admitted to hospitals as faraway as Glasgow, Falkirk, Perth, Dumfries and theBorders.
Health Technology Assessment 2004; Vol. 8: No. 1
83
© Queen’s Printer and Controller of HMSO 2004. All rights reserved.
TABLE 45 mRS health states and TTO tariff weights based on IST and LSR data
mRS TTO weights TTO weights – constant mRS at 12 and 24 months
n 146 124
Alive and independentn 95 84Mean 0.76 0.7895% CI 0.72–0.81 0.73–0.82Median 0.80 0.80Minimum 0.06 0.06Maximum 1 1
Alive and dependentn 51 40Mean 0.37 0.3495% CI 0.28–0.47 0.23–0.45Median 0.51 0.33Minimum –0.57 –0.57Maximum 1 1

The change in health state (mRS) and LOS thenresulting from each of the 12 scanning strategies isshown in Table 48. This details for each of the 12strategies by diagnosis and associated treatment,the assumed changes in clinical outcomes and inLOS. The evidence base for each of theseassumptions is indicated. While many of these canbe and have been explored using sensitivity analysisthe table highlights the challenges of assessing theimpact of different CT scanning strategies.
Unit costs were derived using a combination ofboth a detailed costing approach and estimatesavailable in the published literature. Detailedcosting was undertaken to calculate the cost of CTscans across a range of hospitals and during‘normal working hours’ as well as ‘out of hours’ toprovide typical examples. A detailed description ofthe methods and results of the CT costing study isreported in Appendix 8. This required first anapproach to several Scottish hospitals to ascertainwhether detailed CT costing data could be
obtained within the period of the project. In eachof the three different Scottish hospitals where thisapproach was successful, this was followed by closeliaison with an NHS-funded health servicemanager to obtain details of capital, marginal,recurrent and staff costs to obtain a total cost for aCT scan both in normal working hours andoutside normal working hours. This enabled thecost of CT scanning to be estimated for a largeteaching hospital and two large general hospitals,one rural, one urban. These costs were intendedto provide three suitably stylised cases againstwhich other health care providers could comparetheir own costs in the model. A sensitivity analysisbased on the minimum and maximum times takento scan a patient (mainly adjusting the cost of stafftime) was also performed to obtain a ‘low’ and‘high’ estimate of cost for each hospital in and outof hours. A summary of the results of the costingstudy is presented in Table 49. The average cost ofCT scanning in a teaching hospital was £42.96during normal working hours and £79.35 out of
Cost-effectiveness of CT in stroke
84
TABLE 46 Mean LOS in hospital for the first episode of care after stroke by type of stroke, functional status and type of hospital (6 month mRS)a (LSR data linked to ISD)
LOS in hospital
Stroke by clinical subtype Teaching hospital Large general hospital Long-stay hospital
PICHTACS
Alive and independent (n) 56.3 (3) 35 (1) 31.0 (2)Alive and dependent (n) 79.5 (10) – 82.8 (5)Dead (n) 14.4 (18) 9.5 (2) 42.0 (1)
Non-TACS Alive and independent (n) 13.8 (34) 11.6 (8) 34.9 (8)Alive and dependent (n) 67.4 (24) 16.3 (3) 49.0 (4)Dead (n) 18.3 (13) 53.0 (1) –
Cerebral infarctionTACS
Alive and independent (n) 32.9 (15) 7.0 (1) 24.5 (2)Alive and dependent (n) 75.4 (63) 26.5 (2) 90.1 (12)Dead (n) 22.5 (81) 20.5 (2) 45.0 (12)
LACS Alive and independent (n) 12.3 (100) 12.7 (6) 68.6 (5)Alive and dependent (n) 38.7 (65) 29.3 (6) 61.2 (11)Dead (n) 25.9 (11) – 15.7 (3)
PACs Alive and independent (n) 11.2 (156) 14.5 (18) 25.1 (19)Alive and dependent (n) 49.9 (120) 17.9 (11) 67.1 (27)Dead (n) 25.3 (60) 33.3 (3) 22.9 (16)
POCs Alive and independent (n) 9.6 (80) 6.4 (9) 22.7 (3)Alive and dependent (n) 27.0 (33) 8.5 (6) 31.0 (6)Dead (n) 13.4 (17) – 19.7 (3)
a Observations with LOS = 0 or > 365 days were excluded.Note that patients were first admitted to the teaching hospital and thence may have been transferred to the general orlong-stay hospital or both.

hours. The average cost of CT scanning variedfrom £30.23–£71.47 in the large teachinghospitals during normal working hours to£55.05–£173.46 out of hours. The costs ofscanning in the urban district general hospitals(DGH) were lower than those estimated for therural DGH, but higher than those for the teachinghospital during normal working hours. The out-of-hours costs for the urban DGH were not muchdifferent to those for normal working hours, incontrast to the teaching and rural DGH, where theout-of-hours costs were substantially higher thanthe daytime costs. The main reason for thisappeared to be that the radiographers in theurban DGH did not have a minimum billing rateper call as in the other two hospitals, possiblybecause the radiographer on call was able tooperate CT as well as other modalities. Thus, adedicated CT radiographer in addition to ageneral radiographer was not required.
The cost per inpatient day was estimated using theNHS Scottish Health Service costs.69 An averagecost per bed day was estimated for a teaching
hospital, a large general hospital and a long-stayhospital using the relevant inpatient in acutespecialities costs (medical and neurology). Weconsidered obtaining more detailed costs forfurther investigations and primary treatment, butthis would not have been practical as the costsoverall are small compared with the cost of timespent in a hospital bed. In addition, the NHSScottish Health Service costs include an amountfor general investigations and treatments. Theaverage cost per bed day for long-stay hospitalswas generated using the hospital running costs fora subgroup of relevant hospitals. The subgroup ofhospitals included long-stay hospitals, small long-stay hospitals, long-stay acute hospitals, long-stayacute hospitals, long-stay psychiatric hospitals andlong-stay community hospitals). The average costper bed day ranged from £116 for long-stayhospitals to £239 for teaching hospitals. Costs forstroke are also incurred in the community, but wedid not have time or resources to determine these.In any case the cost of care for severely disabledpatients is at least partially included in the cost oflong-term care included above.
Health Technology Assessment 2004; Vol. 8: No. 1
85
© Queen’s Printer and Controller of HMSO 2004. All rights reserved.
TABLE 47 Mean LOS in hospital of subsequent episodes of care by type of stroke, functional status and type of hospital (24 month mRS)a
LOS in hospital
Stroke by clinical subtype Teaching hospital Large general hospital Long-stay hospital
PICHTACS
Alive and independent (n) 9.5 (2) 9 (1) 8.5 (2)Alive and dependent (n) 62.0 (5) 15.0 (1) 12.0 (2)Dead (n) 10.5 (6) – –
Non-TACS Alive and independent (n) 13.5 (13) 10.7 (3) 60.0 (2)Alive and dependent (n) 33.9 (14) 34.0 (3) 65.5 (6)Dead (n) 17.5 (10) – 64.8 (5)
Cerebral infarctionTACS
Alive and independent (n) 28.3 (3) 23.0 (1) 56.0 (3)Alive and dependent (n) 36.2 (19) 42.2 (4) 64.7 (20)Dead (n) 30.6 (20) 53.0 (1) 53.8 (8)
LACS Alive and independent (n) 6.7 (14) 6 (7) 33.0 (11)Alive and dependent (n) 48.2 (17) 14.5 (2) 67.5 (15)Dead (n) 35.7 (4) 37.0 (1) 26.0 (4)
PACS Alive and independent (n) 12.1 (39) 16.0 (9) 46.5 (10)Alive and dependent (n) 30.5 (49) 23.1 (12) 68.2 (34)Dead (n) 25.6 (20) – 33.7 (13)
POCS Alive and independent (n) 19.8 (23) 8 (6) 15.2 (5)Alive and dependent (n) 22.0 (8) 6.5 (2) 63.2 (5)Dead (n) 9.5 (6) – 18.8 (4)
a Observations with LOS = 0 or > 365 days were excluded.

Cost-effectiveness of CT in stroke
86
TABLE 48 Incremental outcomes associated with the CT scanning strategies compared with the main comparator (withhold aspirin until after the CT scan)
CT scanning Diagnosis Treatment Change in clinical outcomes Change in LOSa
strategy
1. Scan allimmediately
Cerebral infarctions which experience HTI
Clinically significant HTI occurs in 1.5% (95% CI0.8% to 2.2%) (Lindley et al., unpublished)
Treat appropriately Unable to quantify the impact on outcomes Not calculated
Cerebral infarctions diagnosed in 3 hours
4% of cerebral infarctions (10% of cerebralinfarctions are eligible, but 6% havecontraindications to tPA)
Administer tPA Change in outcomes (Cochrane, 2001)130:• 140/1000 more alive and independent (95%
CI 80/1000 more to 200/1000 more)• 0/1000 difference in deaths (95% CI 40/1000
fewer to 50/1000 more)• No tPA tPA mRS
28% 28% dead32% 27% dependent39% 45% independent
Average LOS 31 days for one untreatedpatient, and 29.3 days for rt-PA-treatedpatients, therefore tPA ↓ LOS by 1.7 days per patient on average
No tPA tPA9,240 9,240 day/1000 pts
16,320 13,770 day/1000 pts5,460 6,300 day/1000 pts
Patients in a life-threatening condition due tocerebellar haematoma or cerebral infarct andsecondary hydrocephalus
Drainage ofhydrocephalus
May result in a better recovery and preventdeath in the acute phase. No evidence availableon the impact on outcomes
Half patients improve to independence,therefore ↓ LOS from 51 to 14 days forhalf patientsb
30% of PICH-TACS(Patients in a life-threatening condition fromPICH)
Early drainage Difficult to quantify effect on outcome but mayresult in better outcomes and prevent deaths inthe acute phase
↓ LOS from 51 to 14 days for 20% ofpatients treated in this wayb
Patients on anticoagulants who suffer a PICH Effects ofanticoagulation arereversed more quickly
The severity of the stroke could possibly bereduced if patients were diagnosed earlier, butthere is no evidence currently available on theimpact on outcomes
↓ LOS by 1 week for patients treated inthis wayb
a These figures are included here to show how mRS was converted to a treatment effect on LOS. These figures are approximate, more precise figures were used in the actual model.Similar figures were calculated for the effect of aspirin on outcome after ischaemic stroke and haemorrhagic stroke.
b Estimates of the effect on LOS based on clinical experience and what evidence available in the literature. However, these estimates may be inaccurate and so extensive sensitivitytesting will be undertaken to vary the effect on LOS and determine the confidence limits of the effect of CT scanning on the patients in these minority groups.
Tumours and infections Correct management Change in outcomes:1/1000 fewer deaths if infections were managedcorrectly
Tumours occupy fewer bed days, but anyreduction in LOS would be marginal if patientswould otherwise be scanned within 48 hours
Infections: ↓ LOS by 1 week on averagefor all patients managed correctlyb
Tumours: ↓ LOS by a few days perpatient. Note: strategies 1 and 2, littleeffect compared with base; strategy 4,add 7 days to this; strategy 5, add 14 days
continued
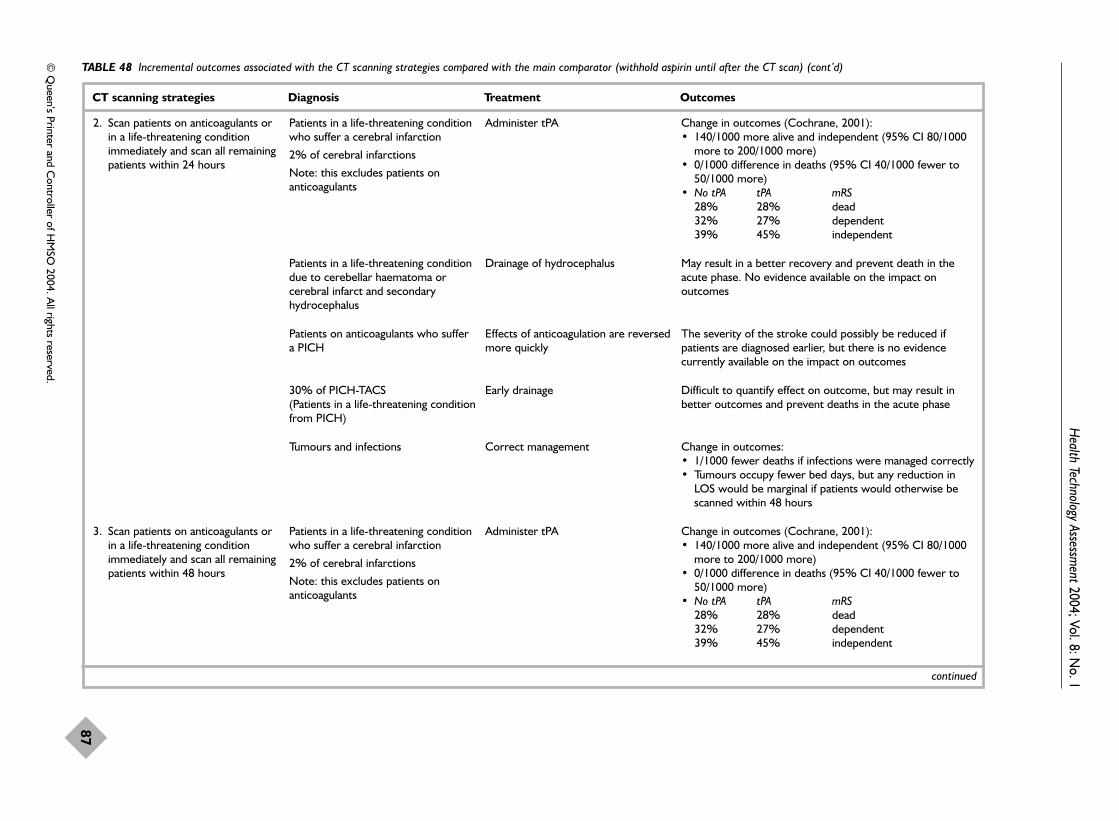
Health Technology Assessm
ent2004; Vol. 8: No. 1
87
© Q
ueen’s Printer and Controller of H
MSO
2004. All rights reserved.
TABLE 48 Incremental outcomes associated with the CT scanning strategies compared with the main comparator (withhold aspirin until after the CT scan) (cont’d)
CT scanning strategies Diagnosis Treatment Outcomes
2. Scan patients on anticoagulants orin a life-threatening conditionimmediately and scan all remainingpatients within 24 hours
Patients in a life-threatening conditionwho suffer a cerebral infarction
2% of cerebral infarctions
Note: this excludes patients onanticoagulants
Administer tPA Change in outcomes (Cochrane, 2001):• 140/1000 more alive and independent (95% CI 80/1000
more to 200/1000 more)• 0/1000 difference in deaths (95% CI 40/1000 fewer to
50/1000 more)• No tPA tPA mRS
28% 28% dead 32% 27% dependent 39% 45% independent
Patients in a life-threatening conditiondue to cerebellar haematoma orcerebral infarct and secondaryhydrocephalus
Drainage of hydrocephalus May result in a better recovery and prevent death in theacute phase. No evidence available on the impact onoutcomes
Patients on anticoagulants who suffer a PICH
Effects of anticoagulation are reversedmore quickly
The severity of the stroke could possibly be reduced ifpatients are diagnosed earlier, but there is no evidencecurrently available on the impact on outcomes
30% of PICH-TACS(Patients in a life-threatening conditionfrom PICH)
Early drainage Difficult to quantify effect on outcome, but may result inbetter outcomes and prevent deaths in the acute phase
Tumours and infections Correct management Change in outcomes:• 1/1000 fewer deaths if infections were managed correctly• Tumours occupy fewer bed days, but any reduction in
LOS would be marginal if patients would otherwise bescanned within 48 hours
3. Scan patients on anticoagulants orin a life-threatening conditionimmediately and scan all remainingpatients within 48 hours
Patients in a life-threatening conditionwho suffer a cerebral infarction
2% of cerebral infarctions
Note: this excludes patients onanticoagulants
Administer tPA Change in outcomes (Cochrane, 2001):• 140/1000 more alive and independent (95% CI 80/1000
more to 200/1000 more)• 0/1000 difference in deaths (95% CI 40/1000 fewer to
50/1000 more)• No tPA tPA mRS
28% 28% dead32% 27% dependent 39% 45% independent
continued

Cost-effectiveness of CT in stroke
88
TABLE 48 Incremental outcomes associated with the CT scanning strategies compared with the main comparator (withhold aspirin until after the CT scan) (cont’d)
CT scanning strategies Diagnosis Treatment Outcomes
30% of PICH-TACS(Patients in a life-threatening conditionfrom PICH)
Early drainage Difficult to quantify effect on outcome, but may result inbetter outcomes and prevent deaths in the acute phase
Patients in a life-threatening conditiondue to cerebellar haematoma orcerebral infarction and secondaryhydrocephalus
Drainage of hydrocephalus May result in a better recovery and prevent death in theacute phase. No evidence available on the impact onoutcomes
Patients on anticoagulants who suffer a PICH
Effects of anticoagulation are reversedmore quickly
The severity of the stroke could possibly be reduced ifpatients are diagnosed earlier, but there is no evidencecurrently available on the impact on outcomes.
4. Scan patients on anticoagulants orin a life-threatening conditionimmediately and scan all remainingpatients within 7 days
Patients in a life-threatening conditionwho suffer a cerebral infarction
2% of cerebral infarctions
Note: this excludes patients onanticoagulants
Administer tPA Change in outcomes (Cochrane, 2001)130:• 140/1000 more alive and independent (95% CI 80/1000
more to 200/1000 more)• 0/1000 difference in deaths (95% CI 40/1000 fewer to
50/1000 more)• No tPA tPA mRS
28% 28% dead32% 27% dependent39% 45% independent
30% of PICH-TACS(Patients in a life-threatening conditionfrom PICH)
Early drainage Difficult to quantify effect on outcome, but may result inbetter outcomes and prevent deaths in the acute phase
Patients in a life-threatening conditiondue to cerebellar haematoma orcerebral infarction and secondaryhydrocephalus
Drainage of hydrocephalus May result in a better recovery and prevent death in theacute phase. No evidence available on the impact onoutcomes
Patients on anticoagulants who suffer a PICH
Effects of anticoagulation are reversedmore quickly
The severity of the stroke could possible be reduced ifpatients are diagnosed earlier, but there is no evidencecurrently available on the impact on outcomes
continued
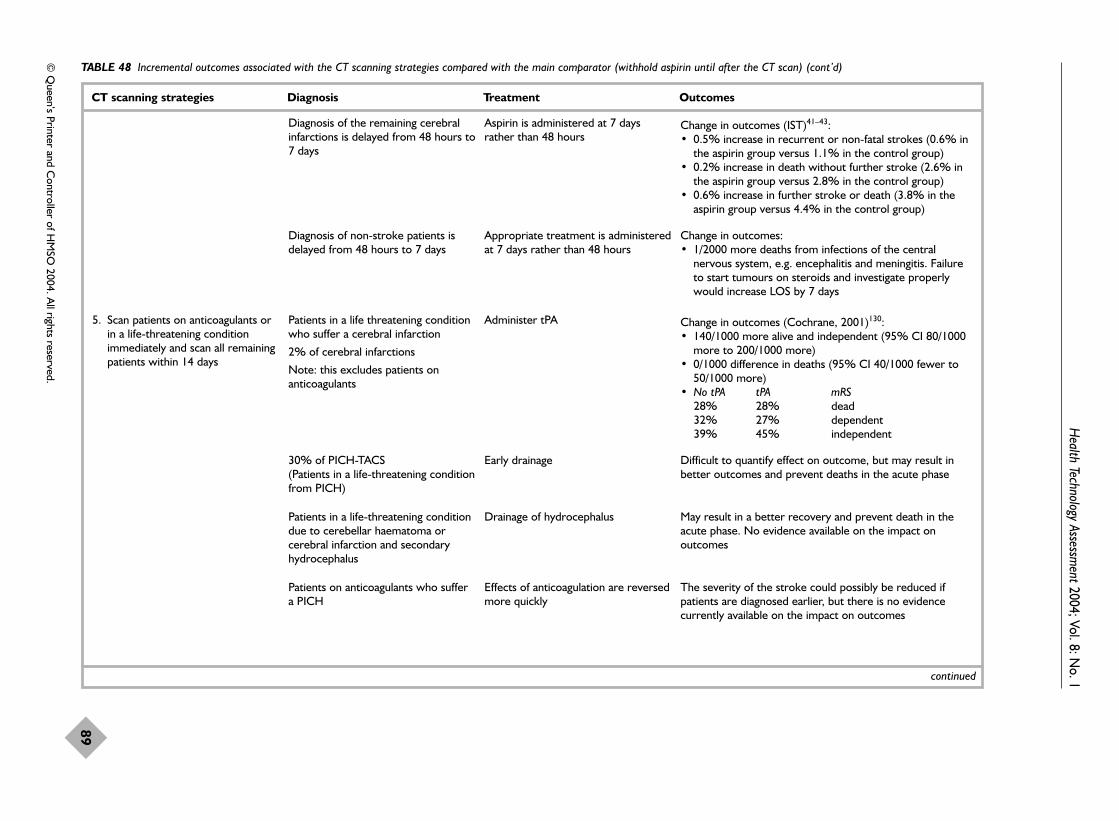
Health Technology Assessm
ent2004; Vol. 8: No. 1
89
© Q
ueen’s Printer and Controller of H
MSO
2004. All rights reserved.
TABLE 48 Incremental outcomes associated with the CT scanning strategies compared with the main comparator (withhold aspirin until after the CT scan) (cont’d)
CT scanning strategies Diagnosis Treatment Outcomes
Diagnosis of the remaining cerebralinfarctions is delayed from 48 hours to7 days
Aspirin is administered at 7 daysrather than 48 hours
Change in outcomes (IST)41–43:• 0.5% increase in recurrent or non-fatal strokes (0.6% in
the aspirin group versus 1.1% in the control group)• 0.2% increase in death without further stroke (2.6% in
the aspirin group versus 2.8% in the control group)• 0.6% increase in further stroke or death (3.8% in the
aspirin group versus 4.4% in the control group)
Diagnosis of non-stroke patients isdelayed from 48 hours to 7 days
Appropriate treatment is administeredat 7 days rather than 48 hours
Change in outcomes: • 1/2000 more deaths from infections of the central
nervous system, e.g. encephalitis and meningitis. Failureto start tumours on steroids and investigate properlywould increase LOS by 7 days
5. Scan patients on anticoagulants orin a life-threatening conditionimmediately and scan all remainingpatients within 14 days
Patients in a life threatening conditionwho suffer a cerebral infarction
2% of cerebral infarctions
Note: this excludes patients onanticoagulants
Administer tPA Change in outcomes (Cochrane, 2001)130:• 140/1000 more alive and independent (95% CI 80/1000
more to 200/1000 more)• 0/1000 difference in deaths (95% CI 40/1000 fewer to
50/1000 more)• No tPA tPA mRS
28% 28% dead32% 27% dependent 39% 45% independent
30% of PICH-TACS(Patients in a life-threatening conditionfrom PICH)
Early drainage Difficult to quantify effect on outcome, but may result inbetter outcomes and prevent deaths in the acute phase
Patients in a life-threatening conditiondue to cerebellar haematoma orcerebral infarction and secondaryhydrocephalus
Drainage of hydrocephalus May result in a better recovery and prevent death in theacute phase. No evidence available on the impact onoutcomes
Patients on anticoagulants who suffer a PICH
Effects of anticoagulation are reversedmore quickly
The severity of the stroke could possibly be reduced ifpatients are diagnosed earlier, but there is no evidencecurrently available on the impact on outcomes
continued

Cost-effectiveness of CT in stroke
90
TABLE 48 Incremental outcomes associated with the CT scanning strategies compared with the main comparator (withhold aspirin until after the CT scan) (cont’d)
CT scanning strategies Diagnosis Treatment Outcomes
Diagnosis of the remaining cerebralinfarctions is delayed from 48 hours to 14 days
Aspirin is administered at 14 daysrather than 48 hours
Change in outcomes: IST/CAST41–43
• Further stroke or deathA delay of 7 days results in an increase in further stroke ordeath by 0.6% (3.8% to 4.4%)
A delay of 8–14 days results in an increase in further strokeor death by 0.3% (2.8% to 3.1%)
The total increase in further stroke or death from 2 to 14days is 0.9%
• Death without further strokeA delay of 7 days results in an increase in death withoutfurther stroke by 0.2% (2.6% to 2.8%)
A delay of 8–14 days results in an increase in death withoutfurther stroke by 0.3% (1.6% to 1.9%)
The total increase in death without further stroke from 2 to14 days is 0.5%
• Recurrence of fatal or non-fatal cerebral infarctionA delay of 7 days results in an increase in recurrence of fatalor non-fatal cerebral infarction of 0.5% (0.6% to 1.1%)
A delay of 8–14 days results in an increase in recurrence offatal or non-fatal cerebral infarction of 0.2% (0.5% to0.7%)
The total increase in recurrence of fatal or non-fatalcerebral infarction from 2 to 14 days is 0.7%
• ATT350
In acute stroke, non-fatal stroke increases by 0.4% (2.1%to 2.5%), vascular deaths increase by 0.5% (6.0% to 6.5%)and all deaths increase by 0.6% (6.1% to 6.6%)
continued

Health Technology Assessm
ent2004; Vol. 8: No. 1
91
© Q
ueen’s Printer and Controller of H
MSO
2004. All rights reserved.
TABLE 48 Incremental outcomes associated with the CT scanning strategies compared with the main comparator (withhold aspirin until after the CT scan) (cont’d)
CT scanning strategies Diagnosis Treatment Outcomes
Incorrect diagnosis of PICH. The CTversus MR study presented inChapter 3 indicates that 40% ofPICH would be misdiagnosed as theywould not be visible on a CT scan at14 days. Out of 228 patients 6/8PICH strokes would be misdiagnosedas infarcts and 13/15 haemorrhagictransformations were diagnosed asinfarcts (of a population ofoutpatients with mild stroke). A totalof 19/23 (19/228 or 30/1000) patientswere misdiagnosed because bleedingwas missed
Incorrect treatment is administered Change in outcomes: • Longer term actuarial risk of recurrent PICH in survivors
of PICH to 30 days was 7% per year in those not givenaspirin340 (OCSP). A 40% (30% to 50%) relativeincrease at 1 year in recurrent PICH was estimated ifthese patients were given aspirin, a 20% relative increasein death and a 20–30% increase in dependency
• A systematic review of stroke and stroke survivors109
indicated that 4.3% of survivors have any recurrentstroke (CI 3.5% to 5.4%), 2.4% have a haemorrhagicstroke (CI 1.9% to 2.7%) and there are 8.8% deaths peryear (CI 5.2% to 11.0%) (assuming aspirin was notgiven). If aspirin was given this would result in a 3.7% (CI2.7% to 3.8%) increase in haemorrhagic stroke and a12.3% (a 7.3% to 15.4%) increase in deaths
Delay in diagnosis of tumours andinfections
Correct management 2/2000 more deaths from incorrectly managed infectionsand tumours (95% CI 1/2000 to 5/2,000)
continued
6. Scan patients on anticoagulants,those in a life-threatening conditionor candidates for hyperacutetreatment immediately and scan allremaining patients within 24 hours
Patients in a life-threatening conditionwho suffer a cerebral infarction
4% of cerebral infarctions
Note this excludes patients onanticoagulants
Administer tPA Change in outcomes (Cochrane, 2001)130:• 140/1000 more alive and independent (95% CI 80/1000
more to 200/1000 more)• 0/1000 difference in deaths (95% CI 40/1000 fewer to
50/1000 more)• No tPA tPA
28% 28%32% 27%39% 45%
30% of PICH-TACS Early drainage Difficult to quantify effect on outcome, but may result inbetter outcomes and prevent deaths in the acute phase.
Patients in a life-threatening conditiondue to cerebellar haematoma,cerebral infarct and secondaryhydrocephalus
Drainage of hydrocephalus May result in a better recovery and prevent death in theacute phase. No evidence available on the impact onoutcomes
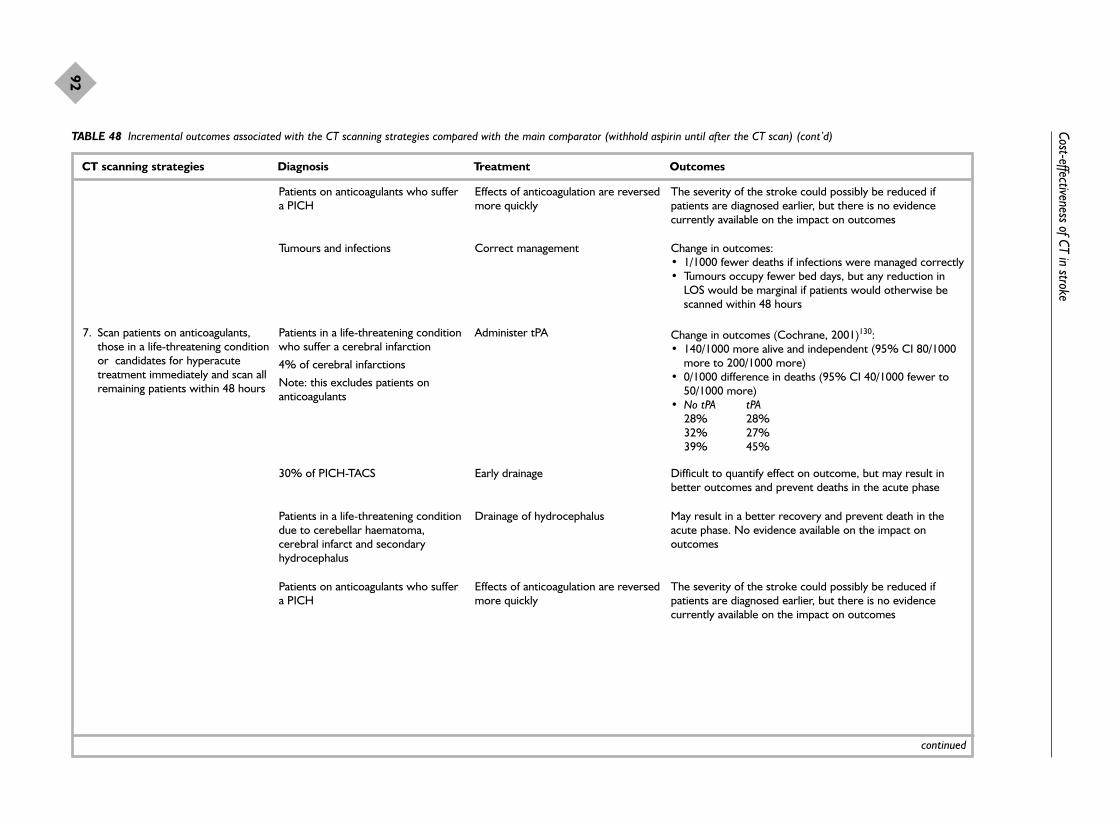
Cost-effectiveness of CT in stroke
92
TABLE 48 Incremental outcomes associated with the CT scanning strategies compared with the main comparator (withhold aspirin until after the CT scan) (cont’d)
CT scanning strategies Diagnosis Treatment Outcomes
Patients on anticoagulants who suffera PICH
Effects of anticoagulation are reversedmore quickly
The severity of the stroke could possibly be reduced ifpatients are diagnosed earlier, but there is no evidencecurrently available on the impact on outcomes
Tumours and infections Correct management Change in outcomes:• 1/1000 fewer deaths if infections were managed correctly• Tumours occupy fewer bed days, but any reduction in
LOS would be marginal if patients would otherwise bescanned within 48 hours
7. Scan patients on anticoagulants,those in a life-threatening conditionor candidates for hyperacutetreatment immediately and scan allremaining patients within 48 hours
Patients in a life-threatening conditionwho suffer a cerebral infarction
4% of cerebral infarctions
Note: this excludes patients onanticoagulants
Administer tPA Change in outcomes (Cochrane, 2001)130:• 140/1000 more alive and independent (95% CI 80/1000
more to 200/1000 more)• 0/1000 difference in deaths (95% CI 40/1000 fewer to
50/1000 more)• No tPA tPA
28% 28%32% 27%39% 45%
continued
30% of PICH-TACS Early drainage Difficult to quantify effect on outcome, but may result inbetter outcomes and prevent deaths in the acute phase
Patients in a life-threatening conditiondue to cerebellar haematoma,cerebral infarct and secondaryhydrocephalus
Drainage of hydrocephalus May result in a better recovery and prevent death in theacute phase. No evidence available on the impact onoutcomes
Patients on anticoagulants who suffera PICH
Effects of anticoagulation are reversedmore quickly
The severity of the stroke could possibly be reduced ifpatients are diagnosed earlier, but there is no evidencecurrently available on the impact on outcomes

Health Technology Assessm
ent2004; Vol. 8: No. 1
93
© Q
ueen’s Printer and Controller of H
MSO
2004. All rights reserved.
TABLE 48 Incremental outcomes associated with the CT scanning strategies compared with the main comparator (withhold aspirin until after the CT scan) (cont’d)
CT scanning strategies Diagnosis Treatment Outcomes
continued
8. Scan patients on anticoagulants,those in a life-threatening conditionor candidates for hyperacutetreatment immediately and scan allremaining patients within 7 days
Patients in a life-threatening conditionwho suffer a cerebral infarction
4% of cerebral infarctions
Note this excludes patients onanticoagulants
Administer tPA Change in outcomes (Cochrane, 2001)130:• 140/1000 more alive and independent (95% CI 80/1000
more to 200/1000 more)• 0/1000 difference in deaths (95% CI 40/1000 fewer to
50/1000 more)• No tPA tPA
28% 28% 32% 27% 39% 45%
30% of PICH-TACS Early drainage Difficult to quantify effect on outcome, but may result inbetter outcomes and prevent deaths in the acute phase
Patients in a life-threatening conditiondue to cerebellar haematoma andcerebral infarct and secondaryhydrocephalus
Drainage of the hydrocephalus May result in a better recovery and prevent death in theacute phase. No evidence available on the impact onoutcomes
Patients on anticoagulants who suffera PICH
Effects of anticoagulation are reversedmore quickly
The severity of the stroke could possibly be reduced ifpatients are diagnosed earlier, but there is no evidencecurrently available on the impact on outcomes
Diagnosis of the remaining cerebralinfarctions is delayed from 48 hoursto 7 days
Aspirin is administered at 7 daysrather than 48 hours
Change in outcomes (IST)41–43:• 0.5% increase in recurrent or non-fatal strokes (0.6% in
the aspirin group versus 1.1% in the control group)• 0.2% increase in death without further stroke (2.6% in
the aspirin group versus 2.8% in the control group)• 0.6% increase in further stroke or death (3.8% in the
aspirin group versus 4.4% in the control group)
Diagnosis of non-stroke patients isdelayed from 48 hours to 7 days
Appropriate treatment is administeredat 7 days rather than 48 hours
Change in outcomes: • 1/2000 more deaths from infections of the central
nervous system, e.g. encephalitis or meningitis. Failure tostart tumours on steroids and investigate properly wouldincrease LOS by 7 days

Cost-effectiveness of CT in stroke
94
TABLE 48 Incremental outcomes associated with the CT scanning strategies compared with the main comparator (withhold aspirin until after the CT scan) (cont’d)
CT scanning strategies Diagnosis Treatment Outcomes
9. Scan patients on anticoagulants,those in a life-threatening conditionor are candidates for hyperacutetreatment immediately and scan allremaining patients within 14 days
Patients in a life-threatening conditionwho suffer a cerebral infarction
4% of cerebral infarctions
Note: this excludes patients onanticoagulants
Administer tPA Change in outcomes (Cochrane, 2001)130:• 140/1000 more alive and independent (95% CI 80/1000
more to 200/1000 more)• 0/1000 difference in deaths (95% CI 40/1000 fewer to
50/1000 more)• No tPA tPA
28% 28% 32% 27%39% 45%
continued
30% of PICH-TACS Early drainage Difficult to quantify effect on outcome, but may result inbetter outcomes and prevent deaths in the acute phase
Patients in a life-threatening conditiondue to cerebellar haematoma andcerebral infarct and secondaryhydrocephalus
Drainage of hydrocephalus May result in a better recovery and prevent death in theacute phase. No evidence available on the impact onoutcomes
Patients on anticoagulants who suffera PICH
Effects of anticoagulation are reversedmore quickly
The severity of the stroke could possibly be reduced ifpatients are diagnosed earlier, but there is no evidencecurrently available on the impact on outcomes
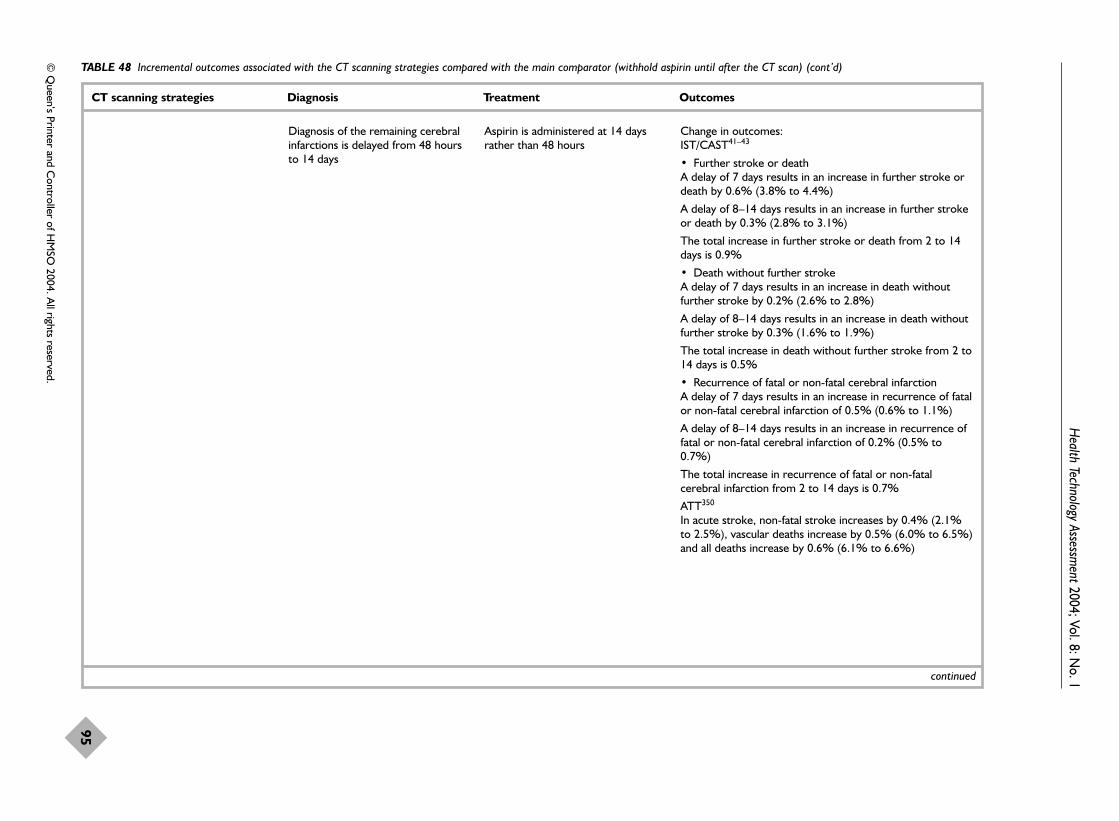
Health Technology Assessm
ent2004; Vol. 8: No. 1
95
© Q
ueen’s Printer and Controller of H
MSO
2004. All rights reserved.
TABLE 48 Incremental outcomes associated with the CT scanning strategies compared with the main comparator (withhold aspirin until after the CT scan) (cont’d)
CT scanning strategies Diagnosis Treatment Outcomes
Diagnosis of the remaining cerebralinfarctions is delayed from 48 hoursto 14 days
Aspirin is administered at 14 daysrather than 48 hours
Change in outcomes: IST/CAST41–43
• Further stroke or deathA delay of 7 days results in an increase in further stroke ordeath by 0.6% (3.8% to 4.4%)
A delay of 8–14 days results in an increase in further strokeor death by 0.3% (2.8% to 3.1%)
The total increase in further stroke or death from 2 to 14days is 0.9%
• Death without further strokeA delay of 7 days results in an increase in death withoutfurther stroke by 0.2% (2.6% to 2.8%)
A delay of 8–14 days results in an increase in death withoutfurther stroke by 0.3% (1.6% to 1.9%)
The total increase in death without further stroke from 2 to14 days is 0.5%
• Recurrence of fatal or non-fatal cerebral infarctionA delay of 7 days results in an increase in recurrence of fatalor non-fatal cerebral infarction of 0.5% (0.6% to 1.1%)
A delay of 8–14 days results in an increase in recurrence offatal or non-fatal cerebral infarction of 0.2% (0.5% to0.7%)
The total increase in recurrence of fatal or non-fatalcerebral infarction from 2 to 14 days is 0.7%
ATT350
In acute stroke, non-fatal stroke increases by 0.4% (2.1%to 2.5%), vascular deaths increase by 0.5% (6.0% to 6.5%)and all deaths increase by 0.6% (6.1% to 6.6%)
continued
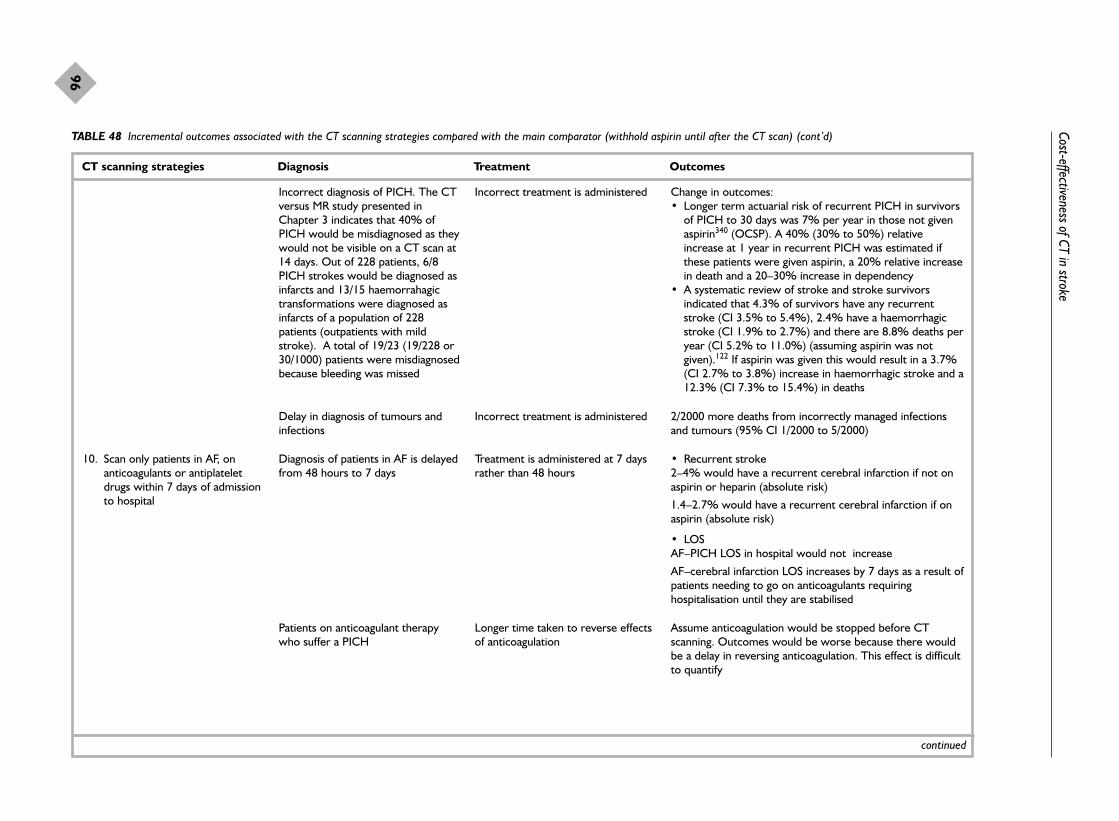
Cost-effectiveness of CT in stroke
96
TABLE 48 Incremental outcomes associated with the CT scanning strategies compared with the main comparator (withhold aspirin until after the CT scan) (cont’d)
CT scanning strategies Diagnosis Treatment Outcomes
Incorrect diagnosis of PICH. The CTversus MR study presented inChapter 3 indicates that 40% ofPICH would be misdiagnosed as theywould not be visible on a CT scan at14 days. Out of 228 patients, 6/8PICH strokes would be diagnosed asinfarcts and 13/15 haemorrahagictransformations were diagnosed asinfarcts of a population of 228patients (outpatients with mildstroke). A total of 19/23 (19/228 or30/1000) patients were misdiagnosedbecause bleeding was missed
Incorrect treatment is administered Change in outcomes: • Longer term actuarial risk of recurrent PICH in survivors
of PICH to 30 days was 7% per year in those not givenaspirin340 (OCSP). A 40% (30% to 50%) relativeincrease at 1 year in recurrent PICH was estimated ifthese patients were given aspirin, a 20% relative increasein death and a 20–30% increase in dependency
• A systematic review of stroke and stroke survivorsindicated that 4.3% of survivors have any recurrentstroke (CI 3.5% to 5.4%), 2.4% have a haemorrhagicstroke (CI 1.9% to 2.7%) and there are 8.8% deaths peryear (CI 5.2% to 11.0%) (assuming aspirin was notgiven).122 If aspirin was given this would result in a 3.7%(CI 2.7% to 3.8%) increase in haemorrhagic stroke and a12.3% (CI 7.3% to 15.4%) in deaths
Delay in diagnosis of tumours andinfections
Incorrect treatment is administered 2/2000 more deaths from incorrectly managed infectionsand tumours (95% CI 1/2000 to 5/2000)
10. Scan only patients in AF, onanticoagulants or antiplateletdrugs within 7 days of admissionto hospital
Diagnosis of patients in AF is delayedfrom 48 hours to 7 days
Treatment is administered at 7 daysrather than 48 hours
• Recurrent stroke2–4% would have a recurrent cerebral infarction if not onaspirin or heparin (absolute risk)
1.4–2.7% would have a recurrent cerebral infarction if onaspirin (absolute risk)
• LOSAF–PICH LOS in hospital would not increase
AF–cerebral infarction LOS increases by 7 days as a result ofpatients needing to go on anticoagulants requiringhospitalisation until they are stabilised
Patients on anticoagulant therapywho suffer a PICH
Longer time taken to reverse effectsof anticoagulation
Assume anticoagulation would be stopped before CTscanning. Outcomes would be worse because there wouldbe a delay in reversing anticoagulation. This effect is difficultto quantify
continued

Health Technology Assessm
ent2004; Vol. 8: No. 1
97
© Q
ueen’s Printer and Controller of H
MSO
2004. All rights reserved.
TABLE 48 Incremental outcomes associated with the CT scanning strategies compared with the main comparator (withhold aspirin until after the CT scan) (cont’d)
CT scanning strategies Diagnosis Treatment Outcomes
Diagnosis of patients on antiplatelettherapy is made at 7 days rather than48 hours
Assume that antiplatelet therapywould be stopped until CT scan
Risk of an effect on outcomes. Loss of benefit:
Change in outcomes cerebral infarctions (IST)41–43:• 0.5% increase in recurrent or non-fatal strokes (0.6% in the
aspirin group versus 1.1% in the control group) • 0.2% increase in death without further stroke (2.6% in the
aspirin group versus 2.8% in the control group)• 0.6% increase in further stroke or death (3.8% in the aspirin
group versus 4.4% in the control group)
Change in outcomes for PICH:• 30% of PICH-TACS• Drainage• Loss of benefit (difficult to quantify effect on outcome, but may
result in better outcomes and prevent deaths in the acute phase)
Remaining patients are not scannedand it is assumed that they have had a cerebral infarction
Treat with aspirin Change in outcomes: • 10/2000 more deaths from incorrectly managed infections and
tumours. 80% of infections and 60–70% of tumours will die• PICH in a life-threatening condition due to cerebellar haematoma
and secondary hydrocephalus. The hydrocephalus will not bedrained and therefore patients will die as a result of lack of acutetreatment
• PICH patients in a non-life-threatening condition have anincreased risk of recurrent haemorrhagic stroke and an increasedrisk of death. Longer term actuarial risk of recurrent PICH insurvivors of PICH to 30 days was 7% per year in those not givenaspirin340 (OCSP). A 40% (30% to 50%) relative increase at 1 year in recurrent PICH was estimated if these patients weregiven aspirin a 20% relative increase in death and a 20–30%increase in dependency. A systematic review of stroke and strokesurvivors indicated that 4.3% of survivors have any recurrentstroke (CI 3.5% to 5.4%), 2.4% have a haemorrhagic stroke (CI1.9% to 2.7%) and there are 8.8% deaths per year (CI 5.2% to11.0%) (assuming aspirin was not given).122 If aspirin was giventhis would result in a 3.7% (2.7% to 3.8%) increase inhaemorrhagic stroke and a 12.3% (CI 7.3% to 15.4%) increasein deaths
continued

Cost-effectiveness of CT in stroke
98
TABLE 48 Incremental outcomes associated with the CT scanning strategies compared with the main comparator (withhold aspirin until after the CT scan) (cont’d)
CT scanning strategies Diagnosis Treatment Outcomes
11. Scan only patients with a life-threatening stroke oranticoagulants within 7 days ofadmission to hospital
30% of PICH-TACS Drainage is delayed from 48 hours to7 days
Loss of benefit:50% more will die and the remaining patients will notrecover
Patients in a life-threatening conditiondue to cerebellar haematoma,cerebral infarct and secondaryhydrocephalus
Drainage of hydrocephalus is delayedfrom 48 hours to 7 days
100% will die
Patients on anticoagulant therapywho suffer a PICH
Longer time taken to reverse effectsof anticoagulation
Assume anticoagulation would be stopped before CTscanning. Outcomes would be worse because there wouldbe a delay in reversing anticoagulation. This effect would bedifficult to quantify
Remaining patients are not scannedand it is assumed that they havesuffered a cerebral infarction
Treat with aspirin Change in outcomes: • 8/2000 more deaths from incorrectly managed infections
and tumours. 80% of infections and 60–70% of tumourswill die
• PICH patients in a non-life-threatening condition have anincreased risk of recurrent haemorrhagic stroke and anincreased risk of death. Longer term actuarial risk ofrecurrent PICH in survivors of PICH to 30 days was 7%per year in those not given aspirin340 (OCSP). A 40%(30% to 50%) relative increase at 1 year in recurrentPICH was estimated if these patients were given aspirin,a 20% relative increase in death and a 20–30% increasein dependency. A systematic review of stroke and strokesurvivors indicated that 4.3% of survivors have anyrecurrent stroke (CI 3.5% to 5.4%), 2.4% have ahaemorrhagic stroke (CI 1.9% to 2.7%) and these gave8.8% deaths per year (CI 5.2% to 11.0%) (assumingaspirin was not given).122 If aspirin was given this wouldresult in a 3.7% (2.7% to 3.8%) increase inhaemorrhagic stroke and a 12.3% (CI 7.3% to 15.4%)increase in deaths
continued

Health Technology Assessm
ent2004; Vol. 8: No. 1
99
© Q
ueen’s Printer and Controller of H
MSO
2004. All rights reserved.
TABLE 48 Incremental outcomes associated with the CT scanning strategies compared with the main comparator (withhold aspirin until after the CT scan) (cont’d)
CT scanning strategies Diagnosis Treatment Outcomes
12. Do not scan anyone It is assumed that patients havesuffered a cerebral infarction
Treat with aspirin Change in outcomes: • Longer term actuarial risk of recurrent PICH in survivors of PICH
to 30 days was 7% per year in those not given aspirin (OCSP).340
A 40% (30% to 50%) relative increase at 1 year in recurrentPICH was estimated if these patients were given aspirin, a 20%relative increase in death and a 20–30% increase in dependency.A systematic review of PICH and PICH survivors indicated that4.3% of survivors have any recurrent stroke (CI 3.5% to 5.4%),2.4% have a haemorrhagic stroke (CI 1.9% to 2.7%) and thereare 8.8% deaths per year (5.2% to 11.0%) (assuming aspirin wasnot given).122 If aspirin was given this would result in a 3.7% (CI2.7% to 3.8%) increase in haemorrhagic stroke and a 12.3% (CI7.3% to 15.4%) increase in deaths
• 10/2000 more deaths from incorrectly managed infections andtumours. 80% of infections and 60–70% of tumours will die
• Cerebral infarctions would have an immediate benefit, buthowever the benefit is small
Change in outcomes for PICH:• 30% of PICH-TACS• No drainage• 50% will die
• PICH on anticoagulantsThe effects of the anticoagulation would not be reversed and aspirinis administered
60–70% of patients would die
• Patients with a cerebellar haematoma or cerebral infarct andsecondary hydrocephalusThe hydrocephalus would not be drained
100% would die
• Patients in AFPatients who suffer a cerebral infarction receive aspirin and in thenext year have a 20% reduced risk of recurrent stroke. After 2weeks patients would receive anticoagulants and the risk ofrecurrent stroke would be reduced by 60% (i.e. a further 40%reduction compared with aspirin)
AF: atrial fibrillation.

SummaryThis section described the data required to modelthe cost-effectiveness of CT scanning. The datainclude the parameter estimates for the maindecision tree, outcomes and costs. The results ofthe cost-effectiveness analysis will be presentedlater in the chapter (p. 109).
Current provision of CT scanningfor stroke: questionnaire surveyof CT scanning departments inScotland linked to populationdistributionThe lack of detailed information on theavailability of CT for stroke has been highlightedabove. Radiology departments in Scotland weresurveyed to determine the current access to CTscanning for stroke patients by hospital and healthboard, highlight current and future potentialresource constraints, and determine whatadditional resource(s) would be required to scanall patients within 48 hours of stroke as specifiedin current guidelines,50 or to achieve the optimalCT strategy identified in this project if the latterwere different. The survey was also undertaken todetermine whether there were variations in accessto CT scanning in Scotland. The geography andpopulation distribution of Scotland provideexamples of most of the patterns of hospital andcommunity healthcare found elsewhere in the UK,so the results were considered to be relevant to therest of the UK.
MethodsA postal questionnaire to send to the clinicaldirectors of all radiology departments in Scotlandwas devised. The survey was developed by healtheconomists (JS, JC) and radiologists (JW, andconsultant neuroradiology colleagues Dr D Collieand Dr R Sellar), with the help of the ScottishRadiological Society. The survey (Appendices 6and 7) contained detailed questions regardingimaging equipment, including the number of CTscanners, type of scanner, year of installation, andwhether and when the scanner was used to scanstroke patients.
Access to CT scanning was assessed in severaldifferent ways:
� on the current operating hours for their CTscanning facilities: to overcome problemsassociated with seasonal variation anddifferences in the timing of when the surveyswere completed, respondents were asked todescribe the operating hours for a ‘typical week’in October 2000. Detailed information wasobtained on the number of sessions (defined asa half day), the length of sessions, the type ofpatients scanned in each session and theavailability of out-of-hours scanning. Thisinformation was collected for normal workinghours (09.00–17.00 hours Monday to Friday)and out-of-hours (17.00–09.00 hours Monday toFriday and during weekends);
� on CT scanning activity levels for the 1999calendar year, including the number of brain
Cost-effectiveness of CT in stroke
100
TABLE 49 Unit costs
Resources Unit cost (£) Source
CT scanningTeaching hospital
Normal working hours 42.90 (30.23–71.47) CT costing studya
Out of hours 79.35 (55.05–173.46) CT costing study
Large general hospital 1 (rural)Normal working hours 81.02 (71.44–89.56) CT costing studyOut of hours 126.36 (119.52–133.16) CT costing study
Large general hospital 2 (urban)Normal working hours 69.47 (58.73–84.58) CT costing studyOut of hours 72.57 (61.43–91.48) CT costing study
Cost per bed dayTeaching hospital 239 NHS ISD, 2000Large general hospital 217 NHS ISD, 2000Long-stay hospital 116 NHS ISD, 2000
a See Appendix 8 for details of CT scanning costs.

scans, the proportion of brain scans that wereundertaken for suspected stroke and theproportion of scans undertaken out of hours,and the waiting times for CT scanning strokepatients during normal working hours and outof hours;
� on the effect on the department if the demandfor CT scanning were increased: such effectsmight include introducing waiting lists,referring patients to another hospital for a scan,employing additional staff, out-of-hoursscanning and purchasing additional scanningequipment.
Additional questions were included on the accessto MR scanning for stroke patients during normalworking hours and out of hours. The availabilityof MR with diffusion and/or perfusion imagingwas also examined.
A list of Scottish Clinical Directors of Radiologywas obtained from the ISD, Scotland. Clinicaldirectors from 31 hospitals across 13 health boards were contacted and asked to complete thesurvey. Respondents were assured that theinformation they provided would be treated asconfidential and that responses would be reportedin such a way that individual hospitals could notbe identified. The surveys were initially sent inJanuary 2001, and a reminder letter and anadditional copy of the survey were sent 2 weekslater.
AnalysisThe data were entered into a database andanalysed using descriptive statistics. Access to CTscanning was also assessed in terms of timesrequired to travel by car for CT scanning. Drivetimes of 60, 90, 120 and 180 minutes wereexamined using the Geographical InformationService (GIS) software. An analysis was conductedusing ArcView 3.2a Network Analyst software todetermine the proportion of the total populationand the population ‘at risk’ of suffering a stroke(defined as those over the age of 65 years) whowere within 60, 90, 120 and 180 minutes’ drivetime of hospitals with CT scanners in Scotlandduring normal working hours. This analysis wasrepeated for access to CT scanning during out ofhours, Monday to Friday and weekend scanning.
Four data sets were constructed, listing eachhospital providing CT during normal workinghours, out of hours during Monday to Friday,during the weekend including stroke, and duringthe weekend but not for patients with stroke. Eachdata set also contained the geographical
coordinates (latitude and longitude) for eachhospital identified using an interactive mappingfacility (MultiMap, 2001, http://www.multimap.com).Population data from the 1991 Scottish Censusprovided by the General Registers Office ofScotland (GROS) were used in the analysis. Thetotal population in the analysis was 4,973,459.
Survey resultsAltogether, 29 of the 31 surveys (93.5%) werecompleted within the study period. Non-respondents were sent reminder letters and alsofollowed up by telephone over a 3 month period.After further follow-up, the remaining threesurveys were returned, giving a 100% sample.
Of the 31 respondents, 28 (90.3%) indicated thatCT scanning facilities were available in theirdepartment to scan stroke patients. Fourrespondents reported that there were two CTscanners in their department, although only oneof these was available for stroke patients. Threerespondents reported that CT scanning facilitieswere not available at their hospital; at each,patients with stroke were referred to anotherhospital for CT scanning, within a radius of 2–17miles.
On average, there were two CT scanners perhealth board in Scotland (range one to eightscanners in some areas. This in addition to theOrkneys and the Shetlands health boards, whereCT scanning is not available). The number of CTscanners per health board was also examined interms of the size of the population served by eachhealth board. Table 50 and Figure 12 indicate thenumber of CT scanners per 10,000 population byhealth board (National Health Service in ScotlandInformation and Statistics Division69). Healthboards had on average 0.085 CT scanners per10,000 population and a median of 0.060scanners per 10,000 population. The number ofCT scanners per 10,000 population ranged from0.047 in Argyll and Clyde to 0.363 in the Western Isles. The higher proportion of CTscanners per 10,000 population in the WesternIsles reflects both the remote geographicallocation of the hospital and the small population.Even excluding the Western Isles, there isconsiderable variation in access to CT betweenhealth boards, with almost twice as many CTscanners per 10,000 in the Borders and GreaterGlasgow as in the Highlands and Argyll andClyde.
Table 51 and Figure 13 illustrate the number of CTscanners per 1000 available staffed beds by health
Health Technology Assessment 2004; Vol. 8: No. 1
101
© Queen’s Printer and Controller of HMSO 2004. All rights reserved.

board (National Health Service in ScotlandInformation and Statistics Division69). Healthboards on average had 1.110 CT scanners per1000 available staffed beds and a median of 0.910CT scanners per 1000 beds. The number of CTscanners per 1000 beds ranged from 0.616 inArgyll and Clyde to 4.016 in the Western Isles.Again, excluding the Western Isles, there are twiceas many CT scanners per 1000 staffed beds in theBorders as in the Highlands, Tayside and Argylland Clyde.
The type of CT scanner varied: spiral (71%) andnon-spiral (29%) CT scanners had been installedbetween 1991 and 2001. The Highlands andWestern Isles were the only health boards withouta spiral CT scanner. A spiral scanner generally
operates more quickly, so that a routine brain scanas for stroke may take about half the time that anon-spiral scanner would take.
The access to CT scanning is reported in Table 52. During the week, there were a mean ofnine and a median of ten CT scanning sessionsper scanner, varying from five to ten sessions perweek. CT scanning was available for strokepatients in 92% of all sessions. Seventy per cent of scanning sessions were for a combinationof inpatients, outpatients and emergencies. CTscanners operated for an average of 37 hoursduring the week. However, this varied acrosshospitals from 20 to 58 hours. Out-of-hoursscanning was available in 20 hospitals (71%),Monday to Friday. Out-of-hours scanning was
Cost-effectiveness of CT in stroke
102
TABLE 50 Number of CT scanners per 10,000 population by health board in Scotland
Health board No. of CT Populationa 10,000 population CT scanners per scanners 10,000 population
1. Western Isles 1 27,560 2.756 0.3632. Borders 1 106,400 10.64 0.0943. Greater Glasgow 8 906,000 90.60 0.0884. Forth Valley 2 277,600 27.76 0.0725. Dumfries & Galloway 1 146,800 14.68 0.0686. Fife 2 349,200 34.92 0.0577. Grampian 3 525,300 52.53 0.0578. Ayrshire & Arran 2 374,600 37.46 0.0539. Lanarkshire 3 562,400 56.24 0.05310. Tayside 2 388,300 38.83 0.05211. Lothian 4 778,500 77.85 0.05112. Highlands 1 208,600 20.86 0.04813. Argyll & Clyde 2 425,600 42.56 0.047
a Source: National Health Service in Scotland Information and Statistics Division.69
0.00
Wes
tem Is
les
Border
s
Greate
r Glas
gow
Forth
Valley
Dunfri
es &
Gall
oway Fife
Grampia
n
Ayrshir
e & A
rran
Lana
rksh
ire
Taysi
de
Lothi
an
Highlan
ds
Argyll &
Clyd
e
0.05
0.10
0.15
0.20
0.25
0.30
0.35
0.40
FIGURE 12 Number of CT scanners per 10,000 population by health board in Scotland. Note: CT scanning is not available in eitherthe Orkney or Shetland Islands.

not available at all in four hospitals, and onehospital did not scan stroke patients outsidenormal operating hours during the week. From the geographical location of these hospitals, it would be possible for patients to betransferred to a nearby hospital for a CT scan ifnecessary.
Weekend scanning (Table 53) was available in atleast some capacity across 24 hospitals (78%). In42%, weekend scanning was limited to out ofhours and in 33% of hospitals it was restricted toemergencies only. There were ten hospitals inwhich CT scanning for stroke patients was notavailable during weekends. Most of these hospitalsare relatively close to other hospitals that doprovide weekend CT. At least one hospital in each
health board provides out-of-hours CT scanningMonday to Friday and during weekends. There isrestricted access to CT scanning facilities for strokepatients in the north-east of Scotland as there areno scanning facilities for suspected stroke patientsat weekends in either Grampian or Tayside, withno alternative imaging facilities within a realistictravelling distance.
Table 54 reports the activity data for each hospitalfor the calendar year 1999. Ninety-six per cent ofrespondents provided data on the total number ofCT scans and the number of brain CT scansundertaken during the period. Hospitals anddirectorates on average completed 4640 CT scansduring the period (range 730–11,300 scans). Onaverage, 45% of all CT scans were brain scans. On
Health Technology Assessment 2004; Vol. 8: No. 1
103
© Queen’s Printer and Controller of HMSO 2004. All rights reserved.
TABLE 51 Number of CT scanners per 1000 staffed hospital beds by health board in Scotland
Health board No. of CT Average no. of 1000 available CT scanners per scanners staffed beds staffed bedsa 1000 staffed beds
1. Western Isles 1 249 0.249 4.0162. Borders 1 690 0.690 1.4493. Greater Glasgow 8 7139 7.139 1.1214. Forth Valley 2 1867 1.867 1.0715. Dumfries & Galloway 1 982 0.982 1.0186. Fife 2 1984 1.984 1.0087. Ayrshire & Arran 2 2153 2.153 0.9298. Lothian 4 4537 4.537 0.8829. Lanarkshire 3 3600 3.600 0.83410. Grampian 3 3598 3.598 0.83311. Highlands 1 1426 1.426 0.70112. Tayside 2 3114 3.114 0.64213. Argyll & Clyde 2 3248 3.248 0.616
a Source: National Health Service in Scotland Information and Statistics Division.69
0.000.501.001.502.002.503.003.504.004.50
Wes
tem Is
les
Border
s
Greate
r Glas
gow
Forth
Valley
Dunfri
es &
Gall
oway Fife
Grampia
n
Ayrshir
e & A
rran
Lana
rksh
ire
Taysi
de
Lothi
an
Highlan
ds
Argyll &
Clyd
e
FIGURE 13 Number of CT scanners per 1000 available staffed hospital beds by health board in Scotland. Note: CT scanning is notavailable in either the Orkney or Shetland Islands.

average, 867 or 43% of all brain scans were forpatients suspected of having had a stroke. Thisproportion varied markedly from 7 to 80%between hospitals.
During 1999 an average of 528 CT brain scansper hospital were undertaken out of hours. Onaverage, 106 CT scans for stroke patients wereconducted out of hours per hospital (i.e. about twoper week); however, this varied considerably acrosshospitals, as some hospitals did not scan anystroke patients out of hours and another hospitalscanned 543 patients during the period. It shouldbe noted that these data were not always routinelycollected in all hospitals involved in the survey.Thus, respondents were encouraged to provideestimates based on the information they hadavailable.
Access to CT scanning was also examined byconsidering the time taken to provide scans forstroke patients (see Table 55). Thirty per cent ofhospitals reported that they could provide scanswithout difficulty to stroke patients admitted tohospital immediately on a weekday, comparedwith only 15% of hospitals that could provide a CT scan regardless of the day of the week.Seventy-seven per cent of respondents couldprovide CT scans within 24 hours during weekdays without difficulty, whereas 35% ofhospitals could provide scans within 24 hours at aweekend. Eighty-three per cent of hospitals couldpossibly provide CT scanning to stroke patientswithin 48 hours without difficulty, except atweekends, compared with 68% regardless of theday of the week. The survey did not specificallyrequest information on outpatient access forstroke.
Cost-effectiveness of CT in stroke
104
TABLE 52 Operating hours of CT scanning facilities amonghospitals in Scotland
CT scanning services
Weekly CT scanning (Monday–Friday)No. of sessions
Mean (SD) 9 (2)Range 5–10
Operating hours (hours)Mean (SD) 37 (7)Range 20–58
Type of patients scannedInpatients, outpatients and emergencies 19 (70.4%)Inpatients and outpatients 2 (7.7%)Type of patients varies 6 (23.1%)
CT scan stroke patientsYes 26 (92.9%)During some sessions 2 (7.1%)
Availability of out-of-hours CT scanningYes 20 (71.4%)Emergency only 3 (10.7%)Not available for stroke patients 1 (3.2%)No 4 (12.9%)
Weekend CT scanningAvailability of weekend scanning
Yes 24 (77.5%)No 4 (15.4%)
Type of patients scannedOut of hours only 10 (41.7%)Emergencies 8 (33.3%)Other 6 (25.0%)
Availability of CT scanning for stroke patientsYes 10 (41.7%)Some sessions 3 (12.5%)Yes if suspected bleed 1 (4.2%)No 10 (41.7%)
Availability of ‘out of hours’ CT scanningYes 10 (83.3%)Yes, but not available for stroke 2 (8.3%)Sometimes 1 (3.2%)No 1 (3.2%)
TABLE 53 Availability of weekend CT scanning facilities by health boards in Scotland
Health board Out-of-hours CT scanning Weekend CT scanning Weekend CT scanning Monday–Friday for suspected stroke
1. Ayrshire & Arran � � �2. Borders � � �3. Argyll & Clyde � � �4. Fife � � �5. Greater Glasgow � � �6. Highlands � � �7. Lanarkshire � � �8. Grampian � � ✗9. Lothian � � �10. Tayside � � �11. Forth Valley � � ✗12. Western Isles � � �13. Dumfries & Galloway � � �

The question on what percentage workloadincrease would lead to actions such as increasingthe waiting time or employing more staff was notwell answered. When asked what increase inworkload would lead to a waiting list of more than4 weeks, several departments said that the waitinglist was already more than 7 weeks. On thepossibility of referral to another hospital, severalhospitals said that this was not an option and onethat it was already happening. The medianincrease in workload that respondents said wouldlead to additional radiographic staff (34%) orradiologists (30%) was inconsistent with the manycomments received to the effect that mostdepartments had at least one unfilled radiologistpost and that the radiographers were alreadyworking to capacity. This suggests that thequestion was interpreted as ‘what increase inworkload would be required to convince thehospital managers to employ more radiographersor radiologists’, which is different to what wasactually asked, which was ‘what increase inworkload would lead to the need for more staff?’As many departments were already working at thecapacity of the available funding, and in a climatewhere there are insufficient radiologists to fillexisting posts (45% said that they requiredadditional radiologists now), some of thesehypothetical questions may have seemed ratherredundant.
GIS analysisThe proportion of the total population within 60,90, 120 and 180 minutes’ drive time from CTscanning facilities is reported in Table 56. Theproportion of the population aged 65 years and
over within 60, 90, 120 and 180 minutes’ drivetime from CT scanning facilities is reported inTable 57.
Figure 14 presents areas within 180 minutes drive time from hospitals with CT scanning
Health Technology Assessment 2004; Vol. 8: No. 1
105
© Queen’s Printer and Controller of HMSO 2004. All rights reserved.
TABLE 54 Timing of CT scans for patients suspected of having suffered a stroke
Timing of CT scanning to patients suspected of having suffered n Yes Yes, Noa stroke (%) with difficulty (%) (%)
Provide CT scans immediately to suspected stroke patients on 27 30 52 19weekdays?
Provide CT scans immediately to suspected stroke patients on 26 15 30 58weekends?
Provide CT scans within 24 hours to suspected stroke patients on 26 77 23 0weekdays?
Provide CT scans within 24 hours to suspected stroke patients on 26 35 27 39weekends?
Provide CT scans within 48 hours to suspected stroke patients 25 68 16 16regardless of the day of the week?
Provide CT scans within 48 hours to suspected stroke patients except 24 83 4 8at weekends?
Provide CT scans within 7 days to suspected stroke patients? 25 100 0 0
Provide CT scans within 14 days to suspected stroke patients? 25 100 0 0
TABLE 55 Activity data 1999 calendar year
CT scans No. of scans
Total no. of CT scansn 27Mean (SD) 4,640 (2,342)Minimum 730Maximum 11,300
No. of brain CT scansn 27Mean (SD) 2,096 (1,551)Minimum 366Maximum 6,004
No. of CT scan undertaken ‘out of hours’n 24Mean (SD) 528 (668)Minimum 0Maximum 2,840
No. of CT brain scans for patients suspected of having suffered a stroke
n 22Mean (SD) 867 (544)Minimum 81Maximum 1,840
No. of CT scans for stroke patients undertaken ‘out of hours’
n 19Mean (SD) 106 (166)Minimum 0Maximum 543
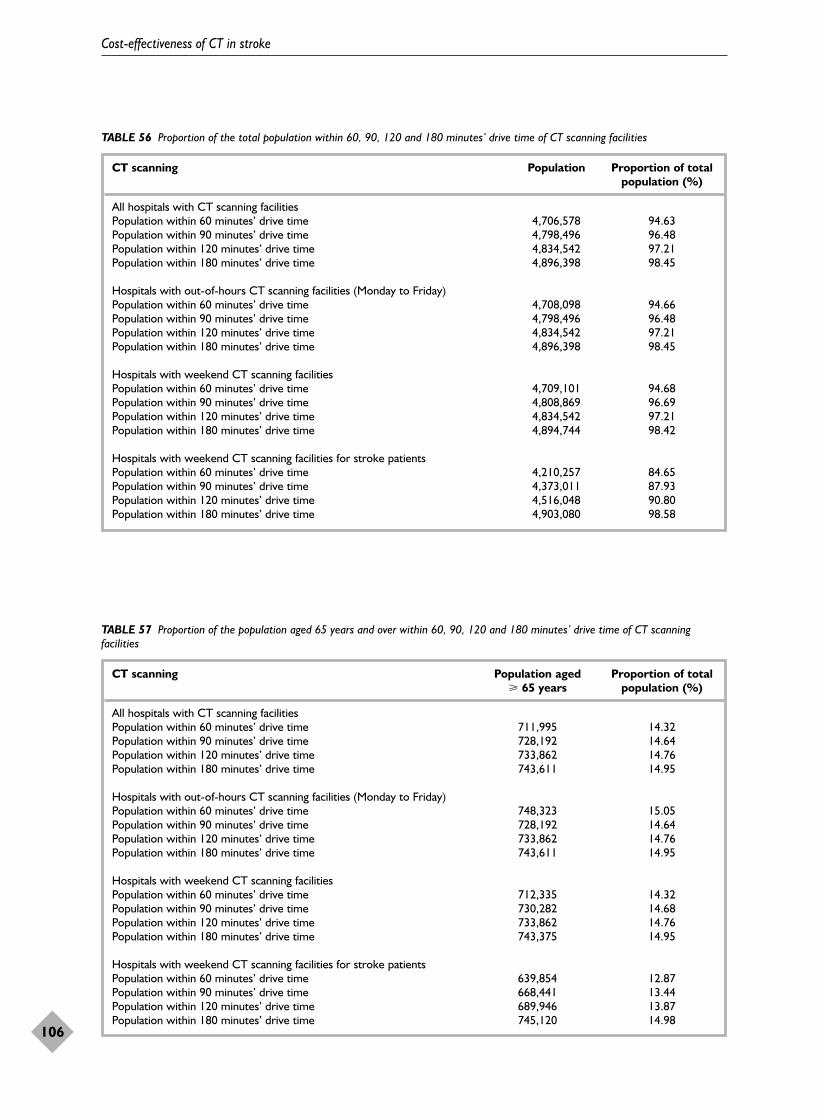
Cost-effectiveness of CT in stroke
106
TABLE 56 Proportion of the total population within 60, 90, 120 and 180 minutes’ drive time of CT scanning facilities
CT scanning Population Proportion of total population (%)
All hospitals with CT scanning facilitiesPopulation within 60 minutes’ drive time 4,706,578 94.63Population within 90 minutes’ drive time 4,798,496 96.48Population within 120 minutes’ drive time 4,834,542 97.21Population within 180 minutes’ drive time 4,896,398 98.45
Hospitals with out-of-hours CT scanning facilities (Monday to Friday)Population within 60 minutes’ drive time 4,708,098 94.66Population within 90 minutes’ drive time 4,798,496 96.48Population within 120 minutes’ drive time 4,834,542 97.21Population within 180 minutes’ drive time 4,896,398 98.45
Hospitals with weekend CT scanning facilitiesPopulation within 60 minutes’ drive time 4,709,101 94.68Population within 90 minutes’ drive time 4,808,869 96.69Population within 120 minutes’ drive time 4,834,542 97.21Population within 180 minutes’ drive time 4,894,744 98.42
Hospitals with weekend CT scanning facilities for stroke patientsPopulation within 60 minutes’ drive time 4,210,257 84.65Population within 90 minutes’ drive time 4,373,011 87.93Population within 120 minutes’ drive time 4,516,048 90.80Population within 180 minutes’ drive time 4,903,080 98.58
TABLE 57 Proportion of the population aged 65 years and over within 60, 90, 120 and 180 minutes’ drive time of CT scanningfacilities
CT scanning Population aged Proportion of total � 65 years population (%)
All hospitals with CT scanning facilitiesPopulation within 60 minutes’ drive time 711,995 14.32Population within 90 minutes’ drive time 728,192 14.64Population within 120 minutes’ drive time 733,862 14.76Population within 180 minutes’ drive time 743,611 14.95
Hospitals with out-of-hours CT scanning facilities (Monday to Friday)Population within 60 minutes’ drive time 748,323 15.05Population within 90 minutes’ drive time 728,192 14.64Population within 120 minutes’ drive time 733,862 14.76Population within 180 minutes’ drive time 743,611 14.95
Hospitals with weekend CT scanning facilitiesPopulation within 60 minutes’ drive time 712,335 14.32Population within 90 minutes’ drive time 730,282 14.68Population within 120 minutes’ drive time 733,862 14.76Population within 180 minutes’ drive time 743,375 14.95
Hospitals with weekend CT scanning facilities for stroke patientsPopulation within 60 minutes’ drive time 639,854 12.87Population within 90 minutes’ drive time 668,441 13.44Population within 120 minutes’ drive time 689,946 13.87Population within 180 minutes’ drive time 745,120 14.98

facilities during normal working hours. This shows that despite Scotland having ageographically dispersed community, the majority of the population live within 3 hours’drive of a CT scanner. Figure 15, however, shows that access depends on the day of the week on which the stroke occurs, as fewer hospitals are able to provide weekend scanning for stroke.
SummaryNinety per cent of Scottish radiology directorateshave at least one CT scanner, and no hospitalwithout a CT scanner was more than 32 km (20miles) from a hospital that did have a CT scanner.However, there is considerable variation in thenumber of CT scanners per population and perinpatient bed, being lowest in Argyll and Clyde(0.62 CT scanners per 1000 beds) and highest in
Health Technology Assessment 2004; Vol. 8: No. 1
107
© Queen’s Printer and Controller of HMSO 2004. All rights reserved.
Hospitals with CT scanners
180 minutes drive time boundary
Areas outside drive time boundary
FIGURE 14 Areas within 180 minutes drive time of a CT scanner during normal working hours
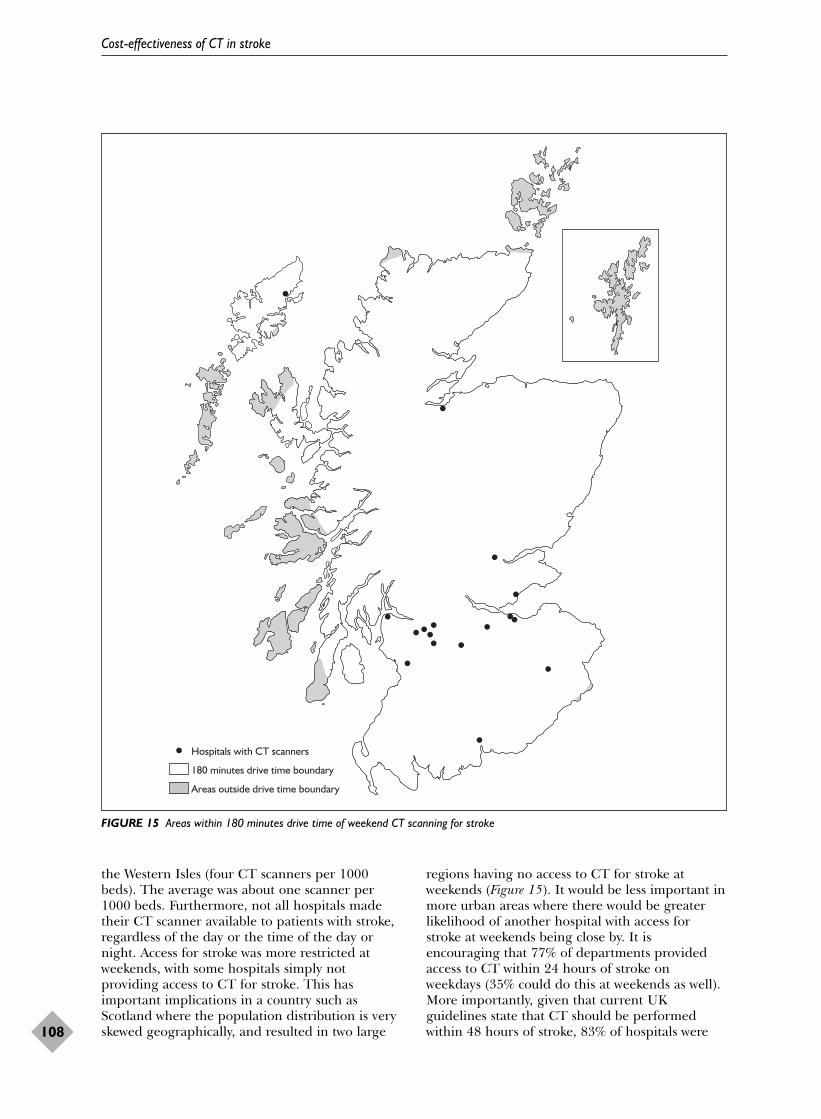
the Western Isles (four CT scanners per 1000beds). The average was about one scanner per1000 beds. Furthermore, not all hospitals madetheir CT scanner available to patients with stroke,regardless of the day or the time of the day ornight. Access for stroke was more restricted atweekends, with some hospitals simply notproviding access to CT for stroke. This hasimportant implications in a country such asScotland where the population distribution is veryskewed geographically, and resulted in two large
regions having no access to CT for stroke atweekends (Figure 15). It would be less important inmore urban areas where there would be greaterlikelihood of another hospital with access forstroke at weekends being close by. It isencouraging that 77% of departments providedaccess to CT within 24 hours of stroke onweekdays (35% could do this at weekends as well).More importantly, given that current UKguidelines state that CT should be performedwithin 48 hours of stroke, 83% of hospitals were
Cost-effectiveness of CT in stroke
108
Hospitals with CT scanners
180 minutes drive time boundary
Areas outside drive time boundary
FIGURE 15 Areas within 180 minutes drive time of weekend CT scanning for stroke

able to provide CT for stroke on weekdays withinthis period (68% at weekends as well). However,currently only 30% could provide immediatescanning for stroke on weekdays, and only 15% atweekends. Although there are several barriers tomore patients being scanned more quickly, thesingle most frequently mentioned factor was lackof radiologists.
Results of the analysis of thecost-effectiveness model for CTscanning, and sensitivity analysesAdditional assumptionsThe following analysis was conducted for a cohortof 1000 patients aged between 70 and 74 years.The analysis will be repeated for all other agegroups in the final version of this report. It shouldalso be noted that the modelling of functionaloutcomes in the preliminary analysis is based onoutcome data at 24 months. Variation in outcomesbetween the time of stroke and 6 months, 6–12months and 12–24 months will be incorporated inthe subsequent analyses. The final assumptionmade in the present analysis is that the utilityweights for all non-stroke diagnoses are equal to 1(many would argue that being diagnosed as havinga brain tumour would not equate to a utilityweight of 1, and the effect of other utility weightsfor the tiny proportion of patients with tumours orinfections on QALYs will be determined insensitivity analyses). Thus, many sensitivityanalyses are still to be undertaken on the results ofthis final analysis. At this stage robustness of the
results is limited to examining the impact ofvarying the cost of CT scanning on the results.
Costs and outcomes associated withthe 12 CT scanning strategies forpatients suspected of having suffered astrokeThe cost-effectiveness of the CT scanningstrategies was estimated by assessing theincremental costs and outcomes of each strategycompared with the main comparator (i.e. CT scanall patients suspected of having suffered a strokewithin 48 hours). For the majority of patients (i.e.the 80% with ischaemic stroke and most of the 15%with haemorrhagic stroke), it was possible to useevidence from the published literature andsecondary data sources. However, data were lackingfor tumours, some PICH issues and infection, sofor a minority of patients this analysis was largelybased on expert clinical opinion extrapolatingfrom the available literature and experience.
CostsThe cost of CT scanning was assessed for the maincomparator and each of the scanning strategies.Figure 16 illustrates the proportion of patientsscanned during normal working hours and out ofhours, and those not scanned at all for each of the12 scanning strategies. In strategies S10, S11 andS12, a proportion of patients did not receive a CTscan. Of the remaining strategies, the proportionof patients scanned during normal working hoursvaried from 23.8 to 89.7% and the proportion ofpatients scanned out of hours ranged from 23.8 to76.2%.
Health Technology Assessment 2004; Vol. 8: No. 1
109
© Queen’s Printer and Controller of HMSO 2004. All rights reserved.
0
Patie
nts
(%)
Compa
rato
r S1 S2 S3 S4 S5 S6 S7 S8 S9 S10
S11
S12
10
20
30
40
50
60
70
80
90
100
FIGURE 16 Proportion of patients scanned during normal working hours ( ), out of hours ( ) and not scanned at all ( ) for thecomparator and the 12 CT scanning strategies
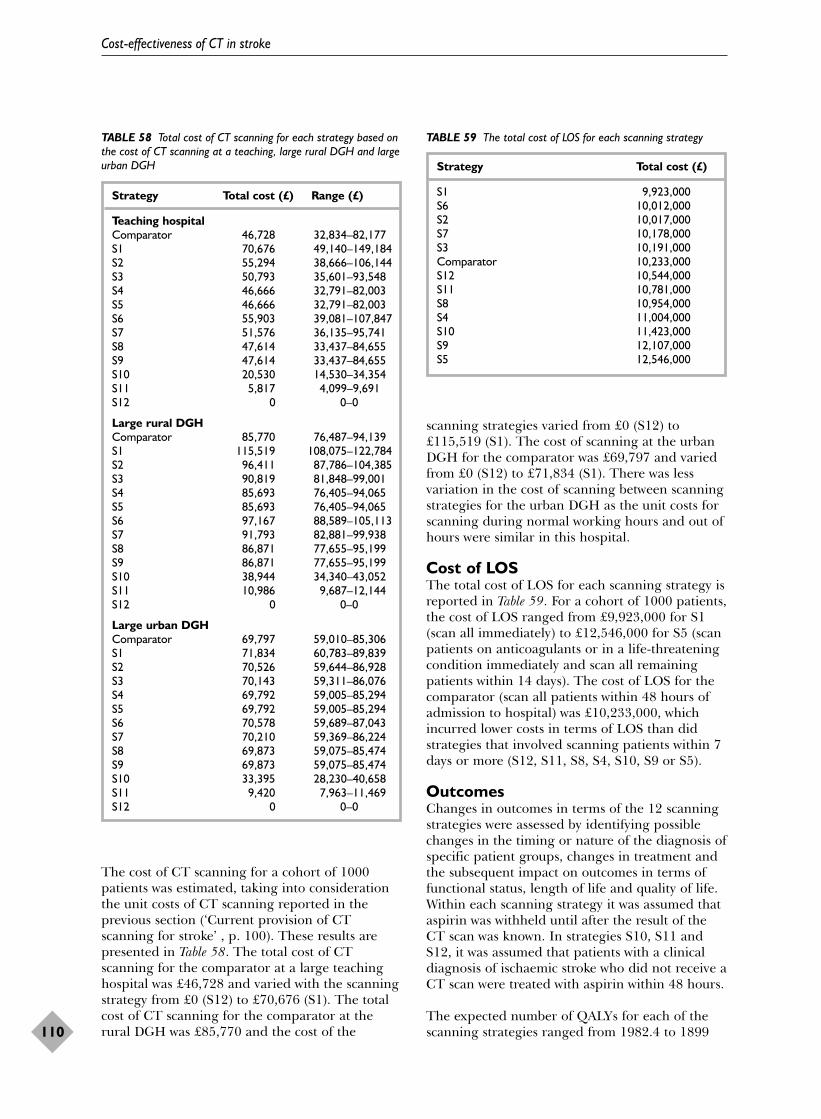
The cost of CT scanning for a cohort of 1000patients was estimated, taking into considerationthe unit costs of CT scanning reported in theprevious section (‘Current provision of CTscanning for stroke’ , p. 100). These results arepresented in Table 58. The total cost of CTscanning for the comparator at a large teachinghospital was £46,728 and varied with the scanningstrategy from £0 (S12) to £70,676 (S1). The totalcost of CT scanning for the comparator at therural DGH was £85,770 and the cost of the
scanning strategies varied from £0 (S12) to£115,519 (S1). The cost of scanning at the urbanDGH for the comparator was £69,797 and variedfrom £0 (S12) to £71,834 (S1). There was lessvariation in the cost of scanning between scanningstrategies for the urban DGH as the unit costs forscanning during normal working hours and out ofhours were similar in this hospital.
Cost of LOSThe total cost of LOS for each scanning strategy isreported in Table 59. For a cohort of 1000 patients,the cost of LOS ranged from £9,923,000 for S1(scan all immediately) to £12,546,000 for S5 (scanpatients on anticoagulants or in a life-threateningcondition immediately and scan all remainingpatients within 14 days). The cost of LOS for thecomparator (scan all patients within 48 hours ofadmission to hospital) was £10,233,000, whichincurred lower costs in terms of LOS than didstrategies that involved scanning patients within 7days or more (S12, S11, S8, S4, S10, S9 or S5).
OutcomesChanges in outcomes in terms of the 12 scanningstrategies were assessed by identifying possiblechanges in the timing or nature of the diagnosis ofspecific patient groups, changes in treatment andthe subsequent impact on outcomes in terms offunctional status, length of life and quality of life.Within each scanning strategy it was assumed thataspirin was withheld until after the result of theCT scan was known. In strategies S10, S11 andS12, it was assumed that patients with a clinicaldiagnosis of ischaemic stroke who did not receive aCT scan were treated with aspirin within 48 hours.
The expected number of QALYs for each of thescanning strategies ranged from 1982.4 to 1899
Cost-effectiveness of CT in stroke
110
TABLE 59 The total cost of LOS for each scanning strategy
Strategy Total cost (£)
S1 9,923,000S6 10,012,000S2 10,017,000S7 10,178,000S3 10,191,000Comparator 10,233,000S12 10,544,000S11 10,781,000S8 10,954,000S4 11,004,000S10 11,423,000S9 12,107,000S5 12,546,000
TABLE 58 Total cost of CT scanning for each strategy based onthe cost of CT scanning at a teaching, large rural DGH and largeurban DGH
Strategy Total cost (£) Range (£)
Teaching hospitalComparator 46,728 32,834–82,177S1 70,676 49,140–149,184S2 55,294 38,666–106,144S3 50,793 35,601–93,548S4 46,666 32,791–82,003S5 46,666 32,791–82,003S6 55,903 39,081–107,847S7 51,576 36,135–95,741S8 47,614 33,437–84,655S9 47,614 33,437–84,655S10 20,530 14,530–34,354S11 5,817 4,099–9,691S12 0 0–0
Large rural DGHComparator 85,770 76,487–94,139S1 115,519 108,075–122,784S2 96,411 87,786–104,385S3 90,819 81,848–99,001S4 85,693 76,405–94,065S5 85,693 76,405–94,065S6 97,167 88,589–105,113S7 91,793 82,881–99,938S8 86,871 77,655–95,199S9 86,871 77,655–95,199S10 38,944 34,340–43,052S11 10,986 9,687–12,144S12 0 0–0
Large urban DGHComparator 69,797 59,010–85,306S1 71,834 60,783–89,839S2 70,526 59,644–86,928S3 70,143 59,311–86,076S4 69,792 59,005–85,294S5 69,792 59,005–85,294S6 70,578 59,689–87,043S7 70,210 59,369–86,224S8 69,873 59,075–85,474S9 69,873 59,075–85,474S10 33,395 28,230–40,658S11 9,420 7,963–11,469S12 0 0–0
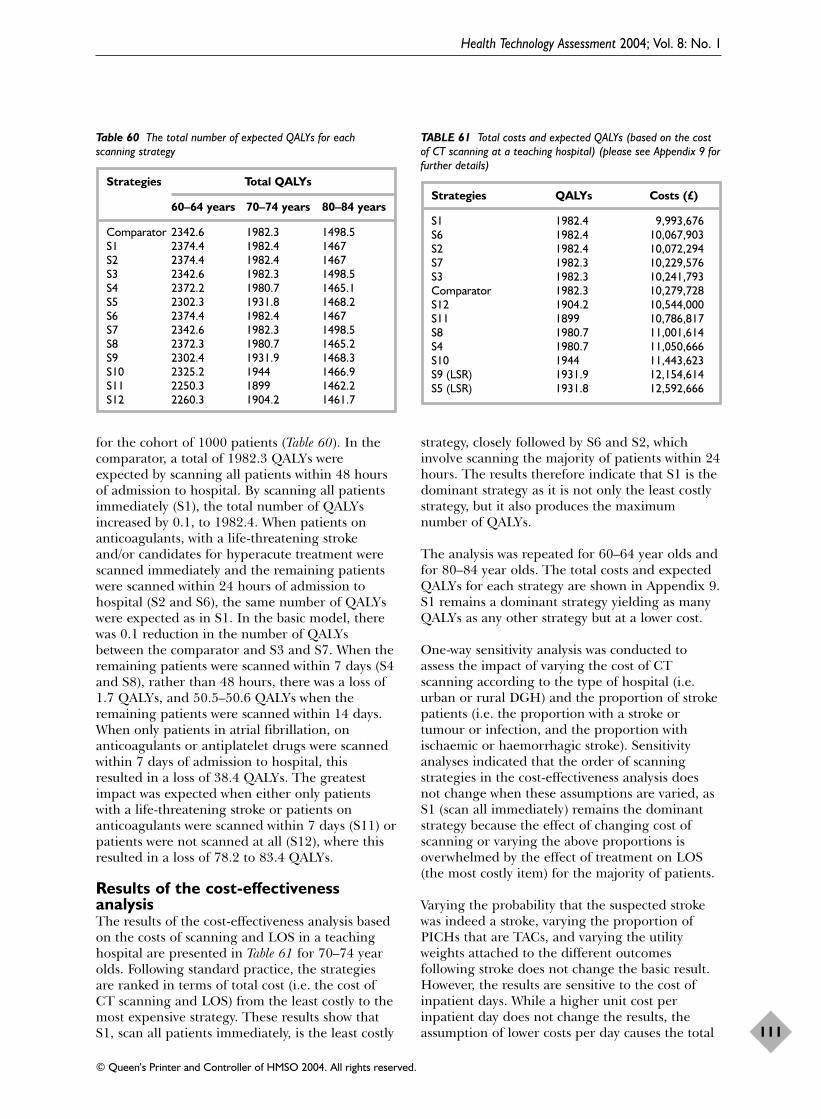
for the cohort of 1000 patients (Table 60). In thecomparator, a total of 1982.3 QALYs wereexpected by scanning all patients within 48 hoursof admission to hospital. By scanning all patientsimmediately (S1), the total number of QALYsincreased by 0.1, to 1982.4. When patients onanticoagulants, with a life-threatening strokeand/or candidates for hyperacute treatment werescanned immediately and the remaining patientswere scanned within 24 hours of admission tohospital (S2 and S6), the same number of QALYswere expected as in S1. In the basic model, therewas 0.1 reduction in the number of QALYsbetween the comparator and S3 and S7. When theremaining patients were scanned within 7 days (S4and S8), rather than 48 hours, there was a loss of1.7 QALYs, and 50.5–50.6 QALYs when theremaining patients were scanned within 14 days.When only patients in atrial fibrillation, onanticoagulants or antiplatelet drugs were scannedwithin 7 days of admission to hospital, thisresulted in a loss of 38.4 QALYs. The greatestimpact was expected when either only patientswith a life-threatening stroke or patients onanticoagulants were scanned within 7 days (S11) orpatients were not scanned at all (S12), where thisresulted in a loss of 78.2 to 83.4 QALYs.
Results of the cost-effectivenessanalysisThe results of the cost-effectiveness analysis basedon the costs of scanning and LOS in a teachinghospital are presented in Table 61 for 70–74 yearolds. Following standard practice, the strategiesare ranked in terms of total cost (i.e. the cost ofCT scanning and LOS) from the least costly to themost expensive strategy. These results show thatS1, scan all patients immediately, is the least costly
strategy, closely followed by S6 and S2, whichinvolve scanning the majority of patients within 24hours. The results therefore indicate that S1 is thedominant strategy as it is not only the least costlystrategy, but it also produces the maximumnumber of QALYs.
The analysis was repeated for 60–64 year olds andfor 80–84 year olds. The total costs and expectedQALYs for each strategy are shown in Appendix 9.S1 remains a dominant strategy yielding as manyQALYs as any other strategy but at a lower cost.
One-way sensitivity analysis was conducted toassess the impact of varying the cost of CTscanning according to the type of hospital (i.e.urban or rural DGH) and the proportion of strokepatients (i.e. the proportion with a stroke ortumour or infection, and the proportion withischaemic or haemorrhagic stroke). Sensitivityanalyses indicated that the order of scanningstrategies in the cost-effectiveness analysis doesnot change when these assumptions are varied, asS1 (scan all immediately) remains the dominantstrategy because the effect of changing cost ofscanning or varying the above proportions isoverwhelmed by the effect of treatment on LOS(the most costly item) for the majority of patients.
Varying the probability that the suspected strokewas indeed a stroke, varying the proportion ofPICHs that are TACs, and varying the utilityweights attached to the different outcomesfollowing stroke does not change the basic result.However, the results are sensitive to the cost ofinpatient days. While a higher unit cost perinpatient day does not change the results, theassumption of lower costs per day causes the total
Health Technology Assessment 2004; Vol. 8: No. 1
111
© Queen’s Printer and Controller of HMSO 2004. All rights reserved.
TABLE 61 Total costs and expected QALYs (based on the costof CT scanning at a teaching hospital) (please see Appendix 9 forfurther details)
Strategies QALYs Costs (£)
S1 1982.4 9,993,676S6 1982.4 10,067,903S2 1982.4 10,072,294S7 1982.3 10,229,576S3 1982.3 10,241,793Comparator 1982.3 10,279,728S12 1904.2 10,544,000S11 1899 10,786,817S8 1980.7 11,001,614S4 1980.7 11,050,666S10 1944 11,443,623S9 (LSR) 1931.9 12,154,614S5 (LSR) 1931.8 12,592,666
Table 60 The total number of expected QALYs for eachscanning strategy
Strategies Total QALYs
60–64 years 70–74 years 80–84 years
Comparator 2342.6 1982.3 1498.5S1 2374.4 1982.4 1467S2 2374.4 1982.4 1467S3 2342.6 1982.3 1498.5S4 2372.2 1980.7 1465.1S5 2302.3 1931.8 1468.2S6 2374.4 1982.4 1467S7 2342.6 1982.3 1498.5S8 2372.3 1980.7 1465.2S9 2302.4 1931.9 1468.3S10 2325.2 1944 1466.9S11 2250.3 1899 1462.2S12 2260.3 1904.2 1461.7

cost of S1 to fall but not as rapidly as the fall inthe total cost of some other strategies (Table 62).However, even if inpatient costs per day are 5%lower than assumed in the base case S1 continuesto be the dominant strategy. However, if the costper day is lower than this, S1 ceases to cost lessthan the comparator and because of the very smallexpected difference in QALYs the incremental costper QALY of scanning all immediately risesrapidly.
Interpretation of the results of thecost-effectiveness analysisThe analyses indicate that strategy S1, scan allpatients immediately, is the dominant option. Thecosts in terms of CT scanning are highest for thisoption since it requires greater use of more costlyout-of-hours scanning. However, these higher costsare offset by savings in the length of inpatient stay.Given the cost per inpatient bed day used in thebase case, it would require the costs of out-of-hours scanning to rise markedly in order to offsetthese savings.
If the cost of the delayed scanning options wassignificantly lower than assumed currently in themodel, for example, if delayed scanning was notassociated with significantly longer inpatient stays,then in principle a situation could arise wheredelayed scanning strategies cost less than strategyS1. Then S1 would no longer be the dominantoption and it would be possible to calculate
incremental cost-effectiveness ratios that measuredthe cost-effectiveness of early scanning optionscompared with delayed scanning options. However,as the evidence for the majority of patients in themodel (i.e. the vast majority with ischaemic stroke)is good (the effects of aspirin, anticoagulants andthrombolysis are supported by reasonably robustdata), it is unlikely that the LOS effects are veryinaccurate. Furthermore a sensitivity analysis of theeffect of varying the assumption about the effect ofdelay to CT scanning on time to starting aspirintreatment did not alter the dominance of strategyS1 (Appendix 9).
The sensitivity analysis indicates that these basicfindings are robust with respect to severalassumptions. However, the sensitivity of the resultswith respect to the cost per inpatient day wasmarked. This suggests that further work iswarranted on the inpatient costs of stroke patients.The unusual sensitivity of the incremental cost-effectiveness estimates is largely a product of thevery small difference in outcome between astrategy of scanning all immediately and one ofscanning all within 48 hours of admission tohospital. As the majority of patients haveischaemic stroke, the main treatment is aspirinand there is no good evidence of a time-dependency of the effect of aspirin up to 48 hoursafter stroke, it is perhaps not surprising that thedifference between S1 and the comparator issensitive to the cost of inpatient care.
Cost-effectiveness of CT in stroke
112
TABLE 62 Incremental cost-effectiveness and the cost per inpatient day (please see Appendix 9 for further details)
Comparator Strategy S1
QALYs COSTS QALYs COSTS Incremental cost (£million) (£million) per QALY (£million)
Base case cost per day 1982.3 10.280 1982.4 9.994 S1 dominantCost per day 5% lower 1982.3 9.763 1982.4 9.738 S1 dominantCost per day 10% lower 1982.3 9.246 1982.4 9.482 2.359Cost per day 15% lower 1982.3 8.746 1982.4 9.230 4.839Cost per day 20% lower 1982.3 8.231 1982.4 8.976 7.449

Robustness of the conclusionsFor the vast majority of patients to whom thepresent work applies – that is the 80% or so ofpatients with ischaemic stroke – sound evidencehas been used to determine the effect of CTscanning on LOS, QALYs, and so the cost-effectiveness of CT scanning. The data on theeffect of aspirin on functional outcome wereobtained from 40,000 patients randomised in thetwo largest ever acute stroke trials, IST andCAST.41,42 The data on LOS for patients withdifferent subtypes of stroke, and severities, inrelation to their functional outcome came from alarge UK stroke registry collected over 10 years,linked to Scottish national hospital dischargestatistics. The data on quality of life came from astudy of patients who had been randomised in theIST in the UK conducted before the present study,and linked to the investigators’ hospital strokeregistry. Although the literature on imaging isweak and often difficult to access and summarise,the data on accuracy of CT scanning were basedon the totality of the evidence and 20 years ofexperience with this widely used technique. Wheredata were lacking, for example in the duration oftime that a haemorrhage might be discernible assuch on CT, new data were obtained to use in themodel. The researchers also relied heavily onexpert opinion and drew on extensive experienceof patterns of management of stroke and commondiagnostic and treatment problems faced in caringfor stroke in producing the model and the rangeof strategies for use of CT, and on extensiveexperience in health economics evaluations in thedesign and development of the model.
The data on cost of CT scanning were obtainedfrom three different sorts of hospitals and wereextremely detailed to reflect the opportunity costsof the procedure both in and out of normalworking hours. A range of costs were obtainedbased on a range of times taken to do a CT brainscan, depending on the ease or difficulty ofmoving the patient into the scanner and theduration of scanning, so as to provide a range ofcosts to which other hospitals elsewhere couldrelate. These costs provide suitably stylised casesagainst which healthcare providers in other parts
of the UK or elsewhere can compare their costs ofCT scanning for stroke.
Further sensitivity analyses show that for themajority of patients (the 80% with ischaemicstroke), the model and data are robust. Thesensitivity analyses have addressed the effect ofvarying the cost of CT scanning and bedoccupancy according to the type of hospital,patient age, the proportion with actual stroke, theproportion with a severe PICH, the sensitivity andspecificity of CT for differentiating an infarct froma haemorrhage, the specificity of CT indifferentiating a vascular lesion from a tumour orother non-vascular lesion, different utility weights,altering assumptions about delays to startingaspirin while waiting for a scan, and the unit costof LOS to determine whether any of these wouldalter the optimal strategy from ‘scan allimmediately’. This shows that, with one exception,the order of strategies remains the same, as theLOS and cost of bed occupancy so considerablyoutweigh the cost of CT scanning, even when mostof the scanning has to be done out of hours. Thisholds true even for the patients in the minoritygroups, such as the 15% or so with PICH or the4% or so with tumours presenting as a stroke, forwhom the data were in general much less robust.The one exception is lowering the unit cost ofLOS. A reduction in the unit cost of LOS by 10%or more changes the ranking of scanningstrategies because the ‘comparator’ becomes lessexpensive than ‘scan all immediately’ though atthe expense of a reduction in QALYs. The fact that the model is so sensitive to changes in unit cost of LOS suggests that further research is needed into costs of individualcomponents of LOS.
It is notable that the LOS is much shorter forpatients who achieved independence at 6 monthscompared with those who were dependent. Thus amarginal shift in the proportion of patients fromdependency to independency would have amarked effect on total LOS and hence on the costof inpatient care.
Have we failed to achieve any of the aims in theoriginal application? The aims were to resolveissues of whether CT is cost-effective or not;
Health Technology Assessment 2004; Vol. 8: No. 1
113
© Queen’s Printer and Controller of HMSO 2004. All rights reserved.
Chapter 6
Discussion
outline a variety of strategies from which healthcommissioners could choose that which best suitstheir local resources; give clear estimates infinancial and population terms of the cost of thesedifferent strategies; and determine in whichparticular patients the even more expensiveresource of MR is worth using. We believe that thestudy has accomplished all of those, some ingreater detail than originally intended. Forexample, detailed information was obtained of theavailability of CT and MR for stroke in the wholeof Scotland and on the costs of CT at differenttimes of the day, and it was established that CTwill miss small haemorrhages as early as 8 daysafter stroke, and thus that the proportion of strokedue to PICH has probably been underestimated inepidemiological studies. The model developed inthe cost-effectiveness analysis based on systematicreviews, and clinical expertise, could potentially beadapted by others to explore specific subquestionsor subpopulations now, or used in the future toassess new healthcare directions.
We have examined first stroke only, not recurrentstroke, although the model could be used to assessthe cost effectiveness of CT in recurrent stroke byaltering some of the probabilities at the nodes inthe decision tree, as the nodes themselves wouldremain the same. However there was a lack of dataon proportion of different types of recurrentstroke, outcomes, and so forth that precludeduseful analysis at this time.
We have obtained data on availability of MR andthe cost of substituting MR for CT in certaincircumstances could be determined using themodel if detailed costs for MR were available.These were not available at the time of the study,nor did we have time to obtain detailed costs.However, in general MR is more expensive than CT.
We have concentrated on the cost effectiveness ofCT scanning in patients admitted to hospital aftera stroke, as the majority (about 80%) are admittedand create the major burden of disease. Those notadmitted to hospital in general are milder strokes.
Difficulties in undertaking thisworkThe absence of data on treatment in some areaswas very frustrating and we accept that thereliability of estimates based on expert clinicalopinion for some treatment effects may be of
concern. However, it is hoped that the sensitivityanalyses should cover these deficiencies. But, for avery common disease such as stroke (an averageDGH will admit one or two patients with strokeper day) the absence of data on some commonmanagement problems was lamentable (seebelow).
The imaging literature is acknowledged to be poorand biased; it is also difficult to search reliably andto extract data from the primary publications.With the introduction of each new technique,there is usually a flurry of publications stating theapparent advantages of the new technique overthe existing ones, with small sample sizes,inadequate blinding (and other methodology) andhence optimistic claims regarding the sensitivityand specificity of the technique. Publication biasfor positive studies is common. Studies withnegative (or just less optimistic) results struggle forpublication against the referees’ claims that theresearchers ‘used the wrong machine’ or ‘used thewrong technique’, rather than accepting that thetechnique may not be as good as its earlyproponents had suggested. It is thus virtuallyimpossible to obtain an accurate assessment of theperformance of a technique in routine clinicalpractice from the literature. We therefore had toextract what we could on the accuracy of CT andMRI but interpret it with caution. However,fortunately in the case of CT in stroke and thedifferentiation of infarct from haemorrhage thereis little problem soon after stroke and so the dataand assumptions in the model are valid; and realdata from a study of 232 patients bridged the gapin knowledge of when small haemorrhages are nolonger visible as such on CT.
A multitude of data sources were used to obtaindata on the incidence of different subtypes ofstroke, diagnostic accuracy, outcomes amongdifferent subtypes of stroke, treatment effects,QALYs and LOS. These included:
� re-examining trial data (IST and CAST andsubstudies)
� observational data (OCSP and LSR)� national statistical data linked to our own
hospital data (ISD and LSR)� the literature (imaging, effect of aspirin on
intracranial haemorrhage, bed occupancy byage)
� the Cochrane Database of Systematic Reviews(aspirin, anticoagulants, thrombolysis, secondaryprevention)
� all of the CT scanning departments in Scotland(32, access to CT for stroke)
Discussion
114

� three CT department finance and clinicalmanagers (cost of CT)
� panel of expert clinicians (devising the CTstrategies and the flow path through the model)
� generating new data (CT compared with MRfor PICH)
� and analysis of secondary data (QALYs for ISTpatients in the LSR).
At times it was difficult to keep all of this flowingsmoothly, and new data sources had to beidentified when the first source that was turned toproved to be inadequate.
Had we not had the IST and CAST data (becausewe ran the IST and have performed an individualpatient data meta-analysis of the IST and CAST inconjunction with the CAST investigators), beenthe authors of several Cochrane reviews (and oneof the authors been the Editor of the StrokeGroup), run the LSR for the past 10 years (forwhich we regularly obtain linked long-termoutcome data from ISD) and had a research-dedicated MR scanner on which to undertake theMR arm of the CT/MR comparison, then most ofthis project would have been impossible or basedon considerably less true evidence, or would havetaken considerably longer to do and requiredmuch greater resources.
One might question whether it was reallynecessary to use evidence wherever possible, orwhether a ‘back-of-an-envelope’ calculation wouldhave arrived at the same answer. We cannotanswer that as no such calculation was attemptedbefore embarking on the project proper, and anyretrospective attempt to do a back-of-an-envelopesum would now be biased. However, a model orcalculation that did not take account of theevidence now available for the majority of patientswould have been heavily criticised for failing touse available evidence and so probably ignored.Although there are clearly areas in the presentanalysis that are based on assumptions, it is hopedthat readers will appreciate that these assumptionsapply to the minority and so the overallconclusion is robust and evidence based. Thedifference between the present cost-effectivenessanalysis and the three previous attempts atassessing the cost-effectiveness of CT (see Chapter5), is the substantial lack of data in the previousattempts, the large gaps in the analysis, the broadassumptions and the very limited conclusions. Thedetailed model which we have developed allowsindividual healthcare providers to examinedifferent components of the use of CT in stroke as
each component might show regional and localvariations in availability and costs. Thus, althoughall three previous studies concluded that CT wascost-effective,328–330 there was no total costprovided for caring for a cohort of patientsaccording to a particular strategy, and noassessment of the effect on functional outcome,LOS or quality of life. The generalisability wasunclear and in reality two of the previous studieswere actually simply comparisons of CT withanother diagnostic strategy.328,329
Two other studies in the UK published asmonographs did not develop such a detailedmodel, did not have such detailed evidenceavailable (some had not been published), did nottake account of the accuracy of imaging, and didnot provide such a comprehensive range of CTscanning strategies as in the present study. Thestudy by the Trent Institute for Health351 ServicesResearch concluded that:
“a purchasing strategy supporting the routine CTscanning of stroke patients likely to benefit fromsecondary prevention should be adopted. Thereshould be a distinction between those patientsrequiring an urgent scan, and those requiring a scanas soon as reasonably possible within two weeks of theonset of symptoms, i.e. before it becomes impossibleto distinguish haemorrhagic from ischaemic strokesusing a CT scan.”
Published in 1997, this study did not include theloss of benefit incurred by failing to start aspirin within the first 48 hours identified in theIST and CAST, or the adverse effect ofadministering aspirin to those with PICH(regardless of any benefit that aspirin might havein reducing the risk of other ischaemic vascularevents).
A second document prepared by the WessexInstitute for Health Service Research andDevelopment (though we are unsure of itspublication status)352 did incorporate the notion ofscanning within 48 hours, but only based theirassessment on the cost of CT (one flat-rate cost,not by time of day) without incorporating the costof inpatient hospital care and effect on LOS. Ittherefore did not achieve the comprehensiveassessment and robust conclusions that wereattained in the present study. Therefore, there isno place for a back-of-an-envelope calculationwhen data are available. We believe that ourapproach of accessing this large amount ofdetailed knowledge, put together in a verycohesive and functional way, was very cost-effective.
Health Technology Assessment 2004; Vol. 8: No. 1
115
© Queen’s Printer and Controller of HMSO 2004. All rights reserved.
Discussion
116
LimitationsThe alternative approach to determining the cost-effectiveness of CT in stroke would have been toundertake a randomised trial comparing CTscanning (and subsequent management andfunctional outcome) with diagnosis andmanagement based on clinical diagnosis alone.Not only would this have required a very largestudy (which would have been considerably morecostly than the approach used in the presentstudy), but it would have been morally andethically insupportable in the present era ofmodern medical management. The time to have evaluated such an approach might have been at first introduction of CT (a lesson for the introduction of new technologies in thefuture), although the absence of a treatment for stroke in the 1970s would have limited theresults.
Other sensitivity analyses could be undertaken, forexample to vary the outcomes of patients withtumours or infections. However, it was apparentafter a range of sensitivity analyses, that the majorfactor influencing the model was the cost of LOS.Other factors like a change in the accuracy of CT,or the proportion of patients with PICH or infarcthad no effect on the ranking of the scanningstrategies. Even changing the assumption aboutwhen treatment might be started while waiting forthe scan did not affect the ranking. For example,the model currently works by assuming that themajority of patients placed in a particular scanstrategy do not undergo CT scanning until thetime specified; that is, for ‘scan all patients within7 days of stroke’, most patients would be scannednear the 7 day time limit. However, in reality somemight be scanned on admission, and some on day2, and so on, rather than all near day 7. Somemight start aspirin on the basis of the clinicaldiagnosis of ischaemic stroke pending a CT scanand therefore not lose the early benefit of aspirin,but for some with intracranial haemorrhage ortumour, incorrectly diagnosed as ischaemic stroke,starting aspirin would be inappropriate. Therewere no differences in cost effectiveness betweenyounger and elderly patients.
Furthermore, the focus was on patients admittedto hospital. In the UK about 15–20% of patientsare not admitted to hospital after a stroke,although current guidelines suggest that allpatients with stroke should be admitted.62 Furtheranalyses could be run to determine the cost-effectiveness of CT scanning for those patients notadmitted to hospital.
Generalisability of the resultsHow generalisable are our results? We havecollected much of our data from hospitals inScotland. We have sampled all CT departmentsand several hospital finance departments tocalculate the cost of CT. We used data on cost ofinpatient care from NHS Scotland Health ServiceCosts. The district general and teaching hospitalswhich provided the financial data on CT scanningare likely to be representative of at least aproportion of hospitals elsewhere in the UK, andso provide suitable examples. Similarly, amongstthe range of CT departments in Scotland, it islikely that there are parallels with many hospitalselsewhere in the UK. Indeed the Royal College ofRadiologists Audit of CT scanning for stroke data,although not collected in quite the same way asour survey, suggested that Scotland was at themore accessible end of the spectrum of access toCT for stroke compared with England and Wales.There were no comparable data to calculate unitcosts of LOS by hospital type for England andWales, but given that equipment costs, staffinglevels and pay scales are similar, the costs we usedshould be relevant for England (except forLondon where staff and building costs are higher).Finally, Scotland offers a range of geographies,including densely populated urban areas andsparsely populated rural areas, some very remote.Across this range of geographies, there are likelyto be parallels with most other parts of the UK. Inall of this, even if our conditions do not matchthose of all other parts of the UK, it is likely thatcentres will be able to see where they fit in therange of available data. Furthermore, it would bepossible to re-run the model with other data toexplore local regional variations.
Much of our data on stroke came from the IST,CAST, the Lothian Stroke Register, or the ISDScotland. The IST and CAST are generalisable,being very large and conducted in many hospitalsin many countries worldwide. The Lothian StrokeRegister is specific to our hospital, but we useddata by stroke syndrome and OCSP classificationthereby at least partly accounting for any localeffects, and making the results more generalisable.Our outcome data however come from a setting ofreasonably organised stroke care and a stroke unithas been in place for some years. Organised strokeimproves functional outcome and so will reduceaverage LOS compared with a hospital without astroke unit. Thus the costs of stroke care are likelyto be even higher (and so CT be even more costeffective) in hospitals without organised strokecare.

Our analysis was conducted prior to the licensingof thrombolysis for treatment of acute stroke whenaspirin and organised stroke care were the majorcommon treatments. We have assumed that only asmall proportion of patients would reach hospitalin time to be considered for thrombolysis, but thatis consistent with surveys from other parts of theworld where recombinant tissue PlasminogenActivator is already licensed. If a larger proportionof patients were to become eligible forthrombolysis, say 10%, then the CT scanningstrategy ‘scan all immediately’ would become evenmore cost-effective than the base comparator ‘scanall within 48 hours’, assuming that the estimate ofthrombolysis treatment effect from current data(110 per 1000 more alive and independent) iscorrect.132
Implications for healthcareIt is not within our remit to make recommendationson whether healthcare should change as a result ofthis report. However, hospitals providing servicesfor patients with stroke may wish to examine theircurrent CT provision and see which of our 12strategies their service matches most closely. Theymay then wish to determine whether they are ableto move to a more cost-effective strategy byallocating resources more efficiently andreorganising services, or whether they may need toprovide some additional component to be able toimprove the service. For example, there is anational shortage of radiologists in the UK – manyradiology departments in the UK have unfilledconsultant posts. In our survey of Scottish radiologydepartments, although the question was not wellanswered, the consistent factor barring improvedaccess to CT for patients with stroke was moreradiologists. In addition, CT departments mayneed to identify ways of relaying the result of thescan quickly to the admitting doctor. Regardless ofthe barriers to scanning, in the UK, access to CTfor stroke is still not good,66 and is generally poorcompared with provision in other EU countries.18
However, even as long ago as the early 1990s,before the IST and CAST had demonstrated thebenefit of aspirin, or stroke units had beenrecognised as beneficial, the majority of UKphysicians (90%) said that they would wish to have aCT scan if they suffered a stroke themselves.137
The comparison of CT and MR imaging suggeststhat CT is unreliable for diagnosing small PICHsmore than 8 days after the stroke. This is mostlikely to affect outpatients who may not be seen ina hospital clinic until several weeks after their
stroke – they may not recognise the urgencythemselves, there will be delays in obtainingappointments with the GP and then hospitalclinic. By that time CT may fail to diagnosecorrectly even quite large PICHs. However theproblem with delays may also affect someinpatients as there are difficulties in obtaining aCT scan for stroke in many parts of the UK (RoyalCollege of Radiologists Audit Sub-committee,personal communication) so that patients may waitin hospital for up to 2 weeks for a CT scan.Anecdotal reports also suggest that patients maybe sent home if well enough, rather than wait inhospital for the CT scan, occupying a bed, butmay then be put on an outpatient waiting list of several months. By that time, one could argue that it is almost not worth doing the CT. Thealternative for patients affected by delays is to use MR with GRE. However MR is moreexpensive than CT, takes longer to do, is lessavailable and patients find it less pleasant thanCT. Waiting lists for MR scans are generallythought to be much worse than for CT in mostparts of the country (e.g. the waiting time for anMR in our neuroscience department is 7 monthsat present). If the decision to commence aspirinwere to be delayed while waiting for the MR result,then the majority of patients with ischaemic strokewould be denied effective secondary prevention,and the wait would create anxiety. MR in place ofCT for patients whose imaging is delayed forwhatever reason is unlikely to be a realisticsolution in the UK. Speedy referral to fast-trackclinics with ready access to imaging is the bettersolution.
It is not just carrying out the scan which isimportant, but the result must reach the doctorscaring for the patient in the most efficient waypossible. In our experience, a provisional reporton a duplicate sheet, with a copy sent with thepatient and a copy retained in the department,not only gets the result to the attending physicianquickly, but also reduces the amount of time thatjunior and senior doctors spend trying to get thescan result from the CT department, cutsunnecessary result-seeking phone calls to hard-pressed CT secretaries and reduces interruptionsto the radiologists so that they can get on withtheir radiological work. There may also be otherways of streamlining the information transfer thatcould be evaluated.
It is worth pointing out that our model assumesthat patient management is implemented correctlyas described at all stages, e.g. that patients whoshould be treated with aspirin actually receive it.
Health Technology Assessment 2004; Vol. 8: No. 1
117
© Queen’s Printer and Controller of HMSO 2004. All rights reserved.

In reality, the process of healthcare is much lessprecise, and so our cost-effectiveness data arelikely to be the ‘best case scenario’. It is likely to beeven more expensive for all the strategies. Forexample, patients may not be sent home soquickly, and even an extra unnecessary half-day inhospital is costly, quickly adding to the financialburden of caring for stroke.
The difference in QALYs and costs between thestrategies may seem marginal per patient, or per1000 patients, and so some may wonder whetherimproved CT scanning is worth the extra effortand possible disadvantage to other specialtiescompeting with stroke for access to imaging.However, stroke is so common that in the UK, ourfigures calculated for 1000 patients would need tobe multiplied by about 120 to 140 to get the totaleffect per year. These differences then becomesubstantial across the population. A marginal shiftin the proportion of patients, from beingdependent to independent by 6 months afterstroke will have a marked effect on overall LOSand hence costs. Thus although the effect ofaspirin may seem very marginal in the individual,the population effect is proportionately larger andworthwhile, and is largely what drives the rankingof scan strategies. It may help to think of the costof caring for an average stroke in terms of somecommon day-to-day object. For example, eachstroke patient admitted to hospital, on average,will cost about as much as to buy an average familycar. Reducing the overall cost of care by reducingLOS by speedy diagnosis and increasing thechance of independent survival, would mean thatnot only would patients have a better healthoutcome, but more money would be available to‘purchase more cars’. Thus, although for theindividual, the gains in functional outcome andquality of life from the rapid scan strategies mayseem marginal compared with the more leisurelyscan strategies, in the case of stroke everymarginal gain counts towards an improvedoutcome, and it would be wrong even on anindividual level to disregard these benefits. For theservice provider dealing with the population,where large savings are possible with modestalterations in CT strategy, these gains are veryimportant.
Implications for researchFor a disease as common as stroke and with such ahigh mortality and morbidity, there are somerather fundamental questions about how best tomanage patients for which there are few data.
1. There are inadequate data on the effect ofaspirin or anticoagulant therapy in patientswith intracranial haemorrhage. Although wedetermined that, in general, the currentsparse data suggest that antithrombotic drugsshould be avoided in acute PICH, there aresituations where antithrombotic treatmentmay be required after acute PICH. Forexample in patients with deep veinthrombosis, or who are at high risk ofmyocardial infarction, or who requireanticoagulation for an artificial heart valve,there are inadequate data on which to basetreatment decisions. Unfortunately arandomised trial would take a long time toaccrue an adequate sample size.
2. There are insufficient data on the effect ofantithrombotic drugs given late (i.e. monthsor years later) after PICH, for example toreduce the risk of ischaemic stroke ormyocardial infarction. Although patients withPICH seem to be more prone to having afurther PICH, and this risk is likely to beincreased with aspirin, it is still unclearwhether the reduction in the risk of ischaemicvascular events with aspirin is offset by anincrease in the risk of recurrent PICH.
3. The management of PICH in the hyperacutestage is uncertain. Patients on anticoagulantshave their deranged clotting reversed, butthere is no good guidance on when toevacuate larger haematomas or whether it isbetter to manage these medically. Trials inthese areas are required to fill these gaps inknowledge (indeed a trial of evacuation versusmedical therapy for supra-tentorialhaematomas – STICH trial – is ongoing).
4. Epidemiological studies have probablyunderestimated the proportion of strokes dueto PICH because of suboptimal scanningpolicies.
5. There is a lack of data on whether theproportion of stroke due to PICH varies withage, or recurrent versus first stroke, and thisinformation will be necessary to determine thecost effectiveness of CT in recurrent stroke.
6. The data on the individual costs of thecomponents of caring for stroke patients inhospital and in the community are lacking, aswell as a general total cost. This informationis needed by different types of hospital andregion to calculate cost-effectiveness in detail.
7. The methodology used in studies assessingaccuracy of imaging needs to be improved.Sample size, blinding of image assessment,prospective rather than retrospective datacollection, and careful clinical characterisation
Discussion
118
Health Technology Assessment 2004; Vol. 8: No. 1
119
© Queen’s Printer and Controller of HMSO 2004. All rights reserved.
and documentation of the process of clinicalcharacterisation are all too frequentlyoverlooked.
8. There is also a surprising paucity of data onsome basic components of stroke care. Forexample there was little evidence on theagreement between clinicians, or paramedicsor nurses or general practitioners for theclinical diagnosis of stroke. What informationwas available tended not to be in thehyperacute phase but later on when thesymptoms and signs had stopped fluctuating,and so the assessment was easier. These data may therefore not represent the truedifficulty of assessing patients in thehyperacute phase. Data on how to improvethe clinical diagnosis of stroke versus not astroke in the hyperacute phase, and whichsymptoms or signs are particularly reliable,are required if we are to reduce delays in theprocess of admitting stroke patients tohospital.
9. If data on recurrent stroke and realistic MRcosts were available, then further modellingcould be undertaken to look at the effect ofthese factors on cost effectiveness.
10. Finally, there is room for improving theefficiency of the CT scanning process, fromhow the scan is requested through to how theresult is transmitted back to the attendingphysicians. Different methods may berequired for different departments dependingon resources. What works for our department(see above) may not work for others. Someevaluation of where the system is inefficientand how this could be improved would beworthwhile. Different methods of streamliningthe process of investigating stroke patients,(e.g. keep an empty appointment each day inanticipation of a stroke vs not; authorised bythe consultant vs radiographer, etc) should beevaluated in randomised trials because that isthe best way to avoid bias in the assessment ofthese strategies.

The Health Economics Research Unit (HERU)is funded by the Chief Scientist Office of the
Scottish Executive Department of Health (SEHD).The opinions expressed in this report are those ofthe authors and not of the SEHD.
We would like to acknowledge Alistair Wilkie fromthe Scottish Executive Geographic InformationService (SEGIS) for undertaking the drive timeanalysis reported in Chapter 5 and thank him forhis assistance with this work.
Many thanks also go to Moira Napper fromHERU for providing the literature search on thecost-effectiveness of CT for stroke; ProfessorCharles Warlow, for assistance with data onepidemiology of stroke; the LSR and allcontributing doctors; Scottish Radiological Societyfor support with the project; all Scottish radiology
departments, but especially Dr J Murray in Perthand Dr C Jamieson in Dunfermline forcompleting the survey on access to CT scanningfor stroke; the administrators of the radiologydepartments in Forresterhill Aberdeen, theBorders General Hospital and Stirling RoyalInfirmary for data to calculate the cost of CT; DrZhenMing Chen in Oxford for permission to usethe CAST data; the DCN X-ray departmentradiographers for helping with the CT versus MRpart of the project; the SHEFC Brain ImagingResearch Centre for Scotland, for access toperform the MR imaging, and GE MedicalSystems the main industrial collaborator.
Contributions of the authorsImaging/clinical components: JM Wardlaw, PAG Sandercock, SL Keir, S Lewis, MS Dennis.Economic evaluation: J Seymour, J Cairns.
Health Technology Assessment 2004; Vol. 8: No. 1
121
© Queen’s Printer and Controller of HMSO 2004. All rights reserved.
Acknowledgements


1. Sudlow CLM, Warlow CP. Comparable studies ofthe incidence of stroke and its pathological types.Results from an international collaboration. Stroke1997;28:491–9.
2. Rothwell PM. The high cost of not funding strokeresearch: a comparison with heart disease andcancer. Lancet 2001;357:1612–16.
3. Murray CJL, Lopez AD. The global burden of disease:a comprehensive assessment of mortality and disabilityfrom diseases, injuries and risk factors in 1990 andprojected to 2020. Boston, MA: Harvard UniversityPress; 1996.
4. MacDonald BK, Cockerell OC, Sander JW,Shorvon SD. The incidence and lifetimeprevalence of neurological disorders in aprospective community-based study in the UK.Brain 2000;123:665–76.
5. Bamford J, Sandercock P, Dennis M, Warlow C,Jones L, McPherson K. A prospective study ofacute cerebrovascular disease in the community:the Oxfordshire Community Stroke Project1981–86. 1. Methodology, demography andincident cases of first-ever stroke. J NeurolNeurosurg Psychiatry 1988;51:1373–80.
6. Wade DT. Stroke (acute cerebrovascular disease).In: Stevens A, Raftery J, editors. Health care needsassessment. The epidemiologically based needs assessmentreviews. Oxford: Radcliffe Medical Press; 1994. pp.111–255.
7. Office of Health Economics. OHE compendium ofhealth statistics. London: Office of HealthEconomics; 2000.
8. Wolfe CD. The impact of stroke. Bri Med Bull2000;56:275–86.
9. Bamford J, Sandercock P, Dennis M, Burn J,Warlow C. Classification and natural history ofclinically identifiable subtypes of cerebralinfarction. Lancet 1991;337:1521–6.
10. Dorman P, Dennis, M, Sandercock P, on behalf ofthe United Kingdom Collaborators in theInternational Stroke Trial (IST). Are the modified‘simple questions’ a valid and reliable measure ofhealth related quality of life after stroke? J NeurolNeurosurg Psychiatry 2000;69:487–93.
11. The Stroke Association. Stroke care: reducing theburden of disease. London: The Stroke Association;1998.
12. Stegmayr B, Asplund K. Exploring the decliningcase-fatality in acute stroke. Population-based
observations in the northern Sweden MONICAproject. J Intern Med 1996;240:143–9.
13. Bonita R. Epidemiology of stroke. Lancet1992;339:342–4.
14. Menken M, Munsat TL, Toole JF. The GlobalBurden of Disease Study. Implications forneurology. Arch Neurol 2000;57:418–20.
15. Evers M, Goosens M, Ament A, Maarse. Economicevaluation in stroke research. J Cerebrovasc Dis2000;11:82–91.
16. British Heart Foundation. Coronary heart diseasestatistics: British Heart Foundation statistics. London:British Heart Foundation; 1998.
17. Grieve R, Hutton J, Bhalla A, Rastenye D,Ryglewicz D, Wolfe CD, on behalf of the BiomedII European Study of Stroke Care. A comparisonof the costs and survival of hospital admittedstroke patients across Europe. Stroke2001;32:1684–91.
18. Weir NU, Sandercock PAG, Lewis SC, SignoriniDF, Warlow CP, on behalf of the IST CollaborativeGroup. Variations between countries in outcomeafter stroke in the International Stroke Trial (IST).Stroke 2001;32:1370–7.
19. Wardlaw JM, Lewis SC, Sandercock PAG, Ricci S,Spizzichino L, International Stroke TrialCollaborators in Italy and the UK. Why do Italianstroke patients receive CT scans earlier than UKpatients? Postgrad Med J 1999;75:18–21.
20. Holloway R, Benesch C, Rahilly C, Courtright C,Abad-Santos F. A systematic review of cost-effectiveness research of stroke evaluation andtreatment. Stroke 1999;30:1340–9.
21. Fagan S, Morgenstern L, Pettita A, Ward R, TilleyB, Marler J, et al. Cost-effectiveness of tissueplasminogen activator for acute ischemic stroke.Neurology 1998;50:883–90.
22. Hatano S. Experience from a multicentre strokeregister: a preliminary report. Bull World HealthOrgan 1976;54:541–53.
23. Bamford J. Clinical examination in diagnosis andsubclassification of stroke. Lancet 1992;339:400–2.
24. Bamford J, Sandercock P, Dennis M, Burn J,Warlow C. A prospective study of acutecerebrovascular disease in the community: theOxfordshire Community Stroke Project – 1981–86.2. Incidence, case fatality rates and overalloutcome at one year of cerebral infarction,
Health Technology Assessment 2004; Vol. 8: No. 1
123
© Queen’s Printer and Controller of HMSO 2004. All rights reserved.
References

primary intracerebral and subarachnoidhaemorrhage. J Neurol Neurosurg Psychiatry 1990;53:16–22.
25. Warlow CP, Dennis MS, van Gijn J, Hankey GJ,Sandercock PAG, Bamford JM, et al. Whatpathological type of stroke is it? Stroke: a practicalguide to management. 2nd ed. Oxford: BlackwellScientific; 2001. pp. 151–222.
26. Warlow CP, Dennis MS, van Gijn J, Hankey GJ,Sandercock PAG, Bamford JM, et al. What causedthis intracerebral haemorrhage? Stroke: a practicalguide to management. 2nd ed. Oxford: BlackwellScientific; 2001. pp. 339–75.
27. Sandercock PAG, Warlow CP, Jones LN, StarkeyIR. Predisposing factors for cerebral infarction: theOxfordshire Community Stroke Project. BMJ1989;298:75–80.
28. Warlow CP, Dennis MS, van Gijn J, SandercockPAG, Bamford JM, Wardlaw J. Subarachnoidhaemorrhage. Stroke: a practical guide tomanagement. Oxford: Blackwell Science; 1996. pp. 322–59.
29. Allen CM. Clinical diagnosis of the acute strokesyndrome. Q J Med 1983;52:515–23.
30. Poungvarin N, Viriyavejakul A, Komontri C. Sirirajstroke score and validation study to distinguishsupratentorial intracerebral haemorrhage frominfarction. BMJ 1991;302:1565–7.
31. Besson G, Robert C, Hommel M, Perret J. Is itclinically possible to distinguish nonhemorrhagicinfarct from hemorrhagic stroke? Stroke1995;26:1205–9.
32. Celani MG, Ceravolo MG, Duca E, Minciotti P,Caputo N, Orlandini M. Was it infarction orhaemorrhage? A clinical diagnosis by means of theAllen score. J Neurol 1992;239:411–13.
33. Lindley R, Wardlaw J, Ricci S, Celani M,Sandercock P. Haemorrhagic transformation ofcerebral infarction in acute stroke patients in theInternational Stroke Trial Pilot. Cerebrovasc Dis1992;2:234.
34. Weir CJ, Murray GD, Adams FG, Muir KW,Grosset DG, Lees KR. Poor accuracy of strokescoring systems for differential clinical diagnosis ofintracranial haemorrhage and infarction. Lancet1994;344:999–1002.
35. Hawkins GC, Bonita R, Broad JB, Anderson NE.Inadequacy of clinical scoring systems todifferentiate stroke subtypes in population-basedstudies. Stroke 1995;26:1338–42.
36. Sohn YH, Kim SM, Kim JS, Kim DI. Benignbrainstem haemorrhage simulating transientischaemic attack. Yonsei Med J 1991;32:91–3.
37. Aparicio A, Sobrino J, Arboix A, Torres M.Hematoma intraparenquimatoso que simula unaccidente isquemico transitorio. Med Clin (Barc)1995;104:478–9.
38. Gunathilake SB. Rapid resolution of symptomsand signs of intracerebral haemorrhage: casereports. BMJ 1998;316:1495–6.
39. Ivo L. CT scanning can differentiate betweenischaemic attack and haemorrhage. Lancet 1999;319:1197–8.
40. Scott WR, Miller BR. Intracerebral haemorrhagewith rapid recovery. Arch Neurol 1985;42:133–6.
41. International Stroke Trial Collaborative Group.The International Stroke Trial (IST): a randomisedtrial of aspirin, subcutaneous heparin, both, orneither among 19435 patients with acuteischaemic stroke. International Stroke TrialCollaborative Group. Lancet 1997;349:1569–81.
42. Chinese Acute Stroke Trial Collaborative Group.CAST: randomised placebo-controlled trial ofearly aspirin use in 20,000 patients with acuteischaemic stroke. CAST (Chinese Acute StrokeTrial) Collaborative Group. Lancet 1997;349:1641–9.
43. Chen Z, Sandercock P, Pan H, Counsell C, CollinsR, Liu L, et al. Indications for early aspirin use inacute ischaemic stroke. A combined analysis of40000 randomised patients from the ChineseAcute Stroke Trial and the International StrokeTrial. Stroke 2000;31:1240–9.
44. Wolfe C, Rudd A, Dennis M, Warlow C,Langhorne P. Taking acute stroke seriously. BMJ2001;323:5–6.
45. Kennedy J, Buchan A, Barnett HJM. Thrombolysismust be considered after stroke. BMJ 2001;323:937.
46. Sandercock P, Berge E, Dennis M, Forbes J, Hand P, Kwan J, et al. A systematic review of the effectiveness, cost-effectiveness and barriers to implementation of thrombolytic andneuroprotective therapy for acute ischaemic strokein the NHS. Health Technol Assess 2001;6(26).
47. Antithrombotic Trialists’ Collaboration. Preventionof death, myocardial infarction and stroke byantiplatelet therapy in high risk patients. BMJ2001;324:71–86.
48. Antiplatelet Trialists’ Collaboration. Collaborativeoverview of randomised trials of antiplatelettherapy – I: Prevention of death, myocardialinfarction, and stroke by prolonged antiplatelettherapy in various categories of patients. BMJ1994; 308:81–106.
49. Sandercock PAG. Statins for stroke prevention?Lancet 2001;357:1548–9.
50. Scottish Intercollegiate Guidelines Network(SIGN). Management of patients with stroke. I:Assessment, investigation, immediate managementand secondary prevention. SIGN publication no.13. Edinburgh: SIGN; 1997.
51. Prasad K, Shrivastava A. Surgery for primarysupratentorial intracerebral haemorrhage
References
124

(Cochrane Review). The Cochrane Library (Issue4), Oxford: Update Software; 2001.
52. Fernandes HM, Gregson B, Siddique S, MendelowAD. Surgery in intracerebral haemorrhage. Theuncertainty continues. Stroke 2001;31:2511–16.
53. PROGRESS Collaborative Group. Randomisedtrial of a peridopril-based blood-pressure-loweringregimen among 6105 individuals with previousstroke or transient ischaemic attack. Lancet2001;358:1033–41.
54. Franke FL, Ramos LMP, van Gijn J. Developmentof multifocal haemorrhage in a cerebral infarctduring computed tomography. J Neurol NeurosurgPsychiatry 1990;53:531–2.
55. Dennis MS, Bamford JM, Molyneux AJ, WarlowCP. Rapid resolution of signs of primaryintracerebral haemorrhage in computedtomograms of the brain. BMJ 1987;295:379–81.
56. Mead GE, Lewis S, Wardlaw JM, Dennis MS,Warlow CP. Should computed tomographyappearance of lacunar stroke influence patientmanagement? J Neurol Neurosurg Psychiatry1999;67:682–4.
57. Wardlaw JM, Lewis SC, Dennis MS, Counsell C,McDowall M. Is visible infarction on computedtomography associated with an adverse prognosisin acute ischemic stroke? Stroke 1998;29:1315–19.
58. Miller JH, Wardlaw JM, Lammie GA. Intracerebralhaemorrhage and cerebral amyloid angiopathy:CT features with pathological correlation. ClinRadiol 1999;54:422–9.
59. Chest, Heart and Stroke Scotland. Improving strokeservices. Patients’ and carers’ views. Edinburgh:Chest, Heart and Stroke Scotland; 2001.
60. Langhorne P, Williams BO, Gilchrist W, Howie K.Do stroke units save lives? Lancet 1993;342:395–8.
61. Lindley R, Amayo E, Marshall J, Sandercock PAG,Dennis MS, Warlow CP. Acute Stroke Treatment inUK hospitals: the Stroke Association survey ofconsultant opinion. J R Coll Phys Lond1995;29:479–84.
62. Royal College of Physicians. Recommendations foracute treatment of stroke. BMJ 2000;320:823–5.
63. Grimshaw JM, Russell IT. Achieving health gainthrough clinical guidelines. I: Developingscientifically valid guidelines. Qual Health Care1993;2:243–8.
64. Leape LL, Park RE, Kahan JP, Brook RH. Groupjudgement of appropriateness: the effect of panelcomposition. Qual Assur Health Care 1992;4:151–9.
65. Scott EA, Black N. When does consensus exist inexpert panels. J Public Health Med 1991;13:35–9.
66. Roberts MA, Allen A, Langhorne P, McEwen J, D’A Semple P. Organisation of services for acute
stroke in Scotland – report of the Scottish strokeservices audit. Health Bull 2000;58(2):87–95.
67. Ebrahim S, Redfern J. Stroke care – a matter ofchance. A national survey of stroke services. London:The Stroke Association; 1999.
68. Department of Health. National ServiceFramework for older people.http://www.doh.gov.uk/nsf/olderpeople.htm.London: Department of Health; 2001.
69. National Health Service in Scotland Informationand Statistics Division (NHS, ISD). Scottish HealthService costs. Year ended 31st March 2000.Edinburgh; ISD Publications; 2000. pp. 5–7.
70. Mushlin AI, Ruchlin HS, Callahan MA.Costeffectiveness of diagnostic tests. Lancet 2001;358:1353–5.
71. White PM, Wardlaw JM, Easton VE. Can non-invasive imaging tests accurately detectintracranial aneurysms? A systematic review.Radiology 2000;217:361–70.
72. Hobson RW II. Status of carotid angioplasty andstenting trials. J Vasc Surg 1998;27:791.
73. Von Arbin M., Brittion M, De Faire U, Helmers C,Miah K, Murray V. Accuracy of bedside diagnosisin stroke. Stroke 1981;12:288–93.
74. Rowe CC, Donnan GA, Bladin PF. Intracerebralhaemorrhage: incidence and use of computedtomography. BMJ 1988;297:1177–8.
75. Cochrane Stroke Group search strategy forspecialised register. The Cochrane Library (Issue1). Oxford: Update Software; 2000.
76. Ricci S, Celani MG, La Rosa F, Vitali R, Duca E,Ferraguzzi R. SEPIVAC: a community-based studyof stroke incidence in Umbria, Italy. J NeurolNeurosurg Psychiatry 1991;54:695–8.
77. Anderson CS, Jamrozik K, Burvill PW, ChakeraTMH, Johnson GA, Stewart-Wynne EG.Ascertaining the true incidence of stroke:experience from the Perth Community StrokeStudy, 1989–1990. Med J Aust 1993;158:80–4.
78. Lauria G, Gentile M, Fassetta G, Casetta I, AgnoliF, Andreotta G, et al. Incidence and prognosis ofstroke in the Belluno province, Italy. First-yearresults of a community-based study. Stroke1995;26:1787–93.
79. Jorgensen HS, Nakayama H, Raaschou HO, OlsenTS. Intracerebral hemorrhage versus infarction:stroke severity, risk factors, and prognosis. AnnNeurol 1995;38:45–50.
80. Kolominsky-Rabas PL, Sarti C, Heuschmann PU,Graf C, Siemonsen S, Neundoerfer B, et al. Aprospective community-based study of stroke inGermany – the Erlangen Stroke Project (ESPro):incidence and case fatality at 1, 3, and 12 months.Stroke 1998;29:2501–6.
Health Technology Assessment 2004; Vol. 8: No. 1
125
© Queen’s Printer and Controller of HMSO 2004. All rights reserved.
81. Vemmos KN, Bots ML, Tsibouris PK, Zis VP,Grobbee DE, Stranjalis GS, et al. Stroke incidenceand case fatality in southern Greece: the Arcadiastroke registry. Stroke 1999;30:363–70.
82. Zweifler RM, York D, Tha Tha U, Mendizabal JE,Rothrock JF. Accuracy of paramedic diagnosis ofstroke. J Stroke Cerebrovasc Dis 1998;7:446–8.
83. Kothari R, Barsan W, Brott T, Broderick J,Ashbrock S. Frequency and accuracy of prehospitaldiagnosis of acute stroke. Stroke 1995;26:937–41.
84. Wester P, Radberg J, Lundgren B, Peltonen M.Factors associated with delayed admission tohospital and in-hospital delays in acute stroke andTIA. A prospective, multicenter study. Stroke1999;30:40–8.
85. Zweifler RM, Drinkard R, Cunningham S, BrodyML, Rothrock JF. Implementation of a stroke codesystem in Mobile, Alabama. Diagnostic andtherapeutic yield. Stroke 1997;28:981–3.
86. Libman RB, Wirkowski E, Alvir J, Rao TH.Conditions that mimic stroke in the emergencydepartment. Implications for acute stroke trials.Arch Neurol 1995;52:1119–22.
87. Bratina P, Greenberg L, Pasteur W, Grotta JC.Current emergency department management ofstroke in Houston, Texas. Stroke 1995;26:409–14.
88. Kothari RU, Brott T, Broderick JP, Hamilton CA.Emergency physicians. Accuracy in the diagnosisof stroke. Stroke 1995;26:2238–41.
89. Horn J, Limburg M, Vermeulen M. Diagnosticaccuracy of stroke by family physicians. Neurology1997;48 (Suppl):A405.
90. Martin PJ, Young G, Enevoldson TP, HumphreyPR. Overdiagnosis of TIA and minor stroke:experience at a regional neurovascular clinic. QJM1997;90:759–63.
91. Ferro JM, Pinto AN, Falcao I, Rodrigues G,Ferreira J, Falcao F, et al. Diagnosis of stroke by thenonneurologist. A validation study. Stroke1998;29:1106–9.
92. Ellekjaer H, Holmen J, Indredavik B, Terent A.Epidemiology of stroke in Innherred, Norway,1994 to 1996. Incidence and 30-day case-fatalityrate. Stroke 1997;28:2180–4.
93. Smucker WD, Disabato JA, Krishen AE. Systematicapproach to diagnosis and initial management ofstroke. Am Fam Phys 1995;52:225–34.
94. Gillard JH, Barker PB, van Zijl PCM, Bryan N,Oppenheimer SM. Proton MR spectroscopy inacute middle cerebral artery stroke. AJNR Am JNeuroradiol 1996;17:873–86.
95. Henneman PL, Lewis RJ. Is admission medicallyjustified for all patients with acute stroke ortransient ischemic attack? Ann Emerg Med1995;25:458–63.
96. Czlonkowska A, Ryglewicz D, Weissbein T,Baranska-Gieruszczak M, Hier DB. A prospectivecommunity-based study of stroke in Warsaw,Poland. Stroke 1994;25:547–51.
97. Brown JJ, Hesselink JR, Rothrock JF. MR and CTof lacunar infarcts. Am J Roentgenol 1988;151:367–72.
98. Ashok PP, Radhakrishnan K, Sridharan R, El-Mangoush M. Incidence and pattern ofcerebrovascular disease in Benghazi, Libya. J Neurol Neurosurg Psychiatry 1986;49:519–23.
99. Herman B, Leyten ACM, Van Luijk JH, FrenkenCWGM, Op de Coul AAW, Schulte BPM.Epidemiology of stroke in Tilburg, TheNetherlands. 2. Incidence, initial clinical pictureand medical care and three-week case fatality.Stroke 1982;13:629–34.
100. Ueda K, Omae T, Hirota Y, Takeshita M, KatsukiS, Tanaka M. Decreasing trend in incidence andmortality from stroke in Hisayama residents,Japan. Stroke 1981;12:154–60.
101. Tanaka H, Ueda Y, Date C, Baba T, Yamashita H,Hayashi M. Incidence of stroke in Shibata, Japan:1976–1978. Stroke 1981;12:460–6.
102. Wang CC, Cheng XM, Li SZ, Liana Bolis C,Schoenberg B. Epidemiology of cerebrovasculardisease in an urban community of Beijing,People’s Republic of China. Neuroepidemiology1983;2:121–34.
103. Scmidt VE, Smirnov VE, Ryabova VS. Results ofthe seven-year prospective study of stroke patients.Stroke 1988;19:942–9.
104. Kojima S, Omura T, Wakamatsu W, Kishi M,Yamazaki T, Iida M. Prognosis and disability ofstroke patients after 5 years in Akita, Japan. Stroke1990;21:72–7.
105. Giroud M, Gras P, Chadan N, Beuriat P, Milan C,Arveux P, et al. Cerebral haemorrhage in a Frenchprospective population study. J Neurol NeurosurgPsychiatry 1991;54:595–8.
106. D’Alessandro G, Di Giovanni M, Roveyaz L,Iannizzi L, Compagnoni MP, Blanc S. Incidenceand prognosis of stroke in the Valle d’Aosta, Italy.First-year results of a community-based study.Stroke 1992;23:1712–15.
107. Jorgensen HS, Plesner A, Hubbe P, Larsen K.Marked increase of stroke incidence in menbetween 1972 and 1990 in Frederiksberg,Denmark. Stroke 1992;23:1701–4.
108. Tuomilehto J, Sarti C, Narva EV, Salmi K, Sivenius J, Kaarsalo E, et al. The FINMONICAstroke register: community-based strokeregistration and analysis of stroke incidence inFinland, 1983–1985. Am Epidemiol1992;135:1259–70.
References
126

109. Jerntorp P, Berglund G. Stroke registry in Malmo,Sweden. Stroke 1992;23:357–61.
110. Shah S, Cooper B. The epidemiology of strokeand transient ischaemia in Brisbane, Australia. ItalJ Neurol Sci 1995;16:603–12.
111. Carolei A, Marini C, Di Napoli M, Di GianfilippoG, Santalucia P, Baldassarre M, et al. High strokeincidence in the prospective community-basedL’Aquila registry (1994–1998). First year’s results.Stroke 1997;28:2500–6.
112. Korv J, Roose M, Kaasik A-E. Stroke registry ofTartu, Estonia, from 1991 through 1993.Cerebrovasc Dis 1997;7:154–62.
113. Stewart JA, Dundas R, Howard RS, Rudd AG,Wolfe CDW. Ethnic differences in incidence ofstroke: prospective study with stroke register. BMJ1999;318:967–71.
114. Thrift AG, Dewey HM, Macdonell RAL, McNeilJJ, Donnan GA. Incidence of the major strokesubtypes. Initial findings from the North EastMelbourne Stroke Incidence Study (NEMESIS).Stroke 2001;32:1732–8.
115. Kita Y, Okayama A, Ueshima H, Wada M, NozakiA, Choudhury SR, et al. Stroke incidence and casefatality in Shiga, Japan 1989–1993. Int J Epidemiol1999;28:1059–65.
116. Tanizaki Y, Kiyohara Y, Kato I, Iwamoto H,Nakayama K, Shinohara N, et al. Incidence andrisk factors for subtypes of cerebral infarction in ageneral population. Stroke 2001;31:2616–22.
117. Bogousslavsky J, Regli F, Uske A, Maeder P. Earlyspontaneous hematoma in cerebral infarct: isprimary cerebral hemorrhage overdiagnosed?Neurology 1991;41:837–40.
118. Mead GE, Wardlaw JM, Dennis MS, Lewis SC.Extensive haemorrhagic transformation of infarct:might it be an important cause of primaryintracerebral haemorrhage? Age Ageing2002;31:429–33.
119. Kase CS, Caplan LR (editors). Intracerebralhaemorrhage. Oxford: Butterworth-Heinemann;1994.
120. Kwa VIH, Franke CL, Verbeeten B, Jr, Stam J.Silent intracerebral microhaemorrhages in patientswith ischaemic stroke. Ann Neurol 1998;44:372–7.
121. Greenberg SM, Finklestein SP, Schaefer PW.Petechial hemorrhages accompanying lobarhemorrhage: detection by gradient-echo MRI.Neurology 1996;46:1751–4.
122. Bailey RD, Hart RG, Benavente O, Pearce LA.Recurrent brain hemorrhage is more frequentthan ischemic stroke after intracranialhemorrhage. Neurology 2001;56:773–7.
123. Vermeer SE, Algra A, Franke CL, Koudstaal PJ,Rinkel GJ. Long-term prognosis after recovery
from primary intracerebral hemorrhage. Neurology2002;59:205–9.
124. Jamrozik K, Broadhurst RJ, Lai N, Hankey GJ,Burvill PW, Anderson CS. Trends in the incidence, severity, and short-term outcome ofstroke in Perth, Western Australia. Stroke1999;30:2105–11.
125. Ueda K, Kiyohara Y, Fujishima M. Epidemiology:stroke risk factors in general population – theHisayama study. J Stroke Cerebrovasc Dis2000;9:27–8.
126. Hamad I, Ayman H, Sokrab S, Momani S,Mesraoua B, Ahmed AR. Incidence of stroke inQatar. J Stroke Cerebrovasc Dis 2000;9:83–4.
127. Johansson B, Norrving B, Lindgren A. Increasedstroke incidence in Lund-Orup, Sweden, between1983 to 1985 and 1993 to 1995. Stroke2000;31:481–6.
128. Chen ZM, Sandercock P, Pan HC, Counsell C,Collins R, Liu LS, et al. Indications for earlyaspirin use in acute ischemic stroke: a combinedanalysis of 40 000 randomized patients from thechinese acute stroke trial and the internationalstroke trial. On behalf of the CAST and ISTcollaborative groups. Stroke 2000;31:1240–9.
129. He J, Whelton PK, Vu B, Klag MJ. Aspirin andrisk of haemorrhagic stroke. A meta-analysis ofrandomised controlled trials. JAMA1998;280:1930–5.
130. Wardlaw JM, Yamaguchi T, del Zoppo GJ, Berge E.Thrombolytic therapy versus control in acuteischaemic stroke (Cochrane Review). TheCochrane Library (Issue 2). Oxford: UpdateSoftware; 2003.
131. Tilley BC, Lyden PD, Brott TG, Lu M, Levine SR,Welch KM. Total quality improvement method forreduction of delays between emergencydepartment admission and treatment of acuteischemic stroke. The National Institute ofNeurological Disorders and Stroke rt-PA StrokeStudy Group. Arch Neurol 1997;54:1466–74.
132. Hankey GJ, Sudlow CL, Dunbabin DW.Thienopyridines or aspirin to prevent stroke andother serious vascular events in patients at highrisk of vascular disease? A systematic review of theevidence from randomized trials. Stroke2000;31:1779–84.
133. Lindley R, Warlow CP, Wardlaw JM, Dennis MS,Sandercock PAG. Interobserver reliability of aclinical classification of acute cerebral infarction.Stroke 1993;24:1801–4.
134. Mead GE, Lewis SC, Wardlaw JM, Dennis MS,Warlow CP. Severe ipsilateral carotid stenosis andmiddle cerebral artery disease in lacunarischaemic stroke: innocent bystanders? J Neurol2002;249,266–71.
Health Technology Assessment 2004; Vol. 8: No. 1
127
© Queen’s Printer and Controller of HMSO 2004. All rights reserved.

135. Lindley R, Amayo E, Marshall J, Sandercock PAG,Dennis M, Warlow CP. Hospital services forpatients with acute stroke in the United Kingdom:the Stroke Association Survey of ConsultantOpinion. Age Ageing 1995;24:525–32.
136. Hung TP, Lee KY. Small intracerebralhaemorrhage: a study of clinical manifestationsand CT findings on 31 cases. Ann Acad MedSingapore 1985;14:22–31.
137. Wardlaw JM, Statham PF. How often ishaemosiderin not visible on routine MRI followingtraumatic intracerebral haemorrhage?Neuroradiology 2000;42:81–4.
138. Walshe TM, Hier DB, Davis KR. The diagnosis ofhypertensive intracerebral hemorrhage: thecontribution of computed tomography.Computerized Tomography 1977;1:63–9.
139. Greenberg JO, Skubick DL. Unexpected brainhemorrhages and the value of computerizedtomography. Computerized Tomography 1977;1:349–57.
140. Lieberman A, Hass WK, Pinto R, Isom WO,Kupersmith M, Bear G, et al. Intracranialhemorrhage and infarction in anticoagulatedpatients with prosthetic heart valves. Stroke1978;9:18–24.
141. Scott WR, Paul FJ, Davis KR, Schnur JA.Computerized axial tomography of intracerebraland intraventricular hemorrhage. Radiology1974;112:73–80.
142. Mizukami M, Nishijima M, Kin H. Computedtomographic findings of good prognosis forhemiplegia in hypertensive putaminalhemorrhage. Stroke 1981;12:648–52.
143. Weisberg L. Multiple spontaneous intracerebralhematomas: clinical and computed tomographiccorrelations. Neurology 1981;31:897–900.
144. Hungerbuhler MD, Regli MD, Van Melle PD,Bogousslavsky J. Spontaneous intracerebralhaemorrhages (SICHs). Clinical and CT features;immediate evaluation of prognosis. SchweizerArchiv fur Neurologie, Neurochirurgie und Psychiatrie1983;132:13–27.
145. Mayr U, Bauer P, Fischer J. Non-traumaticintracerebral haemorrhage. Prognosticimplications of neurological and computer-tomographical findings in 100 consecutivepatients. Neurochirurgia 1983;26:36–41.
146. Garde A, Bohmer G, Selden B, Neiman J. 100cases of spontaneous intracerebral haematoma.Eur Neurol 1983;22:161–72.
147. Helweg-Larsen S, Sommer W, Strange P, Lester J,Baysen G. Prognosis for patients treatedconservatively for spontaneous intracerebralhaematomas. Stroke 1984;15:1045–8.
148. Stein RW, Kase DB, Hier DB, Caplan LR, MohrJP, Hemmati M. Caudate hemorrhage. Neurology1984;34:1549–54.
149. Steiner I, Gomori JM, Melamed E. The prognosticvalue of the CT scan in conservatively treatedpatients with intracerebral hematoma. Stroke1984;15:279–82.
150. Weisberg L. Caudate hemorrhage. Arch Neurol1984;41:971–4.
151. Mori E, Tabuchi M, Yamadori A. Lacunarsyndrome due to intracerebral hemorrhage. Stroke1985;16:454–9.
152. Weisberg L. Subcortical lobar intracerebralhaemorrhage: clinical–computed tomographicfindings. J Neurol Neurosurg Psychiatry1985;48:1078–84.
153. Tanaka Y, Furuse M, Iwasa H, Masuzawa T, SaitoK, Sato F. Lobar intracerebral hemorrhage:etiology and a long-term follow-up study of 32patients. Stroke 1986;17:51–7.
154. Gates PC, Barnett HJM, Vinters HV, Simonsen RL,Siu K. Primary intraventricular hemorrhage inadults. Stroke 1986;17:872–7.
155. Carbonin C, Toso V, Cagnin G, Antonini D.Primary brain stem haemorrhages: clinico-radiological considerations on five cases observed.Neurochirurgia 1986;29:53–7.
156. Dollberg S, Rosin AJ, Fisher D. A new look at thenatural history and clinical features ofintracerebral haemorrhage: a clinical CT scancorrelation. Gerontology 1986;32:211–16.
157. Weisberg L. Primary pontine haemorrhage:clinical and computed tomographic correlations. J Neurol Neurosurg Psychiatry 1986;49:346–52.
158. Fieschi C, Carolei A, Fiorelli M, Argentino C,Bozzao L, Fazio M. Changing prognosis ofprimary intracerebral hemorrhage: results of aclinical and computed tomographic follow-upstudy of 104 patients. Stroke 1988;19:192–5.
159. Darby DG, Donnan GA, Saling MA, Walsh KW,Bladin PF. Primary intraventricular haemorrhage:clinical and neuropsychological findings in aprospective series. Neurology 1988;38:68–75.
160. Weisberg LA, Stazio A. Occipital lobehemorrhages; clinical–computed tomographiccorrelations. Comput Med Imaging Graph1988;12:353–8.
161. Iwasaki Y, Kinoshita M. Lacunar syndrome andintracerebral hemorrhage: clinico-computedtomographic correlations. Comput Med ImagingGraph 1988;12:359–63.
162. Weisberg LA, Stazio A. Nontraumatic parietalsubcortical hemorrhage: clinical-computedtomographic correlations. Comput Med ImagingGraph 1989;13:355–61.
References
128
163. Astarloa R, Jimenez-Scrig A, Gimeno A.[Prognostic value of CAT scanning in spontaneoussupratentorial cerebral hemorrhage. Multivariatestudy in 114 patients]. Archivos de Neurobiologia1989;52:234–8.
164. Jayakumar PN, Taly AB, Bhavani UR, Arya BY,Nagaraja D. Prognosis in solitary intraventricularhaemorrhage. Clinical and computed tomographicobservations. Acta Neurol Scand 1989;80:1–5.
165. Schutz H, Bodeker RH, Damian M, Krack P,Dorndorf W. Age-related spontaneousintracerebral hematoma in a German community.Stroke 1990;21:1412–18.
166. Cerillo A, Villano M, Vizioli L, Narciso N,Tedeschi E, Bucchiero A, et al. Intracerebralhaemorrhage: criteria for prognosis on thegrounds of clinical and CT data. J Neurosurg Sci1990;34:123–36.
167. Weisberg LA, Stazio A, Elliott D, Shamsnia M.Putaminal hemorrhage: clinical–computedtomographic correlations. Neuroradiology1990;32:200–6.
168. Daverat P, Castel JP, Dartigues JF, Orgogozo JM.Death and functional outcome after spontaneousintracerebral hemorrhage. Stroke 1991;22:1–6.
169. Kreel L, Kay R, Woo J, Wong HY, Nicholls MG.The radiological (CT) and clinical sequelae ofprimary intracerebral haemorrhage. Br J Radiol1991;64:1096–100.
170. Franke CL, van Swieten JC, van Gijn J. Residuallesions on computed tomography afterintracerebral hemorrhage. Stroke 1991;22:1530–3.
171. Franke CL, van Swieten JC, Algra A, van Gijn J.Prognostic factors in patients with intracerebralhaematoma. J Neurol Neurosurg Psychiatry1992;55:653–7.
172. Lisk DR, Pasteur W, Rhoades H, Putnam RD,Grotta JC. Early presentation of hemisphericintracerebral hemorrhage: prediction of outcomeand guidelines for treatment allocation. Neurology1994;44:133–9.
173. Berlit P, Tornow K. Outcome of intracerebralhemorrhage: clinical and CT findings in 326patients. Eur J Neurol 1994;1:29–43.
174. Fujii Y, Tanaka R, Takeuchi S, Koike T, MinakawaT, Sasaki O. Hematoma enlargement inspontaneous intracerebral hemorrhage. J Neurosurg 1994;80:51–7.
175. Halpin SF, Britton JA, Byrne JV, Clifton A, Hart G,Moore A. Prospective evaluation of cerebralangiography and computed tomography incerebral haematoma. J Neurol Neurosurg Psychiatry1994;57:1180–6.
176. Passero S, Burgalassi L, D’Andrea P, Battistini N.Recurrence of bleeding in patients with primary
intracerebral hemorrhage [see comments]. Stroke1995;26:1189–92.
177. Dandapani BK, Suzuki S, Kelley RE, Reyes-IglesiasY, Duncan RC. Relation between blood pressureand outcome in intracerebral hemorrhage. Stroke1995;26:21–4.
178. Lampl Y, Gilad R, Eshel Y, Sarova-Pinhas I.Neurological and functional outcome in patientswith supratentorial hemorrhages. A prospectivestudy. Stroke 1995;26:2249–53.
179. Mori S, Sadoshima S, Ibayashi S, Fujishima M,Iino K. Impact of thalamic hematoma on six-month mortality and motor and cognitivefunctional outcome. Stroke 1995;26:620–6.
180. Qureshi AI, Safdar K, Weil J, Barch C, Bliwise DL,Colohan AR, et al. Predictors of early deteriorationand mortality in black Americans with spontaneousintracerebral hemorrhage. Stroke 1995;26:1764–7.
181. Mase G, Zorzon M, Biasutti E, Tasca G, Vitrani B,Cazzato G. Immediate prognosis of primaryintracerebral hemorrhage using an easy model forthe prediction of survival. Acta Neurol Scand1995;91:306–9.
182. Chaves CJ, Pessin MS, Chung CS, Amarenco P,Breen J, Fine J. Cerebellar haemorrhagicinfarction. Neurology 1996;46:346–9.
183. Kazui S, Naritomi H, Yamamoto H, Sawada T,Yamaguchi T. Enlargement of spontaneousintracerebral hemorrhage. Incidence and timecourse. Stroke 1996;27:1783–7.
184. Hsiang JN, Zhu XL, Wong LK, Kay R, Poon WS.Putaminal and thalamic hemorrhage in ethnicChinese living in Hong Kong. Surg Neurol 1996;46:441–5.
185. Eshwar Chandra N, Khandelwal N, Bapuraj JR,Mathuriya SN, Vasista RK, Kak VK, et al.Spontaneous intracranial hematomas: role ofdynamic CT and angiography. Acta Neurol Scand1998;98:176–81.
186. Butler AC, Tait RC. Restarting anticoagulation inprosthetic heart valve patients after intracranialhaemorrhage: a 2-year follow-up. Br J Haematol1998;103:1064–6.
187. Gonzalez-Duarte A, Cantu C, Ruiz-Sandoval JL,Barinagarrementeria F. Recurrent primarycerebral hemorrhage: frequency, mechanisms, andprognosis. Stroke 1998;29:1802–5.
188. Linfante I, Llinas RH, Caplan LR, Warach S. MRIfeatures of intracerebral hemorrhage within 2hours from symptom onset. Stroke 1999;30:2263–7.
189. Offenbacher H, Fazekas F, Schmidt R, Koch M,Fazekas G, Kapeller P. MR of cerebralabnormalities concomitant with primaryintracerebral haematomas. AJNR Am J Neuroradiol1996;17:573–8.
Health Technology Assessment 2004; Vol. 8: No. 1
129
© Queen’s Printer and Controller of HMSO 2004. All rights reserved.

190. Melhem ER, Patel RT, Whitehead RE, Bhatia RG,Rockwell DT, Jara H. MR imaging of hemorrhagicbrain lesions: a comparison of dual-echo gradient-and spin-echo and fast spin-echo techniques. AJRAM J Roentgenol 1998;171(3):797–802.
191. Edelman RR, Johnson K, Buxton R, Shoukimas G,Rosen KR, Davis KR. MR of hemorrhage: a newapproach. AJNR Am J Neuroradiol 1986;7:751–6.
192. Gomori JM, Grossman RI, Goldberg HI,Zimmerman RA, Bilaniuk LT. Intracranialhematomas: imaging by high-field MR. Radiology1985;157:87–93.
193. Zimmerman RD, Heier LA, Snow RB, Liu DPC,Kelly AB, Deck MDF. Acute intracranialhemorrhage: intensity changes on sequential MRscans at 0.5 T. AJNR Am J Roentgenol1988;150:651–61.
194. Shimizu T, Naritomi H, Kuriyama Y, Sawada T.Sequential changes of sodium magnetic resonanceimages after cerebral hemorrhage. Neuroradiology1992;34:301–4.
195. Liang L, Korogi Y, Sugahara T, Shigematsu Y,Okuda T, Ikushima I, et al. Detection ofintracranial hemorrhage with susceptibility-weighted MR sequences. AJNR Am J Neuroradiol1999;20:1527–34.
196. Tanaka A, Ueno Y, Nakayama Y, Takano K. Smallchronic haemorrhages and ischaemic lesions inassociation with spontaneous intracerebralhaematomas. Stroke 1999;30:1637–42.
197. Patel MR, Edelman RR, Warach S. Detection ofhyperacute primary intraparenchymal hemorrhageby magnetic resonance imaging. Stroke1996;27:2321–4.
198. Staffen W, Trinka E, McCoy M, Iglseder B,Unterrainer J, Ladurner G, et al. A comparison ofneuroimaging and clinical findings in 100 patientswith haemorrhagic infarction and intracerebralhaematoma. Aktuelle Neurologie 1998;25:69–73.
199. Steinbrich W, Gross-Fengels W, Krestin GP,Heindel Schreier WG. MRI examinations ofintracranial haematomas. An analysis of itssensitivity evolution and source of bleeding. Rofo:Fortschritte auf dem Gebiete der Rontgenstrahlen undder Nuklearmedizin 1990;152:534–43.
200. Tanaka T, Sakai T, Uemura K, Teramura A,Fujishima I, Yamamoto T. Magnetic resonanceimaging in the acute stage of cerebrovasculardisease – clinical comparison with computedtomography. Neurol Med Chir 1988;2 8: 974–80.
201. Schellinger PD, Jansen O, Fiebach JB, Hacke W,Sartor K. A standardized MRI stroke protocol:comparison with CT in hyperacute intracerebralhemorrhage. Stroke 1999;30:765–8.
202. Kinoshita T, Okudera T, Tamura H, Ogawa T,Hatazawa J. Assessment of lacunar hemorrhage
associated with hypertensive stroke by echo-planargradient-echo T2*-weighted MRI. Stroke 2000;31:1646–50.
203. Salgado ED, Weinstein M, Furlan AJ, Modic MT,Beck GJ, Estes M, et al. Proton magnetic resonanceimaging in ischemic cerebrovascular disease. AnnNeurol 1986;20:502–7.
204. Kertesz A, Black SE, Nicholson L, Carr T. Thesensitivity and specificity of MRI in stroke.Neurology 1987;37:1580–5.
205. Mayer TE, Schulte-Altedorneburg G, Droste DW,Bruckmann H. Serial CT and MRI of ischaemiccerebral infarcts: frequency and clinical impact ofhaemorrhagic transformation. Neuroradiology2000;42:233–9.
206. Arias M, Requena I, Pereiro I, Amigo ME, VenturaM, Quintans L, et al. CT vs MRI in the diagnosisof acute stroke. Arch Neurobiol 1992;55:50–6.
207. Mohr JP, Biller J, Hilal SK, Yuh WTC, TatemichiTK, Hedges S. Magnetic resonance versuscomputed tomographic imaging in acute stroke.Stroke 1995;26:807–12.
208. Van Goethem J, Van Laere M, De Moor J, ParizelPM. Subacute intracerebral hemorrhage: CT and MR characteristics. J Belge Radiol 1990;73:534–5.
209. Buell U, Kazner E, Rath M, Steinhoff H,Kleinhans E, Lanksch W. Sensitivity of computedtomography and serial scintigraphy incerebrovascular disease. Radiology 1979;131:393–8.
210. Soderstrom CE, Ericson K, Mettinger KL,Olivecrona H. Computed tomography and CSFspectrophotometry. Diagnosis and prognosis in300 patients with cerebrovascular disease. Scand JRehabil Med 1981;13:65–71.
211. Wall SD, Brant-Zawadzki M, Jeffrey RB, Barnes B.High frequency CT findings within 24 hours aftercerebral infarction. AJR AM J Roentgenol 1982;138:307–11.
212. Sandercock P, Molyneux A, Warlow C. Value ofcomputed tomography in patients with stroke:Oxfordshire Community Stroke Project. BMJ1985;290:193–7.
213. Brott T, Marler JR, Olinger CP, Adams HP,Tomsick T. Measurements of acute cerebralinfarction: lesion size by computed tomography.Stroke 1989;20:871–5.
214. Sotaniemi KA, Phytinen J, Myllyla VV. Correlationof clinical and computed tomographic findings instroke patients. Stroke 1990;21:1562–6.
215. Koudstaal PJ, van Gijn J, Frenken CW, Hijdra A,Lodder J, Vermeulen M, et al. TIA, RIND, minorstroke: a continuum, or different subgroups?Dutch TIA Study Group. J Neurol NeurosurgPsychiatry 1992;55:95–7.
References
130

216. Lindgren A, Norrving B, Rudling O, JohanssonBB. Comparison of clinical and neuroradiologicalfindings in first-ever stroke. A population-basedstudy. Stroke 1994;25:1371–7.
217. Firlik AD, Kaufmann AM, Wechsler LR, Firlik KS,Fukui MB, Yonas H. Quantitative cerebral bloodflow determinations in acute ischemic stroke.Relationship to computed tomography andangiography. Stroke 1997;28:2208–13.
218. Buttner T, Uffmann M, Gunes N, Koster O. EarlyCCT signs of supratentorial brain infarction:clinico-radiological correlations. Acta Neurol Scand1997;96:317–23.
219. Al-Buhairi AR, Phillips SJ, Llwellyn G, Jan MSJ.Prediction of infarct topography using theOxfordshire Community Stroke Projectclassification of stroke subtypes. J Stroke CerebrovascDis 1998;7:339–43.
220. Lev MH, Farkas J, Gemmete JJ, Hossain ST,Hunter GJ, Koroshetz WJ, et al. Acute stroke:improved nonenhanced CT detection – benefits ofsoft-copy interpretation by using variable windowwidth and center level settings. Radiology1999;213:150–5.
221. Scott JN, Buchan AM, Sevick RJ. Correlation ofneurological dysfunction with CT findings in earlyacute stroke. Can J Neurol Sci 1999;26:182–9.
222. Barber PA, Demchuk AM, Zhang J, Buchan AM.Validity and reliability of a quantitative computedtomography score in predicting outcome ofhyperacute stroke before thrombolytic therapy.ASPECTS Study Group. Alberta StrokeProgramme Early CT Score. Lancet 2000;355:1670–4.
223. von Kummer R, Nolte PN, Schnittger H, Thron A,Ringelstein EB. Detectability of cerebralhemisphere ischaemic infarcts by CT within 6 h ofstroke. Neuroradiology 1996;38:31–3.
224. Fazekas F, Fazekas G, Schmidt R, Kapeller P,Offenbacher H. Magnetic resonance imagingcorrelates of transient cerebral ischemic attacks.Stroke 1996;27:607–11.
225. Cosnard G, Duprez T, Grandin C, Smith AM,Munier T, Peeters A. Fast FLAIR sequence fordetecting major vascular abnormalities during the hyperacute phase of stroke: a comparison with MR angiography. Neuroradiology 1999;41:342–6.
226. Egelhof T, Essig M, von Kummer R, Dorfler A,Winter R, Sartor K. Acute ischemic cerebralinfarct: prospective serial observations by magneticresonance imaging. Rofo: Fortschritte auf dem Gebieteder Rontgenstrahlen und der Neuen BildgebendenVerfahren 1998;168:222–7.
227. Razumovsky AY, Gillard JH, Bryan RN, HanleyDF, Oppenheimer SM. TCD, MRA and MRI in
acute cerebral ischemia. Acta Neurol Scand1999;99:65–76.
228. Awad I, Modic M, Little JR, Furlan AJ, WeinsteinM. Focal parenchymal lesions in transient ischemicattacks: correlation of computed tomography andmagnetic resonance imaging. Stroke1986;17:399–403.
229. Simmons Z, Biller J, Adams HP Jr, Dunn V, JacobyCG. Cerebellar infarction: comparison ofcomputed tomography and magnetic resonanceimaging. Ann Neurol 1986;19:291–3.
230. Rothrock JF, Lyden PD, Hesselink JR, Brown JJ,Healy ME. Brain magnetic resonance imaging inthe evaluation of lacunar stroke. Stroke 1987;18:781–6.
231. Hommel M, Pollak P, Gaio JM, Besson G, BorgelF, Le Bas JF, et al. Magnetic resonance imaging inlateral medullary infarction. Rev Neurol (Paris)1988;144:272–8.
232. Miyashita K, Naritomi H, Sawada T, Nakamura M,Kuriyama Y, Ogawa M. Identification of recentlacunar lesions in cases of multiple smallinfarctions by magnetic resonance imaging. Stroke1988;19:834–9.
233. Arboix A, Marti-Vilalta JL, Pujol J, Sanz M.Lacunar cerebral infarct and nuclear magneticresonance. A review of sixty cases. Eur Neurol1990;30:47–51.
234. Bryan RN, Levy LM, Whitlow WD, Killian JM,Preziosi TJ, Rosario JA. Diagnosis of acute cerebralinfarction: comparison of CT and MR imaging.AJNR Am J Neuroradiol 1991;12:611–20.
235. Stapf C, Hofmeister C, Hartmann A, Marx P, MastH. Predictive value of clinical lacunar syndromesfor lacunar infarcts on magnetic resonance brainimaging. Acta Neurol Scand 2000;101:13–18.
236. New PJF, Scott WR, Schnur JA, Davis KR, TaverasJM. Computerized axial tomography with the EMIscanner. Radiology 1974;110:109–23.
237. Jacobs L, Kinkel WR, Heffner RR Jr. Autopsycorrelations of computerized tomography:experience with 6,000 CT scans. Neurology1976;26:1111–18.
238. Toghi H, Mochizuki H, Yamanouchi H, Iio M,Yamada H, Chiba K, et al. A comparison betweenthe computed tomogram and theneuropathological findings in cerebrovasculardisease. J Neurol 1981;224:211–20.
239. Sipponen JT. Visualization of brain infarction withnuclear magnetic resonance imaging. Neuroradiology1984;26:387–91.
240. Panzer RJ, Feibel JH, Barker WH, Griner PF.Predicting the likelihood of hemorrhage inpatients with stroke. Arch Intern Med 1985;145:1800–3.
Health Technology Assessment 2004; Vol. 8: No. 1
131
© Queen’s Printer and Controller of HMSO 2004. All rights reserved.

241. Wang AM, Lin JC, Rumbaugh CL. What isexpected of CT in the evaluation of stroke?Neuroradiology 1988;30:54–8.
242. Horowitz SH, Zito JL, Donnarumma R, Patel M.Computed tomographic–angiographic findingswithin the first five hours of cerebral infarction.Stroke 1991;22:1245–53.
243. Bendszus M, Urbach H, Meyer B, Schultheiss R,Solymosi L. Improved CT diagnosis of acutemiddle cerebral artery territory infarcts withdensity-difference analysis. Neuroradiology1997;39:127–31.
244. McAlister FA, Fisher BW, Houston SC. The timingof computed tomography in acute stroke: apractice audit. Can Assoc Radiol J 1997;48:123–9.
245. Johansson T. Cerebral infarctions with negative CTscans. Eur Neurol 1984;23:124–31.
246. Kinkel WR, Jacobs L. Computerized axialtransverse tomography in cerebrovascular disease.Neurology 1976;26:924–30.
247. Inoue Y, Takemoto K, Miyamoto T, Yoshikawa N,Taniguchi S, Saiwai S. Sequential computedtomography scans in acute cerebral infarction.Radiology 1980;135:655–62.
248. Moulin T, Cattin F, Crepin-Leblond T, Tatu L,Chavot D, Piotin M, et al. Early CT signs in acutemiddle cerebral artery infarction: predictive valuefor subsequent infarct locations and outcome.Neurology 1996;47:366–75.
249. Toni D, Iweins F, von Kummer R, Busse O,Bogousslavsky J, Falcou A, et al. Identification oflacunar infarcts before thrombolysis in the ECASSI study. Neurology 2000;54:684–8.
250. Toni D, Fiorelli M, De Michele M, Bastianello S,Sacchetti ML, Montinaro E, et al. Clinical andprognostic correlates of stroke subtypemisdiagnosis within 12 hours from onset[published erratum appears in Stroke1996;27:152]. Stroke 1995;26:1837–40.
251. Bryan RN, Willcott MR, Schneiders NJ. Nuclearmagnetic resonance evaluation of stroke. Apreliminary report. Radiology 1983;149:189–92.
252. Virapongse C, Mancuso A, Quisling R. Humanbrain infarcts: Gd-DTPA-enhanced MR imaging.Radiology 1986;161:785–94.
253. Kinkel PR, Kinkel WR, Jacobs L. Nuclear magneticresonance imaging in patients with stroke. SeminNeurol 1986;6:43–52.
254. Byrne JV, Kendall BE, Kingsley DPE, Moseley IF.Lesions of the brain stem: Assessment by magneticresonance imaging. Neuroradiology1989;31:129–33.
255. Crain MR, Yuh WTC, Greene GM, Loes DJ, RyalsTJ, Sato Y. Cerebral ischaemia: evaluation with
contrast-enhanced MR imaging. AJNR Am JNeuroradiol 1991;12:631–9.
256. Yuh WTC, Crain MR, Loes DJ, Greene GM, RyalsTJ, Sato Y. MR imaging of cerebral ischaemia:findings in the first 24 hours. AJNR Am JNeuroradiol 1991;12:621–9.
257. Sato A, Takahashi S, Soma Y, Ishii K, Kikuchi Y,Watanabe T, et al. Cerebral infarction: earlydetection by means of contrast-enhanced cerebralarteries at MR imaging. Radiology 1991;178:433–9.
258. Alberts MJ, Faulstich ME, Gray L. Stroke withnegative brain magnetic resonance imaging. Stroke1992;23:663–7.
259. Shimosegawa E, Inugami A, Okudera T, HatazawaJ, Ogawa T, Fujita H, et al. Embolic cerebralinfarction: MR findings in the first 3 hours afteronset. AJR Am J Roentgenol 1993;160:1077–82.
260. Yin W-M, Nagata K, Satoh Y, Yokoyama E,Watahiki Y, Yuya H, et al. Infratentorial infarction:correlation of MR findings with neurological andangiographical features. Neurol Res 1994;16:154–8.
261. Kim JS, Lee JH, Suh DC, Lee MC. Spectrum oflateral medullary syndrome: correlation betweenclinical findings and magnetic resonance imagingin 33 subjects. Stroke 1994;25:1405–10.
262. Brant-Zawadzki M, Atkinson DJ, Detrick M,Bradley WG, Scidmore G. Fluid-attenuatedinversion recovery (FLAIR) for assessment ofcerebral infarction. Initial clinical experience in 50patients. Stroke 1996;27:1187–91.
263. Mantyla R, Aronen HJ, Salonen O, KorpelainenM, Peltonen T, Standertskjold-Nordenstam C. Theprevalence and distribution of white-matterchanges on different MRI pulse sequences in apost-stroke cohort. Neuroradiology 1999;41:657–65.
264. Mantyla R, Aronen HJ, Salonen O, Pohjasvaara T,Korpelain M, Peltonen T. Magnetic resonanceimaging white matter hyperintensities andmechanism of ischemic stroke. Stroke1999;30:2053–8.
265. Sipponen JT, Kaste M, Ketonen L, Sepponen RE,Katevuo K, Sivula A. Serial nuclear magneticresonance (NMR) imaging in patients withcerebral infarction. J Comput Assist Tomography1983;7:585–9.
266. Smith AS, Weinstein MA, Modic MT. Magneticresonance with marked T2-weighted images:improved demonstration of brain lesions, tumor,and edema. AJR Am J Roentgenol 1985;145:949–55.
267. Steinbrich W, Friedmann G, Pawlik G, Bocher-Schwarz HG, Heiss WD. MR of ischemic brain diseases. A comparison with CT, PET (18-fluorodeoxyglucose) and angiographic results. Rofo: Fortschritte auf dem Gebiete derRontgenstrahlen und der Nuklearmedizin1986;145:173–81.
References
132

268. Biller J, Adams HP, Dunn V, Simmons Z, JacobyCG. Dichotomy between clinical findings and MRabnormalities in pontine infarction. J Comput AssistTomography 1986;10:379–85.
269. Cirillo S, Simonetti L, La Tessa G, Elefante R,Smaltino F. MR imaging and CT: comparativeadequacy in neuroradiology. Radiol Med (Torino)1988;76:390–8.
270. Imakita S, Nishimura T, Yamada N, Naito H,Takamiya M, Yamada Y, et al. Magnetic resonanceimaging of cerebral infarction: time course of Gd-DTPA enhancement and CT comparison.Neuroradiology 1988;30:372–8.
271. Hommel M, Besson G, Le Bas JF, Gaio JM, PollakP, Borgel F, et al. Prospective study of lacunarinfarction using magnetic resonance imaging.Stroke 1990;21:546–54.
272. Shuaib A, Lee D, Pelz D, Fox A, Hachinski VC.The impact of magnetic resonance imaging on themanagement of acute ischemic stroke. Neurology1992;42:816–18.
273. Krivoshapkin AL, Jacobson MG, Rabinovich SS.Correlation of MRI and CT data with outcome ofcerebral revascularization after stroke. Neurol Res1992;14(2 Suppl):211–13.
274. Boyko OB, Burger PC, Shelburne JD, Ingram P.Non-heme mechanisms for T1 shortening:pathologic, CT, and MR elucidation. AJNR Am JNeuroradiol 1992;13:1439–45.
275. Fiorelli M, Sacchetti ML, Toni D, Argentino C,Gori C, Di Biasi C, et al. Feasibility and usefulnessof conventional spin-echo MR imaging inhyperacute ischemic stroke: a comparison with CTscan. Circulation et Metabolisme du Cerveau 1993;10:5–10.
276. Maeda M, Abe H, Yamada H, Ishii Y. Hyperacuteinfarction: a comparison of CT and MRI,including diffusion-weighted imaging.Neuroradiology 1999;41:175–8.
277. Schuetz H, Dommer T, Boedeker RH, Damian M,Krack P, Dorndorf W. Changing pattern of brainhemorrhage during 12 years of computed axialtomography. Stroke 1992;23:653–6.
278. Brennan P, Silman A. Statistical methods forassessing observer variability in clinical measures.BMJ 1992;304:1491–4.
279. Schneider R, Kluge R, Willmes K. Interrateragreement for CT scans of patients with lacunarinfarcts and leuko-araiosis. Acta Neurol Scand1991;84:527–30.
280. Wardlaw J, Sellar R. A simple practicalclassification of cerebral infarcts on CT and itsinterobserver reliability. AJNR Am J Neuroradiol1994;15:1933–9.
281. von Kummer R, Holle R, Gizyska U, Hofmann E,Jansen O, Petersen D, et al. Interobserver
agreement in assessing early CT signs of middlecerebral artery infarction. AJNR Am J Neuroradiol1996;17:1743–8.
282. von Kummer R, Allen KL, Holle R, Bozzao L,Bastianello S, Manelfe C, et al. Acute stroke:usefulness of early CT findings beforethrombolytic therapy. Radiology 1997;205:327–33.
283. Besson G, Moulin T, Chavot D, Tatu L, Garnier P,Crepin-Leblond T. Intra-observer concordance ofthe neuroradiologic reviewing committee in CTscan reviewing in MAST-E. Acta Neurol Scand1998;98:292–3.
284. Marks MP, Holmgren EB, Fox AJ, Patel S, vonKummer R, Froehlich J. Evaluation of earlycomputed tomographic findings in acute ischemicstroke. Stroke 1999;30:389–92.
285. Grotta JC, Chui D, Lu M, Patel S, Levine SR.Agreement and variability in the interpretation ofearly CT changes in stroke patients qualifying forintravenous rTPA therapy. Stroke 1999;30:1528–33.
286. Roszler MH, McCarroll KA, Rashid T, DonovanKR, Kling GA. Resident interpretation ofemergency computed tomographic scans. InvestRadiol 1991;26:374–6.
287. Alfaro D, Levitt MA, English DK, Williams V,Eisenberg R. Accuracy of interpretation of cranialcomputed tomography scans in an emergencymedicine residency program. Ann Emerg Med1995;25:169–74.
288. Pullicino P, Snyder W, Munschauer F, Pordell R,Greiner F. Interrater agreement of computedtomography infarct measurement. J Neuroimaging1996;6:16–19.
289. Schriger DL, Kalafut M, Starkman S, Krueger M,Saver JL. Cranial computed tomographyinterpretation in acute stroke: physician accuracyin determining eligibility for thrombolytic therapy.JAMA 1998;279:1293–7.
290. Kalafut MA, Schriger DL, Saver JL, Starkman S.Detection of early CT signs of > 1/3 middlecerebral artery infarctions: interrater reliabilityand sensitivity of CT interpretation by physiciansinvolved in acute stroke care. Stroke 2000;31:1667–71.
291. Hacke W, Kaste M, Fieschi C, Toni D, Lesaffre E,von Kummer R, et al. Intravenous thrombolysiswith recombinant tissue plasminogen activator foracute hemispheric stroke. The EuropeanCooperative Acute Stroke Study (ECASS). JAMA1995;274:1017–25.
292. Darrow VC, Alvord EC Jr, Mack LA, Hodson WA.Histologic evolution of the reactions tohemorrhage in the premature human infant’sbrain. A combined ultrasound and autopsy studyand a comparison with the reaction in adults. Am JPathol 1988;130:44–58.
Health Technology Assessment 2004; Vol. 8: No. 1
133
© Queen’s Printer and Controller of HMSO 2004. All rights reserved.

293. Cote R, Hachinski VC, Shurvell BL, Norris JW,Wolfson C. The Canadian Neurological Scale: apreliminary study in acute stroke. Stroke 1986;17:731–7.
294. Kalafut M, Starkman S, Saver J, Villablanca P,Schriger D. Early infarct and haemorrhageinterpretation by emergency physicians:implications for thrombolytic therapy. Stroke1997;28:270.
295. Wardlaw JM, Dorman PJ, Lewis SC, SandercockPAG. Can stroke physicians and neuroradiologistsidentify signs of early cerebral infarction on CT? J Neurol Neurosurg Psychiatry 1999;67:651–3.
296. Paxton R, Ambrose J. EMI scanner: brief review of first 650 patients. Br J Radiol1974;47:530–65.
297. Wensley S, Keir S, Caine S, MacMahon M.Additional risk factors in atrial fibrillation patientsnot receiving warfarin. Age Ageing 1999;28:355–7.
298. Mead GE, Wardlaw JM, Lewis SC, McDowall M,Dennis MS. The influence of randomized trials onthe use of anticoagulants for atrial fibrillation. AgeAgeing 1999;28:441–6.
299. Muir KW, Weir CJ, Murray GD. Comparison ofneurological scales and scoring systems for acutestroke prognosis. Stroke 1996;27:1817–20.
300. Leker RR, Abramsky O. Early anticoagulation inpatients with prosthetic heart valves andintracerebral hematoma. Neurology 1998;50:1489–91.
301. Boeer A, Voth E, Henze T, Prange HW. Earlyheparin therapy in patients with spontaneousintracerebral haemorrhage. J Neurol NeurosurgPsychiatry 1991;54:466–7.
302. Wijdicks EFM, Schievink WI, Brown RD, MullanyCJ, Stoodley M, Weir BKA, et al. The dilemma ofdiscontinuation of anticoagulation therapy forpatients with intracranial hemorrhage andmechanical heart valves. Neurosurgery 1998;42:769–73.
303. Chamorro A, Vila N, Saiz A, Alday M, Tolosa E.Early anticoagulation after large cerebral embolicinfarction: a safety study. Neurology 1995;45:861–5.
304. Nakagawa T, Kubota T, Handa Y, Kawano H, SatoK. Intracranial hemorrhage due to long-termanticoagulant therapy in patients with prostheticheart valves – four case reports. Neurol Med Chir(Tokyo) 1995;35:156–9.
305. Pessin MS, Estol CJ, Lafranchise F, Caplan LR.Safety of anticoagulation after hemorrhagicinfarction. Neurology 1993;43:1298–303.
306. Kapp J, Neill WR, Salter JE, Barnes TY. Systemicheparin in the early management of rupturedintracranial aneurysms: review of 104 consecutive
cases and comparison with concurrent controls.Neurosurgery 1987;20:564–70.
307. Cerebral Embolism Study Group. Immediateanticoagulation of embolic stroke: brainhemorrhage and management options. Stroke1984;15:779–89.
308. Wang DZ, Futrell N, Taylon C, Millikan C.Anticoagulation for prevention of cerebral infarctsfollowing subarachnoid hemorrhage. Surg Neurol1995;44:270–4.
309. Brick JF, Cheek JC, Gutierrez AR. Hemorrhagiccardioembolic stroke: is anticoagulation absolutelycontraindicated? South Med J 1991;84:927–8.
310. Rothrock JF, Dittrich HC, McAllen S, Taft BJ,Lyden PD. Acute anticoagulation followingcardioembolic stroke. Stroke 1989;20:730–4.
311. Petty GW, Brown RD Jr, Whisnant JP, Sicks JD,O’Fallon WM, Wiebers DO. Frequency of majorcomplications of aspirin, warfarin, and intravenousheparin for secondary stroke prevention. Apopulation-based study. Ann Intern Med 1999;130:14–22.
312. Sulter G, Steen C, De Keyser J. Use of the BarthelIndex and modified Rankin scale in acute stroketrials. Stroke 1999;30:1538–41.
313. Ono H, Mizukami M, Kitamura K, Kikuchi H.Subarachnoid haemorrhage. Agents Actions 1984;15(suppl):259–72.
314. Mendelow AD, Stockdill C, Steers AJW, Hayes J,Gillingham FJ. Double-blind trial of aspirin inpatients receiving tranexamic acid forsubarachnoid haemorrhage. Acta Neurochir 1982;62:195–202.
315. Shaw MD, Foy PM, Conway M, Pickard JD,Maloney P, Spillane JA, et al. Dipyridamole andpostoperative ischemic deficits in aneurysmalsubarachnoid hemorrhage. J Neurosurg 1985;63:699–703.
316. Dickmann U, Voth E, Schicha H, Henza T, PrangeH, Emrich D. Heparin therapy, deep veinthrombosis and pulmonary embolism afterintracerebral haemorrhage. Klin Wochenschr 1988;66:1182–3.
317. Suzuki S, Sano K, Handa H, Asano T, Tamura A,Yonekawa Y, et al. Clinical study of OKY-046, athromboxane synthetase inhibitor, in prevention ofcerebral vasospasms and delayed cerebralischaemic symptoms after subarachnoidhaemorrhage due to aneurysmal rupture: arandomized double-blind study. Neurol Res 1989;11:79–88.
318. Tokiyoshi K, Ohnishi T, Nii Y. Efficacy and toxicityof thromboxane synthetase inhibitor for cerebralvasospasm after subarachnoid haemorrhage. SurgNeurol 1991;36:112–18.
References
134
319. Hop JW, Rinkel GJ, Algra A, Berkelbach van derSprenkel JW, van Gijn J. Randomized pilot trial ofpostoperative aspirin in subarachnoidhemorrhage. Neurology 2000;54:872–8.
320. Powers WJ. Acute hypertension after stroke: thescientific basis for treatment decisions. Neurology1993;43:461–7.
321. Boeer A, Voth E, Henze Th, Prange HW. Earlyheparin therapy in patients with spontaneousintracerebral haemorrhage. J Neurol NeurosurgPsychiatry 1991;54:466–7.
322. Juvela S. Aspirin and delayed cerebral ischemiaafter aneurysmal subarachnoid hemorrhage. J Neurosurg 1995;82:945–52.
323. Gubitz GJ, Sandercock PAG, Counsell C, Signorini D. Anticoagulants for acute ischaemicstroke (Cochrane Review). The Cochrane Library (Issue 4). Oxford: Update Software; 1999.
324. Decousus H, Leizorovicz A, Parent F, Page Y, Tardy B, Girard P, et al. A clinical trial of venacaval filters in the prevention of pulmonaryembolism in patients with proximal deep-veinthrombosis. Prevention du Risque d’EmboliePulmonaire par Interruption Cave Study Group. N Engl J Med 1998;338:409–15.
325. Drummond M, O’Brien B, Stoddart G, TorranceGW. Methods for the economic evaluation of health careprograms. 2nd ed. Oxford: Oxford University Press;1997.
326. Evers SMAA, Ament AJHA, Blaauw G. Economicevaluation in stroke research. A systematic review.Stroke 2000;31:1046–53.
327. Bahr AE, Hodges FJ. Efficacy of computedtomography of the head in changing patient careand health costs: a retrospective study. AJR Am JRoentgenol 1978;131:45–9.
328. Larson EB, Omen GS, Loop JW. Computedtomography in patients with cerebrovasculardisease: impact of a new technology on patientcare. AJR Am J Roentgenol 1978;131:35–40.
329. Britton M, Jonsson E, Marke L-A, Murray V.Diagnosing suspected stroke. A cost-effectivenessanalysis. Int J Technol Assess 1985;1:147–58.
330. van der Meulen JH, Limburg M, van Straten A,Habbema JD. Computed tomographic brain scansand antiplatelet therapy after stroke: a study of thequality of care in Dutch hospitals. Stroke 1996;27:633–8.
331. Gleason S, Furie K, Lev M, O’Donnell A,McMahon P, Beinfeld M. Potential influences ofacute CT on inpatient costs in patients withischaemic stroke. Acad Radiol 2001;8:955–64.
332. Heller R, Langhorne P, James E. Improving stroke outcomes: the benefits of increasing
availability of technology. Bull World Health Organ2002;78:1337–43.
333. Greive R, Dundas R, Beech R, Wolfe C. Thedevelopment and use of a method to compare thecosts of acute stroke across Europe. Age Ageing2001;30:67–72.
334. Broderick JP, Adams HP, Barsan W, Feinberg W,Feldman E, Grotta J, et al. Guidelines for themanagement of spontaneous intracerebralhemorrhage. A statement for healthcareprofessionals from a special writing group of theStroke Council, American Heart Association. Stroke1999;30:905–15.
335. Scottish Intercollegiate Guidelines Network(SIGN). Antithrombotic therapy. SIGN 36.Edinburgh: SIGN; 1999.
336. Dorman P, Sandercock P. Access to computedtomography in British accident and emergencydepartments. BMJ 1997;314:440–1.
337. Weir NU, Dennis MS, on behalf of the ScottishOutcomes Group. Towards a national system formonitoring the quality of hospital-based strokeservices. Stroke 2001;32:1415–21.
338. Weinstein MC, Fineberg HV. Clinical decisionanalysis. Philadelphia, PA: WB Saunders; 1980.
339. Bamford J, Sandercock P, Warlow C, Slattery J.Interobserver agreement for the assessment ofhandicap in stroke patients. Stroke 1989;20:828.
340. Counsell C, Boonyakarnkul S, Dennis M,Sandercock P, Bamford J, Burn J. Primaryintracerebral haemorrhage in the OxfordshireCommunity Stroke Project. 2. Prognosis.Cerebrovasc Dis 1995;5:26–34.
341. Hallan S, Asberg A, Indredavik B, Wideroe TE.Quality of life after cerebrovascular stroke: asystematic study of patients’ preferences fordifferent functional outcomes. J Intern Med 1999;246:309–16.
342. Dennis M, Wellwood I, Warlow C. Are simplequestions a valid measure of outcome after stroke?Cerebrovasc Dis 1997;7:227–34.
343. Post PN, Stiggelbout A, Wakker P. Utility of healthstates after stroke. A systematic review of theliterature. Stroke 2001;32:1425–9.
344. EuroQol Group. EuroQol – a new facility for themeasurement of health-related quality of life.Health Policy 1990;16:199–208.
345. EuroQol Group. A measure of health related quality oflife developed by the EuroQol Group. Rotterdam:EuroQol; 1996.
346. MVH Group. The measurement and valuation ofhealth. Final report on the modelling of valuation
Health Technology Assessment 2004; Vol. 8: No. 1
135
© Queen’s Printer and Controller of HMSO 2004. All rights reserved.
References
136
tariffs. York: Centre for Health Economics,University of York; 1995.
347. NHS Executive. Health Service Cost Index (HCHSspecific price inflation) September 2000 (October2000), Financial Matters, Appendix 1. Leeds: NHSExecutive; 2000.
348. NHS Executive (2000). Health service cost index(HCHS specific price inflation), September 2001,financial matters, Appendix 1. Leeds: NHSExecutive; 2000.
349. NHS Executive. Reference costs. Leeds: NHSExecutive; 2001.www.doh.gov.uk/nhsexec/refcosts.htm
350. Antiplatelet Trialists’ Collaboration. Collaborativeoverview of randomised trials of antiplatelettherapy – III: reduction in venous thrombosis andpulmonary embolism by antiplatelet prophylaxisamong surgical and medical patients. BMJ1994;308:235–46.
351. Ferguson A, McCabe CJ, Sheffield: Trent Institutefor Health Services Research, Universities ofLeicester Nottingham and Sheffield. The clinicaland cost-effectiveness of computed tomography inthe management of transient ischaemic attack andstroke. Trent Institute for Health ServicesResearch; 1997.
352. The Wessex Institute for Health Research &Development. CT scanning within 48 hours afterstroke. Southampton: University of Southampton;1998.
353. Drummond MF, O’Brien B, Stoddart GL,Torrance G. Methods for the economic evaluation ofhealth care programme. Oxford: Oxford UniversityPress; 1997.
354. Donaldson C, Shackley P. Economic evaluation. InDetels R, Holland W, Omenn GS, editors. Oxfordtextbook of public health. 3rd ed. Oxford: OxfordUniversity Press; 1997.
355. Scott A, Harrold T, Russell E. Evaluation ofcommunity cardiology in Grampian (final report). Aberdeen: Health Economics ResearchUnit (HERU), University of Aberdeen; 1999.
356. Netten A, Curtis L. Unit cost of health and socialcare 2000. 2000. Kent: Personal Social ServicesResearch Unit.http://www.ukc.ac.uk/pssru/PDFfiles/UC2000.pdf
357. Heart Protection Study Collaborative Group.MRC/BHF Heart Protection Study of cholesterollowering with simvastatin in 20,536 high-riskindividuals: a randomised placebo-controlled trial.Lancet 2002;360(9326):7–22.

Primary intracerebral haemorrhage:haemorrhage into the brain parenchyma not
arising as a result of trauma
Stroke: sudden onset of a focal neurological deficitdue to a vascular cause with symptoms lastingmore than 24 hours.
Stroke-like syndrome: features consistent with astroke but due to a non-vascular lesion such as aninfarct or a haemorrhage
Health Technology Assessment 2004; Vol. 8: No. 1
137
© Queen’s Printer and Controller of HMSO 2004. All rights reserved.
Appendix 1
Definitions


Health Technology Assessment 2004; Vol. 8: No. 1
139
© Queen’s Printer and Controller of HMSO 2004. All rights reserved.
Appendix 2
Tables of information sought at start of project, likely sources and information contained therein
TABLE 63 Module: aspirin for acute stroke treatment
Clinical problem Information needed Numbers and comments
1. Subject has a stroke
For the proportion who are admitted to hospital:
Proportion who are admitted tohospital (in the UK)
From latest Stroke Association Survey67:10,500 stroke patients in hospital in UK on a single
day124,000 admitted per year (~2/1000 population
per year, ~ 340 per day)For UK population, can expect 111,000 first
strokes and 132,000 total strokes per year~ 85% strokes are admitted to hospital
2. Of those referred as a‘stroke’, how many arethought to have had adefinite/probable/possiblestroke when seen by thespecialist physician?
Difference between specialist andnon-specialist diagnosis of strokein inpatients
No direct comparison studies found. Studies foundlooking at accuracy of diagnosis always retrospectivewith full notes and scans (by neurologist), with latterused as gold standard rather than comparative
3. How many definite/probable/possible strokes have aninfarct/haemorrhage/non-vascular pathology, e.g.tumour on brain scanningwithin 5–10 days?
Proportion of strokes withinfarcts/haemorrhages/tumours/abscesses, etc., on CT
From literature: misdiagnosis (i.e. admitted withpossible stroke, turn out not to have one) rangesfrom 1.4 to 33% depending on whether CT or not(former yes, latter no). Some include non-brainprimary pathology, e.g. metabolic problem
4. Of definite/probable strokes,what proportion haveinfarct/haemorrhage on CTby stroke syndrome (i.e.TACI, PACI, etc., or somemeasure of stroke severity)?and
How the probability of having ahaemorrhage alters with strokesyndrome/severity
From Copenhagen study,79 using Scandinavian StrokeScore. Risk of ICH increased with severity of stroke:
3.6% with mild stroke had ICH26.4% with very severe stroke had ICH(7.3 times more likely to have ICH with very
severe stroke)Note: study had major drawbacks, stacked againstpicking up small haemorrhages
5. Does the ability of CT todistinguish infarct fromhaemorrhage vary with stroke syndrome?
What is the latest time after strokethat CT can reliably detect smallor large haemorrhages?
Literature suggests 5 days for small haemorrhage The CT versus MR study says 8 days
6. Are patients who are alreadyon aspirin at the time of theirstroke more likely to havehad a haemorrhage than aninfarct?
Does aspirin increase thelikelihood of haemorrhagic stroke?
From JAMA129 (systematic review of mixed primaryand secondary prevention studies), there is anincreased risk of haemorrhagic stroke of 12/10,000(5–20) offset by a reduction in ischaemic stroke of39/10,000 (17–61). Need to give 833 an aspirin tocause a haemorrhagic stroke. From Perth77,124: proportion of those taking aspirinor anticoagulant when had first ever stroke wassignificantly less for ICH than for ischaemic stroke(17% versus 35%)
continued

Options: scan all, scan none, scan just severestrokes, scan just possibles/probables not definites,scan those on aspirin already only, scan on day ofadmission versus sometime within 5–10 days, butstart aspirin on admission.
1. Scan allWould pick up 2–33% of those not stroke anddirect to correct management more quicklyWould pick up ~10–20% of ICHWould therefore avoid aspirin or heparin in ICHpossibly, thereby avoiding:
between 70 fewer and 35 more deaths orrecurrent strokes/1000 with aspirinbetween 19 fewer and 102 more deaths orrecurrent strokes/1000 with heparin.
2. Scan noneMiss the above and therefore treat inappropriatelyup to 33% of ‘strokes’ (miss tumours, epilepsy, etc.,thus having a knock-on effect) and 10–20% ICH,causing up to 35/1000 more deaths/recurrentstrokes in the ICH group and mayhem amongnon-strokes.
3. Scan severe strokes (using ‘very severe’ datafrom Copenhagen)79
Increase the amount of bleeds found by 7.3 times,but this is the group in which stroke scores workbest. Therefore, it could be argued that oneshould use scores on those and only scan mildstrokes.
4. Scan possible/probable strokesNot an easy distinction to make; it would be likescanning all of them.
5. Scan those on aspirin alreadyVery dubious data, if any, to suggest that that is agood reason to suspect an ICH.
6. Scan on day of admissionAvoid numbers in (1).
7. Stratify scanning So that urgent ones get done on day 1 and lessurgent ones on day 2 or 3, but all get done in < 5days (might offer cheaper resource use?)
Appendix 2
140
TABLE 63 Module: aspirin for acute stroke treatment (cont’d)
Clinical problem Information needed Numbers and comments
7. Does early aspirin useincrease the risk of a pooroutcome after haemorrhagicstroke?
Does aspirin increase deaths andnon-fatal strokes, or reduceDVTs/PEs in patients withintracranial haemorrhage?
Systematic review: no good data in the literatureIST/CAST data (treatment following ICH)43:
Aspirin: 18/1000 reduction in non-fatal stroke or death at 2 weeks (70 fewer to 35 more)
Heparin: 41/1000 increase in non-fatal stroke or death at 2 weeks (19 fewer to 102 more)
8. Does aspirin cause moreharm to patients with largethan small intracranialhaemorrhages?
What are the absolute risks ofpoor outcomes in large versussmall haemorrhages given aspirin,i.e. it might not cause harm tosmall haemorrhages, but might tolarge haemorrhages
No data in literatureIST/CAST data sample size not large enough to use
9. Would aspirin given long term(i.e. for more than a fewdays) to patients withhaemorrhages cause moreharm?
Does aspirin cause harm if givencontinuously (a) in the acute phaseand (b) in the long term in patientswith PICH?
Systematic review: most data in literature on SAHIST/CAST: wide confidence intervals for death,recurrent intracranial haemorrhage43
No data on long-term administration ofantithrombotic treatment after ICH
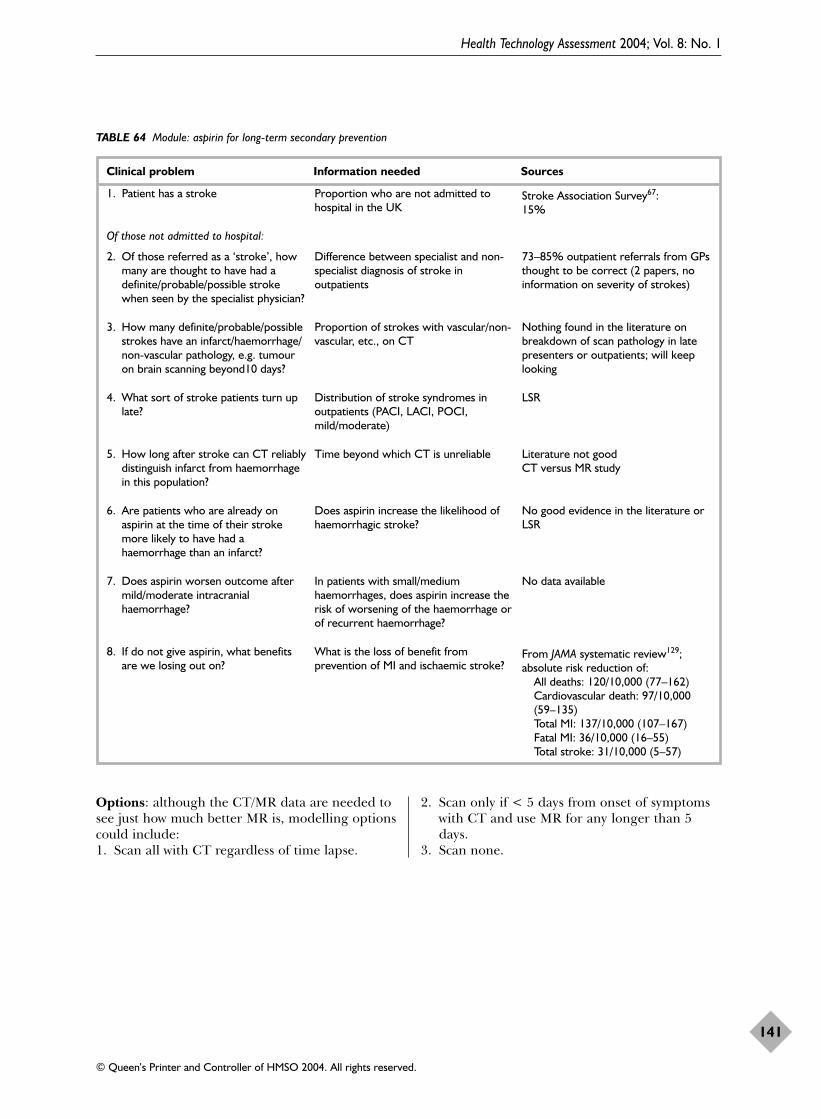
Options: although the CT/MR data are needed tosee just how much better MR is, modelling optionscould include:1. Scan all with CT regardless of time lapse.
2. Scan only if < 5 days from onset of symptomswith CT and use MR for any longer than 5days.
3. Scan none.
Health Technology Assessment 2004; Vol. 8: No. 1
141
© Queen’s Printer and Controller of HMSO 2004. All rights reserved.
TABLE 64 Module: aspirin for long-term secondary prevention
Clinical problem Information needed Sources
1. Patient has a stroke Proportion who are not admitted tohospital in the UK
Stroke Association Survey67:15%
Of those not admitted to hospital:
2. Of those referred as a ‘stroke’, howmany are thought to have had adefinite/probable/possible strokewhen seen by the specialist physician?
Difference between specialist and non-specialist diagnosis of stroke inoutpatients
73–85% outpatient referrals from GPsthought to be correct (2 papers, noinformation on severity of strokes)
3. How many definite/probable/possiblestrokes have an infarct/haemorrhage/non-vascular pathology, e.g. tumouron brain scanning beyond10 days?
Proportion of strokes with vascular/non-vascular, etc., on CT
Nothing found in the literature onbreakdown of scan pathology in latepresenters or outpatients; will keeplooking
4. What sort of stroke patients turn uplate?
Distribution of stroke syndromes inoutpatients (PACI, LACI, POCI,mild/moderate)
LSR
5. How long after stroke can CT reliablydistinguish infarct from haemorrhagein this population?
Time beyond which CT is unreliable Literature not goodCT versus MR study
6. Are patients who are already onaspirin at the time of their strokemore likely to have had ahaemorrhage than an infarct?
Does aspirin increase the likelihood ofhaemorrhagic stroke?
No good evidence in the literature orLSR
7. Does aspirin worsen outcome aftermild/moderate intracranialhaemorrhage?
In patients with small/mediumhaemorrhages, does aspirin increase therisk of worsening of the haemorrhage orof recurrent haemorrhage?
No data available
8. If do not give aspirin, what benefitsare we losing out on?
What is the loss of benefit fromprevention of MI and ischaemic stroke?
From JAMA systematic review129;absolute risk reduction of:
All deaths: 120/10,000 (77–162)Cardiovascular death: 97/10,000(59–135)Total MI: 137/10,000 (107–167)Fatal MI: 36/10,000 (16–55)Total stroke: 31/10,000 (5–57)

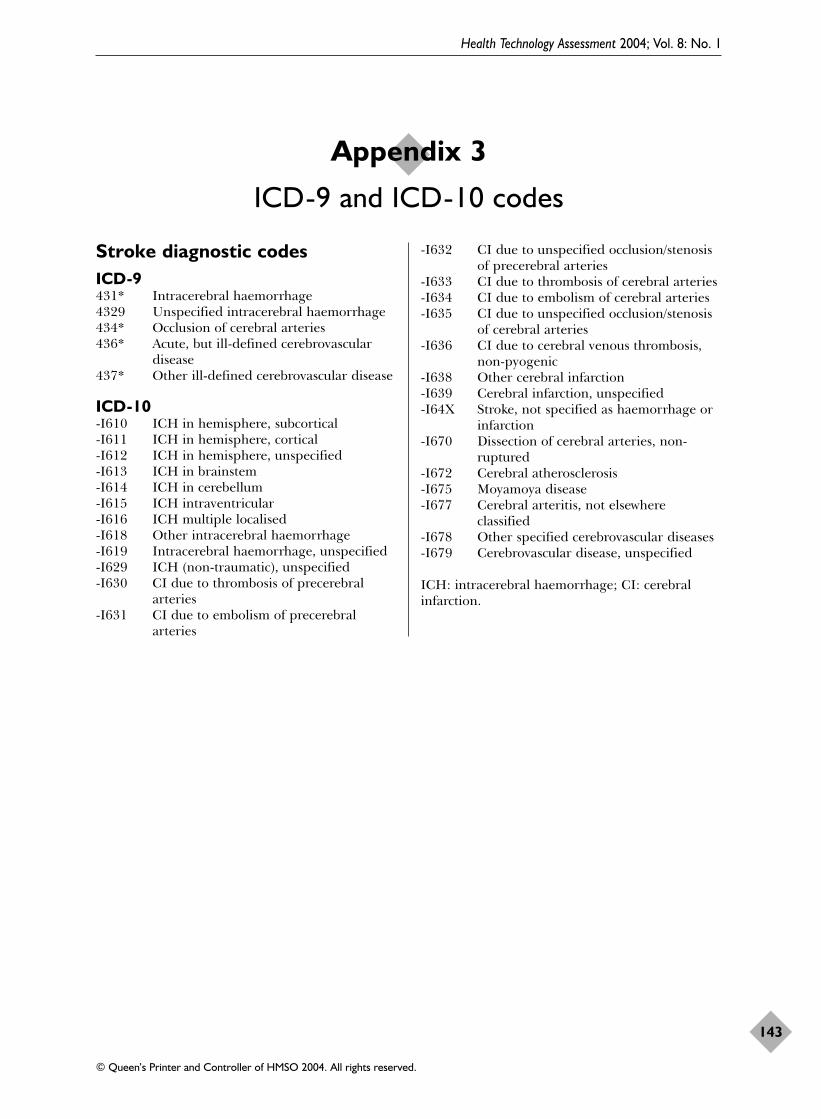
Health Technology Assessment 2004; Vol. 8: No. 1
143
© Queen’s Printer and Controller of HMSO 2004. All rights reserved.
Stroke diagnostic codesICD-9431* Intracerebral haemorrhage4329 Unspecified intracerebral haemorrhage434* Occlusion of cerebral arteries436* Acute, but ill-defined cerebrovascular
disease437* Other ill-defined cerebrovascular disease
ICD-10-I610 ICH in hemisphere, subcortical-I611 ICH in hemisphere, cortical-I612 ICH in hemisphere, unspecified-I613 ICH in brainstem-I614 ICH in cerebellum-I615 ICH intraventricular-I616 ICH multiple localised-I618 Other intracerebral haemorrhage-I619 Intracerebral haemorrhage, unspecified-I629 ICH (non-traumatic), unspecified-I630 CI due to thrombosis of precerebral
arteries-I631 CI due to embolism of precerebral
arteries
-I632 CI due to unspecified occlusion/stenosisof precerebral arteries
-I633 CI due to thrombosis of cerebral arteries-I634 CI due to embolism of cerebral arteries-I635 CI due to unspecified occlusion/stenosis
of cerebral arteries-I636 CI due to cerebral venous thrombosis,
non-pyogenic-I638 Other cerebral infarction-I639 Cerebral infarction, unspecified-I64X Stroke, not specified as haemorrhage or
infarction-I670 Dissection of cerebral arteries, non-
ruptured-I672 Cerebral atherosclerosis-I675 Moyamoya disease-I677 Cerebral arteritis, not elsewhere
classified-I678 Other specified cerebrovascular diseases-I679 Cerebrovascular disease, unspecified
ICH: intracerebral haemorrhage; CI: cerebralinfarction.
Appendix 3
ICD-9 and ICD-10 codes


Electronic search strategies forimaging and treatment of strokeGlossary of search terms/ MEDLINE subject heading (MESH)mp. Title, abstract, heading word, trade
name, manufacturer name.tw Identifies the word specified in the title
or abstract
ti. Identifies word specified in title$ Identifies any word beginning with the
text preceding itor In the search parameter specified, the
article only has to be found in one of thesearch terms
and In the search specified, the article mustbe found in all search terms
Health Technology Assessment 2004; Vol. 8: No. 1
145
© Queen’s Printer and Controller of HMSO 2004. All rights reserved.
Appendix 4
Search strategies for imaging and epidemiology
TABLE 65 Expanded search strategy for stroke: EMBASE
Search history
1 exp cerebrovasc disease/2 stroke$.tw3 cerebrovascular$.tw4 (cerebral or cerebellar or brainstem or vertebrobasilar).tw5 (infarct$ or isch?emi$ or thrombo$ or emboli$).tw6 4 and 57 carotid$.tw8 (cerebral or intraventricular or brainstem or cerebellar).tw9 (infratentorial or supratentorial or subarachnoid).tw10 (brain or intraventricular or brainstem or cerebellar).tw11 8 or 9 or 1012 (haemorrhage or hemorrhage or haematoma or hematoma).tw13 (bleeding or aneurysm).tw14 12 or 1315 11 and 1416 thrombo$.tw17 (intracranial or (venous adj5 sinus$) or (sagittal adj5 venous) or sagittal vein).tw18 16 and 1719 transient isch?emic attack$.tw20 reversible isch?emic neurologic$ deficit$.tw21 venous malformation$.tw22 arteriovenous malformation$.tw23 21 or 2224 11 and 2325 exp aphasia/26 dysphasia/27 hemianopia/28 hemiplegia/29 hemiparesis/30 (aphasi$ or dysphasi$ or hemianop$).tw31 (hemipleg$ or hemipar$).tw32 exp carotid artery surgery/33 Or/1-3, 6-7, 18-20, 24-32

To this expanded search strategy, the followingterms were added:
1. Sensitivity of CT and MRI in the identificationof haemorrhagic and ischaemic stroke:exp computed assisted tomography/or“computed tomography”.mpcomputed tomograph$.tiexp nuclear magnetic resonance imaging or“magnetic resonance imaging”.mpnuclear magnetic resonance imaging ormagnetic resonance.ti(computed tomography or CT).mp and(nuclear magnetic resonance or “magneticresonance imaging”).mp(accuracy or sensitivity or specificity).twstroke adj10 diagnosis
Note: using ‘.tw’ was too non-specific whenattached to scanning terms, therefore searchwas restricted to ‘.ti’
2. Scanning policies in community strokeincidence studies:(register or registry).twexp incidence/incidence study.tw
Notes: using terms for epidemiology provedtoo non-specific, and it was more successful inidentifying studies then deciding if they werecommunity based, rather than attempting toidentify them electronically.
3. The use of antithrombotic drugs followingacute intracranial haemorrhage:To the part of the extended search strategy thatpertains to haemorrhagic stroke were addedthe following terms:exp acetylsalicylic acid/(aspirin or asa).twexp anticoagulant agent
4. The use of magnetic resonance diffusion-weighted imaging and perfusion imaging inthe identification of haemorrhagic andischaemic stroke:(diffusion-weighted or DWI).tw(perfusion or perfusion-imaging.twdynamic susceptibility.tw
Appendix 4
146
TABLE 66 Expanded search strategy for stroke: MEDLINE
MEDLINE terms MEDLINE terms
1 exp cerebrovascular disorders/2 stroke$.tw3 cerebrovascular$.tw4 (cerebral or cerebellar or brainstem or
vertebrobasilar).tw5 (infarct$ or isch?emi$ or thrombo$ or emboli$).tw6 4 and 57 carotid$.tw8 (cerebral or intracerebral or intracranial or
parenchymal).tw9 (brain or intraventricular or brainstem or
cerebellar).tw10 (infratentorial or supratentorial or subarachnoid).tw11 8 or 9 or 1012 (haemorrhage or hemorrhage or haematoma or
hematoma).tw13 (bleeding or aneurysm).tw14 12 or 1315 11 and 1416 thrombo$.tw17 (intracranial or (venous adj5 sinus$) or sagittal adj5
venous) or (sagittal adj5 vein)).tw
18 16 and 1719 transient isch?emic attack$.tw20 reversible isch?emic neurologic$ deficit.tw21 venous malformation$.tw22 arteriovenous malformation$.tw23 21 or 2224 11 and 2325 exp aphasia/26 hemianopsia/27 hemiplegia/28 (aphasi$ or dysphasi$ or hemianop$).tw29 (hemiplegi$ or hemipar$).tw30 25 or 26 or 27 or 28 or 2931 or/1-3, 6-7, 15, 18-20, 24, 3032 leukomalacia, periventricular/33 cerebral anoxia/34 exp dementia, vascular/35 exp vascular headache/36 migrain$.tw37 32 or 33 or 34 or 35 or 3638 31 not 37

To the expanded search strategy were added thefollowing terms:
1. Sensitivity of CT and MRI in the identificationof haemorrhagic and ischaemic stroke:exp tomography Xray computed/ or computedtomography.mp(computed tomograph$ or CT).tiexp magnetic resonance imaging/ magneticresonance imaging.mp(magnetic resonance or MR).ti((computed tomography or CT) adj10(magnetic resonance or MR)).ti(accuracy or sensitivity or specificity).twstroke adj10 diagnosis.tw
2. Scanning policies in community strokeincidence studiesregister or registry.twincidence study.tw
3. The use of antithrombotic drugs followingacute intracranial haemorrhage:To the part of the extended search strategy thatpertains to haemorrhagic stroke were addedthe following terms:exp aspirin/aspirin.twacetyl salicylic acid.twexp anticoagulants/
4. The use of magnetic resonance diffusion-weighted imaging and perfusion imaging inthe identification of haemorrhagic andischaemic stroke:(diffusion-weighted or DWI).tw(perfusion or perfusion-imaging.twdynamic susceptibility.tw
Electronic search strategies for CT cost-effectiveness studiesMEDLINE (Ovid)1. exp cerebrovascular disorders/2. stroke$.tw.3. cerebrovascular$.tw.4. (cerebral or cerebellar or brainstem or
vertebrobasilar).tw.5. (infarct$ or isch?emi$ or thrombo$ or
emboli$).tw.6. 4 and 57. (cerebral or intracerebral or intracranial or
parenchymal).tw.8. (brain or intraventricular or brainstem or
cerebellar).tw.
9. (infratentorial or supratentorial orsubarachnoid).tw.
10. or/7-911. (haemorrhage or hemorrhage or haematoma
or hematoma).tw.12. (bleeding or aneurysm).tw.13. 11 or 1214. 10 and 1315. carotid$.tw.16. thrombo$.tw.17. (intracranial or (venous adj5 sinus$) or
(sagittal adj5 venous) or (sagittal adj5vein)).tw.
18. 16 and 1719. transient isch?emic attack$.tw.20. reversible isch?emic neurologic$ defecit.tw.21. venous malformation$.tw.22. arteriovenous malformation$.tw.23. 21 or 2224. 10 and 2325. exp aphasia/26. hemianopsia/27. hemiplegia/28. (aphasi$ or dysphasi$ or hemianop$).tw.29. (hemiplegi$ or hemipar$).tw.30. or/25-2931. or/1-3,6,14-15,18-20,24,3032. leukomalacia, periventricular/33. cerebral anoxia/34. exp dementia, vascular/35. exp Vascular Headaches/36. migrain$.tw.37. or/32-3638. 31 not 3739. Tomography, X-Ray Computed/40. (computed tomograph$ or ct).tw.41. 39 or 4042. 38 and 4143. exp economics/44. economic evaluation.tw.45. economic$.tw.46. cost effective$.tw.47. Tomography, X-Ray Computed/ec
[Economics]48. or/43-4749. 42 and 4850. limit 49 to english language51. cost$.tw.52. 48 or 5153. 42 and 5254. limit 53 to english language55. Magnetic Resonance Imaging/56. mri.tw.57. 55 or 5658. magnetic resonance imaging/ec59. or/43-46,51,5860. 38 and 57 and 59
Health Technology Assessment 2004; Vol. 8: No. 1
147
© Queen’s Printer and Controller of HMSO 2004. All rights reserved.

Appendix 4
148
61. 60 not 5362. limit 61 to english language63. from 62 keep 1-29
EMBASE (Ovid)1. exp cerebrovascular disease/2. stroke$.tw.3. cerebrovascular$.tw.4. (cerebral or cerebellar or brainstem or
vertebrobasilar).tw.5. (infarct$ or isch?emi$ or thrombo$ or
emboli$).tw.6. 4 and 57. carotid$.tw.8. (cerebral or intracerebral or intracranial or
parenchymal).tw.9. (infratentorial or supratentorial or
subarachnoid).tw.10. (brain or intraventricular or brainstem or
cerebellar).tw.11. or/8-1012. (haemorrhage or hemorrhage or haematoma
or hematoma).tw.13. (bleeding or aneurysm).tw.14. 12 or 1315. 11 and 1416. thrombo$.tw.17. (intracranial or (venous adj5 sinus$) or
(sagittal adj5 venous) or (sagittal adj5vein)).tw.
18. 16 and 1719. transient isch?emic attack$.tw.20. reversible isch?emic neurologic$ defecit.tw.21. venous malformation$.tw.22. atriovenous malformation$.tw.23. 21 or 2224. 11 and 2325. exp aphasia/
26. Hemianopia/27. hemiplegia/28. (aphasi$ or dysphasi$ or hemianop$).tw.29. or/25-2830. or/1-3,6-7,15,18-20,24,2931. exp Computer Assisted Tomography/32. (computed tomograph$ or ct).tw.33. 31 or 3234. 30 and 3335. exp economic aspect/36. economic evaluation.tw. 37. cost effective$.tw.38. cost$.tw.39. economic$.tw.40. or/35-3941. 34 and 4042. limit 41 to english43. Nuclear Magnetic Resonance Imaging/44. mri.tw.45. 43 or 4446. 30 and 40 and 4547. 46 not 4148. limit 47 to english49. from 48 keep 1-39
SCIENCE CITATION INDEX AND SOCIALCITATION INDEX DATABASES (Web of Science)(stroke or cerebrovascular or vascular or cerebralor subarachnoid) AND (tomography OR ct ORmagnetic resonance OR mri) AND (economic* ORcost*)
NHS CRD DATABASES (DARE, NHS EED, HTA) (stroke or cerebrovascular or vascular or cerebralor subarachnoid)/All Fields OR dementia/SubjectHeadings) AND (tomography OR ct OR magneticOR mri/All fields)
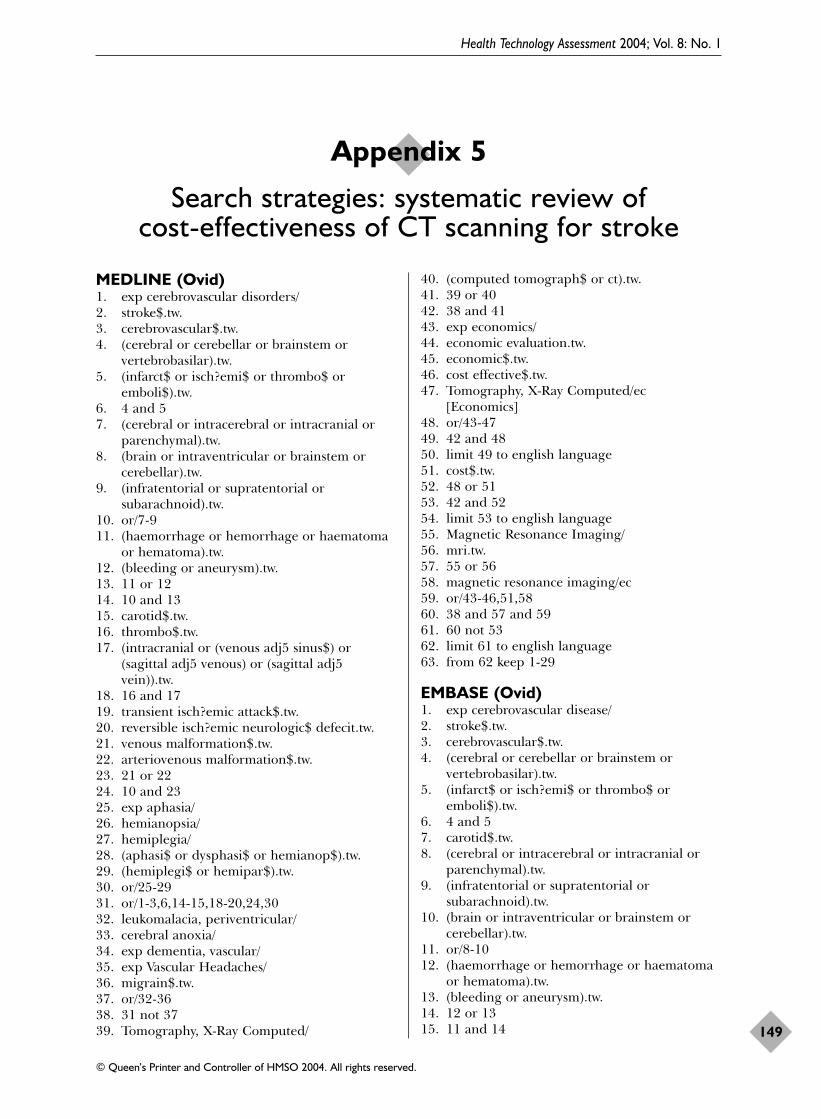
Health Technology Assessment 2004; Vol. 8: No. 1
149
© Queen’s Printer and Controller of HMSO 2004. All rights reserved.
MEDLINE (Ovid)1. exp cerebrovascular disorders/2. stroke$.tw.3. cerebrovascular$.tw.4. (cerebral or cerebellar or brainstem or
vertebrobasilar).tw.5. (infarct$ or isch?emi$ or thrombo$ or
emboli$).tw.6. 4 and 57. (cerebral or intracerebral or intracranial or
parenchymal).tw.8. (brain or intraventricular or brainstem or
cerebellar).tw.9. (infratentorial or supratentorial or
subarachnoid).tw.10. or/7-911. (haemorrhage or hemorrhage or haematoma
or hematoma).tw.12. (bleeding or aneurysm).tw.13. 11 or 1214. 10 and 1315. carotid$.tw.16. thrombo$.tw.17. (intracranial or (venous adj5 sinus$) or
(sagittal adj5 venous) or (sagittal adj5vein)).tw.
18. 16 and 1719. transient isch?emic attack$.tw.20. reversible isch?emic neurologic$ defecit.tw.21. venous malformation$.tw.22. arteriovenous malformation$.tw.23. 21 or 2224. 10 and 2325. exp aphasia/26. hemianopsia/27. hemiplegia/28. (aphasi$ or dysphasi$ or hemianop$).tw.29. (hemiplegi$ or hemipar$).tw.30. or/25-2931. or/1-3,6,14-15,18-20,24,3032. leukomalacia, periventricular/33. cerebral anoxia/34. exp dementia, vascular/35. exp Vascular Headaches/36. migrain$.tw.37. or/32-3638. 31 not 3739. Tomography, X-Ray Computed/
40. (computed tomograph$ or ct).tw.41. 39 or 4042. 38 and 4143. exp economics/44. economic evaluation.tw.45. economic$.tw.46. cost effective$.tw.47. Tomography, X-Ray Computed/ec
[Economics]48. or/43-4749. 42 and 4850. limit 49 to english language51. cost$.tw.52. 48 or 5153. 42 and 5254. limit 53 to english language55. Magnetic Resonance Imaging/56. mri.tw.57. 55 or 5658. magnetic resonance imaging/ec59. or/43-46,51,5860. 38 and 57 and 5961. 60 not 5362. limit 61 to english language63. from 62 keep 1-29
EMBASE (Ovid)1. exp cerebrovascular disease/2. stroke$.tw.3. cerebrovascular$.tw.4. (cerebral or cerebellar or brainstem or
vertebrobasilar).tw.5. (infarct$ or isch?emi$ or thrombo$ or
emboli$).tw.6. 4 and 57. carotid$.tw.8. (cerebral or intracerebral or intracranial or
parenchymal).tw.9. (infratentorial or supratentorial or
subarachnoid).tw.10. (brain or intraventricular or brainstem or
cerebellar).tw.11. or/8-1012. (haemorrhage or hemorrhage or haematoma
or hematoma).tw.13. (bleeding or aneurysm).tw.14. 12 or 1315. 11 and 14
Appendix 5
Search strategies: systematic review of cost-effectiveness of CT scanning for stroke
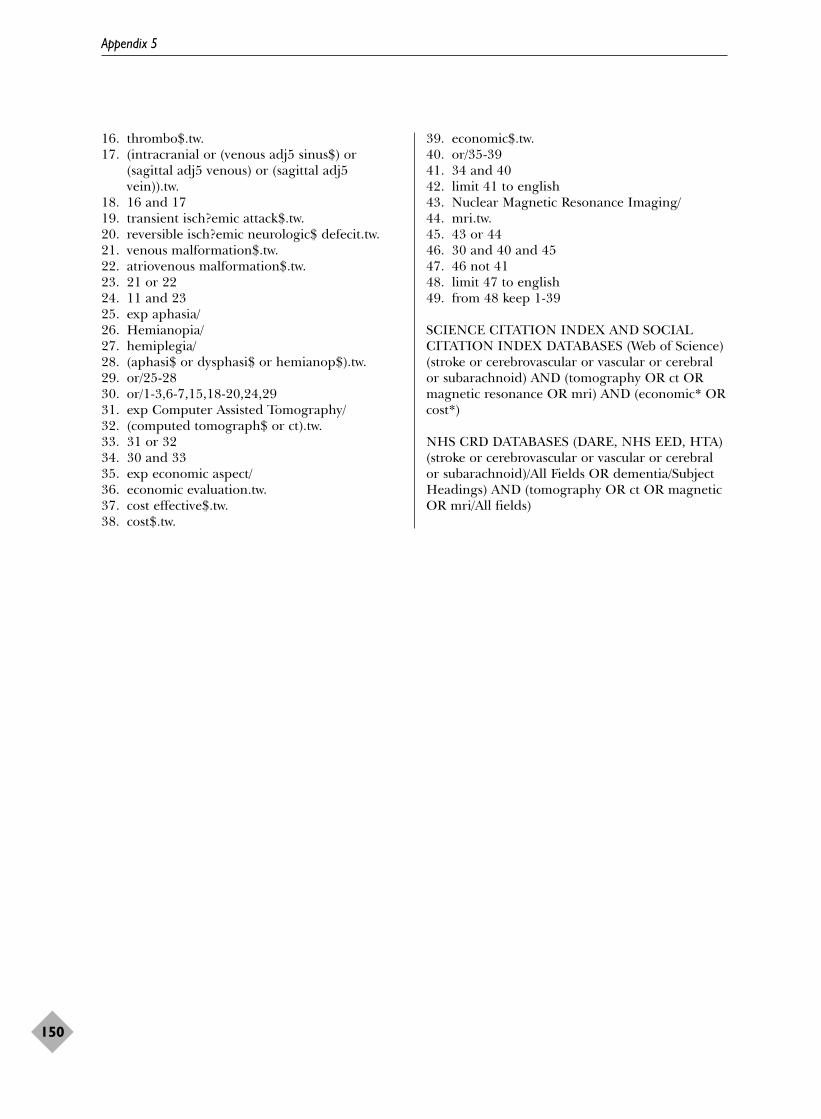
Appendix 5
150
16. thrombo$.tw.17. (intracranial or (venous adj5 sinus$) or
(sagittal adj5 venous) or (sagittal adj5vein)).tw.
18. 16 and 1719. transient isch?emic attack$.tw.20. reversible isch?emic neurologic$ defecit.tw.21. venous malformation$.tw.22. atriovenous malformation$.tw.23. 21 or 2224. 11 and 2325. exp aphasia/26. Hemianopia/27. hemiplegia/28. (aphasi$ or dysphasi$ or hemianop$).tw.29. or/25-2830. or/1-3,6-7,15,18-20,24,2931. exp Computer Assisted Tomography/32. (computed tomograph$ or ct).tw.33. 31 or 3234. 30 and 3335. exp economic aspect/36. economic evaluation.tw. 37. cost effective$.tw.38. cost$.tw.
39. economic$.tw.40. or/35-3941. 34 and 4042. limit 41 to english43. Nuclear Magnetic Resonance Imaging/44. mri.tw.45. 43 or 4446. 30 and 40 and 4547. 46 not 4148. limit 47 to english49. from 48 keep 1-39
SCIENCE CITATION INDEX AND SOCIALCITATION INDEX DATABASES (Web of Science)(stroke or cerebrovascular or vascular or cerebralor subarachnoid) AND (tomography OR ct ORmagnetic resonance OR mri) AND (economic* ORcost*)
NHS CRD DATABASES (DARE, NHS EED, HTA) (stroke or cerebrovascular or vascular or cerebralor subarachnoid)/All Fields OR dementia/SubjectHeadings) AND (tomography OR ct OR magneticOR mri/All fields)
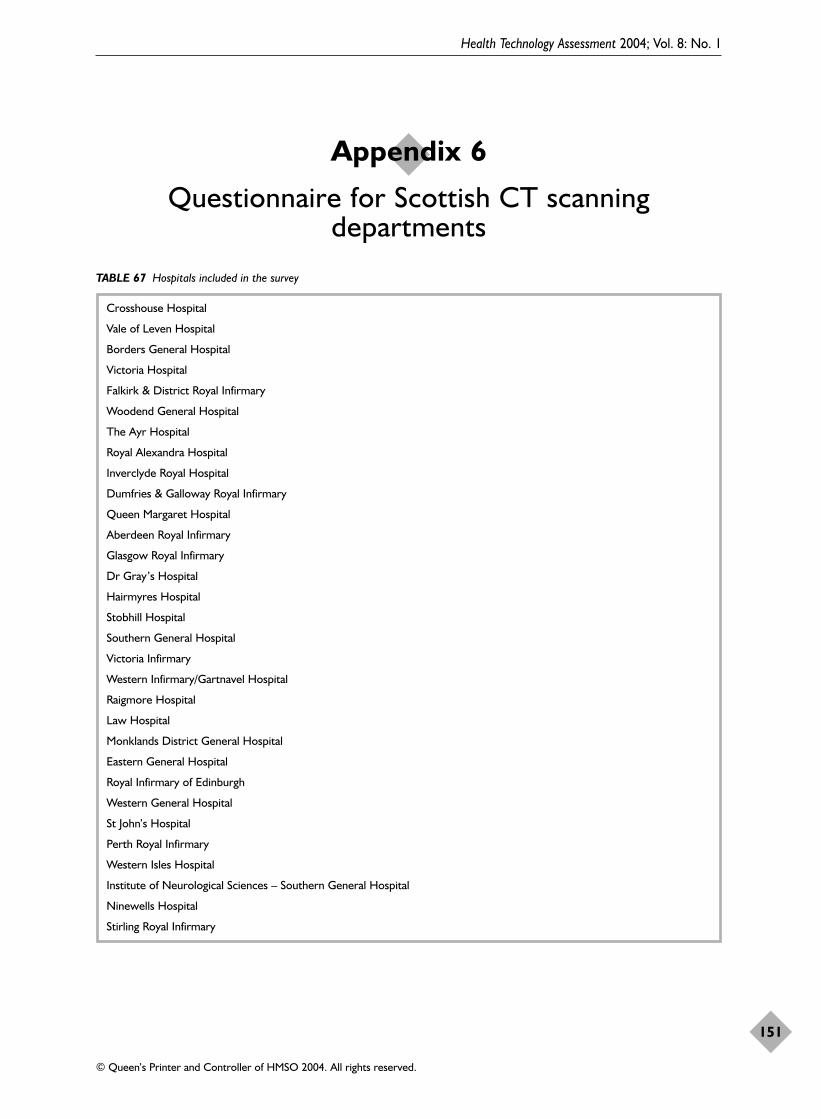
Health Technology Assessment 2004; Vol. 8: No. 1
151
© Queen’s Printer and Controller of HMSO 2004. All rights reserved.
Appendix 6
Questionnaire for Scottish CT scanning departments
TABLE 67 Hospitals included in the survey
Crosshouse Hospital
Vale of Leven Hospital
Borders General Hospital
Victoria Hospital
Falkirk & District Royal Infirmary
Woodend General Hospital
The Ayr Hospital
Royal Alexandra Hospital
Inverclyde Royal Hospital
Dumfries & Galloway Royal Infirmary
Queen Margaret Hospital
Aberdeen Royal Infirmary
Glasgow Royal Infirmary
Dr Gray’s Hospital
Hairmyres Hospital
Stobhill Hospital
Southern General Hospital
Victoria Infirmary
Western Infirmary/Gartnavel Hospital
Raigmore Hospital
Law Hospital
Monklands District General Hospital
Eastern General Hospital
Royal Infirmary of Edinburgh
Western General Hospital
St John’s Hospital
Perth Royal Infirmary
Western Isles Hospital
Institute of Neurological Sciences – Southern General Hospital
Ninewells Hospital
Stirling Royal Infirmary
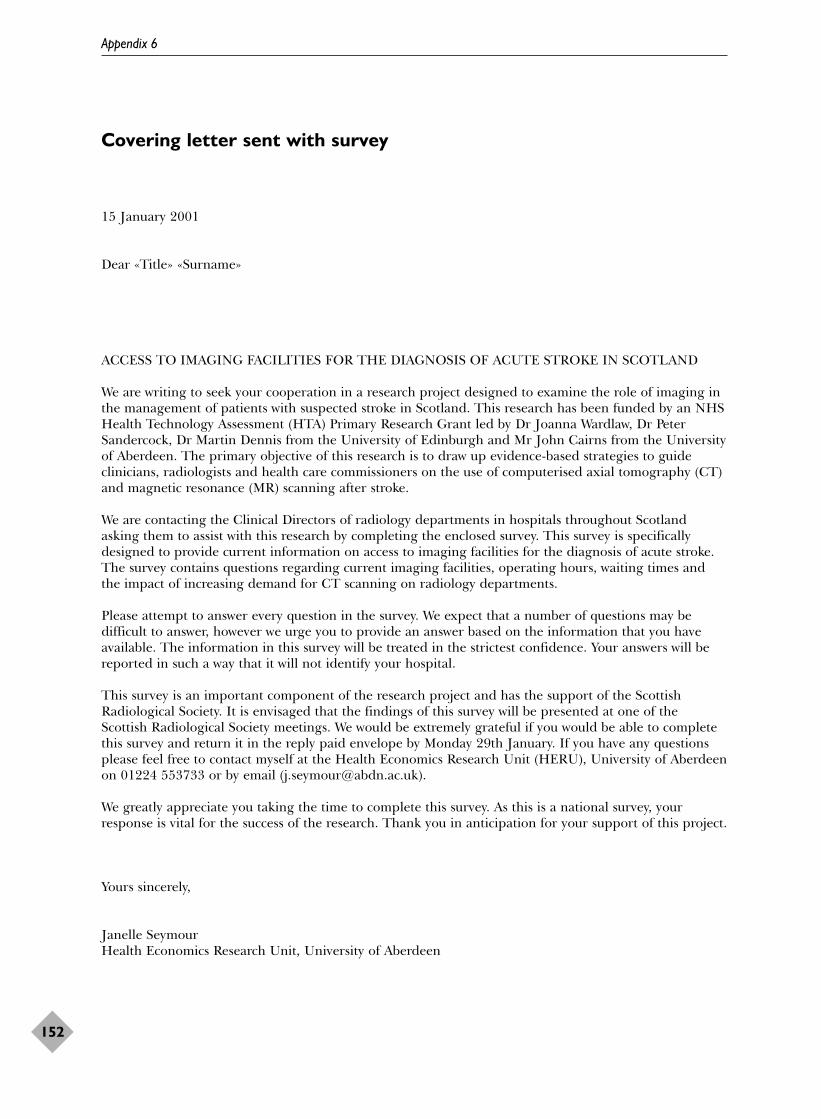
Appendix 6
152
Covering letter sent with survey
15 January 2001
Dear «Title» «Surname»
ACCESS TO IMAGING FACILITIES FOR THE DIAGNOSIS OF ACUTE STROKE IN SCOTLAND
We are writing to seek your cooperation in a research project designed to examine the role of imaging inthe management of patients with suspected stroke in Scotland. This research has been funded by an NHSHealth Technology Assessment (HTA) Primary Research Grant led by Dr Joanna Wardlaw, Dr PeterSandercock, Dr Martin Dennis from the University of Edinburgh and Mr John Cairns from the Universityof Aberdeen. The primary objective of this research is to draw up evidence-based strategies to guideclinicians, radiologists and health care commissioners on the use of computerised axial tomography (CT)and magnetic resonance (MR) scanning after stroke.
We are contacting the Clinical Directors of radiology departments in hospitals throughout Scotlandasking them to assist with this research by completing the enclosed survey. This survey is specificallydesigned to provide current information on access to imaging facilities for the diagnosis of acute stroke.The survey contains questions regarding current imaging facilities, operating hours, waiting times andthe impact of increasing demand for CT scanning on radiology departments.
Please attempt to answer every question in the survey. We expect that a number of questions may bedifficult to answer, however we urge you to provide an answer based on the information that you haveavailable. The information in this survey will be treated in the strictest confidence. Your answers will bereported in such a way that it will not identify your hospital.
This survey is an important component of the research project and has the support of the ScottishRadiological Society. It is envisaged that the findings of this survey will be presented at one of theScottish Radiological Society meetings. We would be extremely grateful if you would be able to completethis survey and return it in the reply paid envelope by Monday 29th January. If you have any questionsplease feel free to contact myself at the Health Economics Research Unit (HERU), University of Aberdeenon 01224 553733 or by email ([email protected]).
We greatly appreciate you taking the time to complete this survey. As this is a national survey, yourresponse is vital for the success of the research. Thank you in anticipation for your support of this project.
Yours sincerely,
Janelle SeymourHealth Economics Research Unit, University of Aberdeen
Health Technology Assessment 2004; Vol. 8: No. 1
153
© Queen’s Printer and Controller of HMSO 2004. All rights reserved.
Reference no
ACCESS TO IMAGING FACILITIES FOR THE DIAGNOSIS OF STROKE IN SCOTLAND
This research has been funded by an NHS Health Technology Assessment Primary Research Grant leadby Dr Joanna Wardlaw, Dr Peter Sandercock, Dr Martin Dennis from the University of Edinburgh and
Mr John Cairns from the University of Aberdeen.
If you have any questions please contact:
Janelle SeymourHealth Economics Research Unit (HERU), University of Aberdeen
Telephone: 01224 553733Email: [email protected]

Appendix 6
154
Question 1aAre CT scanning facilities available in your department/directorate? (Please tick)
Yes If Yes, how many CT scanners are there? Go to Question 1b
No Go to Question 1c
Question 1bAre CT scanning facilities available for patients with suspected stroke in your department/directorate?(Please tick)
Yes Go to Question 2
No Go to Question 1c
Question 1cAre patients with suspected stroke referred from your hospital, to another hospital/s for CT scanning?
Yes If so what hospital/s are they referred to?
If there are CT scanners in your department/directorate, go to Question 2, if not, go toQuestion 7
No If there are CT scanners in your department/directorate, go to Question 2, if not, go toQuestion 7
Computerised axial tomography (CT) is widely used in the diagnosis and management of patientswith acute stroke. The Stroke Association recently reported that although the provision of CTscanning facilities has improved, urgent access to CT scanners is often limited1.
This survey examines access to scanning facilities for patients with suspected stroke. Please answerthe following questions in relation to your department/directorate. Please note that throughout thissurvey, we refer to patients who are suspected of having suffered either an ischaemic stroke orprimary intracerebral haemorrhage but NOT a subarachnoid haemorrhage.
1 Ebrahim S, Redfern J (1999) Stroke care – a matter of chance. A national survey of stroke services. TheStroke Association, London.

Health Technology Assessment 2004; Vol. 8: No. 1
155
© Queen’s Printer and Controller of HMSO 2004. All rights reserved.
Question 2For each CT scanner, please list the type of scanner (e.g. spiral CT), the date of installation and whetherthat machine is used to scan patients with suspected stroke.
Question 3aOne way of assessing current access to CT scanning facilities is to identify the current operating hours ofCT scanning facilities. Please list the following information for each of your CT scanners for what youwould consider to be ‘a typical week’ in October 2000; - each session- the start and end times of each session- the type of patients scanned during each session (i.e. inpatients, outpatients and/or emergencies)- whether patients suspected of having suffered are scanned in the session - whether ‘out of hours CT scanning’ (i.e. after 5pm – 8am) is available.
For example, for this particular scanner, there is one 3 hour session on a Monday for outpatients.Patients suspected of having suffered a stroke are scanned during this session. Out of hours scanningis not available on a Monday.
CT scanner Type of CT scanner Date installed Used to scan suspected stroke patients?
(tick below)
CT scanner 1 ____ / ____ / ____ Yes
No
CT scanner 2 ____ / ____ / ____ Yes
No
CT scanner 3 ____ / ____ / ____ Yes
No
Sessions Start/end Type of patients Stroke patients Out of hours (tick if Yes) times (IP=inpatient (tick if Yes) CT scanning
OP=outpatients (tick if Yes)E=emergency)
MondayAM 9–12 OP
PM
EXAMPLE
EXAMPLE

Appendix 6
156
Please complete a table for each scanner.
Scanner 1
Sessions Start/end Type of patients Stroke patients Out of hours (tick if Yes) times (IP=inpatient (tick if Yes) CT scanning
OP=outpatients (tick if Yes)E=emergency)
MondayAM
PM
TuesdayAM
PM
WednesdayAM
PM
ThursdayAM
PM
FridayAM
PM
Saturday
Sunday

Health Technology Assessment 2004; Vol. 8: No. 1
157
© Queen’s Printer and Controller of HMSO 2004. All rights reserved.
Scanner 2
Sessions Start/end Type of patients Stroke patients Out of hours (tick if Yes) times (IP=inpatient (tick if Yes) CT scanning
OP=outpatients (tick if Yes)E=emergency)
MondayAM
PM
TuesdayAM
PM
WednesdayAM
PM
ThursdayAM
PM
FridayAM
PM
Saturday
Sunday

Appendix 6
158
Scanner 3
Sessions Start/end Type of patients Stroke patients Out of hours (tick if Yes) times (IP=inpatient (tick if Yes) CT scanning
OP=outpatients (tick if Yes)E=emergency)
MondayAM
PM
TuesdayAM
PM
WednesdayAM
PM
ThursdayAM
PM
FridayAM
PM
Saturday
Sunday

Health Technology Assessment 2004; Vol. 8: No. 1
159
© Queen’s Printer and Controller of HMSO 2004. All rights reserved.
Question 3b How much do the operating hours of your CT scanners vary throughout the year? (Please tick)
Not at all
Not very much
A great deal
Is the variation due to seasonal effects? Please comment:
IF out of hours CT scanning is available, please go to Question 4a
Question 3cAre patients referred to another hospital if out of hours scanning is not available? (Please tick)
Yes If yes, which hospital/s are they referred to?
No
Question 4aPlease answer each of the following questions for your directorate the 1999 calendar year. If you do nothave ready access to these data, could you please give approximate figures.
Questions Answers
i. What was the total number of CT scans conducted in 1999?
ii. How many CT brain scans were conducted in 1999?
iii. What proportion of the CT brain scans were conducted after hours?
iv. How many of the CT brain scans were for patients who were suspected to have had a stroke?
v. What proportion of the CT brain scans for patients with suspected stroke were conducted out of hours?

Appendix 6
160
Question 4bPlease answer the following questions by placing a tick in the most appropriate box.
Questions Yes Yes, Nowith difficulty
1. Could you provide CT scans immediately to suspected stroke patients on week days?
2. Could you provide CT scans immediately to suspected stroke patients on weekends?
3. Could you provide CT scans within 24 hours to suspected stroke patients on week days?
4. Could you provide CT scans within 24 hours to suspected stroke patients on weekends?
5. Could you provide CT scans within 48 hours to suspected stroke patients regardless of the day of the week?
6. Could you provide CT scans within 48 hours to suspected stroke patients except at weekends?
7. Could you provide CT scans within 7 days to suspected stroke patients?
8. Could you provide CT scans within 14 days to suspected stroke patients?

Health Technology Assessment 2004; Vol. 8: No. 1
161
© Queen’s Printer and Controller of HMSO 2004. All rights reserved.
Question 5Imagine your department/directorate were to undertake more CT brain scans. Please indicate whatpercentage increase in workload would result in the need for any of the subsequent actions listed below.
For example, an XX% increase in workload would require the introduction of a waiting list for CT scansof more than 4 weeks.
Please complete the following table;
Increase in Actionsworkload
(%)
XX% i. Introduce a waiting list of more than 4 weeks for CT scans
Increase in Actionsactivity
(%)
____ % i. Introduce a waiting list of more than 4 weeks for CT scans
____ % ii. Patients would be referred to another hospital for a CT scan
____ % iii. Employ additional radiographic staff
____ % iv. Employ additional radiologists
____ % v. Undertake any additional CT scans out of hours
____ % vi. Purchase an additional CT scanner
EXAMPLE
EXAMPLE
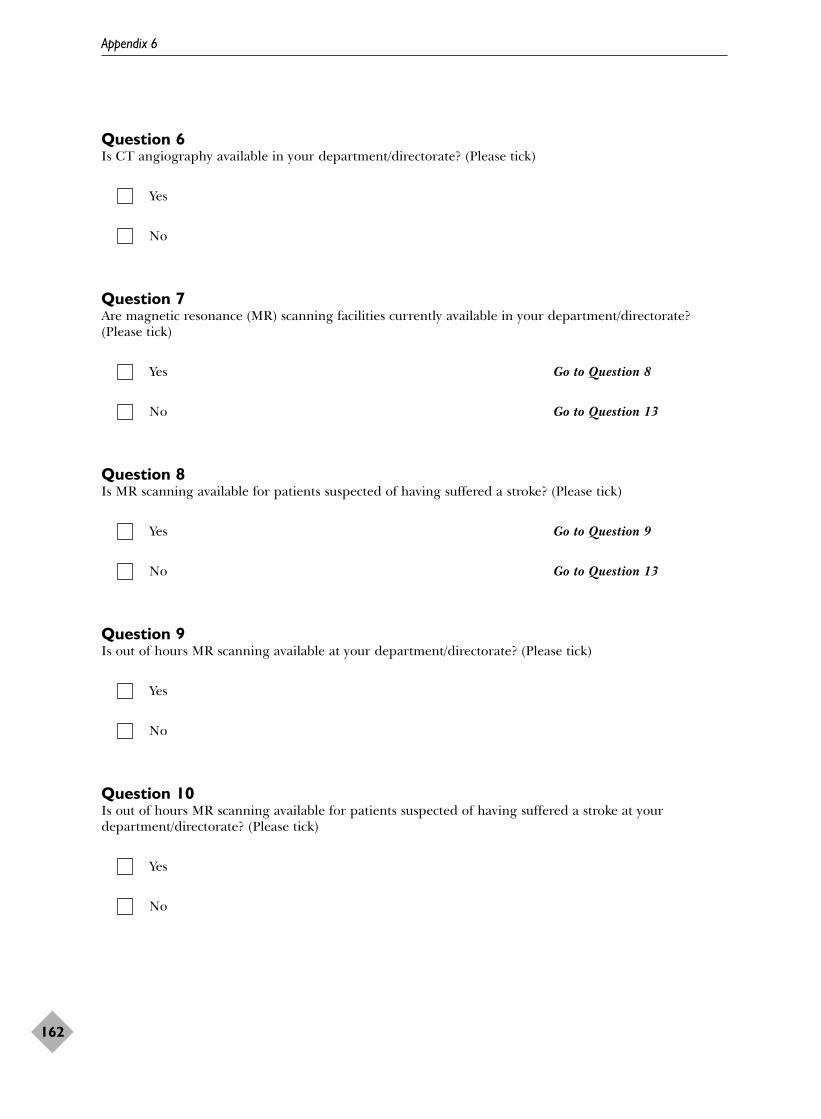
Appendix 6
162
Question 6Is CT angiography available in your department/directorate? (Please tick)
Yes
No
Question 7Are magnetic resonance (MR) scanning facilities currently available in your department/directorate?(Please tick)
Yes Go to Question 8
No Go to Question 13
Question 8Is MR scanning available for patients suspected of having suffered a stroke? (Please tick)
Yes Go to Question 9
No Go to Question 13
Question 9Is out of hours MR scanning available at your department/directorate? (Please tick)
Yes
No
Question 10Is out of hours MR scanning available for patients suspected of having suffered a stroke at yourdepartment/directorate? (Please tick)
Yes
No
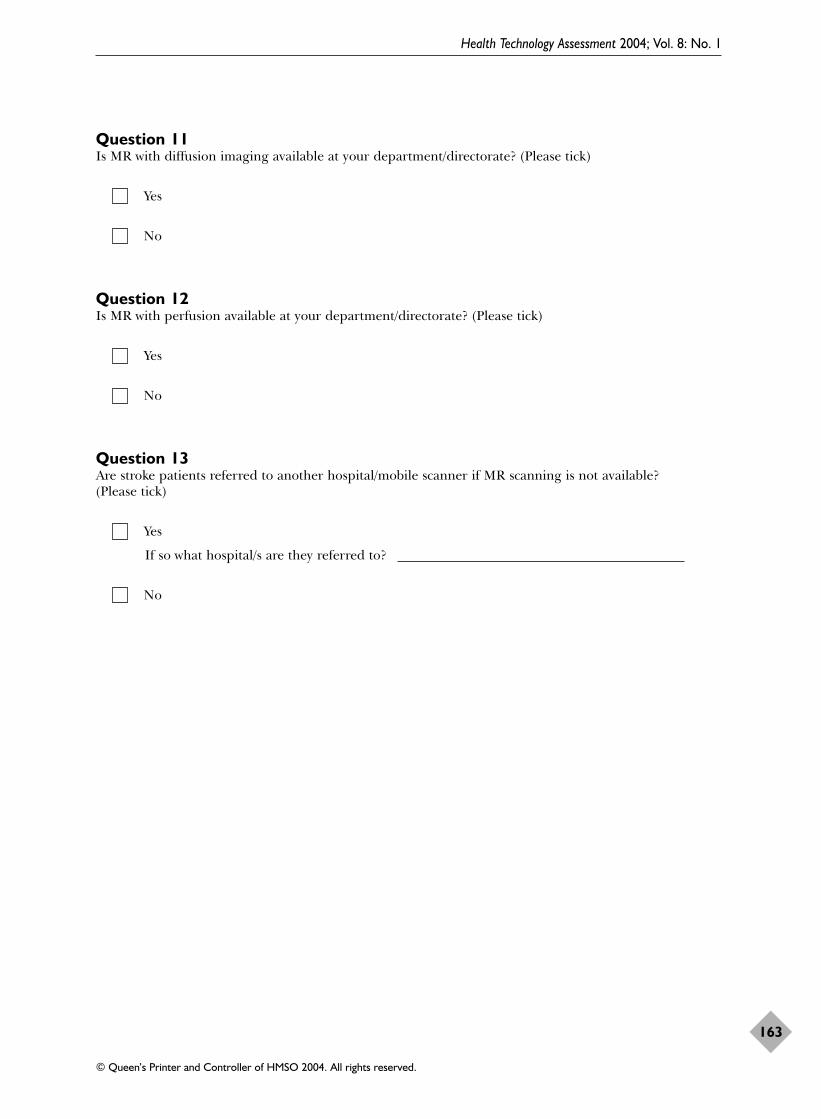
Health Technology Assessment 2004; Vol. 8: No. 1
163
© Queen’s Printer and Controller of HMSO 2004. All rights reserved.
Question 11Is MR with diffusion imaging available at your department/directorate? (Please tick)
Yes
No
Question 12Is MR with perfusion available at your department/directorate? (Please tick)
Yes
No
Question 13Are stroke patients referred to another hospital/mobile scanner if MR scanning is not available? (Please tick)
Yes
If so what hospital/s are they referred to?
No

Appendix 6
164
If you have any additional comments regarding the survey, please make them below.
Thank you for completing the survey
Please return the survey as soon as possible in the pre-paid envelope
If you have any questions please contact:
Janelle SeymourHealth Economics Research Unit (HERU), University of Aberdeen
Telephone: 01224 553733Email: [email protected]

Health Technology Assessment 2004; Vol. 8: No. 1
165
© Queen’s Printer and Controller of HMSO 2004. All rights reserved.
CT scanners:
CE CTIElscint Elite (NS)Elscint Scanner (S)Elsent Twin Spiral (S)GE Helical (S)GE Spiral CT (S)GT Cytec 3000 (NS)IGE Prospeed (S)IGE Prospeed UX (NS)IGEbLX1, replaced IGVE 9800 (NS)Marconi CT Twin Flash (S)Philips Tomoscan av (NS)Phillips SR 7000 (NS)Phillips Tomoscan 3rd Generation Surge Slice (S)Seimens Helical (S)Siemems Somatom Arstar (S)Siemens Plus 4 (S)Siemens Somatom Plus 4 (S)Siemens Somatom Plus 4 (S)Siemens Somaton SR (S)Spiral (S)Toshiba Astewn (NS)Toshiba Express Spiral (S)
S: spiral scanner; NS: non-spiral scanner. Spiral scanners can provide more rapid imaging.
Appendix 7
Current provision of CT scanners in Scotland


Health Technology Assessment 2004; Vol. 8: No. 1
167
© Queen’s Printer and Controller of HMSO 2004. All rights reserved.
IntroductionAs CT scanning is a key component of the cost-effectiveness analysis presented in Chapter 5, it isimportant that an accurate estimate is used in themodel. The costs of CT scanning were estimatedto reflect the difference in resource use betweenscanning during ‘normal working hours’ as well as‘out of hours’. In addition, as CT scanning isconducted in both teaching hospitals and generalhospitals, it was important that unit costs wereestimated in a number of sites to determinewhether there is any difference in resource useassociated with CT scanning patients at differenttypes of hospital.
Costs were estimated at three sites in Scotland: a large teaching hospital (TH) and two generalhospitals (DGH).
MethodsThe cost of CT scanning was estimated in terms ofcosts to the health service in this study. A detailed,bottom–up approach was adopted usingstandardised costing methods.353 A three-stepprocess involving identification, measurement andvaluation of resources was undertaken to estimatethe cost of scanning.354 The first step involvedidentifying the main areas of resource use requiredfor scanning this group of patients. Once thesehad been determined, the quantity of resource usewas measured. Finally, a unit cost was calculated tovalue resource use for CT scanning at each site.All costs were estimated in 1999–2000 prices andexclude value added tax.
The Clinical Director of Radiology at eachhospital was approached to participate in thecosting study. With their agreement health serviceresource use data were obtained for each hospital.The main types of resource use were identified asa result of discussions with radiologists. Theseincluded allocated costs (overheads), labour(neuroradiologists, radiographers, nursing, clerical
staff and porters), capital (buildings andequipment), and consumables (medical supplies).It was indicated that only staff time is likely to varywhen scanning is undertaken during normalworking hours compared with out of hours. Givenresource constraints, it was not possible to collectdata on resource use prospectively, therefore acosting questionnaire, supplemented bydiscussions with radiologists, was used to collectresource use data. The quantity of resource usewas identified by asking each hospital the averageresource use required for CT scanning patientssuspected of having suffered a stroke duringnormal working hours and out of hours.
Unit costs were estimated for health serviceresources. Allocated costs were estimated from the2000 Scottish Health Service Cost manual69 andallocated on the basis of floor space andthroughput. Estimates of throughput wereobtained from the activity level data reported inthe Access to CT Scanning Survey (see Chapter 5).Staff costs were calculated using the mid-point ofNHS salary scales, taking into account nationalinsurance and superannuation. Building costswere estimated using a cost per metre squared,355
converted into an equivalent annual cost (EAC)and allocated on the basis of throughput.355 Adiscount rate of 6% was used to calculate the EAC;however, this was varied from 0% to 10% in thesensitivity analysis. The cost of equipment wasestimated using purchase price, converted into anEAC and allocated in a similar manner. The costsof medical supplies were estimated using existingmarket prices (various personal communications).All costs not estimated in 1999–2000 prices wereadjusted using the NHS Heath Service CostIndex.348,356
ResultsTables 68–77 report the quantity of resource useand costs in terms of allocated costs, staff, capitaland consumables required for CT scanningpatients suspected of having suffered a stroke for
Appendix 8
Costings of CT scanning services from three hospitals in Scotland within normal working hours
and out of hours
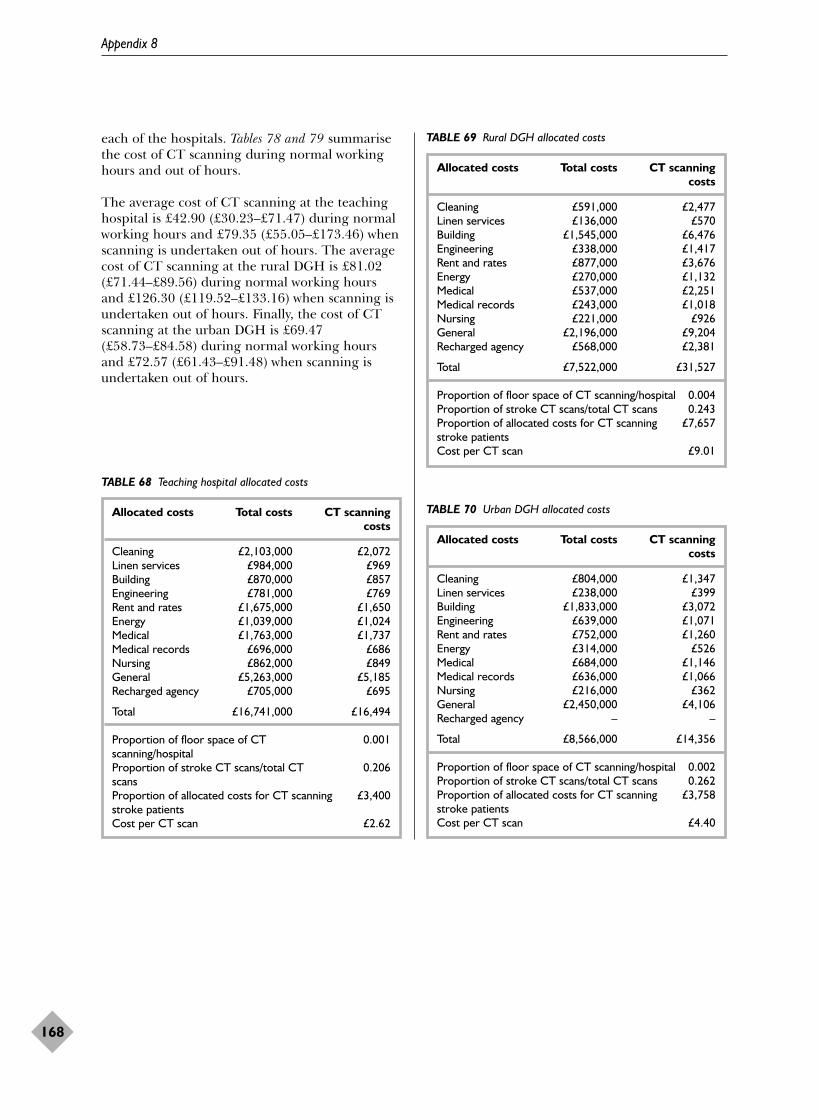
each of the hospitals. Tables 78 and 79 summarisethe cost of CT scanning during normal workinghours and out of hours.
The average cost of CT scanning at the teachinghospital is £42.90 (£30.23–£71.47) during normalworking hours and £79.35 (£55.05–£173.46) whenscanning is undertaken out of hours. The averagecost of CT scanning at the rural DGH is £81.02(£71.44–£89.56) during normal working hoursand £126.30 (£119.52–£133.16) when scanning isundertaken out of hours. Finally, the cost of CTscanning at the urban DGH is £69.47(£58.73–£84.58) during normal working hoursand £72.57 (£61.43–£91.48) when scanning isundertaken out of hours.
Appendix 8
168
TABLE 68 Teaching hospital allocated costs
Allocated costs Total costs CT scanning costs
Cleaning £2,103,000 £2,072Linen services £984,000 £969Building £870,000 £857Engineering £781,000 £769Rent and rates £1,675,000 £1,650Energy £1,039,000 £1,024Medical £1,763,000 £1,737Medical records £696,000 £686Nursing £862,000 £849General £5,263,000 £5,185Recharged agency £705,000 £695
Total £16,741,000 £16,494
Proportion of floor space of CT 0.001scanning/hospitalProportion of stroke CT scans/total CT 0.206scans Proportion of allocated costs for CT scanning £3,400stroke patientsCost per CT scan £2.62
TABLE 69 Rural DGH allocated costs
Allocated costs Total costs CT scanning costs
Cleaning £591,000 £2,477Linen services £136,000 £570Building £1,545,000 £6,476Engineering £338,000 £1,417Rent and rates £877,000 £3,676Energy £270,000 £1,132Medical £537,000 £2,251Medical records £243,000 £1,018Nursing £221,000 £926General £2,196,000 £9,204Recharged agency £568,000 £2,381
Total £7,522,000 £31,527
Proportion of floor space of CT scanning/hospital 0.004Proportion of stroke CT scans/total CT scans 0.243Proportion of allocated costs for CT scanning £7,657stroke patientsCost per CT scan £9.01
TABLE 70 Urban DGH allocated costs
Allocated costs Total costs CT scanning costs
Cleaning £804,000 £1,347Linen services £238,000 £399Building £1,833,000 £3,072Engineering £639,000 £1,071Rent and rates £752,000 £1,260Energy £314,000 £526Medical £684,000 £1,146Medical records £636,000 £1,066Nursing £216,000 £362General £2,450,000 £4,106Recharged agency – –
Total £8,566,000 £14,356
Proportion of floor space of CT scanning/hospital 0.002Proportion of stroke CT scans/total CT scans 0.262Proportion of allocated costs for CT scanning £3,758stroke patientsCost per CT scan £4.40

Health Technology Assessment 2004; Vol. 8: No. 1
169
© Queen’s Printer and Controller of HMSO 2004. All rights reserved.
TABLE 71 Teaching hospital labour costs
Normal working hours Out of hours
Staff Average Minimum Maximum Average Minimum Maximum(minutes) (minutes) (minutes) (minutes) (minutes) (minutes)
Nurse grade E/D 40 20 60 45 22 67Cost per minute = £0.17 £6.80 £3.40 £10.20 £7.65 £3.74 £11.39
Senior I radiographer 15 10 30 45 30 120Cost per minute = £0.21 £3.15 £2.10 £6.30 £9.45 £6.30 £25.20
Superintendent III radiographer 15 10 30 45 30 120Cost per minute = £0.23 £3.45 £2.30 £6.90 £10.35 £6.90 £27.60
Consultant 5 2 30 45 30 120Cost per minute = £0.56 £2.80 £1.12 £16.80 £25.20 £16.80 £67.20
Medical secretarya 10 10 10 10 10 10Cost per minute = £0.13 £1.30 £1.30 £1.30 £1.30 £1.30 £1.30
Porter 40 20 60 40 20 60Cost per minute = £0.08 £3.20 £1.60 £4.80 £3.20 £1.60 £4.80
Senior house officer (ward) – – – – – 45Cost per minute = £0.24 £10.80
Average cost per scan £20.70 £11.82 £46.30 £57.15 £36.64 £148.29
a Average across grades.
TABLE 72 Rural DGH labour costs
Normal working hours Out of hours
Staff Average Minimum Maximum Average Minimum Maximum(minutes) (minutes) (minutes) (minutes) (minutes) (minutes)
Nurse grade D 12 7 15 – – –Cost per minute = £0.16 £1.92 £1.12 £2.40
Senior radiographers × 2 12 7 15 60 60 60Cost per minute = £0.20a £4.80 £2.80 £6.00 £24.00 £24.00 £24.00
Radiologist 10 10 10 60 60 60Cost per minute = £0.56 £5.60 £5.60 £5.60 £33.60 £33.60 £33.60
Clerical secretaryb 10 10 10 10 10 10Cost per minute = £0.13 £1.30 £1.30 £1.30 £1.30 £1.30 £1.30
Average cost per scan £13.62 £10.82 £15.30 £58.90 £58.90 £58.90
a Average cost per minute of a Senior I and Senior II radiographer. b Average across grades.

Appendix 8
170
TABLE 73 Urban DGH labour costs
Normal working hours Out of hours
Staff Average Minimum Maximum Average Minimum Maximum(minutes) (minutes) (minutes) (minutes) (minutes) (minutes)
1 Auxiliary/staff nursea 15 10 30 20 15 45Cost per minute = £0.14 £2.10 £1.40 £4.20 £2.80 £2.10 £6.30
2 Senior radiographersb 15 10 30 20 15 40Cost per minute = £0.20 £6.00 £4.00 £12.00 £8.00 £6.00 £16.00
1 Neuroradiologist 5 5 5 5 5 5Cost per minute = £0.60 £2.80 £2.80 £2.80 £2.80 £2.80 £2.80
1 Clerical/administration 5 5 5 5 5 5Cost per minute = £0.13 £0.65 £0.65 £0.65 £0.65 £0.65 £0.65
1 Porter 15 10 30 20 10 40Cost per minute = £0.08 £1.20 £0.80 £2.40 £1.60 £0.80 £3.20
Average cost per scan £12.75 £9.65 £22.05 £15.85 £12.35 £28.95
a Average cost per minute of a staff nurse and an auxiliary nurse. b Average cost per minute of a Senior I, Senior II and Superintendent IV radiographer.
TABLE 74 Teaching hospital capital costs
Capital Cost Minimum Maximum
EquipmentSiemens Somatom Plus 4 spiral CT scanner
Life span (years) 10 10 10 Replacement cost £509,025 £509,025 £509,025Discount rate (%) 6 0 10Equivalent annual cost £69,177 £50,903 £82,818Proportion of stroke CT scans/total CT scans 0.206 0.206 0.206Cost per CT scan £10.97 £8.07 £13.13
MaintenanceAnnual maintenance £27,500 £27,500 £27,500Proportion of stroke CT scans/total CT scans 0.206 0.206 0.206Cost per CT scan £4.36 £4.36 £4.36
BuildingsCT room
Floor space (m2) 95 95 95Unit cost £919 £919 £919Replacement cost £86,394 £86,394 £86,394Discount rate (%) 6 0 10Equivalent annual cost £5,284 £1,423 £8,563Proportion of stroke CT scans/total CT scans 0.206 0.206 0.206Cost per CT scan £0.84 £0.23 £1.36
Cost of capital per CT scan £16.17 £12.66 £18.85

Health Technology Assessment 2004; Vol. 8: No. 1
171
© Queen’s Printer and Controller of HMSO 2004. All rights reserved.
TABLE 75 Rural DGH capital costs
Capital Cost Minimum Maximum
EquipmentElsent Twin Slice Spiral
Life span (years) 5 5 5Replacement cost £600,000 £600,000 £600,000Discount rate (%) 6 0 10Equivalent annual cost £138,600 £120,000 £158,280Proportion of stroke CT scans/total CT scans 0.243 0.243 0.243Cost per CT scan £39.60 £34.29 £45.22
MaintenanceAnnual maintenance £50,000 £50,000 £50,000Proportion of stroke CT scans/total CT scans 0.243 0.243 0.243Cost per CT scan £14.29 £14.29 £14.29
BuildingsCT room
Floor space (m2) 126 126 126Unit cost £919 £919 £919Replacement cost £114,586 £114,586 £114,586Discount rate (%) 6 0 10Equivalent annual cost £7,093 £1,910 £11,493Proportion of stroke CT scans/total CT scans 0.243 0.243 0.243Cost per CT scan £2.00 £0.54 £3.24
Cost of capital per CT scan £55.89 £49.11 £62.75
TABLE 76 Urban DGH capital costs
Capital Cost Minimum Maximum
EquipmentIGE CT Lxi helical scanner
Life span (years) 10 10 10Replacement cost £585,000 £585,000 £585,000Discount rate (%) 6 0 10Equivalent annual cost £79,502 £58,500 £95,180Proportion of stroke CT scans/total CT scans 0.262 0.262 0.262Cost per CT scan £24.34 £17.91 £29.14
MaintenanceAnnual maintenance £52,000 £52,000 £52,000Proportion of stroke CT scans/total CT scans 0.263 0.263 0.263Cost per CT scan £15.92 £15.92 £15.92
Dry Laser Printer – Kodak Dry View 8100Life span (years) 10 10 10Replacement cost £20,000 £20,000 £20,000Discount rate (%) 6 0 10Equivalent annual cost £2,728 £2,000 £3,254Proportion of stroke CT scans/total CT scans 0.262 0.262 0.262Cost per CT scan £0.83 £0.61 £1.00
MaintenanceAnnual maintenance £2,955 £2,955 £2,955Proportion of stroke CT scans/total CT scans 0.262 0.262 0.262Cost per CT scan £0.90 £0.90 £0.90
continued

Appendix 8
172
TABLE 76 Urban DGH capital costs (cont’d)
Capital Cost Minimum Maximum
BuildingsCT room
Floor space (m2) 80 80 80Unit cost £919 £919 £919Replacement cost £71,890 £71,890 £71,890Discount rate (%) 6 0 10Equivalent annual cost £4,450 £1,198 £7,211Proportion of stroke CT scans/total CT scans 0.262 0.262 0.262Cost per CT scan £1.36 £0.37 £2.21
Cost of capital per CT scan £43.36 £35.72 £49.17
TABLE 77 Cost of consumables
Capital Unit cost (£) Cost per scan (£)
Teaching hospitalOptical disc 35.20 1.42Film and processing – 2.00Total – 3.42
Rural DGHOptical disc – 0.50Film and processing – 2.00Total – 2.50
Urban DGHOptical disc 28.00 0.01Film 1,119.66 8.96Total – 8.97
TABLE 78 Cost of CT scanning for stroke patients: normalworking hours
Cost per scan (£)
Resources TH RDGH UDGH
Average costAllocated costs 2.62 9.01 4.40Labour 20.70 13.62 12.75Capital 16.17 55.89 43.36Consumables 3.42 2.50 8.97Cost per scan 42.90 81.02 69.47
Low estimateAllocated costs 2.62 9.01 4.40Labour 11.82 10.82 9.65Capital 12.66 49.11 35.72Consumables 3.13 2.50 8.97Cost per scan 30.23 71.44 58.73
High estimateAllocated costs 2.62 9.01 4.40Labour 46.30 15.30 22.05Capital 18.85 62.75 49.18Consumables 3.70 2.50 8.97Cost per scan 71.47 89.56 84.58
RDGH, rural DGH; UDGH, urban DGH; TH, teachinghospital.
TABLE 79 Cost of CT scanning for stroke patients: out of hours
Cost per scan (£)
Resources TH RDGH UDGH
Average costAllocated costs 2.62 9.01 4.40Labour 57.15 58.90 15.85Capital 16.17 55.89 43.36Consumables 3.42 2.50 8.97Cost per scan 79.35 126.30 72.57
Low estimateAllocated costs 2.62 9.01 4.40Labour 36.64 58.90 12.35Capital 12.66 49.11 35.72Consumables 3.13 2.50 8.97Cost per scan 55.05 119.52 61.43
High estimateAllocated costs 2.62 9.01 4.40Labour 148.29 58.90 28.95Capital 18.85 62.75 49.17Consumables 3.70 2.50 8.97Cost per scan 173.46 133.16 91.48
RDGH, rural DGH; UDGH, urban DGH; TH, teachinghospital.

Health Technology Assessment 2004; Vol. 8: No. 1
173
© Queen’s Printer and Controller of HMSO 2004. All rights reserved.
Appendix 9
Results of the sensitivity analysis
TABLE 80 Total costs and expected QALYs (based on the costof CT scanning at a teaching hospital for a cohort aged 60–64years
Strategies QALYs COSTS
S1 2374.4 £10,136,676S6 2374.4 £10,210,903S2 2374.4 £10,214,294S7 2342.6 £10,370,576S3 2342.6 £10,382,793Comparator 2342.6 £10,419,728S12 2260.3 £10,810,000S11 2250.3 £11,066,817S8 2372.3 £11,136,614S4 2372.2 £11,184,666S10 2325.2 £11,616,623S9 (LSR) 2302.4 £12,334,614S5 (LSR) 2302.3 £12,771,666
TABLE 81 Total costs and expected QALYs (based on the costof CT scanning at a teaching hospital for a cohort aged 80–84years
Strategies QALYs COSTS
S1 1467 £11,213,676S6 1467 £11,287,903S2 1467 £11,292,294S7 1498.5 £11,449,576S3 1498.5 £11,460,793Comparator 1498.5 £11,498,728S12 1461.7 £11,619,000S11 1462.2 £11,990,817S8 1465.2 £12,219,614S4 1465.1 £12,268,666S10 1466.9 £12,659,623S9 (LSR) 1468.3 £13,364,614S5 (LSR) 1468.2 £13,798,666
TABLE 82 Sensitivity analysis – proportion of actual stroke in apopulation (0.77)
Strategies QALYs COSTS
S1 2063.6 £9,654,676S6 2063.6 £9,729,903S2 2063.6 £9,733,294S7 2063.4 £9,874,576S3 2063.4 £9,885,793Comparator 2063.4 £9,920,728S12 1989.1 £10,220,000S11 1984.3 £10,460,817S8 2062 £10,639,614S4 2061.9 £10,687,666S10 2027 £11,072,623S9 (LSR) 2015.5 £11,745,614S5 (LSR) 2015.4 £12,170,666
TABLE 83 Sensitivity analysis – proportion of actual stroke in apopulation (0.84)
Strategies QALYs COSTS
S1 1921.5 £10,247,676S6 1921.5 £10,321,903S2 1921.5 £10,325,294S7 1921.4 £10,467,576S3 1921.4 £10,478,793Comparator 1921.4 £10,514,728S12 1840.4 £10,788,000S11 1835.1 £11,038,817S8 1919.8 £11,272,614S4 1919.7 £11,322,666S10 1881.8 £11,722,623S9 1869.2 £12,461,614S5 1869.1 £12,909,666
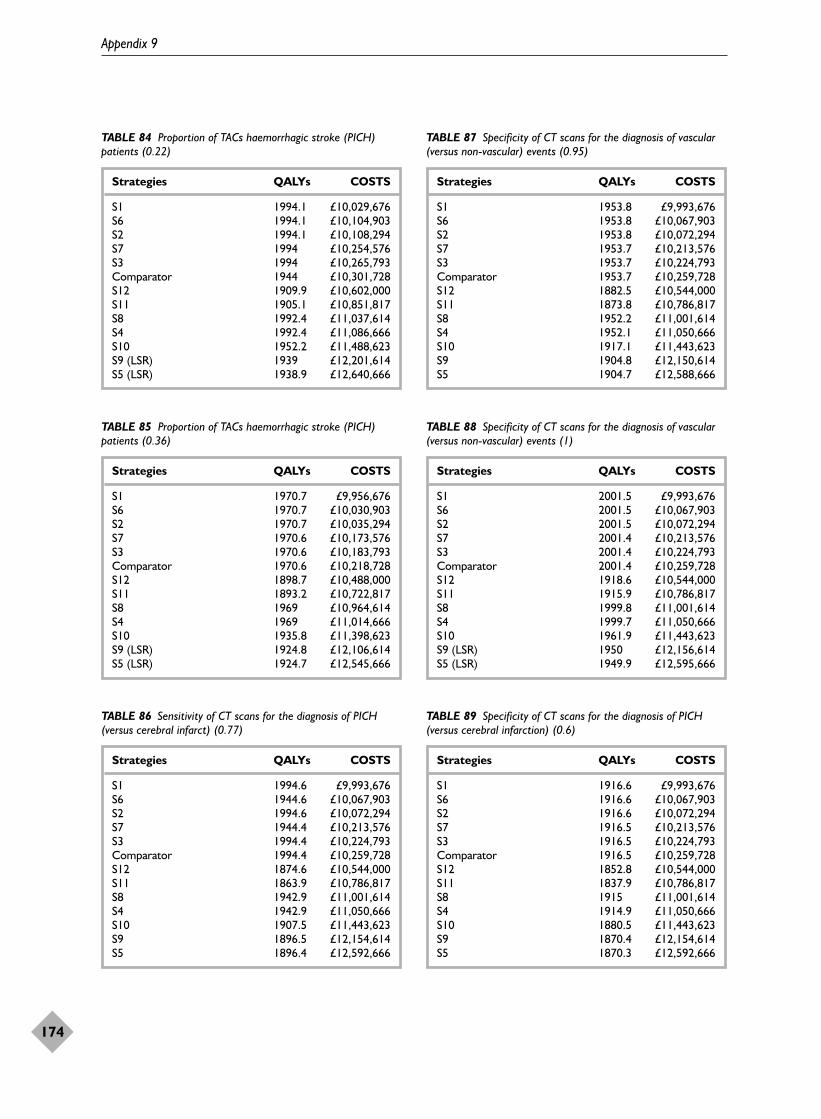
Appendix 9
174
TABLE 84 Proportion of TACs haemorrhagic stroke (PICH)patients (0.22)
Strategies QALYs COSTS
S1 1994.1 £10,029,676S6 1994.1 £10,104,903S2 1994.1 £10,108,294S7 1994 £10,254,576S3 1994 £10,265,793Comparator 1944 £10,301,728S12 1909.9 £10,602,000S11 1905.1 £10,851,817S8 1992.4 £11,037,614S4 1992.4 £11,086,666S10 1952.2 £11,488,623S9 (LSR) 1939 £12,201,614S5 (LSR) 1938.9 £12,640,666
TABLE 85 Proportion of TACs haemorrhagic stroke (PICH)patients (0.36)
Strategies QALYs COSTS
S1 1970.7 £9,956,676S6 1970.7 £10,030,903S2 1970.7 £10,035,294S7 1970.6 £10,173,576S3 1970.6 £10,183,793Comparator 1970.6 £10,218,728S12 1898.7 £10,488,000S11 1893.2 £10,722,817S8 1969 £10,964,614S4 1969 £11,014,666S10 1935.8 £11,398,623S9 (LSR) 1924.8 £12,106,614S5 (LSR) 1924.7 £12,545,666
TABLE 86 Sensitivity of CT scans for the diagnosis of PICH(versus cerebral infarct) (0.77)
Strategies QALYs COSTS
S1 1994.6 £9,993,676S6 1944.6 £10,067,903S2 1994.6 £10,072,294S7 1944.4 £10,213,576S3 1994.4 £10,224,793Comparator 1994.4 £10,259,728S12 1874.6 £10,544,000S11 1863.9 £10,786,817S8 1942.9 £11,001,614S4 1942.9 £11,050,666S10 1907.5 £11,443,623S9 1896.5 £12,154,614S5 1896.4 £12,592,666
TABLE 87 Specificity of CT scans for the diagnosis of vascular(versus non-vascular) events (0.95)
Strategies QALYs COSTS
S1 1953.8 £9,993,676S6 1953.8 £10,067,903S2 1953.8 £10,072,294S7 1953.7 £10,213,576S3 1953.7 £10,224,793Comparator 1953.7 £10,259,728S12 1882.5 £10,544,000S11 1873.8 £10,786,817S8 1952.2 £11,001,614S4 1952.1 £11,050,666S10 1917.1 £11,443,623S9 1904.8 £12,150,614S5 1904.7 £12,588,666
TABLE 88 Specificity of CT scans for the diagnosis of vascular(versus non-vascular) events (1)
Strategies QALYs COSTS
S1 2001.5 £9,993,676S6 2001.5 £10,067,903S2 2001.5 £10,072,294S7 2001.4 £10,213,576S3 2001.4 £10,224,793Comparator 2001.4 £10,259,728S12 1918.6 £10,544,000S11 1915.9 £10,786,817S8 1999.8 £11,001,614S4 1999.7 £11,050,666S10 1961.9 £11,443,623S9 (LSR) 1950 £12,156,614S5 (LSR) 1949.9 £12,595,666
TABLE 89 Specificity of CT scans for the diagnosis of PICH(versus cerebral infarction) (0.6)
Strategies QALYs COSTS
S1 1916.6 £9,993,676S6 1916.6 £10,067,903S2 1916.6 £10,072,294S7 1916.5 £10,213,576S3 1916.5 £10,224,793Comparator 1916.5 £10,259,728S12 1852.8 £10,544,000S11 1837.9 £10,786,817S8 1915 £11,001,614S4 1914.9 £11,050,666S10 1880.5 £11,443,623S9 1870.4 £12,154,614S5 1870.3 £12,592,666
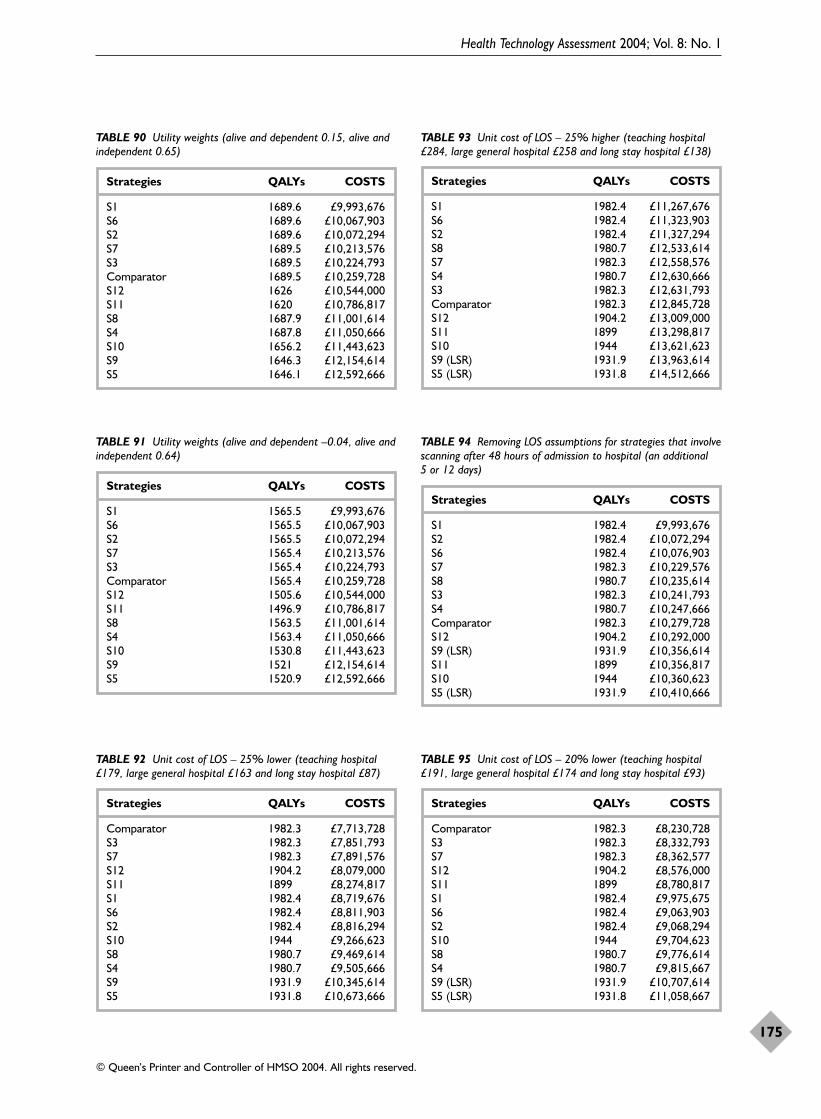
Health Technology Assessment 2004; Vol. 8: No. 1
175
© Queen’s Printer and Controller of HMSO 2004. All rights reserved.
TABLE 90 Utility weights (alive and dependent 0.15, alive andindependent 0.65)
Strategies QALYs COSTS
S1 1689.6 £9,993,676S6 1689.6 £10,067,903S2 1689.6 £10,072,294S7 1689.5 £10,213,576S3 1689.5 £10,224,793Comparator 1689.5 £10,259,728S12 1626 £10,544,000S11 1620 £10,786,817S8 1687.9 £11,001,614S4 1687.8 £11,050,666S10 1656.2 £11,443,623S9 1646.3 £12,154,614S5 1646.1 £12,592,666
TABLE 91 Utility weights (alive and dependent –0.04, alive andindependent 0.64)
Strategies QALYs COSTS
S1 1565.5 £9,993,676S6 1565.5 £10,067,903S2 1565.5 £10,072,294S7 1565.4 £10,213,576S3 1565.4 £10,224,793Comparator 1565.4 £10,259,728S12 1505.6 £10,544,000S11 1496.9 £10,786,817S8 1563.5 £11,001,614S4 1563.4 £11,050,666S10 1530.8 £11,443,623S9 1521 £12,154,614S5 1520.9 £12,592,666
TABLE 92 Unit cost of LOS – 25% lower (teaching hospital£179, large general hospital £163 and long stay hospital £87)
Strategies QALYs COSTS
Comparator 1982.3 £7,713,728S3 1982.3 £7,851,793S7 1982.3 £7,891,576S12 1904.2 £8,079,000S11 1899 £8,274,817S1 1982.4 £8,719,676S6 1982.4 £8,811,903S2 1982.4 £8,816,294S10 1944 £9,266,623S8 1980.7 £9,469,614S4 1980.7 £9,505,666S9 1931.9 £10,345,614S5 1931.8 £10,673,666
TABLE 93 Unit cost of LOS – 25% higher (teaching hospital£284, large general hospital £258 and long stay hospital £138)
Strategies QALYs COSTS
S1 1982.4 £11,267,676S6 1982.4 £11,323,903S2 1982.4 £11,327,294S8 1980.7 £12,533,614S7 1982.3 £12,558,576S4 1980.7 £12,630,666S3 1982.3 £12,631,793Comparator 1982.3 £12,845,728S12 1904.2 £13,009,000S11 1899 £13,298,817S10 1944 £13,621,623S9 (LSR) 1931.9 £13,963,614S5 (LSR) 1931.8 £14,512,666
TABLE 94 Removing LOS assumptions for strategies that involvescanning after 48 hours of admission to hospital (an additional 5 or 12 days)
Strategies QALYs COSTS
S1 1982.4 £9,993,676S2 1982.4 £10,072,294S6 1982.4 £10,076,903S7 1982.3 £10,229,576S8 1980.7 £10,235,614S3 1982.3 £10,241,793S4 1980.7 £10,247,666Comparator 1982.3 £10,279,728S12 1904.2 £10,292,000S9 (LSR) 1931.9 £10,356,614S11 1899 £10,356,817S10 1944 £10,360,623S5 (LSR) 1931.9 £10,410,666
TABLE 95 Unit cost of LOS – 20% lower (teaching hospital£191, large general hospital £174 and long stay hospital £93)
Strategies QALYs COSTS
Comparator 1982.3 £8,230,728S3 1982.3 £8,332,793S7 1982.3 £8,362,577S12 1904.2 £8,576,000S11 1899 £8,780,817S1 1982.4 £9,975,675S6 1982.4 £9,063,903S2 1982.4 £9,068,294S10 1944 £9,704,623S8 1980.7 £9,776,614S4 1980.7 £9,815,667S9 (LSR) 1931.9 £10,707,614S5 (LSR) 1931.8 £11,058,667
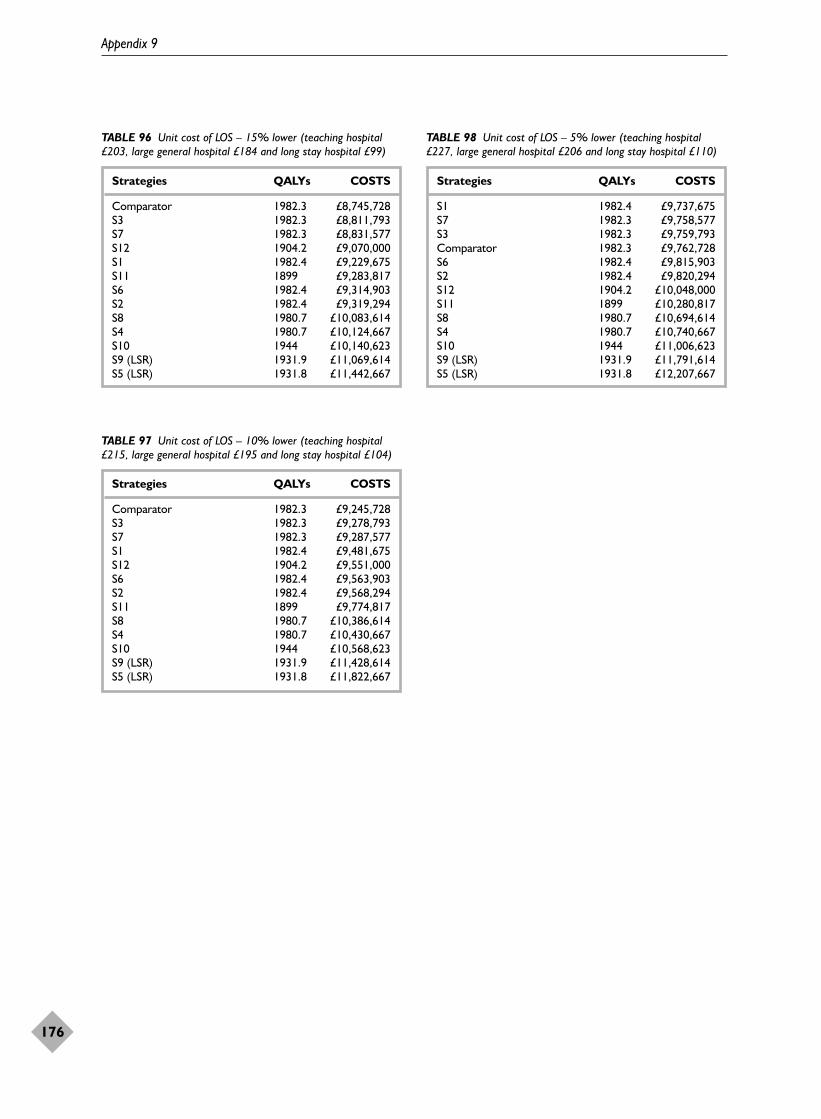
Appendix 9
176
TABLE 96 Unit cost of LOS – 15% lower (teaching hospital£203, large general hospital £184 and long stay hospital £99)
Strategies QALYs COSTS
Comparator 1982.3 £8,745,728S3 1982.3 £8,811,793S7 1982.3 £8,831,577S12 1904.2 £9,070,000S1 1982.4 £9,229,675S11 1899 £9,283,817S6 1982.4 £9,314,903S2 1982.4 £9,319,294S8 1980.7 £10,083,614S4 1980.7 £10,124,667S10 1944 £10,140,623S9 (LSR) 1931.9 £11,069,614S5 (LSR) 1931.8 £11,442,667
TABLE 97 Unit cost of LOS – 10% lower (teaching hospital£215, large general hospital £195 and long stay hospital £104)
Strategies QALYs COSTS
Comparator 1982.3 £9,245,728S3 1982.3 £9,278,793S7 1982.3 £9,287,577S1 1982.4 £9,481,675S12 1904.2 £9,551,000S6 1982.4 £9,563,903S2 1982.4 £9,568,294S11 1899 £9,774,817S8 1980.7 £10,386,614S4 1980.7 £10,430,667S10 1944 £10,568,623S9 (LSR) 1931.9 £11,428,614S5 (LSR) 1931.8 £11,822,667
TABLE 98 Unit cost of LOS – 5% lower (teaching hospital£227, large general hospital £206 and long stay hospital £110)
Strategies QALYs COSTS
S1 1982.4 £9,737,675S7 1982.3 £9,758,577S3 1982.3 £9,759,793Comparator 1982.3 £9,762,728S6 1982.4 £9,815,903S2 1982.4 £9,820,294S12 1904.2 £10,048,000S11 1899 £10,280,817S8 1980.7 £10,694,614S4 1980.7 £10,740,667S10 1944 £11,006,623S9 (LSR) 1931.9 £11,791,614S5 (LSR) 1931.8 £12,207,667

Health Technology Assessment 2004; Vol. 8: No. 1
177
© Queen’s Printer and Controller of HMSO 2004. All rights reserved.
PublicationsKeir SL, Wardlaw JM. Systematic review of diffusion and
perfusion imaging in acute ischaemic stroke. Stroke2000;31:2723–31.
Keir SL, Sandercock PAG, Wardlaw JM. Antithrombotictherapy in patients with any form of intracranialhaemorrhage: a systematic review of the availablecontrolled studies. Cerebrovasc Dis 2002;14:197–206.
Keir SL, Wardlaw JM, Warlow CP. Stroke epidemiologystudies have underestimated the frequency ofintracerebral haemorrhage. A systematic review ofimaging in epidemiological studies. J Neurology2002;249:1226–31.
Wardlaw JM, Dennis MS, Warlow CP, Sandercock PAG.Imaging appearance of the symptomatic perforatingartery in patients with lacunar infarction: occlusion orother vascular pathology? Ann Neurol 2001;50:208–15.
Guy S, Wardlaw JM. Who writes guidelines, and whoshould? Clinical Radiology 2002;57:891–7.
Wardlaw JM, Keir SL, Dennis MS. The impact of delaysin CT brain imaging on the accuracy of diagnosis andsubsequent management in patients with minorstroke. J Neurol Neurosurg Psychiatry 2003;74:77–81.
In preparationKeir SL, Wardlaw JM, Dennis MS. A comparison of CT
and MR imaging in the detection of haemorrhage –are we managing stroke correctly?
Keir SL, Wardlaw JM, Dennis MS. The effect of theresult of a CT or MR scan on doctor’s decisions forprimary treatment and secondary prevention ofstroke. Age and Aging. Under review.
Keir SL, Djimigen M, Wardlaw JM. Accuracy of MR indetection of intracerebral haemorrhage late afterstroke. Under review.
Seymour J, Wardlaw JM, Cairns J. Provision of CTscanning for stroke – a matter of chance? Submitted.
Wardlaw JM, Seymour J, Keir SL, Cairns J, SandercockPAG, Dennis MS. Cost effectiveness of CT scanningafter stroke. Stroke. Submitted.
PresentationsKeir S, Wardlaw J, Warlow CP. Have epidemiological
studies of stroke incidence underestimated thefrequency of primary intracerebral haemorrhage? 9thEuropean Stroke Conference, Vienna, May 25th–27th2000 (Platform Session IV: Hemorrhage). CerebrovascDis 2000;10(Suppl 2):50.
Keir SL, Lewis SC, Wardlaw JM, Sandercock PAG, ChenZM, on behalf of the IST and CAST CollaborativeGroups. Effects of aspirin or heparin inadvertentlygiven to patients with haemorrhagic stroke. 25thInternational Stroke Conference, New Orleans, USA,10–12 Feb 2000. Stroke 2000;31:314.
Keir S, Wardlaw J, Dennis M. What are the benefits ofbrain imaging in patients presenting with minorstroke? 10th European Stroke Conference, Lisbon,Portugal, May 16th–19th 2001 (Oral Session II:Neuro-and Vascular Imaging). Cerebrovasc Dis2001;11(Suppl 4):56.
Wardlaw JM, Dennis MS, Warlow CP, Sandercock PAG.Imaging appearance of the symptomatic perforatingartery in patients with lacunar infarction: occlusion,or other vascular pathology? 10th European StrokeConference, Lisbon, Portugal, May 16th–19th 2001(Oral Session: Neuroimaging). Cerebrovasc Dis2001;11(Suppl 4):27.
Wardlaw J, Seymour J, Sandercock PAG, Cairns J, KeirS, Dennis M. Cost-effectiveness of CT scanning inacute stroke. 11th European strke Conference,Geneva, Switzerland, May 29–June 1 2002 (OneSession/Management Economics). Cerebrovasc Dis2002;13(Suppl. 3):61.
Appendix 10
Publications and presentations


Joanna Wardlaw � is the contact reviewer for the Cochrane
systematic review of thrombolytic treatment foracute stroke
� is a member of the third International StrokeTrial (IST-3) management group and leads acollaborative neuroradiological group assessingthe scans of patients entered in the trial
� is director of the SHEFC Brain ImagingResearch Centre for Scotland. This is locatedwithin the Department of ClinicalNeurosciences at the University of Edinburgh.The Centre houses a research magneticresonance scanner which was funded by the UKResearch Council’s Joint Research EquipmentInitiative, supplemented by grants anddonations from various other sources.Boehringer Ingelheim was one of thecommercial enterprises which gave a granttowards the purchase of the scanner
� has also attended meetings held by BoehringerIngelheim to discuss the licensing of rt-PA. Sheattended as an unpaid independent externaladviser but was refunded her travel expenses.
Peter Sandercock� was the Principal Investigator of the IST-2 to
evaluate a neuroprotective compound (619c89).The trial was to be conducted independently ofthe manufacturer (Glaxo-Wellcome). PeterSandercock received an initial grant of£800,000 from Glaxo-Wellcome for the firstphases of the study, but the compound waswithdrawn from clinical development and IST-2was terminated before any patients had beenrandomised
� is Chairman of the Steering Committee for theIST-3 of thrombolysis in acute stroke. The start-up phase of the trial is currently funded by agrant from the Stroke Association. BoehringerIngelheim have donated trial drug and placebofor the 300 patients to be included in the start-up phase
� is a member of the Trial Steering Committeefor the MRC IMAGES trial (of magnesium, apotentially neuroprotective agent).
Martin Dennis� received a grant of £18,000 from UCB Pharma
for work on the risk of seizures after stroke
� received a grant of £20,000 from Sanofi tosupport work on stroke prevention
� received funding from Glaxo-Wellcome(£100,000) to establish a series of clinical training fellowships in stroke medicine
� is a member of the IST-3 Steering Committeeand is participating as a collaborator in IST-3
� is responsible for running stroke services at the Western General Hospital. This has been supported by Boehringer Ingelheim, who supplied £800 worth of patient leaflets
� was founding president of the BritishAssociation of Stroke Physicians. Boehringerdonated £4000 towards the cost of establishingthe Association.
Sarah KeirHas no conflict of interest (see below).
John CairnsHas no conflict of interest.
Janelle SeymourHas no conflict of interest.
Both John Cairns and Janelle Seymour work inthe Health Economics Research Unit, Aberdeen,which receives funding from the Chief Scientist’sOffice of the Scottish Parliament. The viewsexpressed in this report are not those of theScottish Office.
J Wardlaw, P Sandercock, M Dennis and S Keirhave at some time received lecture fees or travelexpenses to attend conferences from a variety ofpharmaceutical companies, including BoehringerIngelheim and Glaxo Wellcome. None of theauthors has a contractual consultancy arrangementwith any pharmaceutical company. Furthermore,none of us knowingly has any financial interest inany of the companies whose products arementioned in this report.
Book royaltiesJoanna Wardlaw, Peter Sandercock and MartinDennis are co-authors of Stroke: a practical guide tomanagement, published by Blackwell Science.
Health Technology Assessment 2004; Vol. 8: No. 1
179
© Queen’s Printer and Controller of HMSO 2004. All rights reserved.
Appendix 11
Authors’ declared conflicts of interest

Servier, the manufacturers of the antihypertensivedrug Perindopril, bought 2000 copies of the book;each author will receive royalties on these sales tothe value of £762 as a result.
S LewisDoes not, to the best of their knowledge, have anypersonal, financial or scientific conflicts of interest.
Signed declarations of potential conflicts havebeen lodged with Joanna Wardlaw.
180
Appendix 11

Health Technology Assessment 2004; Vol. 8: No. 1
189
Health Technology AssessmentProgramme
Prioritisation Strategy GroupMembers
Chair,Professor Tom Walley, Director,NHS HTA Programme &Professor of ClinicalPharmacology, University of Liverpool
Professor Bruce Campbell,Consultant Vascular & GeneralSurgeon, Royal Devon & ExeterHospital
Professor Shah Ebrahim,Professor in Epidemiology of Ageing, University of Bristol
Dr John Reynolds, ClinicalDirector, Acute GeneralMedicine SDU, RadcliffeHospital, Oxford
Dr Ron Zimmern, Director,Public Health Genetics Unit,Strangeways ResearchLaboratories, Cambridge
HTA Commissioning BoardMembers
Programme Director, Professor Tom Walley, Director,NHS HTA Programme &Professor of ClinicalPharmacology, University of Liverpool
Chair,Professor Shah Ebrahim,Professor in Epidemiology ofAgeing, Department of SocialMedicine, University of Bristol,Canynge Hall, WhiteladiesRoad, Bristol
Deputy Chair, Professor Jenny Hewison,Professor of Health CarePsychology, Academic Unit ofPsychiatry and BehaviouralSciences, University of LeedsSchool of Medicine, Leeds
Professor Douglas Altman,Professor of Statistics inMedicine, Centre for Statisticsin Medicine, Oxford University,Institute of Health Sciences,Cancer Research UK MedicalStatistics Group, Headington,Oxford
Professor John Bond, Professorof Health Services Research,Centre for Health ServicesResearch, University ofNewcastle, School of HealthSciences, Newcastle upon Tyne
Professor John Brazier, Directorof Health Economics, SheffieldHealth Economics Group,School of Health & RelatedResearch, University ofSheffield, ScHARR RegentCourt, Sheffield
Dr Andrew Briggs, PublicHealth Career Scientist, HealthEconomics Research Centre,University of Oxford, Instituteof Health Sciences, Oxford
Dr Christine Clark, MedicalWriter & Consultant Pharmacist,Cloudside, Rossendale, LancsandPrincipal Research Fellow,Clinical Therapeutics in theSchool of Pharmacy, BradfordUniversity, Bradford
Professor Nicky Cullum,Director of Centre for EvidenceBased Nursing, Department ofHealth Sciences, University ofYork, Research Section,Seebohm Rowntree Building,Heslington, York
Dr Andrew Farmer, SeniorLecturer in General Practice,Department of Primary HealthCare, University of Oxford,Institute of Health Sciences,Headington, Oxford
Professor Fiona J Gilbert,Professor of Radiology,Department of Radiology,University of Aberdeen, LilianSutton Building, Foresterhill,Aberdeen
Professor Adrian Grant,Director, Health ServicesResearch Unit, University ofAberdeen, Drew Kay Wing,Polwarth Building, Foresterhill,Aberdeen
Professor Alastair Gray, Director,Health Economics ResearchCentre, University of Oxford,Institute of Health Sciences,Headington, Oxford
Professor Mark Haggard,Director, MRC ESS Team, CBUElsworth House, Addenbrooke’sHospital, Cambridge
Professor F D Richard Hobbs,Professor of Primary Care &General Practice, Department ofPrimary Care & GeneralPractice, University ofBirmingham, Primary Care andClinical Sciences Building,Edgbaston, Birmingham
Professor Peter Jones, Head ofDepartment, UniversityDepartment of Psychiatry,University of Cambridge,Addenbrooke's Hospital,Cambridge
Professor Sallie Lamb, ResearchProfessor in Physiotherapy/Co-Director, InterdisciplinaryResearch Centre in Health,Coventry University, Coventry
Dr Donna Lamping, SeniorLecturer, Health ServicesResearch Unit, Public Healthand Policy, London School ofHygiene and Tropical Medicine,London
Professor David Neal, Professorof Surgical Oncology, OncologyCentre, Addenbrooke's Hospital,Cambridge
Professor Tim Peters, Professorof Primary Care Health ServicesResearch, Division of PrimaryHealth Care, University ofBristol, Cotham House, CothamHill, Bristol
Professor Ian Roberts, Professorof Epidemiology & PublicHealth, Intervention ResearchUnit, London School ofHygiene and Tropical Medicine,London
Professor Peter Sandercock,Professor of Medical Neurology,Department of ClinicalNeurosciences, University ofEdinburgh, Western GeneralHospital NHS Trust, BramwellDott Building, Edinburgh
Professor Martin Severs,Professor in Elderly HealthCare, Portsmouth Institute ofMedicine, Health & Social Care,St George’s Building,Portsmouth
Dr Jonathan Shapiro, SeniorFellow, Health ServicesManagement Centre, ParkHouse, Birmingham
Current and past membership details of all HTA ‘committees’ are available from the HTA website (www.ncchta.org)
© Queen’s Printer and Controller of HMSO 2004. All rights reserved.

Health Technology Assessment Programme
190
Diagnostic Technologies & Screening PanelMembers
Chair,Dr Ron Zimmern, Director ofthe Public Health Genetics Unit,Strangeways ResearchLaboratories, Cambridge
Dr Paul Cockcroft, ConsultantMedical Microbiologist/Laboratory Director, PublicHealth Laboratory, St Mary’s Hospital, Portsmouth
Professor Adrian K Dixon,Professor of Radiology,Addenbrooke’s Hospital,Cambridge
Dr David Elliman, Consultant inCommunity Child Health,London
Dr Andrew Farmer, SeniorLecturer in General Practice,Institute of Health Sciences,University of Oxford
Dr Karen N Foster, ClinicalLecturer, Dept of GeneralPractice & Primary Care,University of Aberdeen
Professor Jane Franklyn,Professor of Medicine,University of Birmingham
Professor Antony J Franks,Deputy Medical Director, TheLeeds Teaching Hospitals NHSTrust
Mr Tam Fry, HonoraryChairman, Child GrowthFoundation, London
Dr Susanne M Ludgate, MedicalDirector, Medical DevicesAgency, London
Dr William Rosenberg, SeniorLecturer and Consultant inMedicine, University ofSouthampton
Dr Susan Schonfield, CPHMSpecialised ServicesCommissioning, CroydonPrimary Care Trust
Dr Margaret Somerville,Director of Public Health,Teignbridge Primary Care Trust,Devon
Mr Tony Tester, Chief Officer,South Bedfordshire CommunityHealth Council, Luton
Dr Andrew Walker, SeniorLecturer in Health Economics,University of Glasgow
Professor Martin J Whittle,Head of Division ofReproductive & Child Health,University of Birmingham
Dr Dennis Wright, ConsultantBiochemist & Clinical Director,Pathology & The KennedyGalton Centre, Northwick Park& St Mark’s Hospitals, Harrow
Pharmaceuticals PanelMembers
Chair,Dr John Reynolds, ClinicalDirector, Acute GeneralMedicine SDU, OxfordRadcliffe Hospital
Professor Tony Avery, Professorof Primary Health Care,University of Nottingham
Professor Iain T Cameron,Professor of Obstetrics &Gynaecology, University ofSouthampton
Mr Peter Cardy, ChiefExecutive, Macmillan CancerRelief, London
Dr Christopher Cates, GP andCochrane Editor, Bushey HealthCentre, Bushey, Herts.
Mr Charles Dobson, SpecialProjects Adviser, Department ofHealth
Dr Robin Ferner, ConsultantPhysician and Director, WestMidlands Centre for AdverseDrug Reactions, City HospitalNHS Trust, Birmingham
Dr Karen A Fitzgerald,Pharmaceutical Adviser, Bro TafHealth Authority, Cardiff
Professor Alastair Gray,Professor of Health Economics,Institute of Health Sciences,University of Oxford
Mrs Sharon Hart, ManagingEditor, Drug & TherapeuticsBulletin, London
Dr Christine Hine, Consultant inPublic Health Medicine, Bristol South & West PrimaryCare Trust
Professor Robert Peveler,Professor of Liaison Psychiatry,Royal South Hants Hospital,Southampton
Dr Frances Rotblat, CPMPDelegate, Medicines ControlAgency, London
Mrs Katrina Simister, NewProducts Manager, NationalPrescribing Centre, Liverpool
Dr Ken Stein, Senior Lecturer inPublic Health, University ofExeter
Professor Terence Stephenson,Professor of Child Health,University of Nottingham
Dr Richard Tiner, MedicalDirector, Association of theBritish Pharmaceutical Industry,London
Professor Dame Jenifer Wilson-Barnett, Head of FlorenceNightingale School of Nursing& Midwifery, King’s College,London
Current and past membership details of all HTA ‘committees’ are available from the HTA website (www.ncchta.org)
Health Technology Assessment 2004; Vol. 8: No. 1
191
Therapeutic Procedures PanelMembers
Chair, Professor Bruce Campbell,Consultant Vascular andGeneral Surgeon, Royal Devon& Exeter Hospital
Dr Mahmood Adil, Head ofClinical Support & HealthProtection, Directorate ofHealth and Social Care (North),Department of Health,Manchester
Professor John Bond, Head ofCentre for Health ServicesResearch, University ofNewcastle upon Tyne
Mr Michael Clancy, Consultantin A & E Medicine,Southampton General Hospital
Dr Carl E Counsell, SeniorLecturer in Neurology,University of Aberdeen
Dr Keith Dodd, ConsultantPaediatrician, DerbyshireChildren’s Hospital, Derby
Professor Gene Feder, Professorof Primary Care R&D, Barts &the London, Queen Mary’sSchool of Medicine andDentistry, University of London
Ms Bec Hanley, FreelanceConsumer Advocate,Hurstpierpoint, West Sussex
Professor Alan Horwich,Director of Clinical R&D, TheInstitute of Cancer Research,London
Dr Phillip Leech, PrincipalMedical Officer for PrimaryCare, Department of Health,London
Mr George Levvy, ChiefExecutive, Motor NeuroneDisease Association,Northampton
Professor James Lindesay,Professor of Psychiatry for theElderly, University of Leicester
Dr Mike McGovern, SeniorMedical Officer, Heart Team,Department of Health, London
Dr John C Pounsford,Consultant Physician, NorthBristol NHS Trust
Professor Mark Sculpher,Professor of Health Economics,Institute for Research in theSocial Services, University ofYork
Dr L David Smith, ConsultantCardiologist, Royal Devon &Exeter Hospital
Professor Norman Waugh,Professor of Public Health,University of Aberdeen
Current and past membership details of all HTA ‘committees’ are available from the HTA website (www.ncchta.org)

Health Technology Assessment Programme
192Current and past membership details of all HTA ‘committees’ are available from the HTA website (www.ncchta.org)
Expert Advisory NetworkMembers
Mr Gordon Aylward, Chief Executive, Association of British Health-Care Industries, London
Ms Judith Brodie, Head of Cancer SupportService, Cancer BACUP, London
Mr Shaun Brogan, Chief Executive, RidgewayPrimary Care Group, Aylesbury,Bucks
Ms Tracy Bury, Project Manager, WorldConfederation for PhysicalTherapy, London
Mr John A Cairns, Professor of Health Economics,Health Economics ResearchUnit, University of Aberdeen
Professor Howard Stephen Cuckle, Professor of ReproductiveEpidemiology, Department ofPaediatrics, Obstetrics &Gynaecology, University ofLeeds
Professor Nicky Cullum, Director of Centre for EvidenceBased Nursing, University of York
Dr Katherine Darton, Information Unit, MIND – TheMental Health Charity, London
Professor Carol Dezateux, Professor of PaediatricEpidemiology, London
Professor Martin Eccles, Professor of ClinicalEffectiveness, Centre for HealthServices Research, University ofNewcastle upon Tyne
Professor Pam Enderby,Professor of CommunityRehabilitation, Institute ofGeneral Practice and PrimaryCare, University of Sheffield
Mr Leonard R Fenwick, Chief Executive, Newcastleupon Tyne Hospitals NHS Trust
Professor David Field, Professor of Neonatal Medicine,Child Health, The LeicesterRoyal Infirmary NHS Trust
Mrs Gillian Fletcher, Antenatal Teacher & Tutor andPresident, National ChildbirthTrust, Henfield, West Sussex
Ms Grace Gibbs, Deputy Chief Executive,Director for Nursing, Midwifery& Clinical Support Servs., WestMiddlesex University Hospital,Isleworth, Middlesex
Dr Neville Goodman, Consultant Anaesthetist,Southmead Hospital, Bristol
Professor Robert E Hawkins, CRC Professor and Director ofMedical Oncology, Christie CRCResearch Centre, ChristieHospital NHS Trust, Manchester
Professor F D Richard Hobbs, Professor of Primary Care &General Practice, Department ofPrimary Care & GeneralPractice, University ofBirmingham
Professor Allen Hutchinson, Director of Public Health &Deputy Dean of ScHARR,Department of Public Health,University of Sheffield
Professor Rajan Madhok, Medical Director & Director ofPublic Health, Directorate ofClinical Strategy & PublicHealth, North & East Yorkshire& Northern Lincolnshire HealthAuthority, York
Professor David Mant, Professor of General Practice,Department of Primary Care,University of Oxford
Professor Alexander Markham, Director, Molecular MedicineUnit, St James’s UniversityHospital, Leeds
Dr Chris McCall, General Practitioner, TheHadleigh Practice, CastleMullen, Dorset
Professor Alistair McGuire, Professor of Health Economics,London School of Economics
Dr Peter Moore, Freelance Science Writer,Ashtead, Surrey
Dr Andrew Mortimore, Consultant in Public HealthMedicine, Southampton CityPrimary Care Trust
Dr Sue Moss, Associate Director, CancerScreening Evaluation Unit,Institute of Cancer Research,Sutton, Surrey
Professor Jon Nicholl, Director of Medical CareResearch Unit, School of Healthand Related Research,University of Sheffield
Mrs Julietta Patnick, National Co-ordinator, NHSCancer Screening Programmes,Sheffield
Professor Chris Price, Visiting Chair – Oxford, ClinicalResearch, Bayer DiagnosticsEurope, Cirencester
Ms Marianne Rigge, Director, College of Health,London
Professor Sarah Stewart-Brown, Director HSRU/HonoraryConsultant in PH Medicine,Department of Public Health,University of Oxford
Professor Ala Szczepura, Professor of Health ServiceResearch, Centre for HealthServices Studies, University ofWarwick
Dr Ross Taylor, Senior Lecturer, Department ofGeneral Practice and PrimaryCare, University of Aberdeen
Mrs Joan Webster, Consumer member, HTA –Expert Advisory Network


The National Coordinating Centre for Health Technology Assessment,Mailpoint 728, Boldrewood,University of Southampton,Southampton, SO16 7PX, UK.Fax: +44 (0) 23 8059 5639 Email: [email protected]://www.ncchta.org ISSN 1366-5278
FeedbackThe HTA Programme and the authors would like to know
your views about this report.
The Correspondence Page on the HTA website(http://www.ncchta.org) is a convenient way to publish
your comments. If you prefer, you can send your comments to the address below, telling us whether you would like
us to transfer them to the website.
We look forward to hearing from you.


![EAP Higher Education Fullreport[1]](https://img.pdfslide.net/doc/110x75/577cd9871a28ab9e78a3add6/eap-higher-education-fullreport1.jpg)