Embed Size (px)
DESCRIPTION
http://www.modelforest.net/media/k2/attachments/BSL_indicateurs_2000_EN.pdf
Citation preview

DEVELOPMENT OF THE BAS-SAINT-LAURENT MODEL FOREST MONITORING SYSTEM: SELECTION
OF LOCAL CRITERIA AND INDICATORS FORSUSTAINABLE FOREST MANAGEMENT
Prepared by Pierre Belleau, FE, M.Sc.
Bas-Saint-Laurent Model Forest
Rimouski
Progress report, February 2000

-2-
TABLE OF CONTENTS
LIST OF TABLES . . . . . . . . . . . . . . . . . . . . . . . . . . . . . . . . . . . . . . . . . . . . . . . . . . . . . . . . . . 3
INTRODUCTION . . . . . . . . . . . . . . . . . . . . . . . . . . . . . . . . . . . . . . . . . . . . . . . . . . . . . . . . . . 4
MODEL FOREST NETWORK AND INDICATORS . . . . . . . . . . . . . . . . . . . . . . . . . . . . . . . . 5
MONITORING SYSTEM DEVELOPMENT . . . . . . . . . . . . . . . . . . . . . . . . . . . . . . . . . . . . . . 6
INDICATOR DEVELOPMENT PROCESS . . . . . . . . . . . . . . . . . . . . . . . . . . . . . . . . . . . . . . . 7Features of the Model Forest’s management systems . . . . . . . . . . . . . . . . . . . . . . . . . . . . . . 7Importance of multi-resource management plans . . . . . . . . . . . . . . . . . . . . . . . . . . . . . . . . . 7Registration of sustainable management systems . . . . . . . . . . . . . . . . . . . . . . . . . . . . . . . . . 8Local forest values . . . . . . . . . . . . . . . . . . . . . . . . . . . . . . . . . . . . . . . . . . . . . . . . . . . . . . . 10Selection of indicators . . . . . . . . . . . . . . . . . . . . . . . . . . . . . . . . . . . . . . . . . . . . . . . . . . . . 10Workshops and meetings . . . . . . . . . . . . . . . . . . . . . . . . . . . . . . . . . . . . . . . . . . . . . . . . . . 11
INDICATORS OF SFM . . . . . . . . . . . . . . . . . . . . . . . . . . . . . . . . . . . . . . . . . . . . . . . . . . . . . 13
RESEARCH AND DEVELOPMENT NEEDS . . . . . . . . . . . . . . . . . . . . . . . . . . . . . . . . . . . . 17Indicator 1: Forest type and age-class distribution by forest type . . . . . . . . . . . . . . . . . . 17Indicator 2: Area of clearcuts . . . . . . . . . . . . . . . . . . . . . . . . . . . . . . . . . . . . . . . . . . . . . 17Indicator 12: Forest cover in watersheds . . . . . . . . . . . . . . . . . . . . . . . . . . . . . . . . . . . . . 17Indicator 15: Annual removal relative to the forest’s productive capacity . . . . . . . . . . . . . 18Socio-economic indicators: 20, 21, 22, 23 and 24 . . . . . . . . . . . . . . . . . . . . . . . . . . . . . . 18
CONCLUSION . . . . . . . . . . . . . . . . . . . . . . . . . . . . . . . . . . . . . . . . . . . . . . . . . . . . . . . . . . . . 19
REFERENCE WORKS . . . . . . . . . . . . . . . . . . . . . . . . . . . . . . . . . . . . . . . . . . . . . . . . . . . . . . 20
APPENDIXEVALUATION OF CCFM INDICATORS . . . . . . . . . . . . . . . . . . . . . . . . . . . . . . . . . . . . . . . . . 22

-3-
LIST OF TABLES
Table 1: Land-use areas defined in the Bas-Saint-Laurent Model Forest management plan . . . 9
Table 2: Local level indicators of SFM, Bas-Saint-Laurent Model Forest . . . . . . . . . . . . . . . . 14

-4-
INTRODUCTION
Phase I of Canada’s Model Forest Program was completed in March 1997. The emphasis during thisfirst development stage was placed on building effective working partnerships, testing models ofsustainable forest management specific to each member of the Model Forest Network and refiningthem through research. In the case of the Bas-Saint-Laurent Model Forest, two management modelswere experimented, i.e. forest tenant farms and improved group ventures.
Phase II of the Program is now well under way and the model forests are faced with new challenges,not the least of which is the development and testing of local-level indicators to measure performancerelative to their sustainable forest management (SFM) goals and objectives. To a certain extent, thisexercise contributes to the definition of mechanisms for certifying SFM systems for private forestland. Evaluation of SFM performance is separate from the five-year model forest evaluation, whichfocuses on achievements under annual programs and general operations.
The present report discusses the progress in developing a monitoring system for the Bas-Saint-Laurent Model Forest. It describes the process used to identify indicators, lists the establishedindicator set and discusses specific research needs that must be filled in order to make the systemmore effective overall. Familiarity with the Model Forest’s management systems would help inunderstanding the final selection.

-5-
MODEL FOREST NETWORK AND INDICATORS
Each model forest in the Canadian Network is required to develop indicators to demonstrate thatmanagement pract ices are having the desired effect on the forest values identified at the local level(Canada’s Model Forest Program: Proposal Guidelines for Phase II, 1996). While sharing acommon goal, the proposed models of sustainable forest management are unique in that they aretailored to a specific land base and, consequently, will influence the selection of local indicators.
To promote the exchange of information and knowledge and coordinate indicator developmentbeyond their individual contexts, all of the model forests used the 1995 Canadian Council of ForestMinisters (CCFM) document Defining Sustainable Forest Management: A Canadian Approach toCriteria and Indicators as the starting point for their deliberations. This document contains over 80indicators grouped under the following six criteria:
Ecological criteria
1. Conservation of biological diversity2. Maintenance and enhancement of forest ecosystem condition and productivity3. Conservation of soil and water resources4. Forest ecosystem contributions to global ecological cycles
Socio-economic criteria
5. Multiple benefits to society6. Accepting society’s responsibility for sustainable development.
Criterion 5 aims to maintain the many benefits society derives from forests, while Criterion 6 concernsthe notions of quality of life and public participation in decision making.
In accordance with the Proposal Guidelines, one or more indicators are to be developed for each ofthe CCFM criteria for the purpose of measuring progress in achieving sustainable forest management.However, because the indicators proposed by the CCFM are not always relevant to local needs, theBas-Saint-Laurent Model Forest has discarded some (see list in appendix) and replaced orreformulated others. Finally, if they wish, the model forests may choose to establish a bridge betweentheir indicator plan and other act ivities such as certification.

-6-
MONITORING SYSTEM DEVELOPMENT
An entire section of the Bas-Saint-Laurent Model Forest ’s Phase II proposal was devoted to thedevelopment of a monitoring system that includes an indicator measurement program and acommunications plan for disseminating the results. The present progress report is one of the meansprovided for in the communications plan.
Rather than repeating the content of the initial proposal, we will simply outline the principal stepsinvolved in developing our monitoring system:
S Establishment of a set of indicators;S Identification and development of measurement methods;S Initial set of measurements;S Results and final measurement program;S Periodic measurements and reports;S Validation of indicators and final assessment of SFM performance.
The development schedule targeted the establishment of a suite of indicators in summer 1998,immediately followed by an initial set of measurements and the establishment of benchmarks. Thesedeadlines were not met for reasons that will be explained further on.

-7-
INDICATOR DEVELOPMENT PROCESS
Features of the Model Forest’s management systems
The Bas-Saint-Laurent Model Forest covers three territories located ent irely on private forest land.This unique context sets it apart from public forests in numerous ways and influences protocols anddecisions related to SFM indicators.
The reliance of the region’s communities on the forest sector shaped the Lower St. Lawrencelandscape: intensive management, increased fragmentation, global and multi-purpose land use, denseand omnipresent road network, etc. In addition, the respect of ownership rights necessitates certaindistinctions. Collectively, these conditions create an environment that is unique to private forests androoted in history, limiting the possibility of change. In fact, the only way of changing standard practiceis through education and public awareness.
As will be seen further on, the above factors are key determinants in the selection of indicatorsspecific to the Bas-Saint-Laurent Model Forest. Issues such as Aboriginal groups, the size ofharvesting areas, fragmentation and connectedness of forest ecosystem components, corridors linkingvegetation units, fire frequency, preservation of old-growth forests and the establishment of areaswith across-the-board protection have a whole different meaning in the private forest context.
Importance of multi-resource management plans
In the minds of the promoters, a multi-resource management plan for each of the Model Forestterritories where SFM models were to be tested was crucial. The Bas-Saint-Laurent Model Forestco-manages its entire territory, which is why, unlike other model forests, it has invested time andmoney in this area from the beginning of Phase I. The multi-resource management plan is one of theModel Forest’s biggest accomplishments, and seeing to it that the protection measures containedtherein are applied is the only means of achieving true forest sustainability.
The Model Forest built its management plans on consultat ions with its partners and a wide spectrumof forest user representatives from within the community. The work plan adopted for the territoryunder the responsibility of the Groupement forestier de l'Est du Lac Témiscouata included severalstages during which a consultation document was submitted to participants for revision and constantimprovement. The plan concluded with a proposal to invite the general public to a meeting at whichthe management plan would be explained and cit izens could give their opinions on the proposedpractices. The meeting was announced in the principal local media, and all aspects of the managementplan met with unequivocal approval.

-8-
The plan, which includes an environmental code of ethics, proposes a range of measures forprotect ing forest resources. Every facet of SFM is addressed: flora, fauna, soil and water resources,recreation, visual quality, etc. The measures were grouped into four categories according to theassociated restriction of human activity and then one category was assigned to each portion of theModel Forest territory to create land-use areas (Table 1). The code of ethics identifies two practices as being incompatible with the project’s general aims,namely the use of herbicides in stand tending, and the clearcutting of an areas over four hectares. Theland-use areas and, more specifically, compliance with the associated management practices, the codeof ethics and the range of silvicultural activities together form an important basis of the Bas-Saint-Laurent Model Forest’s monitoring system. In fact, these elements underlie several of the indicatorsproposed further on.
Registration of sustainable management systems
The subject of forest certification is receiving considerable attention both in Canada and around theworld. Thus, before embarking on indicator development, the Model Forest attempted to link thisprocess to that leading to an application for SFM registration, in accordance with the voluntarystandard of the Canadian Standards Association (CSA Z809-96). The aim was to maximize spinoffsfor forest-dependent communities. However, the differences, on various levels, between the modelforest evaluation process and the process required by the Canadian standard made the two hard toreconcile.
For example, CSA Standard Z809 requires that each stage in the development of managementsystems include public consultation, particularly when it comes to defining values, goals, indicatorsand associated objectives. Furthermore, indicator needs extend beyond the local level. Finally, theStandard appears to be relatively lax in terms of validating linkages between the selected indicatorsand the status of the related criteria.

-9-
Table 1: Land-use areas defined in the Bas-Saint-Laurent Model Forest management plan
Area 1: Resource conservation
Descriptive categories Alder groves
Islands and islets
Barren and semi-barren land
Threatened or vulnerable plant species
Habitats of threatened or vulnerable animal species
Research sites with across-the-board protection
General management practice No forestry activity
Area 2: Resource protection
Descriptive categories Drinking water sources
Outstanding plant species
Habitats of outstanding animal species
Productive forest land with severe limitations in respect of operations
Riparian buffer strips
Beaver colonies
Archeological sites, vacation areas, wildlife and nature observation sites
Trail systems
Immediate surroundings of significant sites
Commercial maple stands
Partially protected research sites
General management practices Maintenance of quality forest cover without soil disturbance
Maximum clearcuts of 0.5 ha
Area 3: Site-specific management
Descriptive categories Forest land with severe limitations in respect of operations
Maple stands not exploited for commercial purposes
Moose wintering areas
White-tailed deer yards
Foreground areas
General management practice Silvicultural work determined on the basis of compatibility with primarysite use and vulnerability to soil disturbance
Area 4: Forest management area with light recreation
Descriptive category Productive forest land exploited primarily for timber production andlight recreation
General management practice Compliance with code of ethics

-10-
Despite the differences, however, the Model Forest initiated the development of indicators with aview to linking the two processes. As will be seen further on, public meetings were held in accordancewith CSA Standard Z809. In addition, various regional stakeholders sat down together on numerousoccasions to try and define a procedure and share responsibilities. If many had found the processcomplicated thus far, they lost interest altogether when strict guidelines on the communication ofcertification, i.e. officially prohibiting eco-labelling, were issued (Hillard and Abusow 1997). In thecase of private forests, where only a portion of the land is covered by a development program, thisrestriction means applying for registration of the entire area regardless of the management status ofthe woodlots concerned. Furthermore, it risks encouraging negligence on the part of certain ownerswho would be able to register their land with absolutely no management effort.
In light of these limitations, the managers of the Bas-Saint-Laurent Model Forest resolved to foregocertification until such time as a more flexible standard that is more compatible with the private forestcontext is introduced. All of this slowed down the definition of indicators and necessitated a revisionof the development schedule.
Local forest values
While not essential, the indicators used to assess model forests’ achievements in implementingsustainable forest management should ideally be associated with values considered important by thelocal population. As previously mentioned, the multi-resource management plan was devised inconsultation with the public and therefore reflects public expectations and concerns. One of the meansused to trace all local values, certain indicators and the associated objectives was to go over themanagement plans with a fine-tooth comb. Considerable information was collected this way.
A working document was subsequently submitted to the public at a meeting in St-Émile d’Auclair,a municipality in the Est du lac Témiscouata territory. Participants unanimously approved its contentand used the opportunity to add to the list of expectations they wanted to see addressed.
Selection of indicators
Other groups in Québec and across Canada have engaged in a similar process of developing indicatorsof SFM. The Bas-Saint-Laurent Model Forest consulted a number of works (see reference sectionin page 20) in defining its indicators, the main one being the CCFM publication Defining SustainableForest Management: A Canadian Approach to Criteria and Indicators, for the reasons mentionedearlier. The resulting suite of indicators will be frequently revised to incorporate comments fromoutside sources as well as validation results.

-11-
A good indicator is said to be measurable, predictable, relevant, comprehensible, valid and achievable(Bruford, 1996b). The Model Forest selected its indicators based on three main criteria:
< Must be currently mesurable;< Must be mesurable at reasonable cost;< Must demonstrate trends.
The first two criteria determine the degree to which a given indicator can eventually be used fo rcertification purposes. The aim is to limit field inspections and public surveys, which are very costly.
This type of exercise inevitably leads to the question of how many indicators are enough. The factthat at least one indicator was defined for each CCFM criterion and related element has no bearingon the evaluation’s worth. Conversely, each additional indicator makes monitoring harder and moreexpensive. The Bas-Saint-Laurent Model Forest started out with some 60 indicators, graduallywhittling the list down to 35 as deliberations progressed.
Workshops and meetings
In addition to participating in the numerous conference calls that allow members of the Model ForestNetwork to discuss and exchange information on the development of local level indicators, Bas-Saint-Laurent Model Forest managers have attended a number of workshops and meetings since thebeginning of Phase II, including:
EVENT DATE PLACE
CSA Seminar – Environmental management systems 02/97 Québec City (QC)Seminar on forest certification of private woodlots (FPBQ) 03/97 Longueuil (QC)SFM Coordination Group (Abitibi-Price) 06/97 Québec City (QC)LLIWG1 meeting 07/97 Lake Opinicon (ON)International conference: Global Approaches. Sustainable Forest Management 09/97 Prince George (BC)CSA Seminar - Sustainable forest management 12/97 Québec City (QC)Local level indicators workshop 10/97 Rimouski (QC)LLIWG1 meeting 01/98 Toronto (ON)CSA Seminar - Sustainable forest management 01/98 Montréal (QC)Public consultation on local forest values 02/98 Auclair (QC)Sustainable forest management and certification seminar (FMF2) 03/98 Rimouski (QC)Remote sensing course 08/98 Calgary (AB)Biodiversity workshop 10/98 Gananoque (ON)Remote sensing workshop 10/98 Sussex (NB)

-12-
In 1997, the Bas-Saint-Laurent Model Forest served as technical advisor to the Fédération desproducteurs de bois du Québec for the development of an SFM indicator proposal for Québec’sprivate forests. It also remains in contact with the MRNQ3 team in charge of developing indicators,whose work served as a model for its development process. 1 Model Forest Network Local Level Indicators Working Group2 Fundy Model Forest3 Ministère des ressources naturelles du Québec

-13-
INDICATORS OF SFM
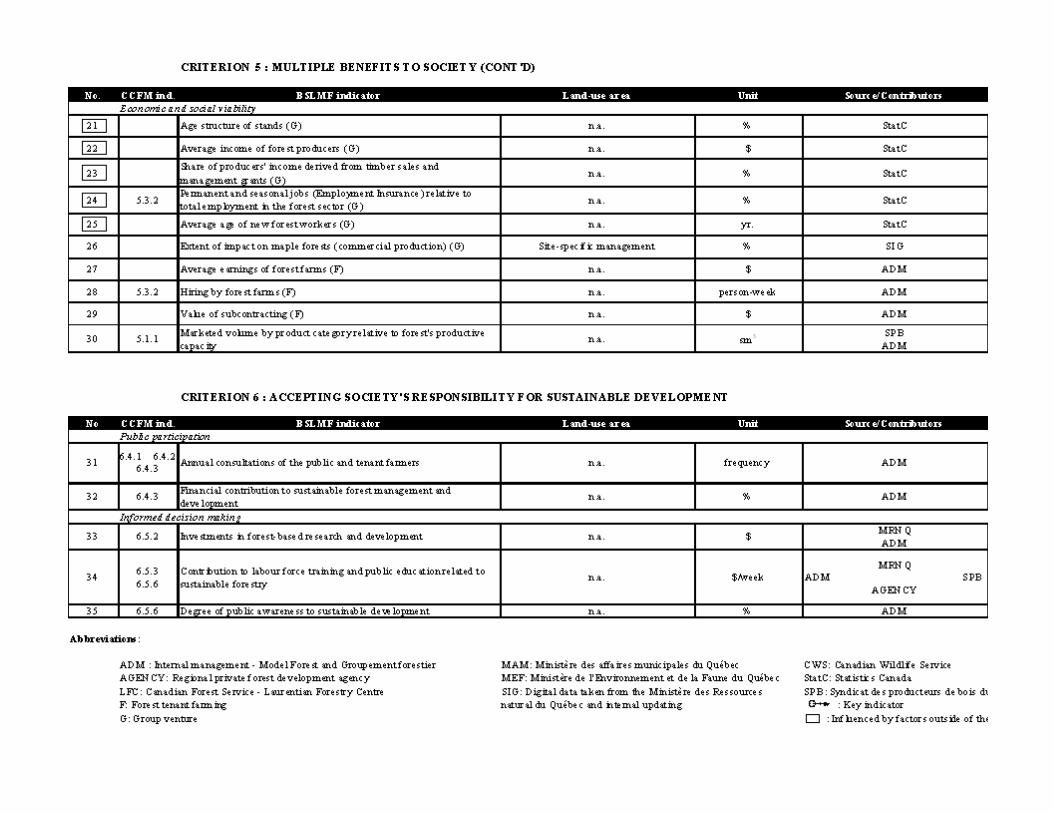
Table 2 presents the 34 indicators selected by the Bas-Saint-Laurent Model Forest for the six CCFMcriteria, indicating the information sources and frequency of updating for each. Physical environmentaldata are taken primarily from in-house operat ions monitoring and Québec government inventories:ecoforestry maps are now updated annually. Data for socio-economic indicators are taken fromnational censuses, various government departments as well as municipal organizations. In order todetermine the probable impacts of its SFM systems, the Model Forest decided to go as far back aspossible in its data collection.
Most of the indicators apply to both management models. However, where an indicator is relevantto only one of the models, it is indicated by the letter F (forest tenant farming) or G (group ventures).Each model will be evaluated separately.
The table also introduces the notion of key indicator, i.e. indicators considered critical to themonitoring of any SFM system and to which it could eventually be limited. Indicators 20 to 24 area special case in that the Model Forest does not have full control over all of the factors that couldmodify the socio-economic climate in the Est du lac Témiscouata territory. We nevertheless hope toidentify the impacts of the group venture management model through comparisons with indicatorareas, although this approach is experimental.
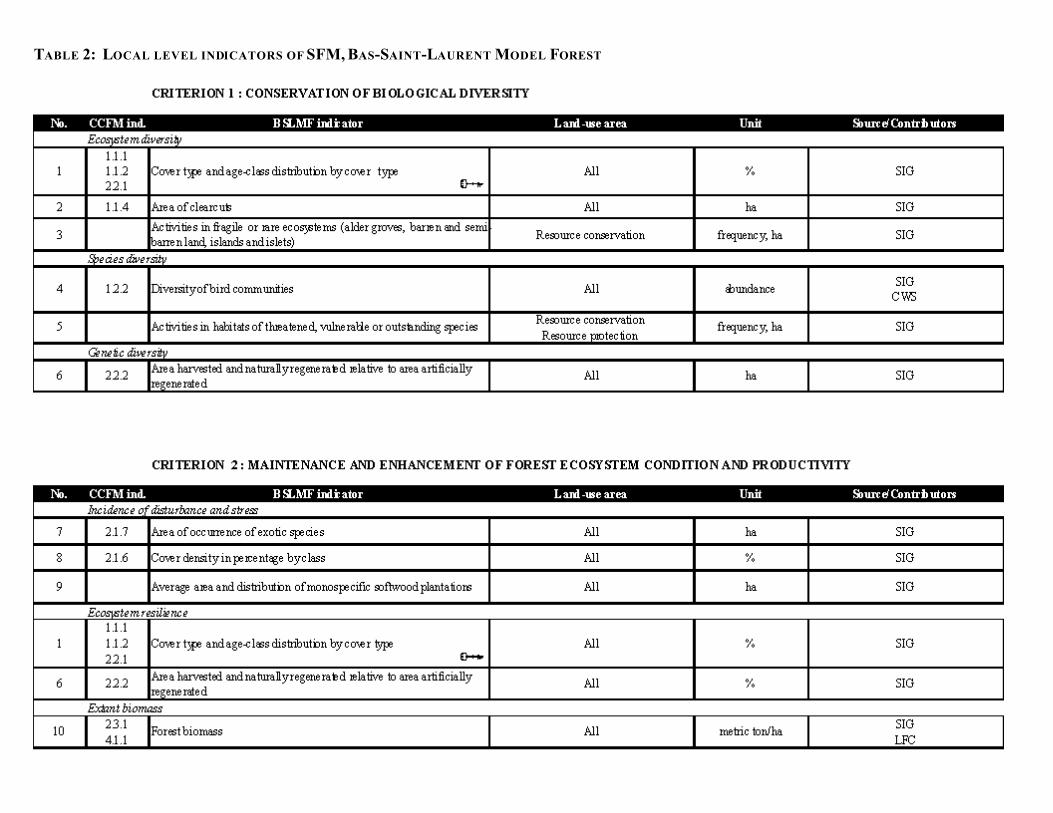
TABLE 2: LOCAL LEVEL INDICATORS OF SFM, BAS-SAINT-LAURENT MODEL FOREST


-17-
RESEARCH AND DEVELOPMENT NEEDS
Implementation of around ten of our indicators is currently limited due to knowledge gaps.Alternatives will be put in place until those gaps can be filled. The main research and developmentneeds in relation to indicators regard the establishment of scientifically based, quantifiable objectivesand the development of measurement methods and protocols. The chief issues that need to be dealtwith are as follows:
Indicator 1: Forest type and age-class distribution by forest type
This indicator is associated with criteria 1, 2 and 5. It is considered a key indicator of forestsustainability because it entails the notion of forest renewal. According to certain schools of thought,the conditions needed to maintain biological diversity can be reproduced by emulating the naturaldisturbance regime as much as possible. While this should be the target of forest management, itneeds to be more clearly defined. To this end, a study aimed at reconstructing the composition ofancient forests is currently being conducted. Until the results are in, the objective will be defined onthe potential final successional stage.
Indicator 2: Area of clearcuts
Indicator 2 relates to CCFM indicator 1.1.4 “Level of fragmentation and connectedness of forestecosystem components.” As previously mentioned, the concept of fragmentation in particular, butalso that of connectedness, have special meaning in the private forest context, especially since small-scale forest ry actually promotes fragmentation. Again, the targeted object ive is not clear.Consequently, a study of the natural disturbance regime is warranted.
In the meantime, the problem can be curbed by restricting the size of clearcuts, a key factor in coverdiversity.
Indicator 12: Forest cover in watersheds
Conservation of water resources implies maintaining the hydrological balance. This can be achievedby avoiding excessive disruption of the flow regime. Since monitoring flow fluctuations in eachwatershed is out of the question, the Model Forest proposes an indirect measure, namely, monitoringchanges in forest cover. Problems are foreseen where vegetation is unable to fulfil its interception andevapotranspiration functions over too large an area of the watershed. Scientifically based thresholdsare crit ical to implementation and management of a watershed management model.

-18-
Indicator 15: Annual removal relative to the forest’s productive capacity
This is the second key indicator in the Bas-Saint-Laurent Model Forest’s monitoring system. Themost recent developments enable annual updating of ecoforestry maps, which means we can nowaccount for and geographically locate all standing stock. The volume of timber harvested each yearis estimated by tree species based on voluntary reporting, but is currently limited to forest land undera management agreement with the Groupement forestier. Monitoring is therefore incomplete andinexact. Remote sensing appears to be the only technology capable of remedying this situation,although there is still a long way to go in its development.
Socio-economic indicators: 20, 21, 22, 23 and 24
The Model Forest’s monitoring system must include an affordable mechanism for effectivelymonitoring the socio-economic dimensions of forestry on privately owned land. Before conductingnew surveys and polls, the Model Forest preferred to consider the potential of existing informationsources, such as national censuses. An exploratory study conducted by Statistics Canada for theModel Forest suggests a possible method for this purpose. The four most recent censuses for theModel Forest territories and indicator areas were consulted to this end.

-19-
CONCLUSION
The process undertaken in April 1997 resulted in the selection of fewer than 40 local level indicatorsfor assessing the performance of group ventures (multi-resource management) and forest tenantfarming in achieving sustainable forest management. The indicators will evolve as new ways to makethem more effective in tracking progress toward sustainability are ident ified. The list will beconstantly updated and posted on the Bas-Saint-Laurent model forest’s web site.
The multi-resource management plans had a vital influence on the final selection of indicators, sincethe practices they prescribe are aimed at sustainable forestry. The plans’ upcoming review will beused to integrate indicator-based monitoring with management decisions.
The next report on the Model Forest’s monitoring system and local level indicators, slated forsubmission in the summer, will discuss the scientific grounds for the selected indicators, measurementprotocols, benchmarks and the preliminary findings.

-20-
REFERENCE WORKS
Author unknown. 1995. Criteria and indicators for the conservation and sustainable managementof temperate and boreal forests. The Montreal Process. Canadian Forest Service. 28 pages.
Bas-Saint-Laurent Model Forest. 1996. Proposal for phase II of Canada’s model forest program.50 pages.
Bell, Y.,Savoie, R. and Marchesseault, J. 1996. Plan d'aménagement multiressource de laseigneurie du Lac-Métis (Partie 2). Le plan d'affectation et d'aménagement des ressources.La Forêt modèle du Bas-Saint-Laurent. 103 pages.
Belleau, P. 1998. Évaluation des systèmes de gestion durable de la Forêt modèle du Bas-Saint-Laurent : indicateurs de biodiversité. Paper presented at the biodiversity workshop organizedby the Model Forest Network Local Level Indicators Working Group in Gananoque (Ont).
Boxall, P. 1997. Indicators of the benefits of wilderness and biodiversity at a local level. A modelforest network proposal. In: Criteria and indicators for sustainable forest management. Threeproposals for the model forest network. SERN. Canadian Forest Service. 4 pages.
Bruford, G. 1996a. CAN/CSA Z808-96. A sustainable forest management system: Guidancedocument. Environmental technology. A national standard of Canada. Canadian StandardsAssociation. 37 pages.
Bruford, G. 1996b. CAN/CSA Z809-96. A sustainable forest management system: Specificationsdocument. Environmental technology. A national standard of Canada. Canadian StandardsAssociation. 13 pages.
Cantin, M. 1998. Critères et indicateurs de développement forestier durable. Gouvernement duQuébec. Ministère des ressources naturelles du Québec. Direction de l'environnement.93 pages plus appendices.
Canadian Council of Forest Ministers. 1995. Defining sustainable forest management: A Canadianapproach to criteria and indicators. 22 pages.
Coté, M.-A. 1997. Proposition d'indicateurs de gestion durable pour la forêt privée du Québec.Fédération des producteurs de bois du Québec. Canadian Standards Association. 35 pagesplus appendices.

-21-
Gagnon, C. 1997. Détermination et évaluation d'indicateurs de développement écologiquementdurable pour une région à vocation forestière : le JAL. Master’s thesis. Faculty of Forestryand Geomatics. Université Laval. 125 pages.
Hardi, P. and Barg, S. 1997. Measuring sustainable development: Review of current practice.Occasional Paper No. 17. Industry Canada. 124 pages.
Hillard, J. and Abusow, K. 1997. Communicating your certification. Canadian sustainable forestrycertification coalition. 14 pages plus appendix.
Moore, J-D. 1998. Le réseau de surveillance des écosystèmes forestiers (RESEF). III- L'utilisationdu RESEF pour l'étude de la biodiversité du milieu forestier. Gouvernement du Québec,MRNQ, Direction de la recherche forest ière. 21 pages plus appendix.
Savoie R. and Joncas, G. 1995. Plan d'aménagement multiressource de la seigneurie de NicolasRiou (Partie 2). Le plan d'affectation et d'aménagement des ressources. La Forêt modèle duBas-Saint-Laurent. 89 pages.
Savoie, R. and Marchesseault, J. 1996. Plan d'aménagement multiressource du territoire de l’estdu lac Témiscouata (Partie 2). Le plan d'affectation et d'aménagement des ressources. LaForêt modèle du Bas-Saint-Laurent. 107 pages.
UNCED. 1992. United Nations Conference on Environment and Development. Convention onBiological Diversity. Rio de Janeiro, Brazil. 40 pages.
White, B. 1997. A consumer expenditure based indicator approach to community forest sectordependence in the model forest network. In: Criteria and indicators for sustainable forestmanagement. Three proposals for the model forest network. SERN. Canadian Forest Service.3 pages.

-22-
APPEN DIXEVALUATION OF CCFM INDICATORS
B S LM F
equivalent
1. CONSER VATION O F BIO LOGIC AL DIVE RSITY
1.1 Ecosystem div ersity
1.1.1 Percentage and extent, in area, of forest types relative to historical condition and to total forest area 1
1.1.2 Percenta ge and e xtent of ar ea by for est type an d age cla ss 1
1.1.3 Area, percentage and representativeness of forest types in protected areas X
1.1.4 Level of fragm entation an d connectedness of forest ecosystem componen ts 2
1.2 Species diversity
1.2.1 Number of known forest-dependent species classified as extinct, threatened, endangered, rare or
vulnerable relative to the total num ber of known forest-dependent species
X
1.2.2 Population levels and changes over time for selected species and species guilds 4
1.2.3 Number of known forest-dependent species that occupy only a small portion of their former range X
1.3 Genetic diver sity
1.3.1 Implementation of an in situ/e x situ genetic conservation strategy for commercial and end angered
forest vegetation species
X
2. M AINTEN ANCE AND E NHAN CEM ENT OF FORE ST ECOS YSTEM COND ITION A ND PR ODUC TIVITY
2.1 Incidence of disturbance and stress (biotic and abiotic)
2.1.1 Area and severity of insect attack X
2.1.2 Area and severity of disease infestation X
2.1.3 Area and severity of fire damage X
2.1.4 Rates of pollutant deposition X X
2.1.5 Ozone concentrations in forested regions X X
2.1.6 Crow n transp arency in percent age by c lass 8
2.1.7 Area and severity of occurrence of exotic species detrimental to forest condition 7
2.1.8 Climate change as measured by temperature sums X X
2.2 Ecosystem resilience
2.2.1 Percenta ge and e xtent of ar ea by for est type an d age cla ss 1
2.2.2 Percentage of area successfully regenerated and a rtificially regenerated 6
2.3 Extant biomass (biota)
2.3.1 Mea n annu al increm ent by forest type an d age cla ss X
2.3.2 Frequency of occurrence within selected indicator species (vegetation, birds, mammals and fish) 10
3. CONSERVATION OF SOIL AND WATER RESOU RCES
3.1 Physical environmental factors

B S LM F
equivalent
-23-
3.1.1 Percenta ge of har vested ar ea hav ing significa nt soil com paction , displacem ent, erosion , puddl ing, loss
of organic matter, etc.
11
3.1.2 Area of forest converted to non-forest land use, e.g., urbanization X
3.1.3 Water qu ality as measured by w ater chemistry, turbidity, etc. X
3.1.4 Trends a nd timing of even ts in stream flows from forest catchments 12
3.1.5. Changes in the distribution and abundance of aquatic fauna X
3.2 Policy and protection forest factors
3.2.1 Percentage of forest managed primarily for soil and water protection X
3.2.2 Percentage of forest area having road con struction and stream crossing guidelines in place X
3.2.3 Area, percentage and representativeness of forest types in protected areas X
4. FOREST ECOSYSTEM CONTRIBUTIONS TO GLOBAL ECOLOGICAL CYCLES
4.1 Contribu tions to the global c arbon bu dget
4.1.1 Tree biomass volu mes 10
4.1.2 Vegetation (non-tree) biomass estimates X
4.1.3 Percentage of canopy cover X
4.1.4 Percentage of biomass volume by general forest type X
4.1.5 Soil carbon pools X
4.1.6 Soil carbon pool decay ra tes X
4.1.7 Area of forest depletion X
4.1.8 Forest wood product life cycles X
4.1.9 Forest sector CO2 emissions X X
4.2 Forest land conversion
4.2.1 Area of forest permanently converted to non-forest land use, e.g., urbanization X
4.2.2 Semi-permanent or temporary loss or gain of forest ecosystems, e.g., grasslands and agriculture X
4.3 Forest sector CO2 conservation
4.3.1 Fossil fuel emissions X X
4.3.2 Fossil carbon products emissions X X
4.3.3 Percentage of forest sector energy usage from renewable sources relative to the total energy
requirement
X
4.4 Forest sector policy factors
4.4.1 Recycling rate of forest wood products manufactured and used in Canada X X X
4.4.2 Participation in the climate change conventions X X
4.4.3 Econom ic incentive s for bioener gy use X X

B S LM F
equivalent
-24-
4.4.4 Existence of forest inventories X
4.4.5 Existence of laws and regulations on forest land management X
4.5 Contr ibution s to hydro logical c ycles
4.5.1 Surface area of water within forested areas 13
5. M ULTIPL E BEN EFITS TO S OCIETY
5.1 Productiv e capacity
5.1.1 Annua l removal o f forest products relativ e to the volum e of removals de termined to be su stainable 15
5.1.2 Distribution of, and changes in, the land base available for timber production 17
5.1.3 Animal popu lation trends for selected species of economic importance X
5.1.4 Manag ement and development expen ditures X
5.1.5 Availability of habitat for selected wildlife species of economic importance X
5.2 Competitiveness of resource industries (timber/non-timber related)
5.2.1 Net profitab ility 21-26
5.2.2 Trends in global market share X X
5.2.3 Trends in R & D expenditures in forest products and processing technologies X X
5.3 Contr ibution to the na tional ec onomy (timber /non-timb er sectors)
5.3.1 Contribution to gross domestic product (GDP) of timber and non-timber sectors of the forest economy X
5.3.2 Total employment in all forest-related sectors 23-27
5.3.3 Utilization of forests for non-market goods and services, including forest land use for subsistence
purposes
X
5.3.4 Economic valu e of non-market goods and services X
5.4 Non-tim ber valu es (inclu ding opti on valu es)
5.4.1 Availability and use of recreationa l opportunities X
5.4.2 Tota l expendit ures by individu als on a ctivities rela ted to non -timber u se X
5.4.3 Memberships and expenditures in forest recreation-oriented organizations and clubs X
5.4.4 Area and percentage of protected forest by degree of protection X
6. ACCEP TING SO CIETY ’S RESPONSIBILITY FOR SUSTAINABLE DEVELOPMENT
6.1 Aborigina l and treaty r ights
6.1.1 Extent to wh ich forest planning a nd mana gement proce sses consider and m eet legal obliga tions with
respect to duly esta blished Aborigin al and trea ty rights
X
6.2 Participation by Aboriginal communities in sustainable forest management
6.2.1 Extent of Aboriginal participation in forest-based economic opportu nities X
6.2.2 Extent to which forest management planning takes into account the protection of unique or significant
Aboriginal social, cultural or spiritua l sites
X

B S LM F
equivalent
-25-
6.2.3 Number of Aboriginal communities with a significant forestry component in the economic base and
diversity of forest use at the community level
X
6.2.4 Area of forest land available for subsistence purposes X
6.2.5 Area of Indian reserve forest lands under integrated management plans X
6.3 Sustainability of forest communities
6.3.1 Num ber of com mun ities with a significant forestry com ponent in the econo mic ba se X
6.3.2 Index of th e diversity o f the local in dustria l base X
6.3.3 Diversity of forest use at the community level X
6.3.4 Num ber of communities with stewardship or co-ma nagement responsibilities X
6.4 Fair and effective decision making
6.4.1 Degre e of publi c particip ation in the design o f decision-m aking processes 30
6.4.2 Degree of public participation in decision-mak ing processes 30
6.4.3 Degree of public participation in implementation of decisions and monitoring of progress toward
sustainable forest management
30
6.5 Informed decision making
6.5.1 Percentage of area covered by m ulti-attribute resource inventories X
6.5.2 Investments in forest-based R & D and information 32
6.5.3 Total effective expenditure on public forestry education 32
6.5.4 Percentage of forest area under completed management plans/programs/guidelines which have
included public participation
X
6.5.5 Expenditure on international forestry X
6.5.6 Mutua l learning mechanisms and p rocesses 33-34
BSLM F equiva lent: Number of the equivalent Bas-Saint-Laurent Model Forest indicator
Not measu rable: High costs, incomplete data, limited accuracy or no existing protocol
Not loca l: Indicator not monitored at the local level
No change: Unable to show improvement
Not releva nt: Does not apply to or is an integral part of the Model Forest’s SFM systems