Embed Size (px)
Citation preview
Hudson Bay Ice Conditions
ERIC W. DANIELSON, JR.l
ABSTRACT. Monthly mean ice cover distributions for Hudson Bay have been derived, based upon an analysis of nine years of aerial reconnaissance and other data. Information is presented in map form, along with diseussian Of significant features. Ice break-up is seen to work southward from the western, northern, and eastern edges of the Bay; the pattern seems to be a result of local topography, cur- rents, and persistent winds. Final melting occurs in August. Freeze-up commences in October, along the northwestern shore, and proceeds southeastward. The entire Bay is ice-covered by early January, except for persistent shore leads.
RÉSUMÉ. Conditions de la glace dans la mer d’Hudson. A partir de l’analyse de neuf années de reconnaissances aériennes et d’autres données, on a pu déduire des moyennes mensuelles de distribution de la glace pour la mer d’Hudson. L‘informa- tion est présentte sous formes de cartes et de discussion des Cléments significatifs. On y voit que la débâcle progresse vers le sud à partir des marges ouest, nord et est de la mer; cette séquence semble être le résultat de la topographie locale, des courants et .des vents dominants. La fonte se termine en aofit. L’enge€wommence en octobre le long de la rive nord-ouest et progresse vers le sud-est. Sauf pow les chenaux côtiers persistants, la mer est entihrement gelée au début de janvier.
INTRODUCTION
In many respects, ice cover is a basic hydrometeorological variable. In Hudson Bay (Fig. 1) it might be considered the most basic of all, as it influences all other conditions so decisively. The present paper is derived from a study of monthly mean heat fluxes, radiative and turbulent, through the Hudson Bay surface (Danielson 1969).
Knowledge of just the very fundamental aspects of Hudson Bay’s ice cover, namely that it freezes over virtually completely each winter and melts completely each summer, came relatively recently. Previous to the 1940’s, the accepted view was that extensive shore ice formed each winter in the Bay, up to 60 or 70 miles off-shore in places (U.S.H.O. 1946), but that the central portions were open all winter, except for a few fields of drifting ice. This ice was reported to melt during the summer.
The first real evidence contrary to this winter open-water belief came from air- plane pilots flying across the Bay during World War II. They reported the Bay quite generally ice-covered in winter. After the war, study of the situation was intensified through investigations in which observational and climatological data
1Talcott Mountain Science Center for Student Involvement, Avon, Connecticut, U.S.A.

HUDSON BAY ICE CONDITIONS 91
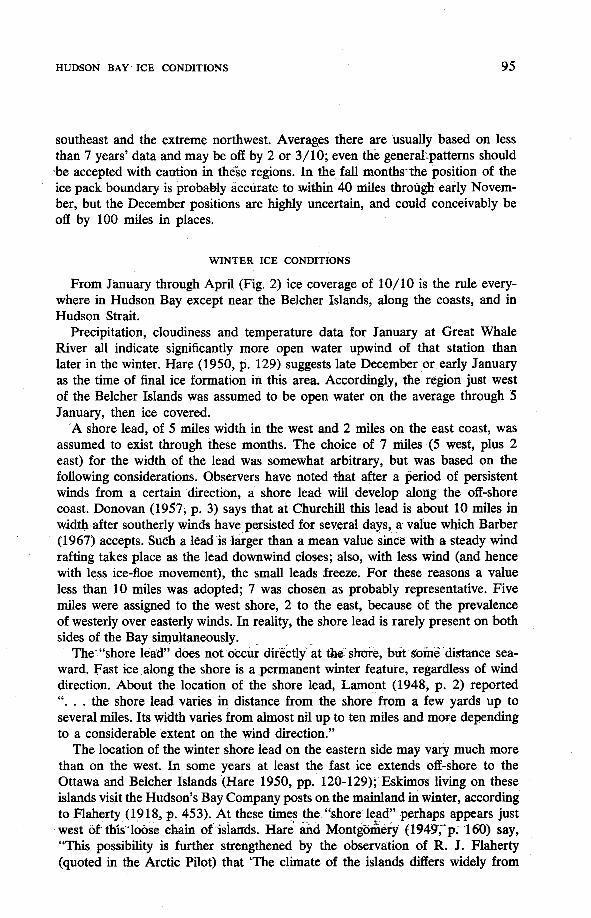
FIG. 1. General map of Hudson Bay with inset showing northeastern area.
were gathered and evaluated. The evidence, presented by Lamont (19481, Hare and Montgomery (1949), Burbidge (1949), Hare (1950), and Montgomery (1950), established beyond all doubt that Hudson Bay freezes over completely, every winter.
Ice reconnaissance flights over the Bay have been made nearly every year since 1950. The Canada Department of Transport, Meteorological Branch, has published these observations annually in its series of Circulars. To date, how- ever, no analysis of this information has been made to determine the mean space and time variations of the ice cover. The present paper contains a study of the subject.
DATA USED
Observations made from aircraft are ideal for ice surveys. The airborne ob- server travels high enough and fast enough to report on great areas in a single day. Unlike the seagoing observer, he may explore fully the areas of heaviest ice concentration. In addition, clouds do not present nearly the problem to low- altitude aircraft reconnaissance that they do to satellite observations.
92 HUDSON BAY ICE CONDITIONS
Since 1958 the Meteorological Branch has conducted aerial surveys of ice break-up and formation in Hudson Bay, primarily in support of shipping along the Hudson Bay Route. Flights are frequent, and reporting procedures are stan- dardized and quantitative in nature, so that reports from different years and different observers may be compared. These observations have been published in the Circulars referred to above.
In order to preserve the uniformity of the data, information other than the aerially-gathered data was used as little as possible in the present study. In the complete absence of aerial observations, however, recourse to land-based and ship-based reports, and to climatic data, was necessary. In particular, very little direct observational evidence exists for the month of December, so ice pack posi- tions for that month are largely smooth interpolations between November and January values. .
REDUCTION OF DATA
Ice conditions in Hudson Bay may be grouped in the following categories: Winter: January to April, when ice cover is nearly 100 per cent; Spring: May to mid-August, when ice cover is dissipating; Summer: late August to early October, when ice cover is nearly zero; Autumn: mid-October to late December, when ice cover is forming.
Winter and summer are static situations for the most part. Ice concentrations may be assumed to be 10/10 and 0/10, except for fringe areas described below. Climatic data provided an estimation of the date of onset of winter (i.e., nearly totally frozen conditions); other dates came directly from aerial data.
Fall and spring concentrations were determined as follows: The 77 grid points employed in this study appear on each map as small dots.
In general they are all odd-odd and even-even intersections of degrees of longitude west of 75 W. and latitude south of 65 N., except where these coordinates fell on islands. Each grid point, then, represents 2 degrees of longitude by 1 degree of latitude or about 3600 square nautical miles of surface.
The Circulars mentioned above provided the data for 1958 to 1964. For 1965 and 1966, data came directly from (photostat copies of) the ice observers’ charts, on file at the library of the Arctic Institute of North America. Ice amounts (10th~ of covaap)..unere-&termined .for each grid point covered on each flight. These were combined into semi-monthly averages at each point for each year. Observa- tion dates ranged from late April to late November, with the greatest number falling in July and August.
Averages were then taken for each grid point and half-month, over however many years’ observations were present. Very few points had observations for all 9 years for any semi-month. It was necessary to standardize the data to the full 9-year period in order to reduce bias arising from the small number (statistically speaking) of observations. A combination of interpolation, extrapolation and graphical subtraction supplied missing data. In certain regions, notably the south- east and the extreme northwest, observations were lacking over large areas for
HUDSON BAY ICE CONDITIONS 93
long periods of time. In such cases no attempt was made to supply the missing data number for number, so these regions represent less than 9 years’ data and are therefore less reliable.
PRESENTATION OF DATA
Presentation is in the form of semi-monthly maps showing isolines of 10 th~ of ice concentration. Except where noted below, the values at the grid points are 9-year means for the semi-month, areally averaged over the domain of each grid point. This results in considerable smoothing of the picture along the coast. Before the fast ice has left the shore in spring, for instance, concentrations at the shore quite generally will be 10/10, will drop to 0/10 at the ever-widening shore lead, and then rise to 9/10 or more as the central pack is reached. This widespread coastal condition may be described by a series of 6/10 and 7/ 10 observations at the coastal grid points, which obscures the fact that the concen- trations are highest on the immediate shore. Isolines of concentration were drawn for the grid points, generally without considering the smaller patterns.
For the autumn months, the presentation is slightly different from that for the other seasons, because of the behaviour of the ice cover in the autumn months. On any given date near the freeze-up time at a particular location, the distribution of ice concentrations observed over the years will be sharply bi-modal. Concen- trations of 0/10 and over 9/10 will occur almost to the exclusion of intermediate values. This is due to the fact that the Hudson Bay ice forms over large areas simultaneously; when cooled by large-scale invasions of very cold air from the northwest, the ice locally, except for a very short transition period, covers either all or none of the surface.
This process of ice formation (and later decay also) is so closely analogous to that of formation of the cirrostratus and altostratus cloud deck of a warm front that comparison may be useful. In both cases gradual cooling takes place until the critical temperature is reached; with additional cooling a rather sudden change of state occurs simultaneously over large areas, resulting in an overcast. The break-up of pack ice, like the dissipation of a stratiform cloud deck, is somewhat more gradual. The edges of the pack melt into smaller floes surrounded by open water just as the edge of the cloud deck breaks up into cells (altocumulus) sur- rounded by cloud-free air. Concentrations other than 0/10 or 10/10 are to be expected near the dissipating boundaries.
Autumn conditions for most points show a clustering of observations at 0/10 and another at 10/10 of concentration. A mean value extracted from such heter- ogeneous data yields an average figure whose frequency of occurrence is rare, the “happy medium” which never is observed. Thus the map for October and November depicts chief modal, rather than mean, values.
In the spring the frequency distribution at many points tends to favour extreme conditions also, because (as the analogy .suggests) intermediate concentrations are common only along the boundary of the ice pack. The spring case is not so extreme as in the fall, however, and the only safe way to deal with the spring ice conditions was to use mean values.

94 HUDSON BAY ICE CONDITIONS
RELIABILITY
Reliability of the results varies considerably by region and season. From late June through late August is the period of best overall coverage by aerial recon- naissance. For other months the coverage is thinner, and drops to almost nothing for most areas in September and from January through mid-May. This is not so very serious, however, for the ice reconnaissance flights are conducted when and where ice conditions are likely to be changing. Thus a nearly complete lack of data for September in the southern three-quarters of the Bay is not a serious handicap, since it is clear from August reports, and climatic conditions, that no ice is to be expected. Flying to pre-selected areas cuts down on the chances of discovering the unexpected, of course; perhaps very small ice concentrations do usually linger in the southwest Bay into September. Such very local phenomena, however, are beyond the intent of this study.
Climatic conditions over the nine years of study were examined, to ascertain whether mean ice conditions over this period were likely to be very different from conditions averaged over a greater number of years. No important climatic anomalies were detected, suggesting that the ice cover formed and dissipated during those years under conditions typical for the area over more extended periods.
It is difficult to estimate probable errors for the derived ice concentrations, owing to the complexity of the influencing factors (anomalous weather, interpo- lation and presentation errors, non-random flight paths, etc.). It is believed that the results generally portray average conditions to about 1/10 of concentration from January through September, except from June through early August in the
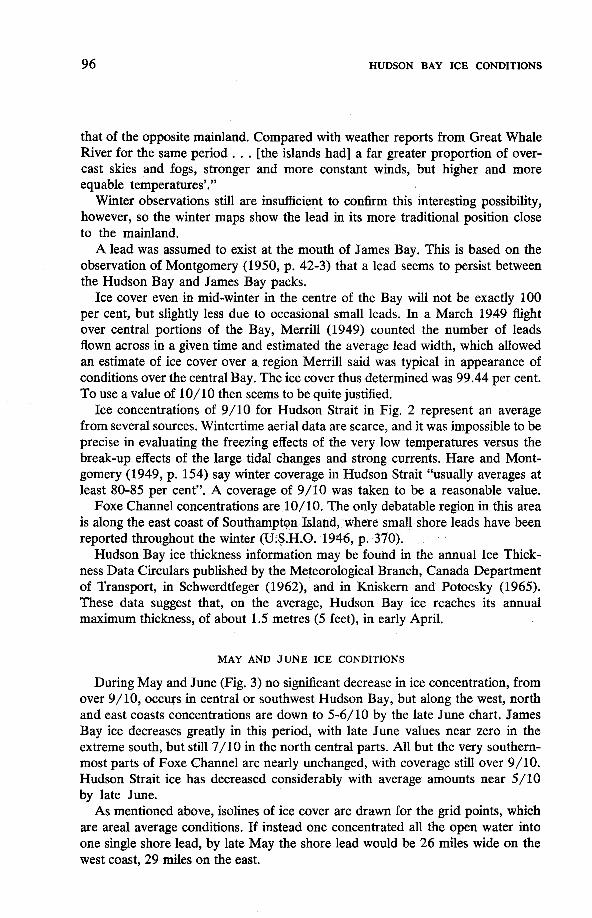
FIG. 2. Mean ice concentration for January through April.
HUDSON BAY ICE CONDITIONS 95
southeast and the extreme northwest. Averages there are usually based on less than 7 years’ data and may be off by 2 or 3/10; even the general-patterns should ,be accepted with caution in these regions. In the, fall monthsthe position of the ice pack boundary is probably accurate to within 40 miles through early Novem- ber, but the December positions are highly uncertain, and could conceivably be off by 100 miles in places.
WINTER ICE CONDITIONS
From January through April (Fig. 2) ice coverage of 10/10 is the rule every- where in Hudson Bay except near the Belcher Islands, along the coasts, and in Hudson Strait.
Precipitation, cloudiness and temperature data for January at Great Whale River all indicate significantly more open water upwind of that station than later in the winter. Hare (1950, p. 129) suggests late December or early January as the time of final ice formation in this area. Accordingly, the region just west of the Belcher Islands was assumed to be open water on the average through 5 January, then ice covered.
’A shore lead, of 5 miles width in the west and 2 miles on the east coast, was assumed to exist through these months. The choice of 7 miles (5 west, plus 2 east) for the width of the lead was somewhat arbitrary, but was based on the following considerations. Observers have noted that after a period of persistent winds from a certain direction, a shore lead will develop along the off-shore coast. Donovan (1957, p. 3) says that at Churchill this lead is about 10 miles in width after southerly winds have persisted for several days, a value which Barber (1967) accepts. Such a lead’is larger than a mean value since with a steady wind rafting takes place as the lead downwind closes; also, with less wind (and hence with less ice-floe movement), the small leads freeze. For these reasons a value less than 10 miles was adopted; 7 was chosen as probably representative. Five miles were assigned to the west shore, 2 to the east, because of the prevalence of westerly over easterly winds. In reality, the shore lead is rarely present on both sides of the Bay simultaneously.
The’“shore lead” dbes not occur directly at the s h e , but some distance sea- ward. Fast ice along the shore is a permanent winter feature, regardless of wind direction. About the location of the shore lead, Lamont (1948, p. 2) reported “. . . the shore lead varies in distance from the shore from a few yards up to several miles. Its width varies from almost nil up to ten miles and more depending to a considerable extent on the wind direction.”
The location of the winter shore lead on the eastern side may vary much more than on the west. In some years at least the fast ice extends off-shore to the Ottawa and Belcher Islands (Hare 1950, pp. 120-129); Eskimos living on these islands visit the Hudson’s Bay Company posts on the mainland in winter, according to Flaherty (1918, p. 453). At these times the “shore lead” perhaps appears just west of this‘lohe ehain ‘of islands. Hare aiid Montgomery (E949;” p;’160) say, “This possibility is further strengthened by the observation of R. J. Flaherty (quoted in the Arctic Pilot) that ‘The climate of the islands differs widely from
96 HUDSON BAY ICE CONDITIONS
that of the opposite mainland. Compared with weather reports from Great Whale River for the same period . . . [the islands had] a far greater proportion of over- cast skies and fogs, stronger and more constant winds, but higher and more equable temperatures’.”
Winter observations still are insufficient to coniirm this interesting possibility, however, so the winter maps show the lead in its more traditional position close to the mainland.
A lead was assumed to exist at the mouth of James Bay. This is based on the observation of Montgomery (1950, p. 42-3) that a lead seems to persist between the Hudson Bay and James Bay packs.
Ice cover even in mid-winter in the centre of the Bay will not be exactly 100 per cent, but slightly less due to occasional small leads. In a March 1949 flight over central portions of the Bay, Merrill (1949) counted the number of leads flown across in a given time and estimated the average lead width, which allowed an estimate of ice cover over a region Merrill said was typical in appearance of conditions over the central Bay. The ice cover thus determined was 99.44 per cent. To use a value of 10/10 then seems to be quite justified.
Ice concentrations of 9/10 for Hudson Strait in Fig. 2 represent an average from several sources. Wintertime aerial data are scarce, and it was impossible to be precise in evaluating the freezing effects of the very low temperatures versus the break-up effects of the large tidal changes and strong currents. Hare and Mont- gomery (1949, p. 154) say winter coverage in Hudson Strait “usually averages at least 80-85 per cent”. A coverage of 9/10 was taken to be a reasonable value.
Foxe Channel concentrations are 10/10. The only debatable region in this area is along the east coast of Southampton Island, where small shore leads have been reported throughout the winter (U.S.H.O. 1946, p. 370).
Hudson Bay ice thickness information may be found in the annual Ice Thick- ness Data Circulars published by the Meteorological Branch, Canada Department of Transport, in Schwerdtfeger (1962), and in Kniskern and Potocsky (1965). These data suggest that, on the average, Hudson Bay ice reaches its annual maximum thickness, of about 1.5 metres (5 feet), in early April.
MAY AND JUNE ICE CONDITIONS
During May and June (Fig. 3) no significant decrease in ice concentration, from over 9/10, occurs in central or southwest Hudson Bay, but along the west, north and east coasts concentrations are down to 5-6/10 by the late June chart. James Bay ice decreases greatly in this period, with late June values near zero in the extreme south, but still 7/10 in the north central parts. All but the very southern- most parts of Foxe Channel are nearly unchanged, with coverage still over 9/10. Hudson Strait ice has decreased considerably with average amounts near 5/10 by late June.
As mentioned above, isolines of ice cover are drawn for the grid points, which are areal average conditions. If instead one concentrated all the open water into one single shore lead, by late May the shore lead would be 26 miles wide on the west coast, 29 miles on the east.

HUDSON BAY ICE CONDLTIONS 97
FIG. 3. Meanice concentration for M a y and June (tenths of coverage).
Low values of 3-4/10 appear by late June just southwest of Southampton Island, showing the importance of wind in ice distribution; for although this region has the lowest air temperatures of all the Bay at that time of year, it is among the first regions to lose its ice coyer. Due to the persistence of the north winds, ice from the north.moves southwards to-melt in the southern parts of the Bay. (The large tidal ranges and strong tidal currents undoubtedly aid in this process along Southampton Island by fracturing and loosening the ice, thus facilitating trans- port.) In Hudson Bay the local decrease with time of.the ice cover is no-indication I
of the amount of heat used locally for melting. The curious fact is that melting in southern parts of the Bay causes open water in the north, for as the southern ice softens and melts it becomes more compressible and allows more ice to be pushed down from the north. Thus there is a direct relationship between the rate of melting in the south and the rate of clearing of ice from northern waters. Wind stress and water currents, both of which generally move ice southward in western Hudson Bay, also are necessary for the process, but are not sufficient by them- selves; for no amount of north wind in the winter months can clear the northern Bay of ice.
This melting pattern, a product of the geographical and climatological setting,
98 HUDSON BAY ICE CONDITIONS
causes a distinct imbalance in the heat budget of Hudson Bay, with the southern portions forced to melt many times more ice than northern areas.
BREAK-UP EAST VS. WEST
With prevailing winds from the northwest, one would think that ice coverage would decrease faster on the western coast than in the east, but the opposite is the case. Through the entire thaw period, May to August, ice coverage decreases faster in the east than in the west. Several factors contribute to this condition: the northward-running current ..along the east coast, persistent and relatively strong especially between ManseLIsland and Quebec, certainly carries some ice out of the Bay, into Hudson Strait. Although only a small percentage of the Bay ice is likely to be removed by this current, the volume may be large enough to cause lower concentrations locally, i.e. along the east coast.
The geography of the east side of the Bay may assist in this process. The off- shore islands, from Manse1 Island in the north through the Ottawas, the Two Brothers, Farmer Island, the~sleepers and the Belchers, constitute a loose chain which has two effects. First, it acts as a partial buffer to ice from the west, so that under west winds the ice cannot jam solidly into the eastern half of the Bay. (This effect is quite apparent on the late July and early August maps.) Seqongly, during , . spring the ice beheenthe islands and the east coast develops a coastal lead with either east or west winds, the lead with east winds being along the east coast of the Bay, with west winds along the east coasts of the islands. Thus leads are forming nearly all the time during thawing, resulting in a general loosening of the pack ice in this protected body between the islands and the east shore. Early break-up of ice into smaller floes hastens both melting and export.
It seems, then, that the off-shore islands may partially isolate the eastern portions from the rest of the Bay, from the point of view. of ice break-up. The occurrence of complete fast ice cover, some years at least, and earlier break-up are typical of conditions on a smaller body of water at the same latitudes as Hudson Bay (see McFadden 1965). If one imagined the east coast of Hudson Bay to lie along the chain of islands instead of in its actual location, the ice con- centrations in these spring months would reflect a more reasonable amount of west-wind bias towards high concentrations in the east.
Freeze-up dates in the east lag behind those in the west by as much as a month. It would seem, then, that western ice would be considerably thicker than eastern ice by the end of winter (and slower to melt in spring). However, heat transport through an ice cover decreases with increasing ice thickness; ice tends to insulate itself against further growth. As a result, the difference between eastern and west- ern thicknesses diminishes as the winter advances. Thus an early freeze-up date may not in itself imply an especially thick ice cover by the arrival of. spring.
JULY ICE CONDITIONS
July (see theupper.half of Fig. 4) is the month that sees the greatest decrease in Hudson Bay ice coverage. At the beginning of the month mean concentrations

HUDSON BAY ICE CONDITIONS 99
EARLY &UGUST LATE AUGUST
FIG. 4. Mean ice concentration for July and August.
at most points are greater than 5/10; by the first of August the greatest value any- where in the Bay is 4/10, and most points are at or close to zero. The pattern established earlier is continued with lowest concentrations in the north, and east of the Ottawa-Belcher chain; higher values retreat to the central and southwest parts, and later to just the southwest areas offshore from Churchdl to the Belchers.
An interesting feature of the July maps is the trough of lower concentrations which extends southwest from Southampton Island for a distance of about 300 miles. Observational coverage in this region was rather complete, allowing con- fidence in the trough’s reality to be relatively high. The location is noteworthy, for it falls along the southwestward flowing current from near Southampton to east of Churchill. The current could cause such a trough in several ways:
1) Simply by physical transport of low concentrations, the current would dilute the concentrations;
2) Being relatively ice-free, the surface water would have a temperature above the melting point: thus the current may advect warmer water, hastening melting;
3) With less ice concentration, the albedo of the surface would be lower near the current than outside it, allowing increased solar radiation absorption; then the lowering of albedo, increased absorption, decrease of ice cover cycle has a head start on surrounding regions.
100 HUDSON BAY ICE CONDITIONS
A similar but less pronounced trough appears on the eastern side of the main July ice mass. This indentation, like the one in the northwest, lies close to a main current: in this case, the northeastward moving one, which leaves the Bay by Manse1 Island. It seems possible that export of ice is the cause of this trough. Since data coverage consists of only 6 to 7 years in these parts, the feature should be accepted only with caution.
INFLUENCE OF ICE ON CURRENTS
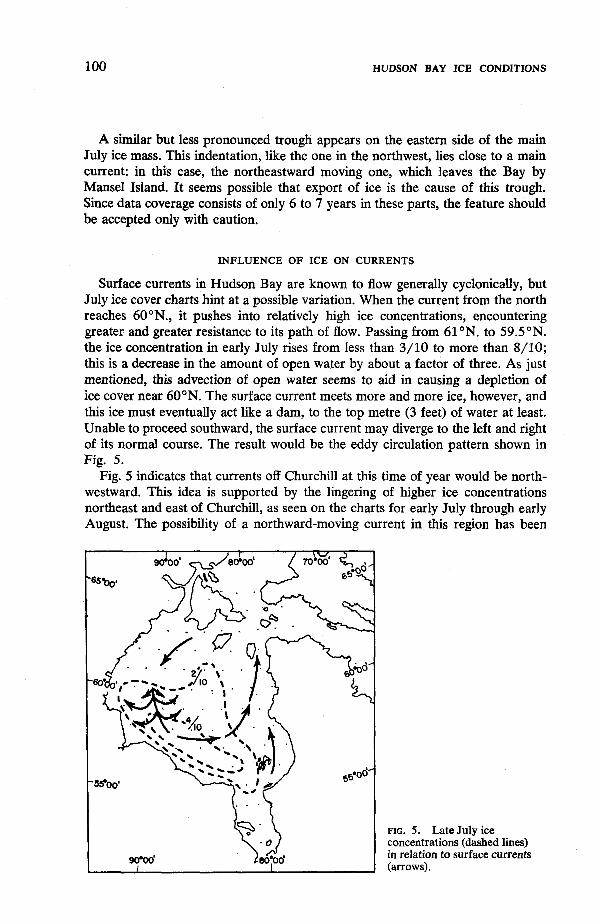
Surface currents in Hudson Bay are known to flow generally cyclonically, but July ice cover charts hint at a possible variation. When the current from the north reaches 60°N., it pushes into relatively high ice concentrations, encountering greater and greater resistance to its path of flow. Passing from 61'N. to 59.5"N. the ice concentration in early July rises from less than 3/10 to more than 8/10; this is a decrease in the amount of open water by about a factor of three. As just mentioned, this advection of open water seems to aid in causing a depletion of ice cover near 60°N. The surface current meets more and more ice, however, and this ice must eventually act like a dam, to the top metre (3 feet) of water at least. Unable to proceed southward, the surface current may diverge to the left and right of its normal course. The result would be the eddy circulation pattern shown in Fig. 5.
Fig. 5 indicates that currents off Churchill at this time of year would be north- westward. This idea is supported by the lingering of higher ice concentrations northeast and east of Churchill, as seen on the charts for early July through early August. The possibility of a northward-moving current in this region has been
FIG. 5. Late July ice concentrations (dashed lines) in relation to surface currents (arrows).
HUDSON BAY ICE CONDITIONS 101
suggested several times in the annual Ice Summaries. Markham (1962, p. 7) says: “During the summer of 1960 there was good evidence of wind-driven
water currents off Churchill which ran counter to drift-bottle findings. It has also been noted that southward drift of ice off Cape Churchill is often lower than expected which can only be explained by water movements.”
Of the 1963 season Beaton and Markham (1964, p. 5 ) remark: “It is apparent from the motion of the lingering ice east of Cape Churchill
in August that the current drift must have opposed the wind drift for the net motion in one week is negligible despite northerly winds of about 10 knots in the week 6-13 August and northwest winds of 15 knots in the interval 13-20 August. . . . This same behaviour was also noticed in 1960. . . . It is suggested on this basis that wind driven currents are often established in the Bay and that they are relatively persistent once they are established.”
Rather than being wind-induced, perhaps such northward-moving currents are simply the result of positions of the pack ice and the main current from Southamp- ton Island, and exist only during ice break-up.
. . . .
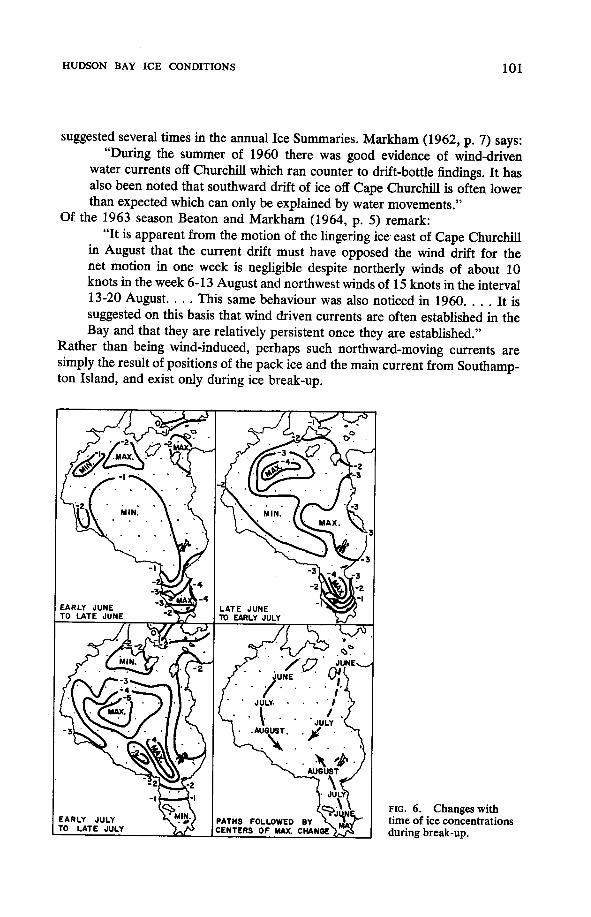
EARLY JULY FIG. 6. Changes with time of ice concentrations during break-up.

102 HUDSON BAY ICE CONDITIONS
CHANGE OF CONCENTRATION MAPS
Maps of change in ice concentration from period to period (Fig. 6) show the area of maximum ice dissipation proceeding southwestward with time along the northwest parts of the Bay (again, in the vicinity of the southwestward moving current). A second maximum of change moves northward from James Bay. (Un- like Hudson Bay, James Bay ice clears generally from the south. Because of James Bay’s much greater length than width, only wind from precisely the right direction, due north, will drive ice into the southernmost parts of James Bay. Thus the southern waters usually can clear first, and the ice boundary retreats northwards. Northernmost parts of James Bay receive ice from Hudson Bay when the wind is anywhere from west, northwest, or north, which makes final clearing there very late.) It is tempting to say that a third centre of maximum change, near Manse1 Island in mid-June, moves southward, although evidence for this is rather scanty. The lower right-hand map in Fig. 6 shows the paths followed during break-up by these maximum change centres. The fact that they all converge to the southwest parts of the Bay is evidence that melting takes place mostly on the edges of a single, large ice mass, rather than here and there in small random patterns. The paths also tell of the ice dissipation forces at work in Hudson Bay. Besides the general influence of solar heating during summer, which affects all areas, are:
1) Clearing in the northwest due to ice transport southward, driven by both water and air;
2) A hint of ice export from the northeastern areas by the northward-moving current (assisted by local geography in breaking up the ice); and
3) The summer heat source (as compared with ice cover) of southern James Bay, whose higher air and water temperatures work at melting the southeastern boundary of the ice.
AUGUST ICE CONDITIONS
By early August (Fig. 4) the only ice of significance typically lies off the south- west shore from east of Churchill to the Belchers. Concentrations there average about 3/10, even at that late date. Elsewhere in the Bay, concentrations most years are zero, although ice occasionally survives nearly the whole summer in places where wind flow, air temperature and cloudiness anomalies retard melting. Thus ice may be reported at any time of year from any part of the Bay. By early August, however, most points have seen their last ice of the season. In James Bay, all but the northernmost parts usually have lost all ice by mid-July.
The line of zero ice concentration, which appears on August and later maps, shows regions where ice never was observed over the nine years for the month in question. It does not imply, of course, that ice is always absent from these regions in that month.
THE NORTHEAST
In Hudson Strait and Foxe Channel, late summer ice is more persistent than in Hudson Bay. Figs. 4 and 7 depict the situation in this region. Along the eastern shore of Southampton Island and around Bell Peninsula, summer ice coverage

HUDSON BAY ICE CONDITIONS 103
. . . . . . . . . . . . . . . . . .
. . . . . . . . . . . . . . . . . . . . . . . . . . .
EARLY OCTOBER LATE OCTOBER
FIG. 7. Mean ice concentrations in northeast regions for September and October $tenths of coverage).
never is typically zero. Early August modal values in western Hudson Strait are zero, although small quantities sometimes linger later to the danger of shipping.
The occurrence of ice all season long near the east coast of Southampton Island is due to the discharge of Foxe Basin ice, which thaws, loosens, and begins to move south relatively late in the season. Foxe Basin and Channel usually contain some ice all year long, which often moves southward with the current along Southampton Island into Hudson Strait, except during the winter months when ice is so extensive that movement is difficult.
As the Foxe Basin ice moves south of 64"N. it may take either of two courses: continuing southwards, it sometimes proceeds towards the Atlantic along the south side of Hudson Strait; or it may round Bell peninsula-and move southward or southwestward into &.extreme northeastern pmtsd .Hudson Bay. Variations in wind direction may determine the path taken. In either case it melts steadily in the progressively warmer late summer waters.
Passage of Foxe Basin ice into Evans Strait is well substantiated (Bennett 1940, p. 113; Manning 1943, p. 228), especially under conditions of easterly wind flow in July, August, and September. During these months it usually melts before reaching Nottingham Island in the east, or Fisher Strait in the west (Hanson 1949, p. 14).
By the end of October, however, it is increasing-in volume and spreading farther south. By early November it has effectively sealed the west end of Hudson Strait. Since loose ice moves so readily in response to wind, and since the currents be- tween Coats and Manse1 Islands are light, some Foxe Basin ice undoubtedly enters Hudson Bay by this route under northeast winds. The captain of a Canadian ice patrol vessel reported on 24 September 1931 "35 miles south of Cape Pembroke,
104 HUDSON BAY ICE CONDITIONS
Coats Island. Sighted ice field extending north. This is the loose tail end of the ice field off Southampton Island.” (Canada Department of Marine 1931, p. 33).
ROES WELCOME SOUND
Roes Welcome Sound, which has a southward running current, presents another possible route for ice import to Hudson Bay. Aircraft-observed data from the Sound are not plentiful, but seem to indicate that no Foxe Basin ice is carried into Hudson Bay by this route. The Sound clears of ice at about the same time as the northwestern parts of the Bay, and remains ice-free until the October freeze- up. Ice usually persists all summer in Frozen Strait, but it cannot pass the north- ern point of Southampton Island to move south in important quantities. Some ice may enter the Sound from Repulse Bay in late summer, but it is unlikely that this ice reaches Hudson Bay proper before melting.
SEPTEMBER, OCTOBER, NOVEMBER, AND DECEMBER
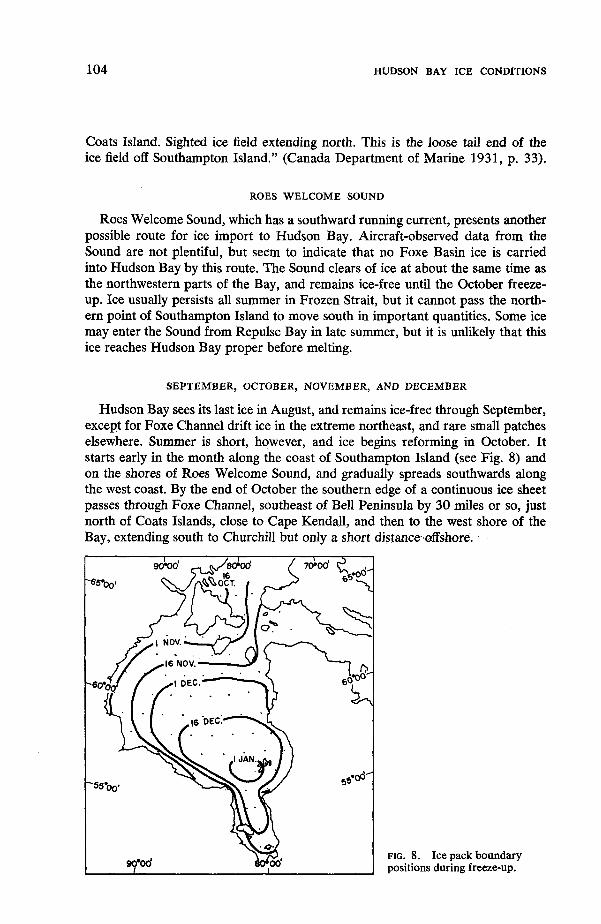
Hudson Bay sees its last ice in August, and remains ice-free through September, except for Foxe Channel drift ice in the extreme northeast, and rare small patches elsewhere. Summer is short, however, and ice begins reforming in October. It starts early in the month along the coast of Southampton Island (see Fig. 8) and on the shores of Roes Welcome Sound, and gradually spreads southwards along the west coast. By the end of October the southern edge of a continuous ice sheet passes through Foxe Channel, southeast of Bell Peninsula by 30 miles or so, just north of Coats Islands, close to Cape Kendall, and then to the west shore of the Bay, extending south to Churchill but only a short distance offshore.
FIG. 8. Ice pack boundary positions during freeze-up.
HUDSON BAY ICE CONDITIONS 105
By early November the ice extends roughly 50 miles offshore from Southamp- ton Island to Churchill, and has formed along shore from Churchill to Winisk. Coastal ice is forming locally elsewhere as well, but by far the greatest part of the Bay is open water. The pack ice continues to grow most rapidly from the north- west, although extensive shore ice rings the entire Bay by early December. Ob- servational and climatological evidence indicate that freeze-up is nearly complete by the end of December, with significant amounts of open water (apart from shore leads) only in the extreme southeast. Except for the ever-present shore leads, the surface is entirely ice covered by early January.
AREAL MEAN ICE COVERAGE
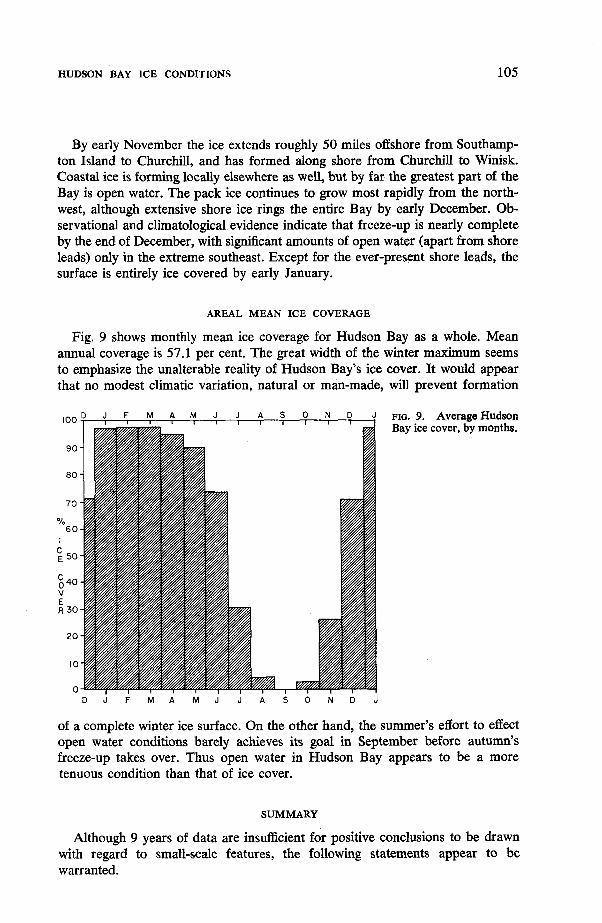
Fig. 9 shows monthly mean ice coverage for Hudson Bay as a whole. Mean annual coverage is 57.1 per cent. The great width of the winter maximum seems to emphasize the unalterable reality of Hudson Bay’s ice cover. It would appear that no modest climatic variation, natural or man-made, will prevent formation
, O O D J F M A M J J A T S O N D J FIG.
Bay 9. Average Hudson ice cover, by months.
D ~ F M A M J J A S O N D J T
of a complete winter ice surface. On the other hand, the summer’s effort to effect open water conditions barely achieves its goal in September before autumn’s freeze-up takes over. Thus open water in Hudson Bay appears to be a more tenuous condition than that of ice cover.
SUMMARY
Although 9 years of data are insufficient for positive conclusions to be drawn wid regard to small-scale features, the following statements appear to be warranted.
106 HUDSON BAY ICE CONDITIONS
1) Hudson Bay ice coverage varies annually from 0 per cent to nearly 100 per cent, with mean annual maximum ice thickness of about 1.5 metres (5 feet) occurring in April. In winter only the shore lead and isolated other leads interrupt continuous ice pack.
2) Ice break-up begins in May, appearing first in James Bay and along the western, northern and eastern shores of Hudson Bay. The local appearance of open water is controlled by wind direction and current movement as well as thawing.
3) The islands in eastern Hudson Bay may hasten break-up in that area. 4) The interaction of water movement and ice cover may create temporary
anomalous surface currents in the vicinity of the melting ice pack. 5) Most years, Hudson Bay sees its last ice in August, although small amounts
may enter from Foxe Basin during any of the warmer months. 6) Freeze-up begins along the northern shore in September and gradually ex-
tends southwards and eastwards. In the southeast, freeze-up occurs last, typically around the first of January.
A more detailed discussion of the energy fluxes associated with changes in Hudson Bay ice cover may be found in a report by Danielson (1969).
ACKNOWLEDGEMENTS
I am grateful to the National Research Council of Canada and the U.S. Veteran’s Administration for partial financial support of this work, the first-mentioned when I was a student at McGill University. Dr. Svenn Orvig made many valuable sug- gestions during all stages of the research; The library of the Arctic Institute of North America was a most important source of information.
REFERENCES
BARBER, E. G. 1967. A contribution to the oceanography of Hudson Bay. Canada Department of Energy, Mines and Raources, Marine Sciences branch, Manuscript Report Series NO. 4. 69 PP.
BEATON, A. P., and w. E. MARKHAM. 1964. Ice summary for Hudson Bay, Hudson Strait, and adjacent waters, May-October 1963. Canada: Meteorological Brunch Circular 4088. 8 pp.
BENNETT, P. M. 1940. The British-Canadian Arctic Expedition. Geographical Journal, 95: 109-20.
BURBIDGE, F. E. 1949. The modification of polar continental air over Hudson Bay. Unpub- lished Master of Science Thesis, McGill University, Montreal. 253 pp.
CANADA, DEPARTMENT OF MARINE. 1931. Navigation conditions in Hudson Bay and Strait during season of navigation. 87 pp.
DANIELSON, E. w. 1969. The surface heat budget of Hudson Bay. McGilI University, Marine Sciences Centre, Manuscript Report No. 9. 196 pp.
DONOVAN, F. P. 1957. A preliminary report of ice conditions on salt and fresh water bodies in the vicinity of Fort Churchill. Canada, Defence Research Board. Defence Research Northern Laboratory Technical Memorandum no. 1/57.3 pp.
FLAHERTY, R. J. 1918. The Belcher Islands of Hudson Bay. Geographical Review, 5: 433-58.
HANSON, w. J. 1949. Ice conditions and other factors relating to the opening and closing of navigation on the Hudson Bay route. Regina. 29 pp.
HUDSON BAY ICE CONDITIONS 107
HARE, F. K. 1950. The climate of the east Canadian Arctic and Subarctic, and its influence on accessibility. Unpublished Ph.D. Thesis, UniversitC de MontrCal. 440 pp.
HARE, F. K. and M . R. MONTGOMERY. 1949. Ice, open water, and winter climate in the eastern Arctic of North America. Arctic, 2: 79-89; 149-64.
LAMONT, A. H. 1948. Ice observation flight over Hudson Bay. Toronto: Canada Department of Transport, Meteorological Branch. 24 pp.
. 1949. Ice conditions over Hudson Bay and related weather phenomena. Amer- ican Meteorological Society Bulletin, 3 0 288-89.
MCFADDEN, J. D. 1965. The interrelationship of lake ice and climate in central Canada. University of Wisconsin, Department of Meteorology, Technical Report no. 20. 120 pp.
MANNING, T. H. 1943. The Foxe Basin coasts of Baffin Island. Geographical Journdl, 101: 228.
MARKHAM, w. E. 1962. Summer break-up patterns in the Canadian Arctic. Canada, Meteorological Service, Circular 3586. 8 pp.
MERRILL, G. c . 1949. Ice reconnaissance of Hudson Bay. Unpublished manuscript, McGill University. 4 pp.
MONTGOMERY, M. R. 1950. Ice reconnaissance flights over Hudson Bay. Arctic, 3: 40-46.
U.S. HYDROGRAPHIC OFFICE. 1946. Sailing directions for northern Canada including the coast of Labrador north of St. Lewis Sound, the northern coast of the Canadian mainland, and the Canadian archipelago. H.O. Publication, 77.759 pp.


![Atmospheric forcing of sea ice in Hudson Bay during the ...C05009 HOCHHEIM AND BARBER: ATMOSPHERIC FORCING OF SEA ICE IN HB C05009 2of20. tion [Prinsenberg, 1986]. The HB basin drains](https://img.pdfslide.net/doc/110x75/61264e88eb272c3cec406229/atmospheric-forcing-of-sea-ice-in-hudson-bay-during-the-c05009-hochheim-and.jpg)