Embed Size (px)
Citation preview
Human Capital Externalitiesand Vertical Labor Mobility in South Africa
Pierre-Carl Michaud and Désiré Vencatachellum
December 1, 2000
Abstract
A person's human capital has an external effect on the productivity of others. InSouth Africa, where apartheid led to important differences in the average human capitalof each racial group, these externalities may differ across and within races. The impactof human capital externalities on wages, and vertical labor mobility, are examined usingthe 1993 South Africa Project for Statistics on Living Standards and Development. Weestimate a wage equation which accounts for both individual and aggregate humancapital and controls for parental assets. We find that: (1) the race-specific human capitalof Blacks and Colored affects same-race wages positively, (2) Blacks’ aggregate humancapital has a positive impact on white workers' wages, (3) Whites’ human capital doesnot affect black workers' wages, and (4) Blacks and Colored have the lowest verticallabor mobility . Our estimates indicate that policies which curtailed the education ofBlacks had the unexpected effect of depressing Whites’ wages. Similarly, any negativeshock which depletes the human capital of Blacks is likely to have adverse effects on thewages of both black and white workers.
Keywords : Human capital externalities, wage determinants, parents' background, South Africa
JEL Classification : J31, H52
We would like to thank the World Bank for the data used here. Financial support was provided by the Fonds pour laFormation de Chercheurs et l'Aide à la Recherche (FCAR). Bernard Fortin, Pascal François, Pierre Thomas Léger,Germano Mwabu, Simon van Norden, and François Vaillancourt provided helpful comments. Authors’ affiliation : Institutd’economie appliquee, École des HEC, Montreal, Quebec, Canada. Corresponding author : D. Vencatachellum, Institutd’economie appliquee, École des HEC, 3000, chemin de la Cote-Sainte-Catherine, Office 4.155, Montréal (Québec)Canada H3T 2A7. Email : [email protected] Fax : (514) 340-6469. Web site : http://des.dyndns.org.
1
1. INTRODUCTION
In 1953, the Government of South Africa implemented the Bantu Act which
restricted the quality of education available to non-Whites.1 This act, as well as
apartheid, likely had persistent effects on wages and private returns to education. Knight
and McGrath (1977) document the considerable wage gap between Blacks and Whites
in apartheid South Africa, and find wage discrimination against Blacks in both the public
and private sectors. Using multivariate analysis, more recent empirical studies have
investigated similar issues with a special emphasis on the returns to education. For
instance, Moll (1998) finds positive returns to higher education in South Africa. Mwabu
and Schultz (1996) investigate how the returns to education vary across races. They
report that, among the four races in South Africa, Blacks have the highest marginal
returns to education. Mwabu and Schultz (2000) push the analysis further by
investigating the determinants of marginal returns to education in South Africa. They
estimate these returns by race, sex and age groups, finding them to be negatively
correlated with a measure of the educated cohort. Mwabu and Schultz (2000) explain
their result by an increase in the supply of skilled workers.
In addition to the effect of the size of the educated cohort on the marginal
returns to education, it is worth investigating, and this is the goal of this paper, how
changes in the proportion of an educated cohort in South Africa affect labor market
equilibrium and wages. Commenting on the returns to education, Griliches (in Krueger
and Taylor, 2000, [p.183]) notes: "The interesting question is, having expanded
education, one might have thought the average return would go down rather than go up.
It didn’t." One possible explanation for this phenomenon is that the educated generate a
positive externality on the productivity of all workers. Indeed, the external effect of
human capital is at the heart of the endogenous growth literature pioneered by Lucas
(1988).
The workings of human capital externalities are two-fold. First, interaction with
and among educated individuals can increase all workers’ productivity through a learning
effect. As mentioned by Lucas (1988) "there are group interactions that are central to
individual productivity". Someone who works, or studies, in an environment where most
1 In 1975, the government spent 15 times more per white student than per black student (Thomas, 1996). This ratiobegan to fall in the 1980’s and was about 5:1 in 1992 (Moll, 1996).

2
colleagues are well trained is more likely to obtain answers to her questions and
therefore increase her productivity.2 Second, in developing countries a larger share of
educated individuals may trigger the adoption of high-productivity technologies as firms
anticipate there will be enough skilled labor to work with these technologies. In other
words, human capital externalities are akin to a productivity effect. Therefore, an
increase in the aggregate human capital in a competitive economy where workers are
paid their marginal product induces an increase in the demand for labor. We call this
shift in the demand for labor arising from human capital externalities the "demand
effect". Note that the demand for labor is also affected by institutional considerations,
these being particularly relevant in apartheid South Africa. For example, as mentioned
by Moll (1996), in 1972, the Chamber of Mines decided, for political reasons, to reduce
the share of foreign mine workers by increasing its recruitment within South-Africa. This
policy led to an increase in the wages of unskilled labor. This paper uses data collected
in 1993, at the end of apartheid, and focuses on the economic reasons for a shift in labor
demand.
Moreover, when a larger share of the population is educated, the supply of skilled
labor increases. This is termed the "supply effect" by Mwabu and Schultz (2000),. The
net effect on wages is positive when human capital externalities are high enough for the
demand effect to dominate the supply effect. Hence, as mentioned by Behrman and
Birdsall (1988), the omission of cohort variables, such as the proportion of the educated
population, in the wage equation is likely to yield misleading estimates. This paper
departs from the empirical literature on wage determinants in South Africa by integrating
measures of aggregate human capital as explanatory variables in the wage equation.
Our primary objective is thus to estimate the direct effect of aggregate human
capital on wages. We allow wages to depend simultaneously on province-wide human
capital, sector and individual characteristics. Our specification includes both individual-
specific human capital and aggregate human capital of the four racial groups as
explanatory variables. We test whether the average education of a racial group has a
direct impact on wages. We thus answer the question whether restricting non-Whites’
education through the Bantu Act, for example, had perverse effects on Whites’ wages.
Moreover, to control respectively for labor market segmentation and a wage-earner's
social background, we also include the sector in which the worker is employed and
2 See Lucas (1988, [p. 35-39]) for a thorough discussion of the external effects of human capital.

3
parental assets as explanatory variables. Our second objective is thus to assess vertical
labor mobility across the four racial groups in South Africa.
Schultz (1988, p. 587) discusses the empirical literature which investigates the
role of family background in estimated wage specification. Just as with aggregate human
capital, omitting the parents' characteristics in a wage equation is likely to bias the
estimates. The parents' background may affect wages and employment opportunities
through a network effect. Moreover, labor market segmentation implies that factors
other than those directly related to the agent’s productivity, such as the parent’s social
network, may affect wages. As a consequence, the apartheid system in South Africa,
which segmented the labor market, may have led to such effects. If parental assets
strongly influence wages, vertical labor mobility is likely to be low.3
Our estimates indicate that a racial group’s human capital never has a negative
impact on the wages of same-race workers. Thus the supply effect never dominates the
demand effect within a race. However, the impact of inter-race human capital
externalities on wages differ by race. More specifically, we find that the average human
capital of Blacks has a positive effect on the wages white workers. As Blacks become
more educated, the productivity of white workers increases. As for Whites, their
aggregate human capital is statistically insignificant in explaining black workers’ wages.
In other words, the productivity of black workers is not affected by Whites' average
human capital. We also find that vertical labor mobility is lowest for Blacks and Colored.
The remainder of the paper is organized as follows. In section 2, we discuss the
data and wage specification. We then estimate the wage equation to assess intra- and
inter-race human capital externalities and vertical labor mobility in section 3. Conclusions
are drawn in section 4.
3 We do not test for labor market segmentation in this paper but rather include sector variables to account for itspossibility. Future research could investigate the wage premium due to labor market segmentation using the methodology of Funkhouser (1997).

4
2. DATA AND SPECIFICATION
We use the 1993 South Africa Project for Statistics on Living Standards and
Development (PSLSD). Following the definition of Statistics South Africa, we assume
that the labor force consists of those who are above 15 years old, who are not mentally
(223) or physically (139) disabled, who are not enrolled at school (4,427) or retired
(2,535). Of the 18,785 individuals who satisfy these criteria, 5,985 are wage-earners.4
Sample statistics reported in Table 1 differ considerably by racial group, a likely
consequence of apartheid. For example, fewer Blacks are wage-earners (see Sherer
(2000) for a discussion) and males are more likely to be wage-earners than females.
Following Mincer (1974) we specify a log-linear wage equation with individual, group and
sector explanatory variables.5 A thorough discussion of these variables for South Africa
is provided in Mwabu and Schultz (1998). In this section, we pay particular attention to
education, household characteristics, human capital externalities and sector variables.
Physical characteristics Table 2 reports average wages across races and regions.
The average monthly wage in our sample is 1,051 rands. Blacks are at the lower end of
the wage distribution with 626 rands per month, while Whites are at the upper end with
2,706 rands per month. Furthermore, Indians receive slightly less than half of the
average White’s wage (1,250 rands per month) while Colored are not significantly better
off than Blacks (785 rands per month). It is particularly striking that a black worker with
some post-secondary education earns 51 rands which is less than a white employee
with no primary education (55 rands). An examination conducted across regions and
gender (Table 2) reveals that, for all races, women receive lower wages than men and
wages in the urban sector are significantly higher than those in the rural sector. In a
4 The PSLSD is a joint project of the World Bank and the Southern African Labor and Development Research Unit. Moll(1998) provides a description of the survey in which 43,974 people were interviewed in 1993. The employment rate,which can be computed from Table 1, varies with the definition of the labor force. We use the same definition of the laborforce as Statistics South Africa, except that we also include women who report housework as their main occupation.While the sample size of wage earners is the same as in Schultz and Mwabu (2000), these authors restrict their attentionto those who have actively looked for a job during the week preceding the survey or who were working during that week tocalculate the unemployment rate. These definitional issues do not affect our results because we estimate the wageequation on the sample of wage earners. This sample does not depend on the definition of the labor force.
5 See also Becker (1975) and Griliches (1977) for the wage specification.
5
nutshell, black females living in rural regions receive the lowest wages, while white
males in urban areas receive the highest wages.
Wage-earners' human capital The specific human capital of workers can be
measured by their experience and education. We define a worker’s potential experience
as his or her age minus five years and the number of years of schooling. As for
education, we use Moll’s (1996, 1998) spline construction.6 Letting x denote the number
of years of schooling, we define the following three education variables :
primary = min [ x, 7 ] , (1)
secondary = min [ max [ x – 7, 0 ] , 5 ] , (2)
post-secondary = max [ x – 12, 0 ]. (3)
Primary education reaches its ceiling at seven years, the time needed to complete this
education cycle in South Africa. Those who do not complete primary school have from 0
to a maximum of six years of primary education and 0 years of secondary and post-
secondary education. The same reasoning applies for the construction of the secondary
and post-secondary variables. Among wage-earners, 31 percent have not completed
primary school, 28 percent completed the secondary education cycle, and 11 percent
have some post-secondary education (Table 3). These figures hide a large variation
across races (Table 3). More than 40 percent of Blacks have less than seven years of
schooling and only 16 percent have at least a secondary school certificate. Indians fare
nearly as well as Whites at the primary school level, with more than 90 percent of Indian
and white wage earners holding a primary school certificate. However, while 72 percent
of Whites have twelve years of schooling, this is true for only 53 percent of Indians.
Aggregate human capital In addition to individual-specific human capital, a wage-
earner may benefit from the aggregate human capital in the economy. For reasons
discussed in the introduction, human capital yields a positive externality on wages. For
instance, Berhrman and Birdsall (1988) find that in Brazil such cohort variables affect
wages. However, in South Africa, racial segregation may have acted as a barrier to such
human capital externalities across the different races. We use the average number of
6 Moll (1998) provides a description of the South Africa education system. This author also notes that the spline variablesassume constant marginal returns to one additional year of schooling within each cycle. Future research could test thisassumption as there may be a wage premium for graduating.

6
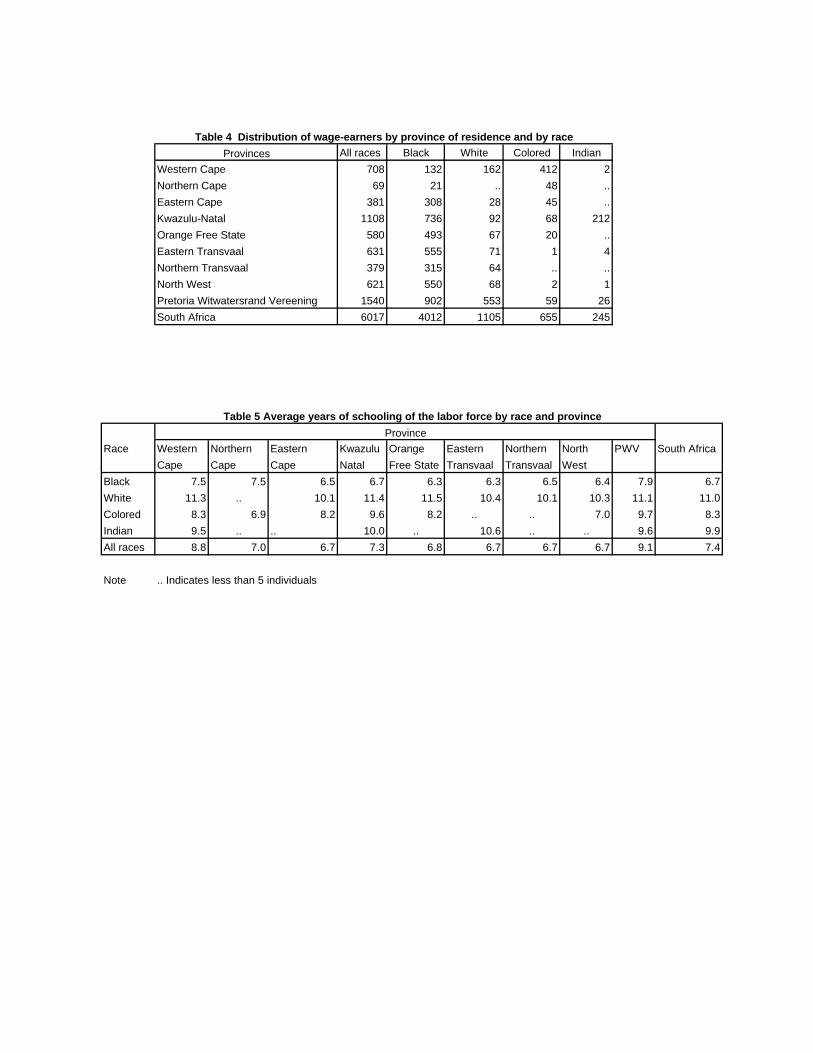
years of schooling of the labor force, for a given race in a given province, as a proxy for
race-specific human capital. The average number of years of schooling for the entire
labor force is 7.4 years; Blacks have 6.7 years, and Whites 11.0 years (see Table 5).
Indians and Colored fare better than Blacks but slightly worse than Whites.
These racial differences are compounded by geographical ones (Table 5). The
Pretoria Witwatersrand Verreniging province enjoys the highest average human capital.
The North West, Northern and Eastern Transvaal provinces have the least. These
differences across regions and races, as well as the fact that apartheid prevented the
different races from fully socializing with each other, may have led to asymmetric human
capital externalities. We thus allow the impact of human capital externalities on wages to
differ by using, as explanatory variables, black, white and colored province-specific
average human capital in our wage equation. We say that human capital externalities
are constrained by racial segregation if these externalities differ across races. Note that
we do not include Indians' average human capital as an explanatory variable because
most Indians (87 percent) reside in Kwazulu-Natal (Table 4).
Household’s assets Apart from economy-wide variables, an individual’s wage
opportunities may be affected by her family’s wealth. For instance, the number of years
spent at school does not take into account the quality of education. Private schooling of
higher quality may provide its graduates with a wage premium. In such cases, wealthier
parents may wish to purchase private education in order to obtain such a premium for
their children. To examine the link between wealth and wages, we proxy wealth by the
sum of TV sets, radios and telephones owned by the household. Other wealth measures
do not provide enough variance or are unreported for too many individuals in order to be
considered.7 Our wealth measure, as expected, indicates that Whites are significantly
richer than other races, while Blacks are the least wealthy. According to this measure,
the average white household is three times richer than its black counterpart (Table 1).
In addition to wealth, the household heads' education may also affect their
offspring’s labor market opportunities through a network effect. Parents who have
completed secondary school may socialize with one another, creating a network of
relatively educated individuals which in turn may allow their children to have get to better
7 For instance, a very small percentage of wage-earners report owning their place of residence.
7
jobs. As reported in Table 1, the average white household head is twice as educated as
the black one, with Indians and Colored falling in between.8
Sectors During apartheid, non-Whites could neither occupy certain positions nor
move freely in the country. Although these legal constraints no longer exist, occupational
differences still persist as reported in Table 1. The share of professionals is highest
among white workers (30 percent) and lowest among black workers (15 percent); 1 in 3
Blacks work in the primary sector while a bit less than 1 in 2 Indians work in the
manufacturing sector. Moll (1993) finds that industry dummies are statistically significant
in explaining earnings in South Africa. In our analysis, we condition wages on the
workers' sector of employment since sample size considerations prevent us from using
industry dummies as explanatory variables.9 Geographical differences are also likely to
have an influence on wages. Most black workers reside in rural regions, while more than
90 percent of each of the three other races reside in urban areas (Table 1).
We next specify a Mincerian wage function with the explanatory variables
discussed above, and where the dependent variable is the logarithm of hourly wages.
The average of the dependent variable for each race is reported at the bottom of Table
6. However, individuals who participate in the labor market may either report positive
wages, in which case they are wage-earners, or report no wages. As shown by
Heckman (1979), estimating the wage equation without accounting for sample selection
may lead to biased estimates. The likelihood that a person who participates in the labor
market is a wage-earner is assumed to depend on three groups of explanatory variables:
first, human capital, as measured by a person's age (rather than by experience for
identification purposes) and education; second household characteristics by wealth and
number of children below 15; third gender and race. We first test for possible sample
selection bias arising from a wage-earner's status by estimating the wage equation using
Heckman’s two-step selection correction procedure. We then compare those estimates
with the ordinary least square (OLS) estimates and justify the use of the latter to test our
main hypotheses .
8 We acknowledge that the parents’ education may affect their children’s education and, consequently, wages, throughhome education. In this case, both the household head's and the children's education are correlated. The inclusion ofboth the worker’s and the parent’s education in the wage equation may lead to a decrease in the precision of theestimates due to collinearity. When most parameter estimates in the wage equation are significant, as reported in Table 6and discussed in section 3, this is not a concern.
9 Moll (1993) uses census data, and his sample consists of 37,944 Africans and 46,638 Whites. Evidence that theindustry in which one works is a determinant of wages is also provided in Smit (1999).
8
3. RESULTS
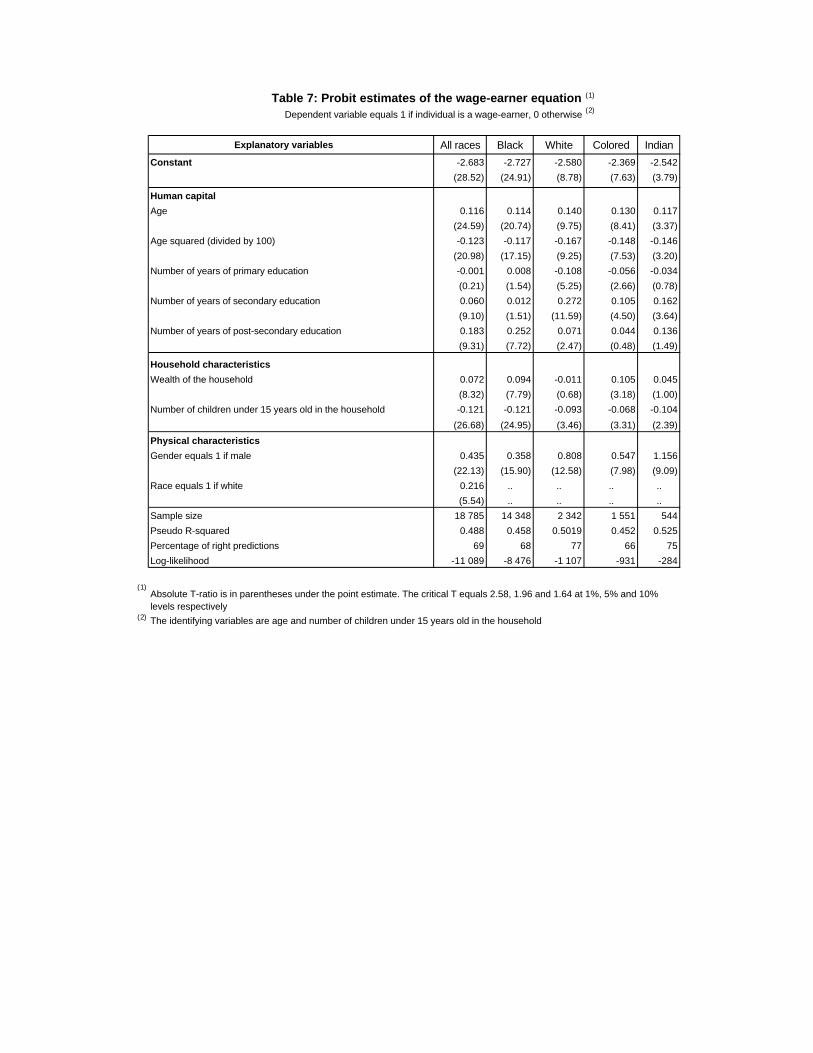
The probit estimates of the wage-earner status reported in Table 7 indicate that
the specification fits the data well, with a pseudo R-square greater than 0.45 for any
racial sub-sample. The specification also correctly predicts the wage-earner status more
than two out of three times. Both identifying variables, age and the number of children
below 15, are always jointly statistically significant which implies that the selection model
is robust. When the determinants of the wage-earner status are investigated using the
entire labor force, we find that, ceteris paribus, the likelihood of being a wage-earner is
highest for white males. Estimating the wage-earner probit equation separately for each
race reveals that Colored and Whites with only primary education have a lower
likelihood of being wage-earners than Blacks or Indians with similar characteristics. This
result may arise because only low-ability Whites and Colored dropout of primary school.
We will come back to this point when discussing the estimates of the returns to
education below. Finally, the number of children below 15 in a household has a negative
incidence on the likelihood of being a wage earner and reflects child rearing constraints.
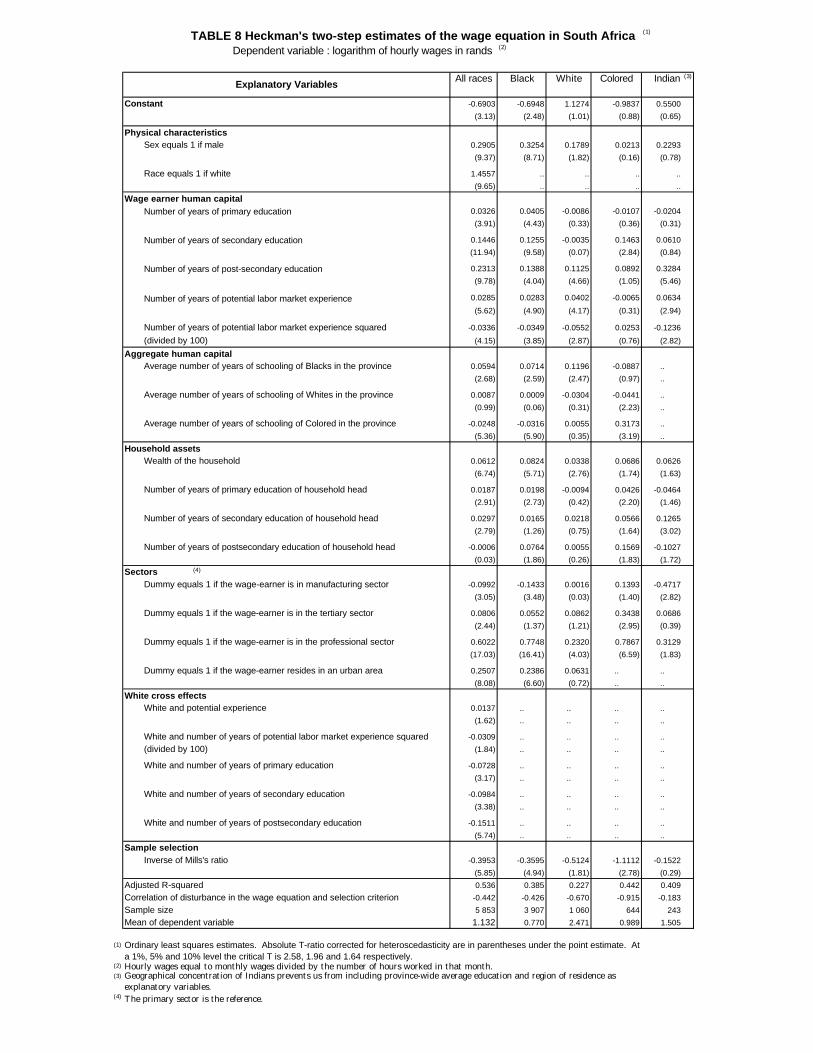
The Heckman estimates of the wage equation in Table 8 indicate that the inverse
of Mills’ ratio (IMR) is statistically significant and negative for Blacks and Colored at the 1
percent level, significant for Whites at the 5 percent level, and insignificant for Indians.
The negative correlation between the disturbance in the wage equation and the selection
criterion means that individuals who have unexplained higher wage opportunities are
less likely to be wage-earners. This result arises because agents with higher
(unexplained) wage opportunities also have higher reservation wages. The fact that the
inverse of Mill's ratio is statistically significant for Blacks is consistent with Mwabu and
Schultz (2000), who find that sample selection matters for African men. However, in our
model, sample selection has strong statistical significance for Colored and weak
significance for Whites. This may be due to our definition of the labor force (see section
2 and footnote 3) and the specification of the wage-earner status equation. However, the
fact that both identifying variables are jointly statistically significant, contrary to Mwabu
and Schultz (2000), and the high goodness of fit measures, lends support to our
estimates.
9
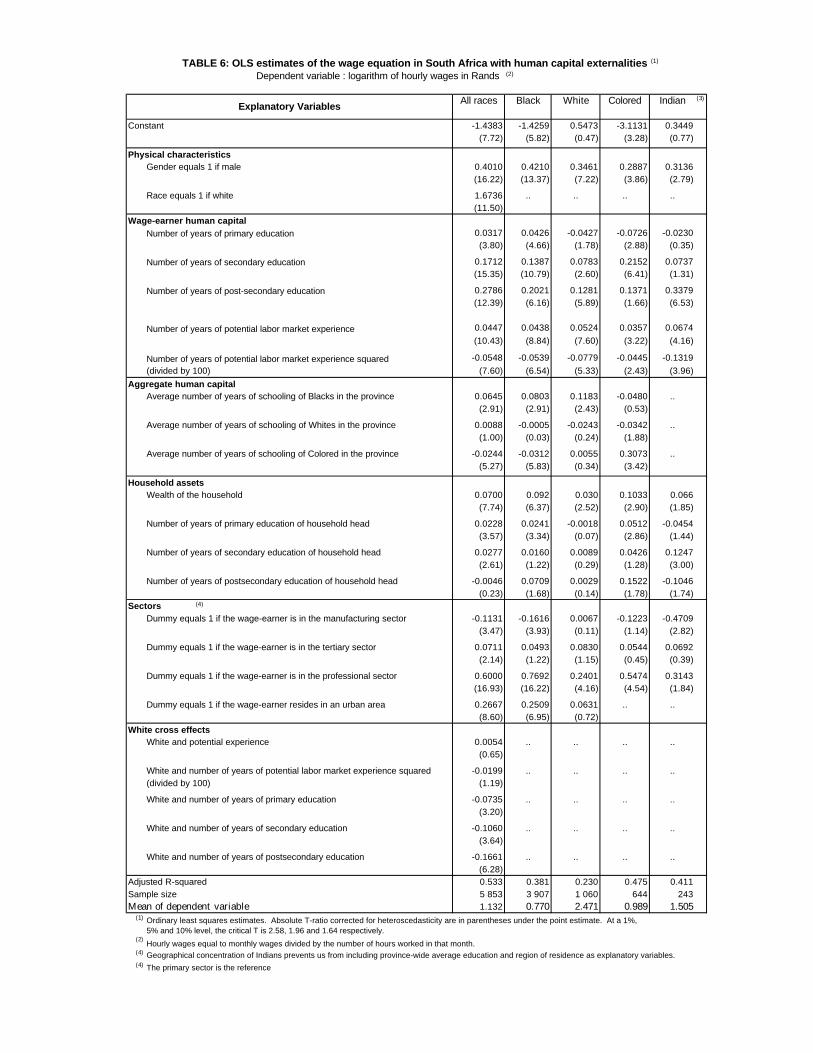
Turning to the OLS estimates of the wage equation for the entire sample and
each racial group, in Table 6, we find the estimates have the same sign as and are close
to those in Table 8. One exception is the potential number of years of experience which
is statistically insignificant for Colored wage-earners in Heckman’s sample selection
correction procedure but is statistically significant in the probit estimate of the wage-
earner status. This would indicate that experience matters for Colored in obtaining
employment, though their wage profile is independent of experience. Given that sample
selection does not substantially bias the OLS estimates, and that the statistical effects of
the two groups of variables in question, namely aggregate human capital and household
assets, are nearly identical in both estimation methods, we focus on the sample of wage-
earners (Table 6) as in Mwabu and Schultz (2000).
The model fits the data well with an adjusted R-square of 0.53 when estimated
over all races, and the coefficients are consistent with the theory. Both gender and race
are statistically significant at 1 percent and have the strongest impact on wages. The
high wage premium for white workers reflects the well documented racial wage
discrimination in South Africa (see, for example, Knight and McGrath (1977)). Similarly,
when controlling for other factors, a worker in the urban sector earns a higher wage than
his rural counterpart. Marginal returns to education increase with the education level for
the entire sample. The negative estimated returns to primary education for Colored
confirm Moll’s (1996) findings.10 In addition, our results indicate that the same result
holds for Whites. These negative returns may be a consequence of type-signaling
whereby only low-ability Colored and Whites quit school during or at the end of the
primary cycle. To the extent that black workers are the only ones with statistically
positive returns to primary education, this implies that, among Blacks, low-ability
students are not the only ones to drop out of primary school. This result reflects the
additional constraints faced by Blacks in acquiring education. Furthermore, white cross
effects are negative and significant for the three education cycles. Hence, ceteris
paribus, Whites enjoy lower marginal returns from one additional year of schooling than
the other races.
The previous estimates of the wage equation are not different from those in the
empirical literature on the determinants of wages in South Africa. Our contribution to the
literature resides in the fact that province-wide human capital and measures of

10
household assets are statistically significant in the wage equation for some races as
discussed hereafter.
3.1 Intra-race Human Capital Externalities
We begin by considering how the race-specific average human capital affects
same-race workers’ wages. Specifically, as to the effects of providing education to more
Blacks, our estimates indicate that the average human capital of the black population
has a positive impact on black workers' wages. Moreover, Blacks’ average human
capital has a higher impact on a black worker’s wages than one year of primary
education acquired by a black worker. Although the returns to primary education are the
lowest of the three education cycles, black workers with low education hence benefit
proportionately more from intra-race human capital externalities. Colored workers benefit
the most from an increase in their own racial group human capital, presumably because
they are geographically concentrated such that human capital spillovers are more easily
absorbed through interaction with each other. As for Whites, they are the only racial
group for whom wages are independent of intra-race human capital externalities, which
indicates that the labor demand and supply effects compensate each other. This result
arises because the average human capital of Whites is already high, and therefore the
marginal benefits of increasing such human capital is rather low.
No racial group's average human capital has a negative effect on the wages of
same-race workers. In other words, if labor markets are (imperfectly) segmented along
race lines, the supply effect on each labor market never dominates the demand effect.
For instance, an increase in the supply of skilled Blacks is accompanied by a high
enough increase in the demand for black workers such that the demand effect exceeds
the supply effect, and black workers’ wages increase. Consequently, increasing the
proportion of educated people in the black population has two effects on the returns to
education. First, appealing to Mwabu and Schultz’s (2000) results, i.e. a fall in the
marginal returns to education as more people are educated, the new returns to
education function is flatter. Second, our estimates indicate that the returns to education
function shifts upwards such that for a given level of education, a black worker’s wages
increase. Our result finds support in Griliches’s statement as well as the aforementioned
10 Moll (1996) uses earnings as the dependent variable and his data spans three years, namely 1980, 1985 and 1990.
11
endogenous growth literature. In this respect, South Africa is no different from other
countries.
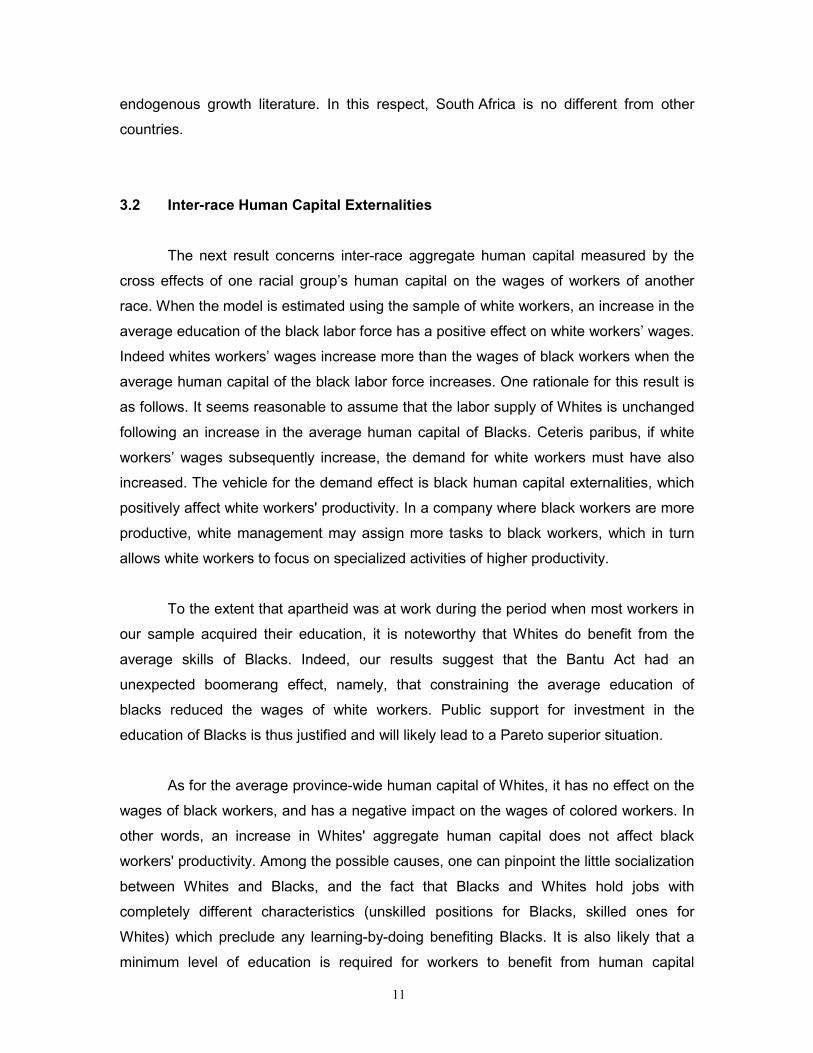
3.2 Inter-race Human Capital Externalities
The next result concerns inter-race aggregate human capital measured by the
cross effects of one racial group’s human capital on the wages of workers of another
race. When the model is estimated using the sample of white workers, an increase in the
average education of the black labor force has a positive effect on white workers’ wages.
Indeed whites workers’ wages increase more than the wages of black workers when the
average human capital of the black labor force increases. One rationale for this result is
as follows. It seems reasonable to assume that the labor supply of Whites is unchanged
following an increase in the average human capital of Blacks. Ceteris paribus, if white
workers’ wages subsequently increase, the demand for white workers must have also
increased. The vehicle for the demand effect is black human capital externalities, which
positively affect white workers' productivity. In a company where black workers are more
productive, white management may assign more tasks to black workers, which in turn
allows white workers to focus on specialized activities of higher productivity.
To the extent that apartheid was at work during the period when most workers in
our sample acquired their education, it is noteworthy that Whites do benefit from the
average skills of Blacks. Indeed, our results suggest that the Bantu Act had an
unexpected boomerang effect, namely, that constraining the average education of
blacks reduced the wages of white workers. Public support for investment in the
education of Blacks is thus justified and will likely lead to a Pareto superior situation.
As for the average province-wide human capital of Whites, it has no effect on the
wages of black workers, and has a negative impact on the wages of colored workers. In
other words, an increase in Whites' aggregate human capital does not affect black
workers' productivity. Among the possible causes, one can pinpoint the little socialization
between Whites and Blacks, and the fact that Blacks and Whites hold jobs with
completely different characteristics (unskilled positions for Blacks, skilled ones for
Whites) which preclude any learning-by-doing benefiting Blacks. It is also likely that a
minimum level of education is required for workers to benefit from human capital

12
externalities. For example, reading skills are a prerequisite for an unskilled worker to
learn how to operate a computer from a skilled worker. Hence, the low level of education
of black workers acts as an invisible barrier preventing them from absorbing these
externalities. In addition, the black labor supply is unchanged. Hence a change in the
aggregate human capital of white workers does not affect the wages of black workers.
However, this does not apply to Colored whose wages vary inversely with
Whites’ aggregate human capital. As the number of qualified Whites increases, ceteris
paribus, the demand for colored workers, and therefore their wages, fall. Moll (1992)
reports that, under apartheid, Colored were subject to some, but not all, of the job
reservations that applied to Blacks. Indeed, according to Moll, from 1960 to 1980, the
percentage of colored managers increased and discrimination against Colored fell. Our
estimates can be interpreted in light of this evidence. When there is a shortage of white
skilled workers (low average human capital among Whites), employers hire colored
workers but revert to white workers when this constraint is relaxed.
3.3 Vertical Labor Mobility
Next, the degree of vertical labor market mobility is reflected in the effects of the
household wealth and the education of the household head on wages. Wealth has a
significant and positive effect on a person’s wage for all four races. This effect is
strongest among Blacks and Colored, and smallest among Whites. The other measure
of vertical mobility, the household head’s education, is significant and positive when the
model is estimated over the entire sample. We explore this result a bit further by
investigating whether it is robust across all four races. Interestingly, the number of years
of education of the household head for Whites is never significant. As for Blacks and
Colored, the number of years of primary and post-secondary education of the household
head has a positive impact on wages. Our estimates show that when we control for
other factors which affect wages, a white worker is less likely to face constrained wage
opportunities than for a black or a colored worker when all of them are from a poor
background and with less educated parents.
Hence, the estimates of the statistical effects of the parents’ wealth and
household head’s education on wages indicate that vertical mobility is lowest among
13
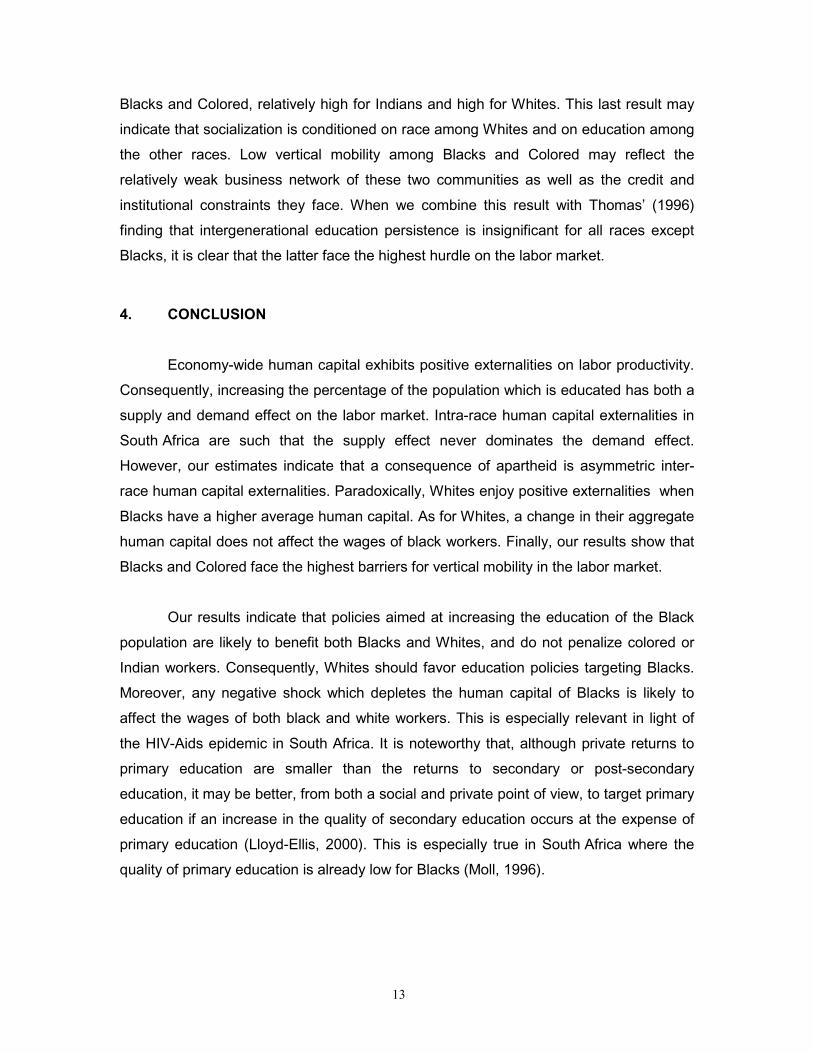
Blacks and Colored, relatively high for Indians and high for Whites. This last result may
indicate that socialization is conditioned on race among Whites and on education among
the other races. Low vertical mobility among Blacks and Colored may reflect the
relatively weak business network of these two communities as well as the credit and
institutional constraints they face. When we combine this result with Thomas’ (1996)
finding that intergenerational education persistence is insignificant for all races except
Blacks, it is clear that the latter face the highest hurdle on the labor market.
4. CONCLUSION
Economy-wide human capital exhibits positive externalities on labor productivity.
Consequently, increasing the percentage of the population which is educated has both a
supply and demand effect on the labor market. Intra-race human capital externalities in
South Africa are such that the supply effect never dominates the demand effect.
However, our estimates indicate that a consequence of apartheid is asymmetric inter-
race human capital externalities. Paradoxically, Whites enjoy positive externalities when
Blacks have a higher average human capital. As for Whites, a change in their aggregate
human capital does not affect the wages of black workers. Finally, our results show that
Blacks and Colored face the highest barriers for vertical mobility in the labor market.
Our results indicate that policies aimed at increasing the education of the Black
population are likely to benefit both Blacks and Whites, and do not penalize colored or
Indian workers. Consequently, Whites should favor education policies targeting Blacks.
Moreover, any negative shock which depletes the human capital of Blacks is likely to
affect the wages of both black and white workers. This is especially relevant in light of
the HIV-Aids epidemic in South Africa. It is noteworthy that, although private returns to
primary education are smaller than the returns to secondary or post-secondary
education, it may be better, from both a social and private point of view, to target primary
education if an increase in the quality of secondary education occurs at the expense of
primary education (Lloyd-Ellis, 2000). This is especially true in South Africa where the
quality of primary education is already low for Blacks (Moll, 1996).

14
5. REFERENCES
Becker, G. S. (1975) "Human Capital : a Theoretical and Empirical Analysis withSpecial Reference to Education", National Bureau of Economic Research, 2nd edition,New York.
Behrman, J. R., and N. Birdsall (1988) "The Reward for Good Timing : Cohort Effectsand Earnings Functions for Brazilian Males", The Review of Economics and Statistics,LXX(1), 129-135.
Funkhouser, E. (1997) "Mobility and Labor Market Segmentation : The Urban LaborMarket in El Salvador", Economic Development and Cultural Change, 18(1), 121-153.
Griliches, Z. (1977) "Estimating Returns to Schooling : some Econometric Problems",Econometrica, 45, 1-22.
Heckman, J. (1979) "Sample Selection Bias as a Specification Error", Econometrica, 47,153-161.
Knight, J. B., and M. D. McGrath (1977) "An Analysis of Racial Wage Discrimination inSouth Africa", Oxford Bulletin of Economics and Statistics, 39, 245-271.
Krueger, A. and T. Taylor (2000) "An Interview with Zvi Griliches", Journal of EconomicPerspectives, 14(2), 171-189.
Lloyd-Ellis, H. (2000) "Public Education, Occupational Choice, and the Growth-Inequality Relationship", International Economic Review, 41(1), 171-199.
Lucas, R. (1988) "On the Mechanics of Economic Development", Journal of MonetaryEconomics, 22, 3-42.
Mincer, J. (1974) "Schooling, Experience and Earnings", National Bureau of EconomicResearch, Columbia University Press, New York.
Moll, P. G. (1992) "The Decline of Discrimination against Colored People in South Africa,1970 to 1980", Journal of Development Economics, 37, 289-307.
Moll, P. G. (1993) "Industry Wage Differentials and Efficiency Wages. A Dissenting Viewwith South Africa Evidence", Journal of Development Economics, 41, 213-246.
Moll, P. G. (1996) "The Collapse of Primary Schooling Returns in South Africa 1960-90",Oxford Bulletin of Economics and Statistics, 58(1), 185-208.
Moll, P. G. (1998) "Primary Schooling, Cognitive Skills and Wages in South Africa",Economica, 65, 263-284.
Mwabu, G. and T. P. Schultz (1996) "Education Returns Across Quantiles of the WageFunction : Alternative Explanations for Returns to Education in South Africa", AmericanEconomic Review, 86(2), 335-339.
15
Mwabu, G. and T. P. Schultz (1998). "Wage Premia for Education and Location ofSouth African Workers, by Gender and Race", Center Discussion Paper no. 785, YaleUniversity, Economic Growth Center, New Haven, Connecticut.
Mwabu, G. and T. P. Schultz (2000) "Wage Premiums for Education and Location ofSouth African Workers, by Gender and Race", Economic Development and CulturalChange, 48(2), 307-334.
Scherer, G. (2000) "Intergroup Economic Inequality in South Africa : The Post-ApartheidEra", American Economic Review, 90(2), 317-321.
Schultz, T. P. (1988) "Education Investment and Returns" in Handbook of DevelopmentEconomics, Volume 1 (Chapter 13), Edited by H.Chenery and T. N. Srinivasan, ElsevierScience Publishers B.V.`
Smit, Minette R. (1999) "Concentration, Labour Quality and Wages in the South AfricaManufacturing Sector", South African Journal of Economics, 67(2), 289-319.
Thomas, D. (1996) "Education Across Generations in South Africa", AmericanEconomic Review, 86(2), 330-334.

All races Black White Colored Indian
Labor force (1) 18 785 14 348 2 342 1 551 544
Number of wage-earners 6 022 4 015 1 105 657 245
Percentage of males among wage-earners 59% 61% 55% 56% 61%
Average age, in years, of wage-earners 37 38 36 35 35
Percentage of wage-earners who live in the urban sector 62% 47% 93% 90% 98%
Percentage of wage-earners who work in the following sector
Primary 28% 33% 19% 22% 7%
Manufacturing 23% 20% 23% 31% 44%
Tertiaty 23% 26% 14% 20% 17%
Professional 19% 15% 30% 18% 22%
Military 2% 2% 3% 2% 3%
Wealth of the household (2) 1.73 1.32 3.94 1.87 2.59
Average education of the household head in years 7.5 6.0 12.0 8.2 10.2(1) See section 2 for a definition of the labor force(2) Wealh of the household equals to the sum of TV sets, radios and telephones
Gender Sectors All races Black White Colored Indian
Male Urban 1 543 769 3 396 920 1 387
Rural 667 605 2 867 319 2 033
Urban and rural 1 185 677 3 359 856 1 400
Female Urban 1 017 594 1 908 757 1 012
Rural 538 498 1 678 139 ..
Urban and rural 854 547 1 892 695 1 017
Male and female Urban 1 316 694 2 735 847 1 240
Rural 620 567 2 325 242 1 900
Urban and rural 1 051 626 2 706 785 1 250
Percentage with less than the following number of years of schooling All races Black White Colored Indian
7 years 31 41 9 22 6
12 years 72 84 28 81 47
13 years (no post-secondary education) 89 94 65 95 86
Table 2 Monthly wage in rands
Table 3 Distribution of wage-earners's education by race
Table 1 Sample Statisitcs for Wage-earners
All races Black White Colored Indian
Western Cape 708 132 162 412 2
Northern Cape 69 21 .. 48 ..
Eastern Cape 381 308 28 45 ..
Kwazulu-Natal 1108 736 92 68 212
Orange Free State 580 493 67 20 ..
Eastern Transvaal 631 555 71 1 4
Northern Transvaal 379 315 64 .. ..
North West 621 550 68 2 1
Pretoria Witwatersrand Vereening 1540 902 553 59 26
South Africa 6017 4012 1105 655 245
Race Western Northern Eastern Kwazulu Orange Eastern Northern North PWV South Africa
Cape Cape Cape Natal Free State Transvaal Transvaal West
Black 7.5 7.5 6.5 6.7 6.3 6.3 6.5 6.4 7.9 6.7
White 11.3 .. 10.1 11.4 11.5 10.4 10.1 10.3 11.1 11.0
Colored 8.3 6.9 8.2 9.6 8.2 .. .. 7.0 9.7 8.3
Indian 9.5 .. .. 10.0 .. 10.6 .. .. 9.6 9.9
All races 8.8 7.0 6.7 7.3 6.8 6.7 6.7 6.7 9.1 7.4
Note .. Indicates less than 5 individuals
Table 4 Distribution of wage-earners by province of residence and by race
Provinces
Table 5 Average years of schooling of the labor force by race and province
Province
(1)
(2)
All races Black White Colored Indian (3)
Constant -1.4383 -1.4259 0.5473 -3.1131 0.3449(7.72) (5.82) (0.47) (3.28) (0.77)
Gender equals 1 if male 0.4010 0.4210 0.3461 0.2887 0.3136(16.22) (13.37) (7.22) (3.86) (2.79)
Race equals 1 if white 1.6736 .. .. .. ..(11.50)
0.0317 0.0426 -0.0427 -0.0726 -0.0230(3.80) (4.66) (1.78) (2.88) (0.35)
0.1712 0.1387 0.0783 0.2152 0.0737(15.35) (10.79) (2.60) (6.41) (1.31)
0.2786 0.2021 0.1281 0.1371 0.3379(12.39) (6.16) (5.89) (1.66) (6.53)
0.0447 0.0438 0.0524 0.0357 0.0674(10.43) (8.84) (7.60) (3.22) (4.16)
-0.0548 -0.0539 -0.0779 -0.0445 -0.1319(divided by 100) (7.60) (6.54) (5.33) (2.43) (3.96)
Average number of years of schooling of Blacks in the province 0.0645 0.0803 0.1183 -0.0480 ..(2.91) (2.91) (2.43) (0.53)
Average number of years of schooling of Whites in the province 0.0088 -0.0005 -0.0243 -0.0342 ..(1.00) (0.03) (0.24) (1.88)
Average number of years of schooling of Colored in the province -0.0244 -0.0312 0.0055 0.3073 ..(5.27) (5.83) (0.34) (3.42)
Wealth of the household 0.0700 0.092 0.030 0.1033 0.066(7.74) (6.37) (2.52) (2.90) (1.85)
Number of years of primary education of household head 0.0228 0.0241 -0.0018 0.0512 -0.0454(3.57) (3.34) (0.07) (2.86) (1.44)
Number of years of secondary education of household head 0.0277 0.0160 0.0089 0.0426 0.1247(2.61) (1.22) (0.29) (1.28) (3.00)
Number of years of postsecondary education of household head -0.0046 0.0709 0.0029 0.1522 -0.1046(0.23) (1.68) (0.14) (1.78) (1.74)
Sectors (4)
Dummy equals 1 if the wage-earner is in the manufacturing sector -0.1131 -0.1616 0.0067 -0.1223 -0.4709(3.47) (3.93) (0.11) (1.14) (2.82)
Dummy equals 1 if the wage-earner is in the tertiary sector 0.0711 0.0493 0.0830 0.0544 0.0692(2.14) (1.22) (1.15) (0.45) (0.39)
Dummy equals 1 if the wage-earner is in the professional sector 0.6000 0.7692 0.2401 0.5474 0.3143(16.93) (16.22) (4.16) (4.54) (1.84)
Dummy equals 1 if the wage-earner resides in an urban area 0.2667 0.2509 0.0631 .. ..(8.60) (6.95) (0.72)
White and potential experience 0.0054 .. .. .. ..(0.65)
White and number of years of potential labor market experience squared -0.0199 .. .. .. ..(divided by 100) (1.19)
White and number of years of primary education -0.0735 .. .. .. ..(3.20)
White and number of years of secondary education -0.1060 .. .. .. ..(3.64)
White and number of years of postsecondary education -0.1661 .. .. .. ..(6.28)
Adjusted R-squared 0.533 0.381 0.230 0.475 0.411Sample size 5 853 3 907 1 060 644 243Mean of dependent variable 1.132 0.770 2.471 0.989 1.505
(1)
(2)
(4) Geographical concentration of Indians prevents us from including province-wide average education and region of residence as explanatory variables.(4) The primary sector is the reference
Physical characteristics
Number of years of primary education
Number of years of secondary education
Aggregate human capital
Household assets
Hourly wages equal to monthly wages divided by the number of hours worked in that month.
TABLE 6: OLS estimates of the wage equation in South Africa with human capital externalitiesDependent variable : logarithm of hourly wages in Rands
Wage-earner human capital
Ordinary least squares estimates. Absolute T-ratio corrected for heteroscedasticity are in parentheses under the point estimate. At a 1%, 5% and 10% level, the critical T is 2.58, 1.96 and 1.64 respectively.
Explanatory Variables
Number of years of post-secondary education
Number of years of potential labor market experience
Number of years of potential labor market experience squared
White cross effects
(1)
(2)
Explanatory variables All races Black White Colored Indian
Constant -2.683 -2.727 -2.580 -2.369 -2.542
(28.52) (24.91) (8.78) (7.63) (3.79)
Human capital
Age 0.116 0.114 0.140 0.130 0.117
(24.59) (20.74) (9.75) (8.41) (3.37)
Age squared (divided by 100) -0.123 -0.117 -0.167 -0.148 -0.146
(20.98) (17.15) (9.25) (7.53) (3.20)
Number of years of primary education -0.001 0.008 -0.108 -0.056 -0.034
(0.21) (1.54) (5.25) (2.66) (0.78)
Number of years of secondary education 0.060 0.012 0.272 0.105 0.162
(9.10) (1.51) (11.59) (4.50) (3.64)
Number of years of post-secondary education 0.183 0.252 0.071 0.044 0.136
(9.31) (7.72) (2.47) (0.48) (1.49)
Household characteristics
Wealth of the household 0.072 0.094 -0.011 0.105 0.045
(8.32) (7.79) (0.68) (3.18) (1.00)
Number of children under 15 years old in the household -0.121 -0.121 -0.093 -0.068 -0.104
(26.68) (24.95) (3.46) (3.31) (2.39)
Physical characteristics
Gender equals 1 if male 0.435 0.358 0.808 0.547 1.156
(22.13) (15.90) (12.58) (7.98) (9.09)
Race equals 1 if white 0.216 .. .. .. ..
(5.54) .. .. .. ..
Sample size 18 785 14 348 2 342 1 551 544
Pseudo R-squared 0.488 0.458 0.5019 0.452 0.525
Percentage of right predictions 69 68 77 66 75
Log-likelihood -11 089 -8 476 -1 107 -931 -284
(1)
(2) The identifying variables are age and number of children under 15 years old in the household
Absolute T-ratio is in parentheses under the point estimate. The critical T equals 2.58, 1.96 and 1.64 at 1%, 5% and 10% levels respectively
Table 7: Probit estimates of the wage-earner equationDependent variable equals 1 if individual is a wage-earner, 0 otherwise
(1)
(2)
All races Black White Colored Indian (3)
Constant -0.6903 -0.6948 1.1274 -0.9837 0.5500
(3.13) (2.48) (1.01) (0.88) (0.65)
Sex equals 1 if male 0.2905 0.3254 0.1789 0.0213 0.2293
(9.37) (8.71) (1.82) (0.16) (0.78)
Race equals 1 if white 1.4557 .. .. .. ..
(9.65) .. .. .. ..
0.0326 0.0405 -0.0086 -0.0107 -0.0204
(3.91) (4.43) (0.33) (0.36) (0.31)
0.1446 0.1255 -0.0035 0.1463 0.0610
(11.94) (9.58) (0.07) (2.84) (0.84)
0.2313 0.1388 0.1125 0.0892 0.3284
(9.78) (4.04) (4.66) (1.05) (5.46)
0.0285 0.0283 0.0402 -0.0065 0.0634
(5.62) (4.90) (4.17) (0.31) (2.94)
Number of years of potential labor market experience squared -0.0336 -0.0349 -0.0552 0.0253 -0.1236
(divided by 100) (4.15) (3.85) (2.87) (0.76) (2.82)
Average number of years of schooling of Blacks in the province 0.0594 0.0714 0.1196 -0.0887 ..
(2.68) (2.59) (2.47) (0.97) ..
Average number of years of schooling of Whites in the province 0.0087 0.0009 -0.0304 -0.0441 ..
(0.99) (0.06) (0.31) (2.23) ..
Average number of years of schooling of Colored in the province -0.0248 -0.0316 0.0055 0.3173 ..
(5.36) (5.90) (0.35) (3.19) ..
Wealth of the household 0.0612 0.0824 0.0338 0.0686 0.0626
(6.74) (5.71) (2.76) (1.74) (1.63)
Number of years of primary education of household head 0.0187 0.0198 -0.0094 0.0426 -0.0464
(2.91) (2.73) (0.42) (2.20) (1.46)
Number of years of secondary education of household head 0.0297 0.0165 0.0218 0.0566 0.1265
(2.79) (1.26) (0.75) (1.64) (3.02)
Number of years of postsecondary education of household head -0.0006 0.0764 0.0055 0.1569 -0.1027
(0.03) (1.86) (0.26) (1.83) (1.72)
Sectors (4)
Dummy equals 1 if the wage-earner is in manufacturing sector -0.0992 -0.1433 0.0016 0.1393 -0.4717
(3.05) (3.48) (0.03) (1.40) (2.82)
Dummy equals 1 if the wage-earner is in the tertiary sector 0.0806 0.0552 0.0862 0.3438 0.0686
(2.44) (1.37) (1.21) (2.95) (0.39)
Dummy equals 1 if the wage-earner is in the professional sector 0.6022 0.7748 0.2320 0.7867 0.3129
(17.03) (16.41) (4.03) (6.59) (1.83)
Dummy equals 1 if the wage-earner resides in an urban area 0.2507 0.2386 0.0631 .. ..
(8.08) (6.60) (0.72) .. ..
White and potential experience 0.0137 .. .. .. ..
(1.62) .. .. .. ..
White and number of years of potential labor market experience squared -0.0309 .. .. .. ..
(divided by 100) (1.84) .. .. .. ..
White and number of years of primary education -0.0728 .. .. .. ..
(3.17) .. .. .. ..
White and number of years of secondary education -0.0984 .. .. .. ..
(3.38) .. .. .. ..
White and number of years of postsecondary education -0.1511 .. .. .. ..
(5.74) .. .. .. ..
Sample selectionInverse of Mills's ratio -0.3953 -0.3595 -0.5124 -1.1112 -0.1522
(5.85) (4.94) (1.81) (2.78) (0.29)
Adjusted R-squared 0.536 0.385 0.227 0.442 0.409
Correlation of disturbance in the wage equation and selection criterion -0.442 -0.426 -0.670 -0.915 -0.183
Sample size 5 853 3 907 1 060 644 243
Mean of dependent variable 1.132 0.770 2.471 0.989 1.505
(1)
(2)
(3)
(4) The primary sector is the reference.
Physical characteristics
Number of years of primary education
Number of years of secondary education
TABLE 8 Heckman's two-step estimates of the wage equation in South Africa
Hourly wages equal to monthly wages divided by the number of hours worked in that month.
Number of years of post-secondary education
Number of years of potential labor market experience
White cross effects
Wage earner human capital
Dependent variable : logarithm of hourly wages in rands
Explanatory Variables
Geographical concentration of Indians prevents us from including province-wide average education and region of residence as explanatory variables.
Ordinary least squares estimates. Absolute T-ratio corrected for heteroscedasticity are in parentheses under the point estimate. At a 1%, 5% and 10% level the critical T is 2.58, 1.96 and 1.64 respectively.
Aggregate human capital
Household assets