Embed Size (px)
Citation preview

Human Capital Formation and the Linkage between Trade and
Poverty: The Cases of Costa Rica and Nicaragua�
Luis Rivera and Hugo Rojas-Romagosa
December 2009
Abstract
We combine di¤erent analytical instruments to assess the impact of human capital and trade
policies on macroeconomic aggregates and poverty, and how both sets of policies complement each
other in Costa Rica and Nicaragua. We use a top-down approach �i.e. a dynamic CGE model and
microsimulations� to assess the e¤ects of two FTAs: DR-CAFTA and EU-CAAA on production
and poverty. Moreover, we use a human capital satellite model to evaluate the impact of human
capital formation. Combining the satellite model with the CGE model and the microsimulations, we
construct a rich analytical framework to assess the direct e¤ect of each set of policies on poverty and
how these policies complement each other. We �nd that human capital policies have a signi�cant
and permanent e¤ect on growth and this is associated with poverty reductions. On the other hand,
the static e¢ ciency changes associated with trade liberalization have positive but small growth and
poverty e¤ects.
�This study is developed with support from the ECLAC-AECID �Poverty, Trade Policy and Complementary Policies�project. Project team members (M. LaFleur and J.Durán) and workshop participants in Santiago (Chile) and San José(Costa Rica) contributed with valuable comments and suggestions on earlier versions of this document. The authors areresponsible for any errors or omissions. Contact information: Hugo Rojas-Romagosa ([email protected]), LuisRivera ([email protected]).
1

Contents
1 Introduction 3
2 Initial economic conditions in Costa Rica and Nicaragua 62.1 Trade and development in Costa Rica and Nicaragua . . . . . . . . . . . . . . . . . . . . 6
2.2 Trade policy in Central America . . . . . . . . . . . . . . . . . . . . . . . . . . . . . . . 9
2.3 Human capital, trade and growth . . . . . . . . . . . . . . . . . . . . . . . . . . . . . . . 11
2.4 Education quality in Nicaragua and Costa Rica . . . . . . . . . . . . . . . . . . . . . . . 13
2.5 Early childhood development policies in Nicaragua and Costa Rica . . . . . . . . . . . . 17
3 Analytical instruments and methodology 193.1 Trade and poverty evaluation using a top-down approach . . . . . . . . . . . . . . . . . 19
3.1.1 Dynamic CGE model . . . . . . . . . . . . . . . . . . . . . . . . . . . . . . . . . 19
3.1.2 Dynamic calibration . . . . . . . . . . . . . . . . . . . . . . . . . . . . . . . . . . 20
3.1.3 Microsimulations using household-level data . . . . . . . . . . . . . . . . . . . . . 22
3.1.4 Poverty measurement . . . . . . . . . . . . . . . . . . . . . . . . . . . . . . . . . 24
3.2 Assessing the impact of human capital policies . . . . . . . . . . . . . . . . . . . . . . . 25
3.2.1 Human capital satellite model . . . . . . . . . . . . . . . . . . . . . . . . . . . . . 26
3.2.2 Linkage variables . . . . . . . . . . . . . . . . . . . . . . . . . . . . . . . . . . . . 34
3.2.3 Human capital policy simulations . . . . . . . . . . . . . . . . . . . . . . . . . . . 35
4 Economic and poverty impact of trade and human capital policies in Costa Rica andNicaragua 434.1 Preliminary trade conditions and FTA negotiations . . . . . . . . . . . . . . . . . . . . . 43
4.1.1 DR-CAFTA negotiation . . . . . . . . . . . . . . . . . . . . . . . . . . . . . . . . 44
4.1.2 EU-CAAA negotiation . . . . . . . . . . . . . . . . . . . . . . . . . . . . . . . . . 45
4.2 Macroeconomic e¤ects of the trade scenarios . . . . . . . . . . . . . . . . . . . . . . . . . 45
4.2.1 Baseline case . . . . . . . . . . . . . . . . . . . . . . . . . . . . . . . . . . . . . . 46
4.2.2 ATC-protocol scenario . . . . . . . . . . . . . . . . . . . . . . . . . . . . . . . . . 47
4.2.3 DR-CAFTA Scenario . . . . . . . . . . . . . . . . . . . . . . . . . . . . . . . . . 50
4.2.4 EU-CAAA Scenario . . . . . . . . . . . . . . . . . . . . . . . . . . . . . . . . . . 51
4.2.5 Final remarks on the CGE simulations of trade policies . . . . . . . . . . . . . . 55
4.3 Poverty e¤ects of the trade scenarios . . . . . . . . . . . . . . . . . . . . . . . . . . . . . 55
4.4 Macroeconomic e¤ects of human capital policies . . . . . . . . . . . . . . . . . . . . . . . 61
4.5 Poverty e¤ects of human capital policies . . . . . . . . . . . . . . . . . . . . . . . . . . . 63
4.6 Integrated approach: Complementary e¤ects of trade and human capital policies . . . . 68
5 Conclusions and policy recommendations 74
References 77
6 Appendix 84
2

1 Introduction
Costa Rica and Nicaragua have engaged in important trade negotiations in the past 15 years. After
negotiating several Free Trade Agreements (FTAs) with minor commercial partners (e.g. Mexico,
Canada, Chile), Nicaragua rati�ed a FTA with the United States (US) in 2006 and Costa Rica in 2008
(DR-CAFTA). Moreover, both countries together with El Salvador, Guatemala and Honduras started
negotiations with the European Union on an EU-Central America Association Agreement (EU-CAAA)
in 2007. Combined, the US and EU represent the highest share of trade �ows for both countries and
thus, both FTAs are expected to have a signi�cant economic impacts. In addition to trade reforms, both
countries have been actively attracting Foreign Direct Investment (FDI) and pursuing competitiveness
reforms to strengthen their integration with global markets. The main challenge of these policy e¤orts
is to foster economic growth, improve living standards and reduce poverty.
Central America is characterized by widespread poverty and high levels of income inequality. Al-
though Costa Rica has lower poverty levels, in the last two decades these have remained almost unaltered
while income distribution has worsened. In the case of Nicaragua, poverty rates are among the highest
in Latin America, while income distribution is highly unequal (Francois et al., 2008). Thus, it is im-
portant to estimate the poverty e¤ects of trade policy in both Central American countries. The main
feature of FTAs is the change in relative prices of �nal goods and factors, associated with the reduction
or elimination of tari¤s and other trade barriers. It has been widely acknowledged that trade reform is
in aggregate bene�cial for households (the country�s aggregate welfare). Notwithstanding, it is also as-
serted that particular groups can be negatively a¤ected by increased trade openness. The �nal outcome
of an FTA depends on the general equilibrium adjustments and resource reallocations resulting from
relative price changes. As well as the dynamic e¤ects created by FDI in�ows, increased productivity
and innovation derived from higher exposure to international markets and ideas.
Human capital formation has long been regarded as an important source of economic growth (Lucas,
1988; Barro and Sala-i-Martin, 1995). In their recent survey, Hanushek and Woessman (2008) �nd that
there are strong empirical links between human capital formation and economic growth, particularly
when the quality of education is accounted for. Thus, it is expected that educational policies that
increase the quantity and quality of schooling can foster growth in both Central American countries. In
turn, higher growth rates have a large potential to reduce poverty rates. Moreover, a labor force with
higher human capital can act as a positive complementary e¤ect to enhance the bene�ts of the recent
trade liberalization process in Costa Rica and Nicaragua.
The main objective of this study is to estimate the impact of trade and human capital formation
on poverty, and assess the complementarities between both sets of policies. To achieve this goal we use
several methodologies. First, we build a dynamic Computable General Equilibrium (CGE) model and
use it to analyze the macroeconomic e¤ects of two FTAs (DR-CAFTA and EU-CAAA). Secondly, using
a �top-down�approach, we assess the microeconomic e¤ects on households when the macro policies are
implemented. Finally, we implement a human capital satellite model and use it to assess the e¤ects of
human capital policies on labor e¢ ciency and labor supply by di¤erent skill types. We then interlink
the satellite model with the CGE model to interact trade and human capital policies at the macro level.
The combination of these methodologies enables use to conduct a rich analysis of each policy (education
and trade), their interactions and complementarities.
3

With respect to the macro component, this paper builds on previous studies that estimated the
macroeconomic e¤ects of both FTAs. In Francois et al. (2008) the economic implications of DR-CAFTA
were assessed, while Rivera and Rojas-Romagosa (2007) studied the e¤ects associated with di¤erent
prospective scenarios for EU-CAAA.
The �top-down�methodology takes a two-step approach where changes in factors and �nal goods
prices and quantities are �rst estimated through a Computable General Equilibrium (CGE) model
and then mapped into the welfare function of each household using detailed household income and
expenditure data.1 With this methodology we can assess the poverty e¤ects of both DR-CAFTA and
the forthcoming EU-CAAA on two Central American countries: Costa Rica and Nicaragua.
Recent household surveys for Costa Rica and Nicaragua provide detailed micro information on the
income sources and expenditures of a representative sample of households.2 When this micro data is
adequately organized, we can map changes in �nal goods and factor prices to the real income of each
household. Using this real income information and the existing poverty line estimations published by
national statistics agencies, we can estimate the changes in headcount poverty ratios, the poverty gap
and the Foster-Greer-Thorbecke index for each country:
To address the issue of human capital formation a satellite model is constructed following a revised
version of the model by Jacobs (2005). In this model, improvements in school attainment are linked to
changes in labor e¢ ciency and labor supplies of di¤erent skill groups. The revised version includes the
use of qualitative measures of schooling �by means of test scores�to assess the impact of educational
policies. This allows us to incorporate into the model the latest �ndings by Hanushek and Woessman
(2008), who show the importance of cognitive skills (i.e. the quality dimension of schooling) to assess
the impact of human capital on growth and productivity.
Given the relative abundance of low-skill labor in both countries, it is expected that better export
market access to the US and the EU increases the production and trade in low-skill intensive activities.
The expansion of these sectors will increase the demand for low-skill workers and this is re�ected in
higher wages and better employment opportunities. Since the region is also characterized by a large
informal sector which consists mainly of low-skill workers, a larger labor demand related to higher trade
volumes can also facilitate the inclusion of these low-skill workers into the formal sector.3 Moreover,
human capital investments in both countries are far behind international standards. This situation
constrains the possibilities to create skill improvements that can take advantage of higher value added
productive activities linked to international trade and foreign direct investment.
Our CGE results show that Costa Rica and Nicaragua can expect production and consumption
increases from DR-CAFTA. These bene�ts are also present after the implementation of an Association
Agreement with the European Union, although at a lower level. The CGE framework, however, only
simulates static e¢ ciency changes as a result of lower trade barriers. Thus, the positive changes from
1This methodology is now a standard feature of trade and poverty analysis. See for instance Cogneau and Robilliard(2000); Bourguignon and da Silva (2003); Löfgren et al. (2003); Winters et al. (2004).
2More precisely, the most recent expenditure and income surveys will be used for this study. These surveys are morecomprehensive and capture more information than the (annual) household surveys.
3For instance, Sauma and Sánchez (2003) indicate that in the case of Costa Rica, trade liberalization helped to createmore �formal� jobs and thus reduce poverty rates. Evidence suggests an inverse relationship between formal work andpoverty in Costa Rica.
4

the trade policies we report can be regarded as a lower-bound for the potential bene�ts of the trade
agreements. If dynamic e¢ ciency gains are considered, then the bene�ts can be higher.4
The main driver of economic growth in the analysis is provided by the upgrading of human capital
through educational policies. The results from the satellite model show that these policies create
signi�cant dynamic e¢ ciency gains. For instance, the baseline growth rate is increased by around 0:6%
in Costa Rica and 1% in Nicaragua when we link the labor supply and e¢ ciency changes from the
satellite model into the CGE model. Thus, both Costa Rica and Nicaragua experience higher growth
and welfare e¤ects when labor e¢ ciency improves through human capital policies. However, there are
signi�cant short-term costs associated with the educational policies. In a �rst stage, the supply of low
and high-skill workers is reduced (since students stay longer in school) but later on the human capital
accumulation process starts and labor e¢ ciency and wages begin to grow steadily over time. This
process yields signi�cant medium and long-term returns from education.
As a consequence of the di¤erent growth patterns produced by both policies, poverty impacts of
FTAs are positive, but small. Human capital policies, on the other hand, yield stronger poverty reduc-
tions. Therefore, the poverty reduction we observe in our integrated scenario �where both trade and
educational policies interact� is a direct outcome of human capital improvements in both countries.
Our microsimulation results using the household surveys show that the most important income source
for poor families in both countries is low-skill wages. Therefore, much of the poverty reduction after
the implementation of education policies derives from the signi�cant growth in low-skill wages. Finally,
poverty and other macroeconomic variables do present positive but relatively small complementarity
e¤ects when both trade and educational policies are jointly implemented.
4Francois et al. (2008) and Rivera and Rojas-Romagosa (2007) estimate some of these dynamic e¢ ciency gains.
5
2 Initial economic conditions in Costa Rica and Nicaragua
In this section we review the initial economic and social conditions in both countries. We start with
an overview of the main macroeconomic and social indicators, continue with the latest trade policies
implemented in recent years, and �nish with an outlook of the human capital characteristics and policies
for both countries.
2.1 Trade and development in Costa Rica and Nicaragua
One of the most meaningful changes experienced by Costa Rica, Nicaragua, and Central America in
general during the last two decades has been the consolidation of market liberalization policies and
trade openness. The countries have been deliberate in opening their economies, establishing measures
to accelerate it through unilateral import tari¤ cuts, policies to attract Foreign Direct Investment (FDI),
and the implementation of Free Trade Agreements (FTAs).
For instance, trade-weighted average tari¤s in both countries have been steadily declining since the
1980s (Figure 1). During the last decade, in particular, trade policy in Costa Rica and Nicaragua has
been based on FTAs. Currently, both countries have signed FTAs with Canada, Mexico, Chile, the
Dominican Republic, United Sates and some Caribbean countries. In addition, investment agreements
have been rati�ed with an important group of countries, European as well as Latin American.
Figure 1: Central America, e¤ective average nominal tari¤ rates1=, 1990-2005
Notes: 1/ Defined as the ratio of collected import duties to total importsSource: World Development Indicators
0,0%
2,0%
4,0%
6,0%
8,0%
10,0%
12,0%
14,0%
1990 1991 1992 1993 1994 1995 1996 1997 1998 1999 2000 2001 2002 2003 2004 2005
Costa Rica
El Salvador
Guatemala
Nicaragua
Table 1 presents economic growth indicators. The average growth rate for Central America during
the present decade has been 3,9%, while Costa Rica and Nicaragua grew at 4.6% and 3.4% respectively.
GDP per capital reached US$6,581 in Costa Rica and US$1,167 in Nicaragua in year 2008, after an
average growth rate of 2,7% and 2.0% for the period 2000-2008, respectively.
Table 2 shows the productive structure of Costa Rica and Nicaragua. It points to a very signi�cant
role for the service sector in Costa Rica, with a relatively high agricultural participation in Nicaragua.
The volume of trade with respect to GDP is high in both countries, which highlights the importance
6

Table 1: GDP IndicatorsGDP GDP GDP per Cápita Per Cápita
(US$ million) Growth (Current US$) Growth2008 20002008 2008 20002008
Costa Rica 29,834.4 4.7% 6,581.4 2.7%Nicaragua 6,627.3 3.4% 1,168.9 2.0%Central America 112,114.9 4.0% 3,005.6 1.9%
Source: CEPAL (2009), Consejo Monetario Centroamericano
of external demand for both economies. Costa Rica has a signi�cant share of its industrial exports
classi�ed as high-technology products.
Table 2: Productive structure
Agriculture Industry Services Merchandisetrade Hightech exports
(% of GDP) (% of GDP) (% of GDP) (% of GDP) (% manufact.exports)
Costa Rica 8.4 28.8 62.8 86.7 36.8Nicaragua 19.5 31.1 56.1 66.0 6.1
Source: World Development Indicators, The World Bank
Costa Rica experienced an important structural change in its productive and trade sectors since
the middle of the 90s, driven by FDI growth (Monge-González et al., 2009). The country has a trade
structure with a higher level of technological sophistication. Exports and imports of industrial goods
represent the highest share of trade, particularly medium and high technology intensive goods. On the
other hand, Nicaragua�s exports depend mainly on primary and natural resource based goods, while
its imports are less technology intensive. The trade structure of the country has not changed, with the
exception of other products like mining, that have increased their participation (Table 3).
Table 3: Trade structure by industry and technology classi�cation, 1995 and 2007/2008
1995 2008 1995 2008 1995 2007 1995 2007Primary Goods 58.3% 23.9% 10.7% 9.9% 64.0% 62.6% 23.9% 19.1%
Industrial Goods 36.4% 75.5% 87.4% 89.5% 34.0% 31.8% 75.2% 79.8%Based on Natural Resources 15.6% 16.3% 23.6% 22.7% 14.2% 23.4% 19.4% 25.1%Low Technology 10.8% 14.1% 16.1% 14.9% 12.0% 2.8% 13.2% 15.7%Medium Technology 7.1% 17.6% 36.3% 29.7% 2.9% 4.8% 30.5% 25.0%High Technology 2.9% 27.6% 11.6% 22.2% 4.8% 0.8% 12.1% 14.1%
Others 5.3% 0.6% 1.9% 0.6% 2.0% 5.6% 0.9% 1.1%
Total 100.0% 100.0% 100.0% 100.0% 100.0% 100.0% 100.0% 100.0%
Source: Ow n elaboration w ith data from CEPAL (2009)
ImportsNicaragua
Exports ImportsCosta Rica
Exports
The United States and the European Union are the most important trade partners of Costa Rica.
Table 4 shows which goods are the main source of trade between Costa Rica an these regions. Industrial
7

goods exports are the largest to the US market, with a higher share of products classi�ed as di¤users
of technical progress.5 These same industrial goods account for around 60% of Costa Rican exports to
other markets. On the other hand, primary agricultural goods represent almost 60% of external sales
to the European Union, and around 30% of exports to the USA. Industrial imports from all trading
partners are signi�cant, whereas more technology advanced goods are imported from the EU and other
markets. The United States is the main import source of traditional industrial goods and products with
economies of scale
Table 4: Costa Rica: Trade by main partners and product categories, 2008
US$ 000 % of total US$ 000 % of total US$ 000 % of totalExports
Agriculture 1,077,692 29.1 952,022 56.1 190,449 4.4Mining 395 0.0 0 0.0 6,277 0.1Energy 644 0.0 0 0.0 0 0.0Traditional industrial goods 821,495 22.2 199,800 11.8 1,413,642 32.7With economies of scale 300,827 8.1 72,785 4.3 754,290 17.4Durable goods 13,788 0.4 5,056 0.3 76,921 1.8Diffusers of technical progress 1,492,051 40.2 465,762 27.5 1,886,965 43.6Others 860 0.0 1,109 0.1 644 0.0Total 3,707,752 100.0 1,696,534 100.0 4,329,188 100.0
ImportsAgriculture 496,321 8.5 18,428 1.1 221,521 2.9Mining 10,771 0.2 588 0.0 42,387 0.5Energy 4,841 0.1 537 0.0 580,562 7.5Traditional industrial goods 904,850 15.5 209,822 12.2 1,613,189 20.9With economies of scale 1,648,528 28.3 453,130 26.4 2,791,887 36.1Durable goods 233,624 4.0 79,302 4.6 816,891 10.6Diffusers of technical progress 2,440,826 41.8 942,437 55.0 1,607,620 20.8Others 92,974 1.6 9,823 0.6 54,859 0.7Total 5,832,735 100.0 1,714,067 100.0 7,728,916 100.0
Source: CEPAL (2009)
United States European Union Others
Nicaragua�s trade with the US and the EU is more balanced in terms of industrial and primary goods
(Table 5). Exports to other markets (specially to the Central American region) are more concentrated
on primary goods. As indicated before, the trade structure of Nicaragua is composed of low technology
intensity goods, especially in terms of its exports. More advanced goods are imported from the EU and
other regions.
It is important to highlight that Costa Rica and Nicaragua have distinct economic and social char-
acteristics, as shown by their di¤erent production and trade patterns. Costa Rica has a medium-income
GDP per capita level, and a more dynamic and diversi�ed economy. This di¤erence can be better under-
stood by observing the education and human development indicators. As shown in Table 6, Nicaragua
has low literacy rates, education expenditures, and lower enrollment rates. Costa Rica shows better
performance indicators. This di¤erentiation introduces comparative issues that would help understand
from two di¤erent perspectives the role played by trade on growth and poverty.
The Central America region has low-income country characteristics, while poverty rates are relatively
lower for Costa Rica, and signi�cantly high for Nicaragua. In addition, poverty rates are higher for
people without a formal occupation. Even when unemployment is around 5% in both countries and5This is mainly related to the operations of Intel Corporation in Costa Rica beginning in the late 1990s.
8

Table 5: Nicaragua: Trade by main partners and product categories, 2007
US$ % of total US$ % of total US$ % of totalExports
Agriculture 59,313 34.0 171,111 53.1 165,735 81.4Mining 3,119 1.8 0 0.0 8 0.0Energy 0 0.0 0 0.0 0 0.0Traditional industrial goods 82,922 47.5 131,073 40.7 31,472 15.5With economies of scale 17,881 10.2 16,742 5.2 5,490 2.7Durable goods 692 0.4 135 0.0 147 0.1Diffusers of technical progress 10,314 5.9 2,899 0.9 699 0.3Others 287 0.2 195 0.1 106 0.1Total 174,529 100.0 322,155 100.0 203,655 100.0
ImportsAgriculture 20,054 1.6 75,008 12.0 6,735 0.8Mining 1,598 0.1 528 0.1 74 0.0Energy 353,419 27.7 3,108 0.5 29,620 3.5Traditional industrial goods 304,541 23.9 121,478 19.4 166,966 19.9With economies of scale 354,308 27.8 173,734 27.8 217,199 25.9Durable goods 56,851 4.5 28,038 4.5 166,499 19.8Diffusers of technical progress 184,962 14.5 187,279 30.0 247,358 29.4Others 235 0.0 35,571 5.7 5,498 0.7Total 1,275,968 100.0 624,744 100.0 839,949 100.0
Source: CEPAL (2009)
United States European Union Others
Table 6: Education and human development
HDI Rank*Adult LiteracyRate (% aged15 and above)
Net PrimaryEnrollmentRate (%)
Net SecondaryEnrollmentRate (%)
PublicExpenditure inEducation (%
of GDP)
Researchers inR&D (per
million people)
2008 2008 2005 2005 2005 2005
Costa Rica 50 95.8 99.7 67.6 4.9 533Nicaragua 120 80.1 84.1 43.0 3.1 73
* Human Development Index among 176 countriesSource: Human Development Report, UNDP and World Development Indicators, The World Bank
expected to increase between 0,6% and 0,7% in year 2009 (ECLAC, 2009), there are relatively high
under-employment conditions tied to a signi�cant informal sector economy, particularly in Nicaragua
(Table 7).
These characteristics imply that with this low human capital pro�le �together with the absence of
major natural resource endowments�low-skill labor is a relatively abundant factor in Nicaragua, and
less in Costa Rica. The subsequent high sub-utilization rates of labor imply that workers could be drawn
to the formal sector with the improved labor opportunities expected from DR-CAFTA and EU-CAAA.
2.2 Trade policy in Central America
Both DR-CAFTA and EU-CAAA are steps forward in the global integration process of Costa Rica and
Nicaragua. The agreements will not only consolidate trade and investments with the US and EU, but
9

Table 7: Poverty and labor conditions
Povertyheadcount
Povertyheadcount*
Poverty nonemployed
Worker SubUtilization**
GiniCoefficient
19902003 2008 2008 2008 2008
22.0% 18.6% 20.0% 13.4% 0.51Nicaragua 47.9% 46.0% 62.0% 33.7% 0.57Central America 44.5% 52.8% 51.9% 30.7% 0.57
* 2005 for Nicaragua** Unemployment plus UnderEmploymentSource: UNDP (2006), ECLAC (2009), Rivera and RojasRomagosa (2007)
Costa Rica
create a business platform in the region, to attract more companies and investors interested in entering
both markets. Most importantly, there would be a more solid integration of a regional Central American
market of almost 40 million people.
Depending on the �nal outcome of a Free Trade Agreement (resulting basically from the political
bargaining of interest and pressure groups), a group of �winners� and �losers� will emerge. These
groups, however, might not be the expected winners and losers, in terms of their success or failure to
in�uence the FTA agreement. Instead, the impact of an FTA will depend signi�cantly on the starting
point of an economy, and the particular characteristics of its productive sectors. The ensuing results
will then depend on the structure, level of development, stage of competitiveness and dynamics of the
di¤erent sectors within the economic system of a country (Condo et al., 2005).
Less competitive business (or even entire industries) will either have to upgrade to compete, or be
forced to move to other activities that o¤er the opportunity to create wealth. This is the resource
reallocation and e¢ ciency gains logic of international trade. If the production capacity and human
resources can be upgraded or reallocated successfully, trade liberalization under DR-CAFTA and EU-
CAAA can become a success as companies become competitive and workers share in the bene�ts of
growing and thriving businesses.
However, there are political, economic and social risks that must be recognized and mitigated. Basi-
cally, the di¢ culties lie in the ability of the countries to manage the transformation process. Upgrading
competitive capacity and shifting factors of production into other areas is time and resource consuming
and requires much investment. Fiscal and institutional constraints in the countries could limit the
ability to invest in many critical areas that would help facilitate and smooth the transformation.
Under the US Caribbean Basin Trade Partnership Act (CBTPA)6 and the Generalized System of
Preferences (GSP), many exports from Costa Rica and Nicaragua already enter the United States
duty-free. DR-CAFTA consolidated these bene�ts and made them permanent.7 More than 80 percent
of US tari¤ codes (consumer and industrial products) exported to Central America enter duty-free
6Enacted in May 2000 as part of the Trade and Development Act. The CBTPA enhanced the 1984 Caribbean BasinInitiative (CBI) bene�ts.
7The United States and �ve Central American countries, El Salvador, Guatemala, Honduras, Nicaragua and CostaRica, concluded negotiations on the US-Central American Free Trade Agreement (DR-CAFTA) in January 2004. Theagreement was signed on May 2004, and rati�ed by the US House of Representatives on July 27, 2005. The agreementhas been rati�ed by all country partners. The Dominican Republic was included into the Agreement on August 2004,named afterwards DR-CAFTA.
10

immediately since the rati�cation of the agreement, while 85 percent will be duty free within �ve years.
All remaining tari¤s will be eliminated within ten years.
Close to 98 percent of all goods produced in Central America enter the US market duty-free. The
Central American countries also accorded substantial market access across their entire services regime
(i.e. banking, insurance, telecommunications), subject to very few exceptions. Regarding agriculture,
DR-CAFTA opened the market widely, with the elimination of almost 100 percent of import tari¤s.
The only excluded products are sugar in the US, white corn in all Central American countries, potatoes
and onions in Costa Rica. The sensitive agricultural products of Central America (rice, beans, poultry,
beef and pork meat, dairy products) obtained protection with long tari¤ phase-out periods.
The European Union (EU) and �ve Central American countries, El Salvador, Guatemala, Honduras,
Nicaragua and Costa Rica, started negotiations of an EU-Central America Association Agreement (EU-
CAAA) in June 2007.8 Under the Generalized System of Preferences (GSP plus), many exports from
Central America already enter the European Union duty-free. Notwithstanding, many agricultural
goods face important tari¤ and non-tari¤ barriers in the EU market, particularly bananas and sugar,
two export commodities with signi�cant comparative advantages in Central America.
The Association Agreement could consolidate GSP plus bene�ts and make them permanent, so
that an important amount of products made in Central America could enter the EU market duty-free
immediately upon rati�cation of the agreement. However, the recent experience with EU negotiated
FTAs (with Chile, Mexico, and South Africa, for instance) suggests that many �sensitive� sectors,
mainly EU agricultural goods with high protection, would be excluded from any agreement.
Tables 4 and 5 shows the relative importance of trading partners for Costa Rica and Nicaragua
before the implementation of both FTAs.
2.3 Human capital, trade and growth
Many of the economy-wide e¤ects of increased trade openness are dynamic in nature. While an im-
provement in the allocation of resources is the main static e¤ect of liberalization, most of the expected
gains from increased trade are dynamic. These include more and cheaper inputs and �nal products,
pro-competitive e¤ects associated with increasing returns to scale and the erosion of market power,
among others (Francois et al., 1996). In order to assess the wider impact of trade liberalization it is
important to take into account the potential impact of changes in key variables related to growth, like
human capital accumulation, foreign investment growth, and technology upgrading.9
The impact of trade on poverty would depend on changes and adjustments of several variables that
a¤ect productivity and consumption. According to Winters et al. (2004), the impact is related to growth
outcomes, household consumption changes, labor market adjustments (employment and wages), and
�scal impacts (public expenditure and income redistribution). Human capital investment is generally
regarded as a key determinant of the impact of trade liberalization on growth and poverty. Reina and
Zuluaga (2008) present a literature review with evidence of a strong link between increased trade, human
8An Association Agreement goes beyond the standard Free Trade Agreement approach. It incorporates political andinstitutional agreements between the Parties, and a development aid component. The EU-CAAA is expected to be rati�edin 2010.
9See for example Edwards (1993), Barro and Sala-i-Martin (1995), Easterly (2001), Helpman (2004), Aghion andHowitt (2009).
11

capital formation and growth. From a theoretical perspective, there are at least three mechanisms
through which education investments may a¤ect economic growth:
� Education increases the human capital inherent in the labor force, which increases labor productiv-ity and thus transitional growth towards a higher equilibrium level of output (Mankiw et al., 1992).
� Education may increase the innovative capacity of the economy, and the new knowledge on newtechnologies, products and processes promotes growth (Lucas, 1988; Romer, 1990; Aghion and
Howitt, 1998).
� Education may facilitate the di¤usion and transmission of knowledge needed to understand andprocess new information and to adapt successfully new technologies, which again promotes eco-
nomic growth (Helpman, 2004; Benhabib and Spiegel, 2005; Aghion and Howitt, 2009).
One particularity of education, from an economic perspective, is the presence of increasing returns
and externalities. A direct consequence of this is the tendency of variables to gain more advantage
when they move ahead, or to fall further behind when they go back. Increasing returns are then a form
of positive feedback (see Arrow, 2000). Existing literature points towards an intergenerational e¤ect of
literates in�uencing education decisions of younger cohorts, and the contribution of a more educated
population to economic growth.10 Moreover, Heckman (2000) argues that early investments in human
capital for children have a larger payo¤ than interventions at a later stage, which aim to close the gap
between troubled and regular students.
It is after Lucas (1988) that linking education and economic growth was theoretically encouraged
in the economic literature. However it was Romer (1990) who �rst emphasized a crucial aspect of
knowledge (i.e. education and ideas): it can be compared to a public goods and regarded as a non-
rivalry good. This roughly means that the use of knowledge by one party does not preclude or make
more costly its use by another party. Thus, knowledge has a big potential to foster long-run progress
in a country.
It is well documented that workers in cities earn a substantial wage premium, and there is mounting
evidence that this premium is not due just to selectivity, but re�ects the notion that cities foster the
accumulation of human capital (Glaeser and Maré, 2001; Gould, 2007). Economic progress encourages
education as well. A country with a healthy economic growth is likely to impact positively the family
budget which also helps to support children education (Hanushek and Kimko, 2000).
Many indicators (of the quantitative e¢ ciency) of the system are consistent with this perspective.
Among them, the primary completion rate (PCR), which records the graduates from the sixth grade,
and the graduate enrollment rate (GER) are regularly selected as the key output indicators to analyze
an education system and its impact on growth and poverty. These two output indicators are, however,
a quantitative measure of school achievements (coverage), but are not accurate indicators of learning
outcomes. It is common practice to use school attainment (years) as a measure of human capital. School
attainment as a rough measure of individual skill has been veri�ed by several studies of labor market
outcomes (Hanushek, 2007).
However, this variable is only a quantitative indicator that does not include the quality of the
education that is provided. Moreover, it assumes that every year of schooling is "homogeneous," that
10See for instance Durlauf (1996).
12

is, produces the same output (like skill formation or completion rates) in every country or time period.
Recent research show, contrary to this view, that the quality (more than the quantity) of education has
an important impact on productivity and national growth rates (Hanushek and Kimko, 2000; Glewwe,
2002). Di¤erences in cognitive achievement have also an impact on labor market outcomes. For instance,
Murnane et al. (2000) present evidence on the causality between cognitive skills and future earnings
(through higher wages).
Hanushek and Woessman (2008) show that cognitive skills (in combination with traditional quan-
titative measures) increase the explanatory power of human capital with respect to economic growth,
income distribution and wage determination. Moreover, Hanushek and Woessman (2009a) provide evi-
dence that the robust association between cognitive skills and economic growth re�ects a causal e¤ect of
cognitive skills and supports the economic bene�ts of education policy. For the case of Latin America,
Hanushek and Woessman (2009b) show that the staggering low levels of cognitive skills in the region,
can explain a great deal of the comparative low growth levels of the Latin American countries in the past
40 years. The authors argue that school attainment is associated with economic growth only insofar as
it produces strong cognitive skills, an area where Latin America has important weaknesses.
The quantity and quality of education are therefore key issues to incorporate when assessing the
potential impacts of education policies on trade openness (in this case, Free Trade Agreements) and
growth outcomes. We will argue below that Nicaragua�s human capital investment is far behind in-
ternational standards, a situation that limits the creation of capacities and skills improvement to take
advantage of higher value added productive activities linked, for instance, to international trade and
foreign direct investment. On the other hand, notwithstanding the relative advantage of Costa Rica
in terms of years of schooling, the analysis shows that the country still lags behind leading nations in
terms of education quality. This leaves broad possibilities for policy actions to enhance human capital
and economic growth.
2.4 Education quality in Nicaragua and Costa Rica
Improving the quality of education is still the major challenge confronted by the education systems of
Latin America and the Caribbean (UNESCO and LLECCE, 2008b). In the case of Nicaragua, the task is
more stressing, since limited access to education and low completion rates (quantity) are still important
barriers to development. According to World Bank (2008), lack of education constitutes one of the
main determinants of poverty in Nicaragua. It is estimated that less than 70% of population between
15 and 19 years attained complete primary education (UNESCO and LLECCE, 2008a). The Ministry
of Education (MINED) reports an 80.3% primary school completion rate (Ministerio de Educación de
Nicaragua, 2007). However, less than 40% of students complete primary education without repetition.
Despite some progress in recent years, Nicaragua is likely to meet less than half of the Millennium
Development Goals (MDGs) set for 2015. In the case of MDG-2 (a net primary enrollment rate of
100% for year 2015), the country is on track, but unlikely to achieve the goal, notwithstanding the
advances reported by Ministerio de Educación de Nicaragua (2008). Currently, the net enrollment rate
in primary education is 84.1%. The forecast for 2015 is 87% (World Bank, 2008).
Regarding secondary education, Ministerio de Educación de Nicaragua (2007) reports a 65.7% ap-
proval rate, while 43.12% of students complete it without repetition. In year 2007, only 32% of the
13

population aged between 20 and 29 year graduated from high school (UNESCO and LLECCE, 2008a).
Therefore, there is also broad space for improvements in secondary education.
Recent estimations indicate that a worker in Nicaragua earns 10% more for each additional year
of schooling received. Returns to primary and secondary education have been increasing in the last
decade. It is estimated that workers require at least 11 years of education to achieve an income level
above the poverty line (World Bank, 2008). Trejos and Gindling (2004) argue that one of the most
important determinants of income inequality in Nicaragua, relative to other Central American countries,
is the limited access to education. Quality is a central issue, as well. The possibility of increasing
labor productivity depends on education quality improvements (World Bank, 2008; Guevara, 2004).
For instance, using household survey data, Gutierrez et al. (2008) report a decrease of -26% in labor
productivity (output per worker) between 2001 and 2005. In presence of more average years of education
of the labor force, and a negative Total Factor Productivity (TFP) rate for the same period, the quality
of education appears as a possible explanation for this outcome.
From a policy perspective, it seems clear that the improvement of education coverage and quality
are key objectives of the Ministry of Education (MINED, 2007b). The �nal policy outcome in terms of
a more productive labor force appears as a key performance indicator for the medium and long term.
Compared to Latin American standards, Costa Rica has made important advances regarding ed-
ucation access in the last decades. Literacy rate is almost 100% while more than 93% of population
between 15 and 19 years has completed primary education (UNESCO and LLECCE, 2008a). According
to the Ministry of Planning (MIDEPLAN), the net enrollment rate in primary education is 100.7% and
68.9% in secondary education, with completion rates of 89.3% and 79.4%, respectively (SIDES, 2009).
However, in recent years secondary school attendance has decreased signi�cantly. Close to 12.5% of
secondary students leave high school before completion (Programa Estado de la Nación, 2008). More-
over, it is estimated that only 69% of enrolled students complete secondary studies without repetition
(SIDES, 2009).
Secondary education is a central concern of current policy. Indeed, government o¢ cials included
secondary education promotion as a key component of the National Development Plan for year 2006-2010
(MIDEPLAN, 2006). The main instrument of education promotion has been Avancemos, a conditional
cash transfer program that aims to support low income students and thus help them complete secondary
education. The main objective is to increase the completion rate by 4.2% of 2006 level, in year 2010.
According to Gindling and Trejos (2005), one of the most important determinants of rising inequality
in Costa Rica during the 1990s (the period of major trade liberalization measures) was the presence of
increasing returns of education, that is, the earning di¤erences between more- and less-educated work-
ers. Driven by trade liberalization and foreign direct investments attraction, the productive structure
of Costa Rica has changed signi�cantly in the last two decades. The demand for high skilled workers
has increased, as well as their relative wages compared to low skilled workers (Sánchez, 2004). Multina-
tional companies (MNCs) and exporting �rms have created a labor demand for more quali�ed workers,
therefore increasing education returns (Monge-González et al., 2009). Gindling (2007) indicates that
90% of household income inequality is explained by labor income, while inequality in education access
accounts for an important part of wage dispersion.
Table 8 describes the education level of the labor force for both countries. In terms of education
quantity, the Costa Rican labor force is generally more skilled than in Nicaragua. In spite of this,
14

Nicaragua has made advances in recent years to reduce the non-educated workers share and increase
all education levels of the employed people. Projections for year 2015 suggest a similar tendency.
Table 8: Education level of the labor force: Projections for 2015
2006 2015 2006 2015
No Education 2.5 1.8 14.4 8.4Incomplete Primary 12.5 8.7 23.1 15.4Primary 28.6 22.8 14.7 12.2Incomplete Secondary 20.7 24.7 23.4 28.4Secondary 13.9 15.1 11.1 16.7University 21.8 26.9 13.2 19.0
Source: Trejos (2008)
NicaraguaCosta Rica
Table 9 describes data from the Second Regional Comparative and Explanatory Study (SERCE).
These data evaluates student performance in Latin America, following a similar methodology to the
PISA (Programme for International Student Assessment) report by OECD (2007). The SERCE gives
insight into the learning acquired by Latin American and Caribbean Third and Sixth Grade Primary
Students in the areas of Mathematics, Language (Reading and Writing) and Natural Science during
their school trajectory. The assessment is based on test scores with an scale of 500 (mean) and 100
(standard deviation) points (UNESCO and LLECCE, 2008a).
Table 9: SERCE tests: Student performance in mathematics and reading tests
Mean Score Std.Dev. Mean Score Std.Dev.
Argentina 513.0 7.7 506.5 9.6Brasil 499.4 11.6 520.3 11.4Chile 517.3 8.1 546.1 8.4Colombia 492.7 9.4 514.9 10.9Costa Rica 549.3 7.4 563.2 6.2Cuba 637.5 21.7 595.9 13.0Ecuador 459.5 9.9 447.4 9.2El Salvador 471.9 7.4 484.2 7.8Guatemala 455.8 5.7 451.5 6.6Mexico 541.6 10.3 529.9 9.4Nicaragua 457.9 5.0 472.9 5.3Panama 451.6 6.3 472.1 7.2Paraguay 468.3 8.4 455.2 8.7Peru 490.0 10.6 479.3 5.2Dominican Rep. 415.6 4.0 421.5 6.4Uruguay 578.4 7.9 542.2 7.2
Latin America 506.7 5.3 513.0 5.2
Source: UNESCO and LLECCE, 2008b
Mathematics Reading
With regard to changes in the quality of education �as measured by standardized test scores�Costa
Rica shows scores above the Latin American averages, while Nicaragua ranks below regional average
both in mathematics and reading skills tests. It is noticeable the dispersion of test scores from the
highest and lowest percentiles.
15

Table 10: PISA tests: Student performance in mathematics and reading
Mean Score Std.Dev. Mean Score Std.Dev.
Australia 519.9 88.0 512.9 93.7Austria 505.5 98.1 490.2 108.2Belgium 520.3 106.1 500.9 110.0Canada 527.0 85.8 527.0 96.3Czech Republic 509.9 103.2 482.7 111.3Denmark 513.0 84.8 494.5 89.3Finland 548.4 80.9 546.9 81.2France 495.5 95.6 487.7 104.0Germany 503.8 99.1 494.9 111.9Greece 459.2 92.3 459.7 102.7Hungary 490.9 91.0 482.4 94.4Iceland 505.5 88.0 484.4 97.0Ireland 501.5 82.0 517.3 92.4Italy 461.7 95.8 468.5 108.8Japan 523.1 91.0 498.0 102.4Korea 547.5 92.6 556.0 88.3Luxembourg 490.0 93.4 479.4 100.2Mexico 405.7 85.3 410.5 95.7Netherlands 530.7 88.6 506.7 96.6New Zealand 522.0 93.3 521.0 105.2Norway 489.8 91.6 484.3 105.1Poland 495.4 86.5 507.6 100.2Portugal 466.2 90.7 472.3 98.8Slovak Republic 492.1 94.5 466.3 105.1Spain 480.0 88.9 460.8 88.8Sweden 502.4 89.7 507.3 98.2Switzerland 529.7 97.4 499.3 94.1Turkey 423.9 93.2 447.1 92.9United Kingdom 495.4 88.9 495.1 101.9United States 474.4 89.7 na na
OECD average 497.7 91.5 491.8 99.1
Latin American CountriesArgentina 381.3 101.1 374 124Brazil 369.5 92.0 393 102Chile 411.4 87.4 442 103Colombia 370.0 88.0 385 108Uruguay 412.5 121.2 413 121
Source: OECD (2007)
Mathematics Reading
The SERCE report found a positive correlation between the average scores of a given country
and its per capita Gross Domestic Product (GDP). Another relevant �nding is that the higher the
income distribution inequality, the lower the average student performance in Latin American countries.
Therefore, SERCE scores change o¤er a good picture of how the improvement of education quality
could impact growth in the region.
SERCE reports scores for sixth grade students, while PISA evaluates 15-year old students skills. In
spite of this di¤erence, both reports are helpful for comparisons of Latin American countries included in
both studies. A clear result is that PISA�s standards are more rigorous than SERCE�s (Table 10). Latin
American countries are far from developed countries standards reported by PISA and obtained much
lower scores compared to those of SERCE (in all cases more than 100 score points less). Furthermore,
Hanushek and Woessman (2009b) argue that the average achievement of Latin American students on
16
international cognitive skills tests is substantially lower than in East Asia and close to Sub-Saharan
Africa.
2.5 Early childhood development policies in Nicaragua and Costa Rica
Development academics and practitioners acknowledge the important role of Early Childhood Develop-
ment (ECD) interventions such as health and nutrition interventions, conditional cash transfer (CCT)
programs, and nurseries and preschool facilities, on cognitive development and children welfare, educa-
tion performance, and labor productivity, among other key development variables (Glewwe et al., 2001;
Gould et al., 2009; Paxson and Schady, 2007; Hoddinott et al., 2009).
In the case of education, available studies for developing countries indicate that ECD interven-
tions make a di¤erence in terms of school attainment, intellectual achievements and education invest-
ment returns in general (UNESCO and LLECCE, 2008b; UNESCO and LLECCE, 2008a; Grantham-
McGregor et al., 2007; Glewwe, 2002; Instituto Nacional para la Evaluación de la Educación, INED,
2008). The existing evidence supports interventions to improve young children�s developmental out-
comes before they enter school to enhance their performance and achievement while in school and
beyond (Young and Richardson, 2007).
In order to increase skill levels, higher investment in education is required. Some studies have
found that ECD interventions in Nicaragua could made important contributions to achieve a better
education performance and higher returns on education investments. For instance, Macours et al.
(2009) evaluate the impact of a randomized cash transfer program in rural Nicaragua, �nding signi�cant
e¤ects on cognitive outcomes, especially language.11 Another conditional cash transfer program, Red
de Protección Social, is evaluated by Maluccio and Flores (2004). The authors �nd that the program
had positive e¤ects on a broad range of indicators and outcomes, like increased household expenditures
on food, reducing primary school desertion, and improving the health care and nutritional status of
children under age 5.
Verdisco et al. (2007) evaluate the Comprehensive Childcare Program in Nicaragua (PAININ), which
introduced a comprehensive ECD model in Nicaragua that consolidated services previously provided
separately (e.g., preschool education; weighing and referral/counter-referrals to the health care system)
and integrated them with new services (e.g., early childhood education). The authors �nd important
impacts of the program on schooling and education performance, among other variables.
By looking at how the Early Childhood Environment a¤ects outcomes of individuals later on in life,
Gould et al. (2009) provides further evidence of investments in the early stages of a child�s development
having long-term payo¤s. Heckman (2000) argues that early investments in human capital for children
have a larger payo¤ than interventions at a later stage, which aim to close the gap between troubled
students and regular students.
A vast body of research has demonstrated that children who participate in well-conceived ECD
programs tend to be more successful in later school. It is well documented by medical and educational
research that the brain is almost entirely developed by the time a child enters school, and it is estimated
that half of all intellectual development potential is established by the age of four. Therefore, poorly
11The program, known as Atención a Crisis, makes sizeable payments, equivalent to about 15 percent of per capitaexpenditures for the average recipient household.
17

developed children could hardly reach their full intellectual potential, maintaining the intergeneration
cycle of poverty (Galliani, 2007).
Regarding ECD interventions in Costa Rica, one of the oldest and most important programs is the
CEN-CINAI. The program started in 1950 with the establishment of the country�s Complementary Food
Program through an agreement between the Ministry of Health and UNICEF. This program includes
three types of centers: the Child Care Centers (CINAI) which provide child day care for twelve hours
per day, the Education and Nutrition Centers (CEN) which operate eight hours a day in the morning
and afternoon and the Education and Nutrition Centers and School Lunch Programs (CENCE), which
also provide services to rural communities without school lunch programs. By 2007, there were 609
centers, of which 558 were CEN and 51 CINAI World Bank and Inter-American Development Bank
(2008).
The CEN-CINAI�s main goal is to allow poor and vulnerable children to develop normally. The
program provide to children the opportunity to develop their psychomotor, cognitive and social skills,
prepare children for high performance during the school life, promote the participation of the family
and the community in education and nutrition issues and enable children�s mothers to participate in
the labor market. This kind of programs should be reinforced and upscaled in order to reach a wider
group of households, particularly the poorer ones.
18

3 Analytical instruments and methodology
In this section we explain each of the analytical instruments that are employed in the analysis. This
includes the use of three di¤erent economic methodologies. Later on, these instruments are used to
simulate di¤erent policy scenarios and are mixed to analyze how trade policies interact with human
capital policies and how this interaction a¤ects poverty and the main macroeconomic indicators.
3.1 Trade and poverty evaluation using a top-down approach
The �rst analysis takes a two-step approach for which changes in factors and goods prices are esti-
mated through a recursively dynamic multi-country CGE model and then mapped into the income
and expenditure disaggregations of individual households using recent household survey data for Costa
Rica and Nicaragua. In this way, the macroeconomic e¤ects of FTAs are used to assess the potential
impacts on poverty and income distribution from trade agreements alone. The methodology to assess
the household-speci�c impact of trade reforms has been developed in Bourguignon et al. (2003).
3.1.1 Dynamic CGE model
To obtain the macroeconomic e¤ects of both trade agreements we construct our own multi-country
recursive dynamic CGE model. This model is written in GAMS using the MPSGE application developed
by Rutherford (1995; 1999).This application translates the GTAP database and standard model into a
GAMS version, i.e. GTAPinGAMS. Furthermore, Rutherford uses the MPSGE programming language,
which allows to handle CGE models in a consistent and compact format.
There has been a long debate among CGE modelers and trade economists concerning the use of
recursive against fully dynamic optimization models. A recursive model is based on a set of simplifying
assumptions concerning investment decisions (i.e. �xed capital accumulation or savings rates) and this
highly simpli�es the modeling and the computational complexities. On the other hand, the use of CGE
models is justi�ed as a way to model structural changes in the economy that require a micro consistent
optimization process by �rms and consumers. Assuming that agents are myopic in their investment
decisions goes against this particular strength of CGE modelling. However, the use of recursive dynamic
models is a practical way to look at the dynamic impact of changes in tari¤s and other forms of taxation
of �nal goods, which do not rely crucially on the capital accumulation adjustment path. In our case,
we want to focus on the growth path of the Central American countries �since this is very relevant for
poverty changes�but we are less interested in assessing the dynamic evolution and adjustment path of
the capital stocks. Although capital accumulation is relevant for growth, it is not directly relevant for
poverty changes, since most poor households rely on low-skill labour or public transfers as their main
income source. Therefore, the use of a dynamic optimization framework that yields a more accurate
description of the evolution of capital is not very relevant for our current purposes, while it greatly
complicates the modelling and simulation tasks. Under these circumstances, we rely on the use of a
recursive dynamic model.
In order to move from the static GTAPinGAMS model to our dynamic recursive CGE model, several
steps had to be taken. We describe them below:
19

� As a starting point we use the GTAPinGAMS static model developed by Rutherford (2005).This static CGE model is based on the standard GTAP general equilibrium model (Hertel and
Tsigas, 1997), with some modi�cations. In particular, it has a di¤erent �nal consumption demand
and investment demand systems. While both models use the same GTAP database.
� The �rst modi�cation done was to adapt the GTAPinGAMS program to read the most recent
GTAP database: GTAP7.12 In this latest version of the database, most of the Central American
countries can be separated. This was not possible with the former GTAP6 version of the database,
where CA was included only as an aggregated region. Now we can separate Costa Rica (CRC),
Guatemala (GUA), Nicaragua (NIC) and Panama (PAN), while the other countries (i.e. El
Salvador, Honduras and Belize) are aggregated in the region RCA.
� The second modi�cation was to transform the GTAPinGAMS static model into a recursive dy-
namic CGE model. This was done base on the insights by Paltsev (2004). In short, a recursive
dynamic model solves the model period by period and links each period using exogenously de-
termined growth rates and capital accumulation rates. The resulting growth path in the main
economic variables: consumption, production, trade and prices is taken to be the baseline scenario.
The way in which this dynamic calibration was done is explained in the following section.
� Finally, the model is used to estimate the macroeconomic impacts of both FTAs: DR-CAFTA andEU-CAAA. The resulting dynamic path from these simulations is then compared with the baseline
scenario to assess the dynamic e¤ects. The CGE evaluation of both FTAs is based on previous
work. For DR-CAFTA our simulations are based on the changes in tari¤s and quotas outlined in
Francois et al. (2008), while we use Rivera and Rojas-Romagosa (2007) for the expected outcomes
of EU-CAAA. The results of these simulations are explained in section 4.4.
3.1.2 Dynamic calibration
There is no standard way to calibrate a recursive dynamic model. The calibration decisions are based
on the baseline assumptions of the model and the questions that the model is built to answer. For the
purposes of this study, which relates changes in trade and educational policies on poverty, we are not
directly concerned with the dynamic adjustment of physical capital nor on demographic transitions. It
is known that economic growth changes demographic patterns �e.g. richer countries tend to have lower
fertility rates and population growth than developing countries. Moreover, human capital growth is also
intertwined in this relationship, with a more educated population also likely changing its demographic
patterns. Despite these interrelations, we want to keep the model tractable and therefore, we assume
that capital and population are growing at the same rate, such that capital per worker is constant. This
allows us to focus on the human capital changes that are fed into the CGE model from the satellite
model.
In general, the capital accumulation process is de�ned in the following equations:
12For a complete explanation and documentation of this database see Narayanan and Walmsley (2008).
20

Kt+1 = (1� �)Kt + It (1)
Kt+1 = (1 + gK)Kt (2)
where Kt and It are the (physical) capital stock and the investment values in period t, while � is
the depreciation rate of capital. Combining both equations we obtain the investment level It and the
investment growth rate gI :
It = (� + gK)Kt (3)
gI =It+1It
� 1 = gK (4)
It follows from this equations that we can either �x investment growth (which is equivalent to �xing
the savings rate when there are no international capital �ows) or the capital growth rate. In our case,
we follow the second option.
Regarding demographic trends, assuming a constant population growth is translated into a constant
increase in both skill types L and H. In our baseline scenario �without any educational policies�the
composition of total labour between both skill types is also held constant. This is not the case for our
counterfactual simulations with educational policies. In these scenarios the skill level of the population
is upgraded and the skill composition of the working force changes accordingly. However, the total
number of workers is constant in all scenarios for most of the years in the simulations. The only
exception is related to the transitional decreases in the working population that are associated with the
opportunity costs of staying longer in school to accumulate more human capital. Therefore, our �rst
calibration assumption is that population (low and high skill labour alike) and capital have an annual
growth rate of 3% in developing countries and 2% in developed countries.
The second assumption is that the remaining production factors: land and natural resources, do
not grow. This follows from the physical limitations of both productive factors to expand. In a strict
sense, land refers to pastures and arable land that are used in the agricultural sector, while natural
resources is a �xed factor in the production of certain sectors. For example, oil and mineral reserves
are a �xed factor in mining sectors. This second assumption implies, hence, that there is no expansion
in the agricultural frontier13 and that new natural resources are not discovered.
However, we do allow for changes in the e¢ ciency of land usage. When labour and capital endow-
ments are increasing and land is kept constant, land becomes a relatively scarce resource and land rents
experience a substantial rise. In turn, land is used intensively in the agricultural sector and this increase
in land rents produces a spike in the relative price of agricultural products. Yet, we do not observe
signi�cant increases in agricultural prices over time, even when the endowments of labour and capital
have been steadily increasing. Therefore, there has to be another mechanism at work that prevents the
relative price of agricultural products to increase. One explanation is that TFP growth in agriculture
is higher than in the rest of the economy. This hypothesis has been con�rmed for OECD countries by
13This is a very plausible case for Costa Rica, where the protection of national parks has set an e¤ective limit to theexpansion of arable land. For Nicaragua is can be possible to still expand the agricultural frontier further, but this israther uncertain and we do not have su¢ cient information to make a robust assumption in this regard.
21

Kets and Lejour (2003). They estimate that TFP growth in agriculture in the period 1970-1990 was
2:7%, while it was lower for manufacturing (1:95%) and services (0:42%). When these di¤erentiated
TFP sectoral growth rates are introduced into a CGE model, changes in agricultural prices are not
signi�cantly di¤erent from the price changes for other sectors (see for example Lejour et al., 2006).
However, we did not �nd such sectoral TFP estimates for Latin America or other developing countries.
The only reference found was to agricultural TFP growth from Avila and Evenson (2004). They �nd
that on average for the years 1961 to 2001 agriculture TFP grew by 1:5% in Costa Rica and 1:6% in
Nicaragua. Since we do not have disaggregated sectoral TFP growth data for non-agicultural sectors,
we use a 1:5% increase in land e¢ ciency use into our model. This gives a productivity increase in
the agricultural sector and thus, agricultural goods prices are not increasing signi�cantly in relation to
other sectors. Thus, using the above information for OECD countries and for agricultural productivity
changes, our third calibration assumption is that land e¢ ciency is has a 1:5% annual growth rate in
developing countries and 2% for developed countries.
Finally, our fourth and last assumption is about aggregated productivity increases that provides
an economy-wide growth path. These productivity changes are calibrated as total factor productivity
(TFP) growth rates in the baseline scenario. Following historic data for Costa Rica14 and OECD
countries15 we assume that TFP is growing at an annual rate of 1% for all regions. This does not
imply that the sources of TFP growth are the same for all regions. For developed countries these TFP
increases are mostly associated with R&D activities and innovation processes. In the case of developing
countries, they are associated with technological catch-up processes and e¢ ciency improvements in the
production process.
3.1.3 Microsimulations using household-level data
For the top-down microsimulations, we use the most recent expenditure/income surveys for Costa Rica
in 2004 (INEC-CR, 2006) and for Nicaragua in 2005 (INEC-Nicaragua, 2006).
The second step in the macro-micro top-down approach consists in translating the macro results from
the CGE model to the disaggregated household data available from national surveys. There are three
main mechanisms through which changes in trade policy can a¤ect household income (Bourguignon
and da Silva, 2003). First, changes in aggregate goods and factor prices directly a¤ect the expenditure
and income levels of individual households. Of these, the change in wages and food prices are usually
the most important to assess poverty e¤ects. Secondly, changes in employment levels induced by the
economy-wide adjustments that follow from FTAs directly a¤ect household income. Sometimes, this
can be the single most important factor for a household to be lifted out of poverty. Finally, government
transfers to poor individuals may also be a¤ected by trade agreements through tari¤ revenue changes.
This is also true for private transfers and �nancial gains in non-poor households, which can induce
signi�cant poverty e¤ects.
This study focus mainly on the �rst mechanism: economy-wide price changes. As a starting point, it
is assumed that the labor market adjustments are made via changes in wages and not through changes
in existing employment levels. When the economy is not in full employment it can be expected that
wages will not vary much, but employment levels will increase in response to a rise in the labor demand.
14Rodríguez-Clare et al. (2004) and Jiménez et al. (2009).15Lejour et al. (2006)
22

In the CGE model it is assumed that the governmental budget is adjusted to compensate for potential
tari¤ revenue losses and therefore, transfers to households are also assumed to remain constant.
Using this approach, therefore, the main e¤ect of the FTAs on individual households is represented
by the change in the price of the goods consumed and the variation in the factor prices (i.e. wages,
capital and land rents). The overall welfare e¤ects for an individual household are then a combination
of both price e¤ects. For example, if the price of the bundle of goods consumed by a speci�c household
increases more than the price of its factor endowments, it is likely that its real income diminishes.16
The macro CGE price changes are mapped into household expenditure and income data following the
GTAP 7 sectors and factor aggregations. This procedure is achieved in two steps. First, all expenditures
are aggregated into the 57 GTAP sectors and for both FTAs the expenditures are further aggregated
to match the particular sector dimension of each simulations. The second step consists in aggregating
each household�s income into four GTAP factors: low-skill labor, high-skill labor, capital and land. An
additional income category consists of �nancial gains and transfers.
With the income and expenditure data classi�ed by the GTAP sectors, the income composition by
household is constructed. To summarize the results, the expansion factors to obtain the whole popu-
lation information are used and then, this population is divided by percentiles. Thus, each percentile
is a representative �gure of each income level. The results for Costa Rica are shown in Figure 2. The
income composition of the low-income families consists mainly of low-skill labor, and to a lesser extent
capital and transfers. On the contrary, for the high-income households�high-skill labor, capital rents,
and �nancial gains are the most signi�cant.
This �gure provides important information to evaluate the potential poverty impacts. First, capital
represents a constant fraction of household income, irrespective of the income level.17 It is important to
notice that the constant share of capital among income levels does not mean that the absolute levels of
capital are equal among di¤erent household, only the relative fraction. Thus, high-income households
will have higher capital gains compared to poorer households, but it will represent the same fraction of
their total income.
With respect to poverty, the changes in low-skill labor earnings are a key issue. This follows from
the fact that for the lowest two quintiles of the population, low-skill labor represents more than half
of its income. Moreover, given the relative importance of food consumption for the poorest household,
the relative price of food is also a key factor that a¤ects poverty.
For the case of Nicaragua, the income composition is heavily skewed toward low-skill labor earnings.
Figure 3 shows that low-skill labor represents around 70% of income for all families up to the last
quintile, were its relative importance diminishes. On the other hand, high-skill labor income is only
signi�cant for the richest families. As with Costa Rica, capital rents represent a similar share of total
income for all the population. However, land rents are more signi�cant in Nicaragua, and contribute
to almost 10% of total income of the poorest families. Finally, transfers are signi�cant for all income
levels.16An alternative is to assume a di¤erent macroeconomic closure, where wages are �xed and employment levels change.
In this case, the assignment of new jobs to speci�c households can be done using logistic regressions. These regressionsprovide the probability of each household to have an employed member.17This follows the way the household divides own-activity income, assigning part of the revenues to capital gains and
the rest to labor income. Thus, for the low-income individuals that work in independent activities, part of their incomewill be reported as capital rents and the rest as unskilled labor income.
23

Figure 2: Costa Rica, factor income composition by income percentile
0,0%
10,0%
20,0%
30,0%
40,0%
50,0%
60,0%
70,0%
80,0%
90,0%
100,0%
1 6 11 16 21 26 31 36 41 46 51 56 61 66 71 76 81 86 91 96
percentil
% in
com
e
0
1
2
3
4
5
6
7
Financial gains
Transfers
Land
Capital
Skilled laborUnskilled labor
% food in consumption
Average HH size
Under these conditions, increases in inequality can be expected if the wages for high-skill wages
increase relative to other income sources. However, the main concern for Nicaragua is the reduction of
its high poverty levels and this can be achieved by an increase in the low-skill labor earnings, which
is the main income source for most households. Moreover, the share of food consumption in total
expenditure is also relatively high for most income levels, and therefore, changes in the relative prices
of food are key to changes in poverty.
3.1.4 Poverty measurement
We use the Foster-Greer-Thorbecke FGT (�) indexes to measure poverty. These indexes are de�ned in
discrete terms as:
FGT (�) =1
n
qXh=1
�z � yhz
��where n is total population, and q is the number of households h with income y that are below the
poverty line z. There are three di¤erent indexes, which are determined by the value of �. When � = 0
we obtain the Head Count Poverty index. This is FGT (0) = q=n, which counts the number of poor
individuals de�ned by q. For � = 1 the Poverty Gap index FTG(1) captures the acuteness of poverty,
since it measures the total shortfall of the poor from the poverty line. The Foster-Greer-Thorbecke
FGT (2) index is also known as the square poverty gap, since � = 2.
Finally, we use two poverty lines following the measures proposed by the World Bank. The �rst
poverty line corresponds to the �$2 a day�measure, which captures relative poverty. While absolute
24

Figure 3: Nicaragua, factor income composition by income percentile
0,0%
10,0%
20,0%
30,0%
40,0%
50,0%
60,0%
70,0%
80,0%
90,0%
100,0%
1 5 9 13 17 21 25 29 33 37 41 45 49 53 57 61 65 69 73 77 81 85 89 93 97
percentil
% in
com
e
0
1
2
3
4
5
6
7
8
9
transferslandcapitalskilled laborunskilled labor% food in consumptionAverage HH size
poverty is de�ned with a �$1 a day� poverty line.18 We use the o¢ cial values of both poverty lines
taken from the statistical o¢ ces of Costa Rica and Nicaragua.
3.2 Assessing the impact of human capital policies
The implementation of human capital formation is evaluated through a satellite model based on Jacobs
(2005) and Rojas-Romagosa (2009). Using �ve di¤erent skill-levels this model estimates the opportunity
costs of increased years of schooling and the expected labor productivity increases by skill that are
expected from higher school attainment. Both outcomes are then linked to the main CGE model
to estimate the e¤ect of higher school attainment on labor supply of di¤erent skills, wages, sectoral
production and other relevant macroeconomic variables. In turn, these macroeconomic results are
linked using the top-down approach to the micro model to evaluate the impact of the human capital
policies on poverty.
For this paper, a revised version of the satellite model by Rojas-Romagosa (2009) is constructed. In
particular, to adapt the model to developing countries, we change the skill classi�cations to have more
detailed information for low skilled workers, which are relatively more important in countries like Costa
Rica and Nicaragua. Thus, we use three low skilled and two high skilled sub-groups. In addition, the
satellite model incorporates cognitive skills into the analysis. Using test score information for Costa
Rica and Nicaragua, the impact of these quality indicators are incorporated to obtain a more robust
indicator of the role of human capital on poverty.
18This poverty lines do not correspond exactly to the values of $1 and $2, but are periodically adjusted by country toaccount for PPP changes and other factors. For a recent review see Ravallion et al. (2008).
25
As surveyed by Hanushek and Woessman (2008), there are strong empirical links between human
capital and economic growth. Thus, it is expected that increasing the quantity and/or quality of
schooling in both Central American countries can positively impact economic growth and facilitate
poverty reduction. Moreover, improving the human capital stock can also act as a complementary
policy to recent trade liberalization processes in the region. Improving the skills of workers can enhance
the potential bene�ts of increased trade openness.
3.2.1 Human capital satellite model
In the following section we explain how the satellite model is constructed and how it is employed to
assess the macroeconomic impacts of di¤erent human capital policies.
De�ning skill groups We de�ne skill groups by school attainment, i.e. years of schooling. Thus, L1
corresponds to a �rst stage of primary education (L1 < 6 years), L2 is completed primary education
(L2 = 6 years), and L3 is lower secondary education (6 years < L3 � 9 years) : We follow the standardconvention to de�ne high skill as workers with completed secondary education. Therefore, H1 corre-
sponds to upper secondary education (9 years < H1 � 12 years), while H2 are workers with universitystudies (H2 > 12 years).
The initial number of workers in each skill group s is de�ned using the schooling ranges described
above. However, to estimate the number of years of schooling in the population and the number of
extra years needed to move from one skill group to the other, we use a �xed number of schooling year
per skill group. In particular: L1 = 3; L2 = 6; L3 = 9; H1 = 12 and H2 = 16: This means that S; the
required number of year to move from one skill group to the other is given by: SL1L2 = 3; SL2L3 = 3;
SLH = 3, and SH1H2 = 4:
This skill classi�cation diverges from that of Rojas-Romagosa (2009) in the �rst and last classi�ca-
tion. In particular, L1 is part of L2 there �since almost all of OECD workers have completed primary
school�this moves the number of schooling year by type until H2 corresponds to workers in a second
stage of tertiary education. The data for Costa Rica is taken from INEC CR (2008) and from INEC
Nicaragua (2005) for Nicaragua.
Labour market dynamics The �rst building block in the satellite model (SM) is the evolution of
the stock of workers over time and how changes in formal schooling are fed into the model. The number
of workers is not only aggregated over the skill-types de�ned above, but also over cohorts. In this sense,
the SM can be regarded as a stylized cohort model. Current formal education policies only a¤ect the
�ow of each new cohort entering the labour market, but not those already working �this can only be
achieved by on-the-job training. This dynamic process is bound to limit the changes in the stock of
human capital and the potential impact of education policies.
De�ning NTsry =P
sNry as the total number of workers, we have that over time N evolves by:
NTry+1 = NTry + iry � ory (5)
where iry is the in�ow and ory is the out�ow of workers. These variables, in turn, are determined
by:
26
iry = �rNTry (6)
ory = �rNTry (7)
Labour force growth by region r is de�ned as gr = �r � �r; where �r is the rate of in�ow of newworkers while �r is the rate of out�ow of workers: The in�ow (�) and out�ow (�) rates are calibrated
such that these match average population growth rates in each region over the period considered. The
data on population growth are provided by the UN�s World Population Prospects. We assume that gris constant over time, since we do not associate changes in gr with any of the human capital policies we
are assessing. Thus, the e¤ort to calibrate time and skill-speci�c cohort di¤erences over a long period
of time (in the estimation of the model we work with y 2 [0; 40]) is not justi�ed. There are other cohortdi¤erence that are not captured. For instance, training on the workplace and the quality of education
is not de�ned by cohort, but only in the aggregate, as explained below.
Educational attainment We proceed now to model the changes in formal schooling. There are two
main components of formal education: the number of years of schooling (i.e. educational attainment)
and the quality of schooling. We deal with the second part in the next section. Regarding educational
attainment we begin by assuming that the current graduation rates are at their steady-state levels. This
means that the composition of total investment between higher and lower education is constant. Since
skills are constantly being upgraded over time, one can think of these steady-state graduation rates as
the share of relatively higher educated with respect to relatively lower educated workers, and not in
absolute terms.19
If we de�ne �sry as the graduation rates for skill s; region r and year y; then we have that the total
in�ow of workers with skill s into the workforce is: isry = �sry�rNTry: We assume that the out�ow
rates for each skill category are the same as for the total work force, hence: osry = �rNTry: Data
on graduation rates are taken from INEC CR (2008) for Costa Rica and INEC Nicaragua (2005) for
Nicaragua. With this information we have a baseline time path of the composition of skills and we can
model changes in educational policies as changing the graduation rates �:
It is important to note that current graduation rates do not re�ect the current share of low to
high-skill workers. For Costa Rica, we have LH = 1:86, while for Nicaragua this value is 2:85: This
re�ects a higher low-skill abundance in Nicaragua when compared to Costa Rica. On the other hand
the graduation rate aggregates for low-skill��Lry
�and high-skill students
��Hry
�result in a ratio of
�Lry�Hry
= 1:01 for Costa Rica and 2:11 for Nicaragua. Since LH >
�Lry�Hry
, these steady-state graduation
rates are translated in our model into a slow adjustment process that upgrades the skill composition of
the labour force over time, increasing the relative share of H in the workforce.
The importance of educational quality In a recent paper, Hanushek and Woessman (2008) argue
that cognitive skills play a key role in understanding the relation between education and economic
outcomes. It is common practice to use school attainment as a measure of human capital. However,
19Another alternative is to explicitly model the optimal decision of the households to invest in di¤erent human capitallevels or skill-types. This requires the use of a dynamic optimization CGE framework. Constructing such a model,however, is beyond the scope of this study.
27
this variable only captures a part of human capital formation. This shortcoming is made clear by
Hanushek and Woessman (2008) in the following equation:
H = �F + �Q(S) + �A+ �X + � (8)
where human capital H is determined by family inputs (F , the quantity and quality of formal
education Q(S), (where S is school attainment), individual ability A, and X which includes other
relevant factors such as experience and health.
Hanushek and Kimko (2000) already emphasized that pure quantity measures of education are a very
crude measure of skill. However, Hanushek and Woessman (2008) show that incorporating cognitive
skills (based on test scores) in combination with traditional quantitative measures (i.e. using Q(S)
instead of only S) greatly increases the explanatory power of human capital with respect to economic
growth, income distribution and wage determination. Moreover, the information contained in test scores
indirectly includes the family inputs, individual abilities and other factors, all of which are not easily
measured. Finally, there is signi�cant country variation in these quality measures that can be used to
assess changes in country-speci�c policies.
It is di¢ cult to track the earnings e¤ects of increased cognitive skills. This requires information on
the test scores at the time of schooling, and later on data on labour earnings. However, US longitudi-
nal data is available that can make this estimations possible. Reviewing these studies, Hanushek and
Woessman (2008) �nd that a standard deviation in test scores increases future earnings by 12%. More-
over, they o¤er several reasons why this estimate can be considered as a lower bound. For instance, the
skill-premium has increased over time and this is not captured by the time of the available longitudinal
data. This value of 12% represents a signi�cant increase from the previous value used in Jacobs (2005),
which was based on a 8% value based on the survey by Krueger (2003).
The former studies where based on data for developed countries. For the case of developing countries
we are not aware of any comparable estimations. However, we can expect a higher wage increase from
increased cognitive skills in developing countries since high-skill labour is relatively scarce. Thus, we
use a value of 20% e¢ ciency increase associated with one standard deviation in test scores for Costa
Rica and Nicaragua.
On-the-job training Workers can acquire human capital through schooling, but also by training at
the workplace. This is modelled in Jacobs (2005) by simplifying the human capital production function
used by Heckman et al. (1998):
Hsabt+1 = Hsabt + eAsa (Isa)�s (Hsabt)�s (9)
where human capital H is indexed over skill type s; ability a, age b and time t; and on-the-job
training (OJT) is de�ned by I: The parameters of this function are: eA;a productivity parameter relatedto the ability to learn, and �s and �s: Implicitly, this function is assuming the human capital does
not depreciate. This assumption is supported by the empirical observation that wages do not generally
decrease nor is there substantial OJT at the end of working careers.
28

To aggregate between cohorts and skill groups Jacobs (2005) assumes that �s = �s = 1 for all s.
This implies that returns to OJT Isa do not diminish with the human capital level. This allows to
aggregate individuals (with di¤erent ability and ages) into:
Hst+1 = Hst(1 + eAs�st) (10)
where the weighted average fraction of time invested in OJT is: �st =P
sa IsaHsabtPsa Isa
: Using (10) we obtain
the growth rates of OJT ( ):
s =Hst+1 �Hst
Hst= eAs�st (11)
Furthermore, it is assumed that the ability to generate human capital through OJT� eAs� is equal
for all skills s and that the time devoted to OJT (�st) is independent of s and constant over time.20
This allows to have a constant OJT growth rate for all skill types. However, we do allow to vary
across regions. Therefore, r is the key parameter in the model that summarizes the e¤ects of OJT on
human capital accumulation.
E¢ ciency units of labour To calibrate the value of we use the work by Mincer (1962) and
Heckman et al. (1998). They estimate that the fraction of life-time human capital gathered through
OJT (!) is 50% and 23% respectively. Assuming that total working years is in average T = 40 we
obtain that the number of e¢ ciency units of labour NErsT for region r; skill s at year T is given by:
NErsT = (1 + )TNErs0 (12)
Taking NErs0 to be the human capital gathered through schooling before any work experience at
y = 0; then we have:
NErsT = !NErsT +NErs0 (13)
Combining (12) and (13) we can calibrate as:
=
�1
1� !
�1=T� 1 (14)
Using the estimates of Heckman et al. (1998) that ! = 0:23 we get that = 0:0066. If we use
! = 0:5 from Mincer (1962), then = 0:0175: Jacobs (2005) decided to use = 0:01; which implies
that ! = 0:33; i.e., OJT generates one third of life-time human capital. In our SM we assume that
= 0:01, since we do not have any data or expectations that OJT is signi�cantly di¤erent in developing
countries.
Since on-the-job training (OJT) is a continuous process, the initial stock of human capital (expressed
in terms of number of workers by school attainment) has to be updated to include the skills already
obtained by the workers through past OJT.
20There is litte empirical evidence about the values of these parameters for di¤erent skill categories. Thus, for simplicitythey are assumed equal.
29
Taken Nrs0 as the number of workers at y = 0, we adjust this value to e¢ ciency units of labour
(NE) using the following equation:
NErs0 = (1 + )TNrs0 (15)
where T = 20 is the average working experience of the population and r0 is the initial value of
gamma.
Dynamic evolution of human capital stocks To obtain an overall function of human capital
accumulation, we combine the dynamic evolution of the labour market together with the human capital
acquired through formal schooling and OJT. The following dynamic function determines how human
capital stocks (de�ned as e¢ ciency units of labour) evolve over time:
NEsry = (1 + � �r)NEsry�1 +NETry�1�r�sryQry (16)
NETry =X
sNEsry (17)
where NETry is the total labour supply in region r in year y,.and NEsry is the number of e¢ ciency
units of labour indexed by the �ve di¤erent skill levels s. Equation (16) is the key equation of the SM
and determines the evolution of human capital stocks over time. Equation (16) consists of four main
components:
� First, it represents the dynamic evolution of the working force population as de�ned in section(3:2:1). Note that we are implicitly assuming that each cohort has the same OJT accumulation
parameter and that di¤erences in the quality of education (given by Qry) are also independent
of cohort size.21
� Formal educational attainment is determined by the graduation rates parameter �sry: The secondterm in equation (16) de�nes the new in�ow of human capital by skill. First, �rNTry�1 indicates
the total number of new workers in year y, while �sry indicates the fraction of that particular
cohort that graduates in each skill-level. We have thatP
s �s = 1 when the composition of the
labour force is not changing between skills, butPs�s < 1 when there is a policy that increases
schooling. In this case, students stay longer in school and do not join the work force immediately,
and this process creates the indirect opportunity costs of higher schooling levels.
� Qry is a quality indicator of the new in�ow of workers by region and year. We start with Q = 1and indicate increases in the quality of education through Q > 1; which only a¤ects the newly
graduated workers and not the overall working force. Note that there is no need to have Q(r)
di¤erences between countries at the initial year, since any quality di¤erences between countries is
implicit in the baseline wage di¤erentials between those countries.
21 In principle, there is not enough data to obtain time-speci�c past observations of quality (Q) and parameters thatcan be calibrated to obtain a present value of e¢ ciency units of labour over di¤erent cohorts. However, assuming theeducational quality has been increasing over time, then the presence of fatter cohorts with more work experience and OJTcan be compensated with thinner cohorts with less OJT but higher Q:
30

� Finally, on-the-job training is determined in the �rst term of equation (16). The human capital
stock of the former year is updated to include the growth rates of aggregate human capital due
to OJT.
It is important to note that the accumulation process builds upon the acquired human capital of
all the population. The e¢ ciency units of newly graduated students are a fraction of the accumulated
e¢ ciency units of labour of previous years NETry�1, and not a fraction of the total raw number of
workers in the that previous year: gNT ry = PseNsry; where eNsry = (1� �) eNsry�1 + gNT ry�1�sry:
In this sense, we can think of the human accumulation process embedded in equation (16) as general
knowledge that is transmitted over time from older to younger cohorts, instead of job-speci�c knowledge
that is not directly transferable to younger cohorts. This assumption is crucial to the results of the SM.
When we used an accumulation process that does not accumulate over e¢ ciency units, but over gNT ry(number of workers), the overall impact of our counterfactual simulations is greatly reduced. This is a
direct consequence of the initial stock of human capital by new cohorts being sizable smaller and thus,
the growth of human capital is much slower. Any policy changes that a¤ect new cohorts (a¤ecting
for instance � and Q) takes much longer to have an impact on the overall stock of human capital.
Moreover, even changes in the OJT parameter are also less in�uential since they are not transmitted
to the human capital stock of new cohorts.
Disaggregated human capital production function Through the parameters in equation (16),
namely: , � and Q; we can estimate how human capital policies a¤ect the human capital accumulation
process by each skill-type. To use these inputs into the core CGE model, however, we �rst need to
aggregate the �ve skill types we have: L1; L2; L3; H1 and H2; into low-skill (L) and high-skill (H)
aggregates This is the classi�cation for which we have data in the core CGE model.22
Using the time path of the di¤erent skill types in e¢ ciency units NETry from equation (16), we
aggregate the �ve groups using a nested CES function, which is commonly used in CGE models. Then
we have:
Lry = ALry [�L1ry (NL1ry)�L + �L2ry (NL2ry)
�L + �L1ry (NL3ry)�L ]
1�L (18)
Hry = ByAHry [�M1ry (NH1ry)�H + �M2ry (NH2ry)
�H ]1�H (19)
where Lry is aggregated low skill and Hry is aggregated high skill; �sry are the share parameters
of each skill level s = L1; L2; L3;H1;H2, with �L1ry + �L2ry + �L3ry = 1 and �H1ry + �H2ry = 1:
The elasticity of substitution between the two di¤erent low-skill workers is �L, with �L = 1 � 1�L: In
the same fashion, �H is the elasticity of substitution between the high skill groups. It is assumed that
�L = 5 and �H = 1:2:23
ALyr and AHyr are general e¢ ciency parameters that scale the embedded human capital levels
(measured by schooling attainment) of each sub-skill group:
22This is the classi�cation used in the GTAP database and we are restricted by this. Currently, the USITC is workingon splitting the current two skills into �ve skills using ocupational-based data (Weingarden and Tsigas, 2009).23Jacobs (2005) is assumed the following values: �L = 3 and �H = 1:2: We use a higher �L re�ecting the di¤erent
skill-type de�nitions we are using. Sensitivity analysis done in Rojas-Romagosa (2009) show that the key labor supplyand e¢ ciency changes do not change when these elasticities vary within sensible ranges.
31
ALry = eAry (3 �NL1ry + 6 �NL2ry + 9 �NL3ry)ALr0
(20)
where eAry is a general labour e¢ ciency scale parameter applied to both skill levels and assumedequal to one in the baseline. ALr0 is the value in y = 0: In a similar way, we de�ne:
AHry = eAry (12 �NH1ry + 16 �NH2ry)AHr0
(21)
In addition, we introduce skill-biased technological change (SBTC) in the model through the para-
meter By in equation (19). We assume that B is growing at a constant rate of � :
By+1 = (1 + �)By (22)
B0 � 1 (23)
The SBTC growth parameter � is calibrated to re�ect the growing wage di¤erential (�) between high-
skill (H) and low-skill (L) workers, where � = dwHwH
� dwLwL. Jacobs (2004) summarizes empirical
estimates for skill-biased technological change in the US, which generate a wage di¤erential increase of
approximately 3% per year. However, for European countries this number is substantially lower and in
Jacobs (2005) he uses � = 1:5%: Log-linearizing the aggregate marginal rate of transformation between
H and L, at constant relative supplies, we get:
� � dB
B=
�
1� 1=� (24)
Using an elasticity of substitution between L and H of � = 1:5, then we get the calibrated value
� = 0:045.24
Finally, we need to obtain the values for the share parameters (�sry) from the disaggregated func-
tions. However, these share are generally unknown. As explained in Jacobs (2005), these shares are
estimated using Mincer rates of return (�) and the number of years required to move from one skill-level
to the other (S) : The resulting calibration equations are:
24 In the SM, � does not play an important role since the aggregation between our low and high skill categories isonly done for descriptive reasons, but it is not used to create the linkage variables that are fed to the core CGE model.Moreover, � is not changing between our baseline and policy counterfactuals, so its value does not change our results.
32

�L1;ry =1
1 + exp�L1ry + exp�L1ry exp�L2ry(25)
�L2;ry =exp�L1ry
1 + exp�L1ry + exp�L1ry exp�L2ry(26)
�L3;ry =exp�L1ry exp�L2ry
1 + exp�L1ry + exp�L1ry exp�L2ry(27)
�L1ry = �L1L2;rSL1L2 + (1� �L) ln�NryL2NryL1
�(28)
�L2ry = �L2L3;rSL2L3 + (1� �L) ln�NryL3NryL2
�(29)
�H1;ry =1
1 + exp�Hry(30)
�H2;ry =exp�Hry
1 + exp�Hry(31)
�Hry = �H1H2rSH1H2 + (1� �H) ln�NryH2NryH1
�(32)
We assume that there is a country average Mincer rate of return, �, of 10% per year. Jacobs
(2005) used a Mincer rate of return of 8%, following the empirical �ndings surveyed by Card (1994),
Ashenfelter et al. (1999) and Harmon et al. (2003) for developed countries.25 However, it is expected
that these rates are higher for developing countries where high-skill workers are scarce (see for example
World Bank, 2008). However, these Mincer rates of return have little impact on the overall results
of the satellite model, since they only a¤ect indirectly, the share parameters of the aggregated labor
functions.
Aggregated human capital production function We can then aggregate labor into a single labour
variable using a CES function:
Gry = Ary [�L;ry (Lry)�+ �H;ry (Hry)
�]1� (33)
where Lry and Hry are the stocks of labour from equations (18) and (19), with shares given by
�L;ry + �H;ry = 1. Ary is a general e¢ ciency parameter and � = 1� 1� ; where � = 1:5 is the elasticity
of substitution between both aggregated skill levels.26 As done before, the share parameters � are
calibrated using Mincer rates of return (�) between low and high skill education and the number of
schooling year that takes to move from low to the high skill category is SLH = 3. Then the estimation
of the share parameters is done using these equations:
25Moreover, Harmon et al. (2003) �nd that each additional year of education on average approximately lowers theMincer rate of return with 1%, hence we set � = 0:01.26This value is the estimated elasticity of substitution between high-school and college graduates in the United States
(Katz and Murphy, 1992; Heckman et al., 1998), which has been recently validated by the work of Caselli and Coleman(2006).
33

�Lry =1
1 + exp�(34)
�Hry =exp�ry1 + exp�
(35)
�ry = �rSLH + (1� �) ln�HryLry
�� � lnBy (36)
Using equation (33) we can obtain an aggregated labour e¢ ciency parameter de�ned as:
"ry =GSry �GBryGBry
(37)
where GSry is the aggregated labour for region r in year y for the counterfactual simulation S; while
GBry is the value of G in the baseline B. We use this summary variable to analyze in a simpli�ed way
the e¤ects of each counterfactual simulation on labour e¢ ciency. However, the linkage between the SM
and the core CGE model is done using four variables, as explained in the next section.
3.2.2 Linkage variables
We incorporate into the core CGE model information from the disaggregated labour values L and H,
which are are de�ned in equations (18) and (19). Moreover we divide the L and H changes into a volume
parameter (LSUP ) and a labour e¢ ciency parameter (LEFF ) : This division allows us to track changes
in the relative supply of L and H and changes in the e¢ ciency units of labour for each skill aggregation
L and H: In total, we have now four linkage variables from the SM into the core GGE model. Note
that using this formulation the aggregated labour variable Gry is not relevant. Consequently the values
of � and the share parameters �Lry and �Hry do not a¤ect our results.
The procedure to separate the human capital labour supply (volume) changes from the labour
e¢ ciency changes is the following. First, we use the number of workers as de�ned in eNsry; whichincludes only the terms in equation (16) that are associated with volume changes, such that:
eNsry = NBsry�1(1� �r) +NTBry�1�r�sry (38)gNT ry =
XseNsry (39)eNLry = eNL1ry + eNL2ry (40)eNHry = eNM1ry + eNM2ry + eNRry (41)
where NBsry is the value of N in the baseline. We use NB instead of eN in equation (38) because we
want to see changes in the composition of the workforce with respect to the baseline. On the other hand,
using eN creates a dynamic process where the changes in ��s are accumulated over time and instead of
seeing shifts between skill groups, we have overall changes in the number of workers with respect to the
baseline.
34

We then estimate the volume change parameter LSUPvfry; where v indexes the counterfactual
simulation and f = L;H: The volume changes are given by the following equations, where eNBsry is the
value of eNsry in the baseline:LSUPvfry =
eNvfryeNBfry
(42)
Secondly, we derive the labour e¢ ciency change, which is given by the change in Lry and Hry when
the volume change is not present. This pure e¢ ciency-units value does not include the volume changes
is de�ned as Nesry:
Nesry = NEBsry�1(1 + r � �r) +NETBry�1�r�BsryQiry (43)
Lery = Ary��L1ry
�NeL1ry
��L + �L2ry �NeL2ry
��L� 1�L (44)
Hery = ByAry
��M1ry
�NeM1ry
��H + �M2ry
�NeM2ry
��H + �Rry �NeRry
��H � 1�H (45)
where the new variables Qiyr is used to account for the accumulation of Q over the years: Qiry =
(Qr)y. The use of Qiyr �instead of its time unvarying equivalent�is required to adjustment the values of
NEBsry that do not include the counterfactual higher values for Qr. Therefore, the values for Nesry are
including the e¤ects of e¢ ciency changes in Qr into the baseline values of NEsry, but do not include the
volume changes associated with the parameters �r; �r and �sry. Finally, the labour e¢ ciency parameter
LEFFfry is de�ned as changes in the Lery and Hery from each counterfactual simulation v with respect
to the baseline values:
LEFFvLry =LevryLBry
LEFFvHry =Hevry
HBry
(46)
Finally, LSUPvfry is multiplied by the labour supply time-path in the core CGE model, while
LEFFvfry is going to be used as a labour e¢ ciency parameter.
3.2.3 Human capital policy simulations
In this section we explain the policy simulations that are conducted for each country and the changes
in labour e¢ ciency that are derived from the application of these policies.
Simulation exercises Based on the state of education in Costa Rica and Nicaragua described in
section 2.4, three simulation exercises are developed. In all cases, a what if policy scenario is formulated.
The main data sources are the household survey of year 2008 in the case of Costa Rica INEC CR
(2008), the eight population census of Nicaragua, published in year 2005 INEC Nicaragua (2005), and
the SERCE report. The three exercises for Nicaragua are based on the following assumptions:
35
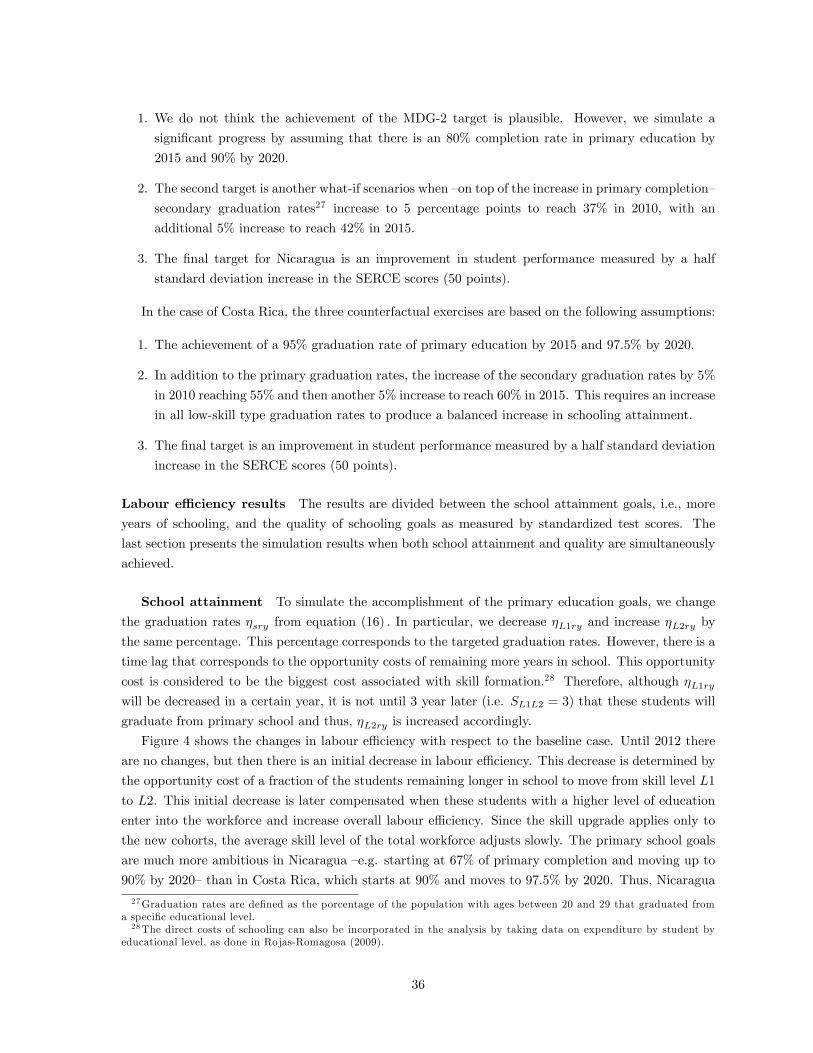
1. We do not think the achievement of the MDG-2 target is plausible. However, we simulate a
signi�cant progress by assuming that there is an 80% completion rate in primary education by
2015 and 90% by 2020.
2. The second target is another what-if scenarios when �on top of the increase in primary completion�
secondary graduation rates27 increase to 5 percentage points to reach 37% in 2010, with an
additional 5% increase to reach 42% in 2015.
3. The �nal target for Nicaragua is an improvement in student performance measured by a half
standard deviation increase in the SERCE scores (50 points).
In the case of Costa Rica, the three counterfactual exercises are based on the following assumptions:
1. The achievement of a 95% graduation rate of primary education by 2015 and 97.5% by 2020.
2. In addition to the primary graduation rates, the increase of the secondary graduation rates by 5%
in 2010 reaching 55% and then another 5% increase to reach 60% in 2015. This requires an increase
in all low-skill type graduation rates to produce a balanced increase in schooling attainment.
3. The �nal target is an improvement in student performance measured by a half standard deviation
increase in the SERCE scores (50 points).
Labour e¢ ciency results The results are divided between the school attainment goals, i.e., more
years of schooling, and the quality of schooling goals as measured by standardized test scores. The
last section presents the simulation results when both school attainment and quality are simultaneously
achieved.
School attainment To simulate the accomplishment of the primary education goals, we change
the graduation rates �sry from equation (16) : In particular, we decrease �L1ry and increase �L2ry by
the same percentage. This percentage corresponds to the targeted graduation rates. However, there is a
time lag that corresponds to the opportunity costs of remaining more years in school. This opportunity
cost is considered to be the biggest cost associated with skill formation.28 Therefore, although �L1rywill be decreased in a certain year, it is not until 3 year later (i.e. SL1L2 = 3) that these students will
graduate from primary school and thus, �L2ry is increased accordingly.
Figure 4 shows the changes in labour e¢ ciency with respect to the baseline case. Until 2012 there
are no changes, but then there is an initial decrease in labour e¢ ciency. This decrease is determined by
the opportunity cost of a fraction of the students remaining longer in school to move from skill level L1
to L2. This initial decrease is later compensated when these students with a higher level of education
enter into the workforce and increase overall labour e¢ ciency. Since the skill upgrade applies only to
the new cohorts, the average skill level of the total workforce adjusts slowly. The primary school goals
are much more ambitious in Nicaragua �e.g. starting at 67% of primary completion and moving up to
90% by 2020�than in Costa Rica, which starts at 90% and moves to 97.5% by 2020. Thus, Nicaragua
27Graduation rates are de�ned as the porcentage of the population with ages between 20 and 29 that graduated froma speci�c educational level.28The direct costs of schooling can also be incorporated in the analysis by taking data on expenditure by student by
educational level, as done in Rojas-Romagosa (2009).
36
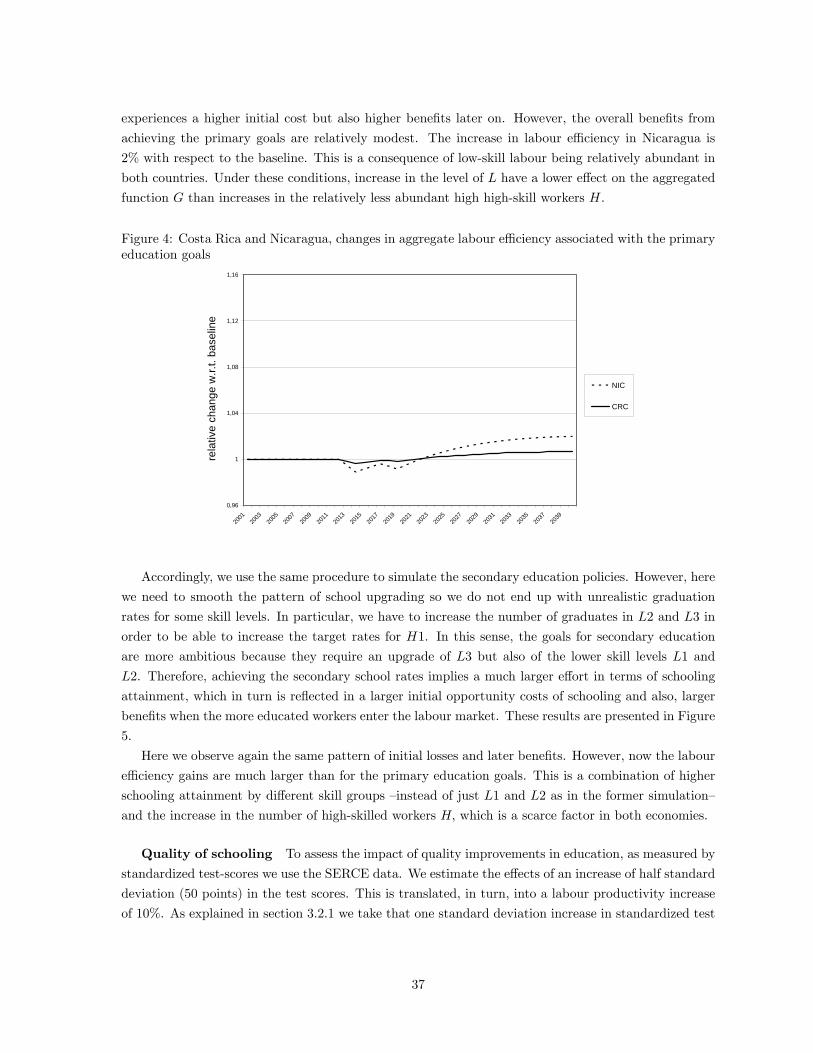
experiences a higher initial cost but also higher bene�ts later on. However, the overall bene�ts from
achieving the primary goals are relatively modest. The increase in labour e¢ ciency in Nicaragua is
2% with respect to the baseline. This is a consequence of low-skill labour being relatively abundant in
both countries. Under these conditions, increase in the level of L have a lower e¤ect on the aggregated
function G than increases in the relatively less abundant high high-skill workers H.
Figure 4: Costa Rica and Nicaragua, changes in aggregate labour e¢ ciency associated with the primaryeducation goals
0,96
1
1,04
1,08
1,12
1,16
2001
2003
2005
2007
2009
2011
2013
2015
2017
2019
2021
2023
2025
2027
2029
2031
2033
2035
2037
2039
rela
tive
chan
ge w
.r.t.
base
line
NIC
CRC
Accordingly, we use the same procedure to simulate the secondary education policies. However, here
we need to smooth the pattern of school upgrading so we do not end up with unrealistic graduation
rates for some skill levels. In particular, we have to increase the number of graduates in L2 and L3 in
order to be able to increase the target rates for H1. In this sense, the goals for secondary education
are more ambitious because they require an upgrade of L3 but also of the lower skill levels L1 and
L2. Therefore, achieving the secondary school rates implies a much larger e¤ort in terms of schooling
attainment, which in turn is re�ected in a larger initial opportunity costs of schooling and also, larger
bene�ts when the more educated workers enter the labour market. These results are presented in Figure
5.
Here we observe again the same pattern of initial losses and later bene�ts. However, now the labour
e¢ ciency gains are much larger than for the primary education goals. This is a combination of higher
schooling attainment by di¤erent skill groups �instead of just L1 and L2 as in the former simulation�
and the increase in the number of high-skilled workers H; which is a scarce factor in both economies.
Quality of schooling To assess the impact of quality improvements in education, as measured by
standardized test-scores we use the SERCE data. We estimate the e¤ects of an increase of half standard
deviation (50 points) in the test scores. This is translated, in turn, into a labour productivity increase
of 10%. As explained in section 3.2.1 we take that one standard deviation increase in standardized test
37

Figure 5: Costa Rica and Nicaragua, changes in aggregate labour e¢ ciency associated with the sec-ondary education goals
0,96
1
1,04
1,08
1,12
1,16
2001
2003
2005
2007
2009
2011
2013
2015
2017
2019
2021
2023
2025
2027
2029
2031
2033
2035
2037
2039
rela
tive
chan
ge w
.r.t.
base
line
CRC
NIC
scores translates into a 20% increase in wages. Thus, a half standard deviation increase is equivalent to
a 6% labor productivity increase.
Since these standardized tests are given to current students, an increase in the test performance only
translates into new cohorts being more productive, but the human capital levels of the older cohorts
already working are unchanged. Therefore, we use (16) and increase the quality parameter Q by 10%
to re�ect that the new cohorts entering the labour force have higher levels of cognitive skills and are
more productive.
To achieve this quality increase, however, requires monetary investments and time. There is a huge
literature that tries to link education expenditures with the quality of education. In the in�uential
paper by Hanushek (1986), he concluded that there was no empirical relation between school expendi-
tures and student performance. However, it is recognized that the majority of the studies he surveyed
su¤ered endogeneity bias. A more recent literature uses exogenous variation from controlled or natural
experiments. These new papers are surveyed by Webbink (2005) and he �nds that resources and incen-
tives can matter for achievements of students. However, the results vary by expenditure and incentives,
making it extremely di¢ cult to establish a clear relationship between concrete policy interventions and
schooling achievements. For example, the cost-e¤ectiveness of the policies is not yet established and it
probably varies much between countries and educational systems. This lack of clear policy instruments
that can be directly modeled to achieve the increase in schooling quality limits is a limiting factor in
our analysis. Thus, for illustrative reasons we conduct a what-if experiment where the quality increase
has already been reached in 2015. We show the changes in labour e¢ ciency of this quality improvement
in Figure 6:
Comparing these results with those of increased schooling attainment, it is clear that the economic
bene�ts of improved schooling quality are much more signi�cant. Labour e¢ ciency increases by around
20% when test scores are improved. While the increase in labour e¢ ciency is half that amount (around
38
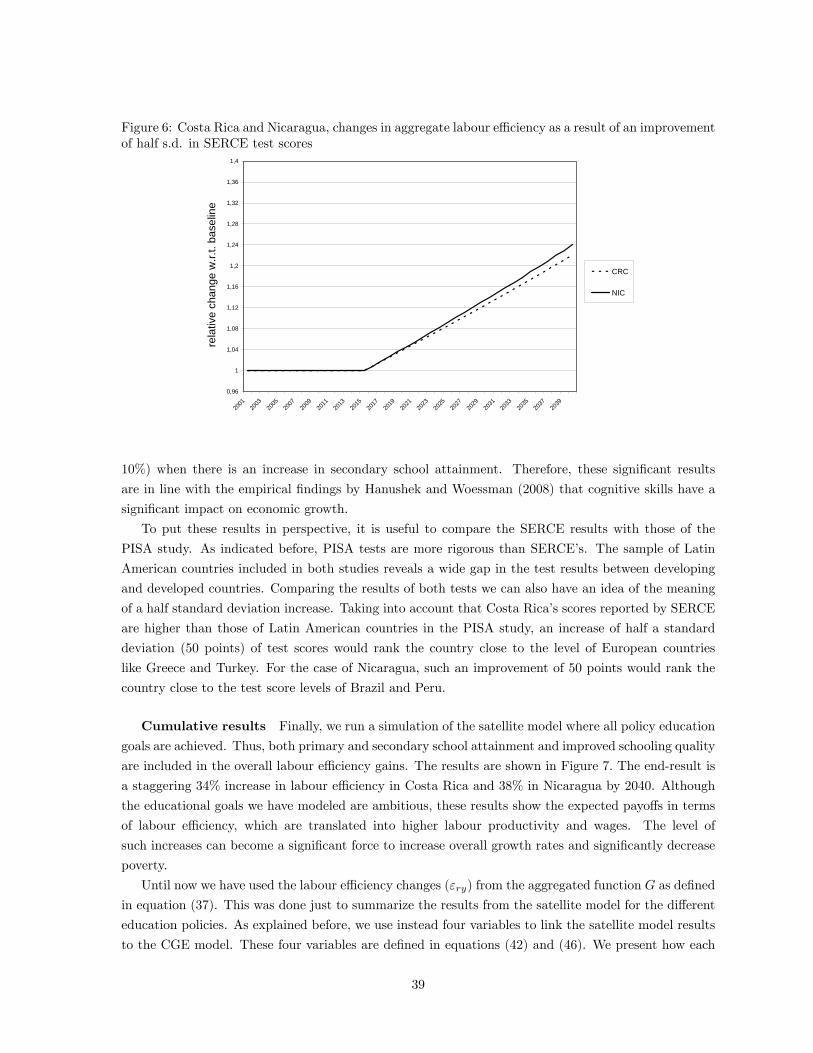
Figure 6: Costa Rica and Nicaragua, changes in aggregate labour e¢ ciency as a result of an improvementof half s.d. in SERCE test scores
0,96
1
1,04
1,08
1,12
1,16
1,2
1,24
1,28
1,32
1,36
1,4
2001
2003
2005
2007
2009
2011
2013
2015
2017
2019
2021
2023
2025
2027
2029
2031
2033
2035
2037
2039
rela
tive
chan
ge w
.r.t.
base
line
CRC
NIC
10%) when there is an increase in secondary school attainment. Therefore, these signi�cant results
are in line with the empirical �ndings by Hanushek and Woessman (2008) that cognitive skills have a
signi�cant impact on economic growth.
To put these results in perspective, it is useful to compare the SERCE results with those of the
PISA study. As indicated before, PISA tests are more rigorous than SERCE�s. The sample of Latin
American countries included in both studies reveals a wide gap in the test results between developing
and developed countries. Comparing the results of both tests we can also have an idea of the meaning
of a half standard deviation increase. Taking into account that Costa Rica�s scores reported by SERCE
are higher than those of Latin American countries in the PISA study, an increase of half a standard
deviation (50 points) of test scores would rank the country close to the level of European countries
like Greece and Turkey. For the case of Nicaragua, such an improvement of 50 points would rank the
country close to the test score levels of Brazil and Peru.
Cumulative results Finally, we run a simulation of the satellite model where all policy education
goals are achieved. Thus, both primary and secondary school attainment and improved schooling quality
are included in the overall labour e¢ ciency gains. The results are shown in Figure 7: The end-result is
a staggering 34% increase in labour e¢ ciency in Costa Rica and 38% in Nicaragua by 2040. Although
the educational goals we have modeled are ambitious, these results show the expected payo¤s in terms
of labour e¢ ciency, which are translated into higher labour productivity and wages. The level of
such increases can become a signi�cant force to increase overall growth rates and signi�cantly decrease
poverty.
Until now we have used the labour e¢ ciency changes ("ry) from the aggregated function G as de�ned
in equation (37). This was done just to summarize the results from the satellite model for the di¤erent
education policies. As explained before, we use instead four variables to link the satellite model results
to the CGE model. These four variables are de�ned in equations (42) and (46). We present how each
39

Figure 7: Costa Rica and Nicaragua, accumulative changes in aggregate labour e¢ ciency when reachingboth school attainment and quality goals
0,96
1
1,04
1,08
1,12
1,16
1,2
1,24
1,28
1,32
1,36
1,4
2001
2003
2005
2007
2009
2011
2013
2015
2017
2019
2021
2023
2025
2027
2029
2031
2033
2035
2037
2039
rela
tive
chan
ge w
.r.t.
base
line
CRC
NIC
of these four variables change when we use the accumulated policy simulations where primary and
secondary schooling are increased, as well as the overall quality of education. This is the simulation
where all the education policies targets are reached.
Figure (8) shows the changes in labour supply for the high-skill category H: We see that the supply
of H is increasing in two steps and the change becomes permanent after 2020. This corresponds to the
increase in high-school graduates in both countries.
Figure 8: Costa Rica and Nicaragua, high-skill labour supply changes with respect to baseline, simula-tion with all education policies
0,96
1
1,04
1,08
2001
2003
2005
2007
2009
2011
2013
2015
2017
2019
2021
2023
2025
2027
2029
2031
2033
2035
2037
2039
rela
tive
chan
ge w
.r.t.
base
line
CRC
NIC
40

On the other hand, Figure (9) gives the same information but for the low-skill workers. The supply
of L is increasing with the primary school goals, which increase the level of schooling within the low
skill aggregate L:But this e¤ect is counteracted by the movement of students from the L aggregate unto
the H aggregate as more students are completing their secondary education. At the end, this second
e¤ect is stronger and after 2020 there is a permanent decrease in the supply of low-skill workers.
Figure 9: Costa Rica and Nicaragua, low-skill labour supply changes with respect to baseline, simulationwith all education policies
0,96
1
1,04
1,08
2001
2003
2005
2007
2009
2011
2013
2015
2017
2019
2021
2023
2025
2027
2029
2031
2033
2035
2037
2039
rela
tive
chan
ge w
.r.t.
base
line
CRC
NIC
The following �gures presents the e¤ects of achieving the educational goals on the labour e¢ ciency
measures for both skill types. Figure (10) shows a very signi�cant increase in the e¢ ciency of high-skill
labour. For Costa Rica we have a 80% increase by 2040 and in Nicaragua it represents a 90% rise.
In the case of low-skill workers, the e¢ ciency increase is also signi�cant but of a lower magnitude
(see Figure 11). Another di¤erence is that there is an initial decrease in the e¢ ciency levels. This is a
consequence of the composition changes happening within the low-skill aggregate L:There is a movement
of students from L1 to L2 to L3 that is consistent with an upgrading of skills from the primary and
secondary education targets. This compositional changed in the transition period when there a less
students graduating than in the steady-state provokes a decrease in the aggregate value of L:
These signi�cant labour e¢ ciency increases are a result of the dynamic accumulative process embed-
ded in equation (16) :The driving force is the rise of educational quality represented by an increase in the
parameter Q, which produces a higher level of human capital for the new cohorts. Given the dynamic
process of labour in�ow and out�ow, higher Q levels are traduced into a slow but steadily increase in
the overall human capital stock level of all cohorts. Moreover, the process is accelerated by the presence
of on-the-job training (OJT), i.e., on each period the previous human capital stock is increased by the
OJT parameter . Since human capital is a crucial determinant of the e¢ ciency levels of both types of
labour and labour is the main productive factor in the economy, we have a direct link between quality
of education and economic growth. This follows the insights by Hanushek and Woessman (2008). In a
broader sense, the particular accumulation dynamics of equation (16) ; produces an endogenous growth
41

Figure 10: Costa Rica and Nicaragua, high-skill labour e¢ ciency changes with respect to baseline,simulation with all education policies
0,9
1
1,1
1,2
1,3
1,4
1,5
1,6
1,7
1,8
1,9
2
2001
2003
2005
2007
2009
2011
2013
2015
2017
2019
2021
2023
2025
2027
2029
2031
2033
2035
2037
2039
rela
tive
chan
ge w
.r.t.
base
line
CRC
NIC
Figure 11: Costa Rica and Nicaragua, low-skill labour e¢ ciency changes with respect to baseline,simulation with all education policies
0,9
1
1,1
1,2
1,3
1,4
1,5
1,6
1,7
1,8
1,9
2
2001
2003
2005
2007
2009
2011
2013
2015
2017
2019
2021
2023
2025
2027
2029
2031
2033
2035
2037
2039
rela
tive
chan
ge w
.r.t.
base
line
CRC
NIC
process. This mechanism is one of the reasons why human capital formation has long been regarded as
an important source of economic growth (Lucas, 1988; Barro and Sala-i-Martin, 1995).
42

4 Economic and poverty impact of trade and human capital
policies in Costa Rica and Nicaragua
The following analysis is done using the three di¤erent analytical instruments developed in the previous
section. For instance, the macroeconomic e¤ects of the FTAs are analyzed using our recursive dynamic
CGE model with the GTAP7 database (section 3.1.1). The poverty impact of the FTAs is evaluated
using the microsimulations (section 3.1.3). Finally, the macroeconomic e¤ects of the human capital
policies is evaluated using the human capital satellite model (section 3.2.1), together with the CGE
model. Furthermore, by linking the CGE model, the top-down approach and the human capital satellite
model we can evaluate the di¤erent interactions and complementarities of trade and human capital
policies and their impact on poverty.
We start, however, with an overview of the initial trade conditions before the negotiation of the
FTAs began and then, what was (or is being) negotiated for each FTA.
4.1 Preliminary trade conditions and FTA negotiations
As discussed in section 2.1, the United States and the European Union are key trade partners for Costa
Rica and Nicaragua. Aggregated data indicate that both regions account for a signi�cant share of both
countries exports and imports. The trade relationship of Costa Rica is more important, while Nicaragua
has other important trade partners besides the US and the EU (see Table 11).
Table 11: Costa Rica and Nicaragua, main trading partners, 2008
Exports Imports Exports Imports
United States 35.6% 40.3% 29.5% 20.7%European Union 16.1% 8.5% 14.9% 6.3%Central America 18.1% 6.0% 33.4% 22.4%Others 30.2% 45.1% 22.3% 50.5%
Total 100% 100% 100% 100%
Source: PROCOMER, Central Bank of Nicaragua
Costa Rica Nicaragua
The Dominican Republic-Central American Free Trade Agreement with the Unites States (DR-
CAFTA) and the forthcoming Association Agreement between the European Union and Central Amer-
ica (EU-CAAA) are expected to create the conditions for the promotion of a more dynamic export sector
in the region, and to build a solid base for a development path in Central America based on increasing
foreign direct investments, the creation of productive linkages with local �rms and the consolidation
of clusters, the transfer of technology and human capital formation, and the reinforcement of regional
integration strategies.
It is not easy to estimate the possible impacts of a Free Trade Agreement (FTA). Many factors and
conditions are involved. The expected impacts of DR-CAFTA and EU-CAAA depend on the growth
of employment, trade and investments, on dynamic e¤ects resulting from increased competition within
the integrated markets, greater investments and technology transfers, and the impact in international
43

relations, including development cooperation, �agreement-pushed� domestic reforms, and CA global
reputation.
4.1.1 DR-CAFTA negotiation
DR-CAFTA was rati�ed by almost all member countries in year 2005. The exception was Costa Rica.
The Congress rati�ed the Agreement until 2008 after a referendum in September 2007. In general, DR-
CAFTA is aimed at consolidating CBI market access bene�ts and extending it to previously excluded
sectors. Furthermore, important provisions and legal requirements were included to improve investment
opportunities in CA.
Almost no agricultural products are excluded from DR-CAFTA. Tari¤s will be eliminated for all
products, except sugar for the United States, fresh potatoes and fresh onions for Costa Rica, and white
corn for the rest of Central America. More than half of current US agricultural exports to Central
America will become duty-free immediately. Each Central American country will have a separate
schedule of commitments providing access for US products. The United States will provide the same
tari¤ treatment to each of the �ve countries, but will make country-speci�c commitments on tari¤-rate
quotas.
Sensitive sectors were granted special treatment (safeguards, protection from imported goods, spe-
ci�c schedules for tari¤ phase-out) under DR-CAFTA. To address asymmetrical development and tran-
sition issues, DR-CAFTA speci�es rules for lengthy tari¤ phase-out schedules as well as transitional
safeguards and tari¤ rate quotas (TRQs) for sensitive goods in Central America. Although almost all
goods will attain immediate duty-free treatment, others will have tari¤s phased out incrementally so
that duty-free treatment is reached in 5, 10, 15, or 20 years. Duty-free treatment would be delayed and
in some cases, the tari¤ reductions would not begin until 7 or 12 years into the agreement (see Table
12).
Table 12: Tari¤ Reduction Schedule for Sensitive Agricultural Products under DR-CAFTA
Product IT PP GP IT PP GP IT PP GP IT PP GP IT PP GP(%) (yrs) (yrs) (%) (yrs) (yrs) (%) (yrs) (yrs) (%) (yrs) (yrs) (%) (yrs) (yrs)
Beef* n.a. 10 0 15 15 6 15 15 0 15 15 3 15 15 4Pork 15 15 0 15 15 0 40 15 6 15 15 0 47 15 6Poultry 164.4 18 10 164.4 18 0 164.4 18 10 164.4 18 10 151 17 10Diaryproducts
15 20 10 15 20 10 40 20 10 40 20 10 66 20 10
Yellowmaize
n.a. 10 0 45 15 6 15 15 6 15 15 0 15 15 0
Beans 20 15 6 15 15 0 20 15 15 30 15 0 47 15 0Freshpotatoes
15 15 0 15 15 0 15 13 0 15 15 0
Rice 29.2 18 10 45 18 10 40 18 10 63 18 10 36 20 10Sorghum 0 0 0 15 15 0 15 15 0 20 15 6 15 15 0
Costa Rica
Excluded
*Beef products other than prime and choice cutsIT: initial tariff; PP: phaseout period; GP: grace period; n.a.= not availableSource: CEPAL (2004)
Guatemala Honduras El Salvador Nicaragua
On the other hand, textiles and apparel will be duty-free and quota-free immediately if they meet
the agreement�s rule of origin. The agreement�s bene�ts for textiles and apparel will be retroactive to
January 1st 2004. Some apparel made in Central America that contains certain fabrics from NAFTA
partners (Mexico and Canada) will have duty-free access. A de minimis provision will allow limited
44

amounts of third-country content to go into DR-CAFTA apparel, giving producers in both the US and
Central America needed �exibility.
In addition, one of DR-CAFTA�s main objectives is to implement a secure and predictable legal
framework for investors. All forms of investment are protected under the agreement, including en-
terprises, debt, concessions, contracts and intellectual property. Pursuant to US Trade Promotion
Authority, the agreement draws from US legal principles and practices to provide US investors in CA a
basic set of substantive protections that Central American investors currently enjoy under the US legal
system.
4.1.2 EU-CAAA negotiation
Central American and European Union countries announced at May 12, 2006, during the Fourth EU-
Latin America Presidential meeting in Vienna, their intention to start a Free Trade Agreement (FTA)
negotiation process. After several informal meetings, discussion events and preparation workshops, at
a national and regional level, formal negotiations of an Association Agreement between the European
Union and Central America (EU-CAAA) started in June 2007.29 Currently, seven rounds of negotiations
have been completed. The rati�cation of the Agreement is expectd in 2010.
Association Agreements negotiated by the EU are di¤erent to traditional FTAs. The Agreements
comprehend not only economic (trade) issues, but additional components related to political dialogue
and development cooperation. These are the previous steps to the consolidation of a Free Trade Zone
between signatory countries. Central American integration strengthening would also be a key element.
Indeed, the EU cooperation strategy for 2007-2013 includes regional integration as a key component for
development assistance and resource allocation.
The Central American integration process has been reactivated in recent years. At present, 35
percent of trade is intraregional. The �ve members of the Central American Common Market (CACM)
agreed in 1995 to reduce their common external tari¤ to a maximum of 15 percent. The region has one of
the lowest average tari¤ rates of the world, as a result of a unilateral process of trade liberalization and
a strong commitment to global integration. However, selected agricultural commodities are protected
with tari¤s that signi�cantly exceed the 15 percent common external tari¤ ceiling (see Table 13). These
specially protected commodities include dairy products, rice, sugar, and poultry. In addition, the use
of non-tari¤ barriers has decreased signi�cantly in recent years; although some of these barriers are still
relevant.
4.2 Macroeconomic e¤ects of the trade scenarios
Since the implementation of NAFTA in the early 1990s, CGE modeling has become the main empirical
tool to assess the impact of free trade agreements. The considerable economy-wide e¤ects expected
from the policy shocks associated with trade openness require the use of general equilibrium analysis.
Moreover, theoretical models and databases have been undertaking continual improvements over the
years to match the extensive use of CGE models.
29 Initial talks to pursue an FTA with the EU started years ago, during the �rst EU-LA Presidential Meeting at Riode Janeiro, Brazil (1999). However, a cooperation agreement signed in year 1993 at San Salvador is perhaps the �rstmoment when the idea of an Association Agreement started. The agreement idea was strengthened in 2002, at the MadridPresidential Meeting.
45

Table 13: Main trade barriers in Central AmericaGuatemala El Salvador Honduras Nicaragua Costa Rica
7.1 6.9 7.1 5.1 7.1Capital goods 0 0 1 0 0Inputs 0 0 1 0 0Intermediate Goods 5 – 10 5 – 10 5 – 10 5 5 – 10Final Goods 15 15 15 15 15
Diary products (Milk) 15 40 20 40 65Corn (yellow) 5 – 35 0 20 030 1Rice 32 40 35 62 35Sugar 20 40 40 55 50Pork meat 15 40 15 15 48Chicken meat 15 20 50 170 150
Countervailing & antidumping X X X X XSafeguards X X X X XNonautomatic licensing X X XSPS Prohibitions X X X X XTariff Rate Quotas X X X X XPrice Band Controls X
Average nominal external tariff
Most Protected Industries (%)
NonTariff Barriers
Source: Own elaboration with information from SIECA, www.sieca.org.gt
Average Tariffs (%)
In this study we aggregate the GTAP7 database in 40 sectors and 9 regions: Costa Rica (CRC),
Guatemala (GUA), Nicaragua (NIC), Panama (PAN), Rest of Central America (RCA), United States
(USA), European Union (EU27), China (CHN), and Rest of the World (ROW). The sector aggregation
was done considering the relevant exporting and importing sectors for Costa Rica, Nicaragua and
Central America.30
4.2.1 Baseline case
The baseline case takes 2004 as the starting point and it then applies the di¤erent growth rates explained
in section 3:1:2: This simulation represents the business as usual scenario, which does not include the
trade nor the human capital policy shocks. The growth path of GDP is described in Figure 8. For both
countries, GDP growth is around 3% by year, which determines the exponential increase in GDP levels.
Analyzing changes in the productive sectors, the evolution is diverse among Costa Rica and Nicaragua.
Agriculture and agricultural industries show continuous growth in both countries (dairy, traditional
crops, cattle, sugar) with the exception of meat in Nicaragua. However, for both countries in most
manufacturing sectors are growing faster than agriculture. In addition, the energy and services sectors
show sustained growth along the projected period (Table 14).
In what follows, the results from the di¤erent scenarios are presented in a sequential way. First the
ATC-protocol is implemented in 2005, together with the expansion of the EU from 25 to 27 members.
Then DR-CAFTA is implemented starting in 2006 and 2008 in Nicaragua and Costa Rica, respectively.
Finally, EU-CAAA is implemented in 2011 in both countries. We analyze each scenario below using
sectoral production changes to see disaggregated e¤ects and relative changes in private consumption.
Changes in factor prices and �nal goods prices are analyzed when we discuss the poverty impacts of
30Sectoral de�nitions and groupings can be found in the Appendix
46

Figure 8: Costa Rica and Nicaragua, GDP growth path, relative changes with respect to base year
1
1,2
1,4
1,6
1,8
2
2,2
2,4
2,6
2004 2007 2010 2013 2016 2019 2022 2025 2028
NIC CRC
each scenario. While aggregated production (GDP) is analyzed in the next section when we simulate
the human capital polices.
In our recursive dynamic model, there is no intertemporal optimization of consumption and in-
vestments, and thus, we cannot construct a strict welfare indicator. However, the changes in private
consumption in real terms, is an indirect measure of the increase in household utility over time. In what
follows, we use consumption as our main indicator of welfare improvements.
4.2.2 ATC-protocol scenario
The global liberalization of textile and clothing quotas at the beginning of 2005 under the Agreement on
Textiles and Clothing (ATC-protocol) has already opened the US and EU markets for Chinese exports.
This fact is very relevant for Central American textile and apparel (T&A) products and has already
produced a signi�cant increase of Chinese exports to the US and Europe. Hence, to assess the current
international setting in the T&A sector, we eliminate the textile quotas for Chinese imports to the US
and EU in 2005, as a pre-experiment condition in our baseline estimations. Subsequently, we use the
updated database for our DR-CAFTA simulations.
Given the highly signi�cant participation of China in the world market, we consider it necessary to
include this event prior to our FTAs estimations, and this is a contribution of this paper with respect
to previous CGE assessments. From Table 15 we observe that with the implementation of the ATC-
protocol, the T&A sector shrinks in Costa Rica and Nicaragua, evidencing an important market share
loss of Central American countries. The resource reallocation from T&A sector to other industries
is important in both Central American countries. Many alternative industries grow signi�cantly as a
result, with a diversi�cation of the productive structure. The impact on agriculture and agro-industries
is diverse. In some cases activities grow while others shrink.
From Figure 9 we observe that the impact of the ATC-protocol implementation on consumption
is signi�cantly negative for Nicaragua with a reduction of more than 2% with respect to the baseline
values. The importance of this single sector (T&A), which is based on maquila production, is evident
47

Table 14: Baseline scenario, sectoral growth rates, relative changes from base year
Code Sector 2010 2020 2030 2010 2020 2030
PDR Paddy_rice 0.20 0.58 0.98 0.15 0.43 0.75WHT Wheat 0.66 2.12 3.73 0.79 3.00 5.80GRO Other_cereal 0.23 0.65 1.06 0.16 0.47 0.84V_F Veg_fruits 0.18 0.50 0.83 0.17 0.48 0.84OSD Oil_seeds 0.18 0.50 0.83 0.18 0.50 0.82C_B Sugar_cane 0.13 0.38 0.68 0.13 0.39 0.70PFB Plant_fibers 0.20 0.58 1.00 0.17 0.51 0.91OCR Crops_nec 0.11 0.31 0.53 0.12 0.31 0.50CTL Cattle 0.16 0.47 0.85 0.08 0.24 0.42OAP Animprod_nec 0.16 0.47 0.82 0.15 0.43 0.74RMK Raw_milk 0.19 0.55 0.98 0.11 0.31 0.54WOL Wool 0.24 0.80 1.57 0.17 0.42 0.62FRS Forestry 0.11 0.30 0.48 0.14 0.33 0.45FSH Fishing 0.09 0.16 0.20 0.05 0.13 0.20OMN Minerals_nec 0.19 0.39 0.46 0.13 0.17 0.18CMT Meat 0.23 0.73 1.40 0.01 0.14 0.40OMT Meatprod_nec 0.24 0.74 1.40 0.21 0.65 1.16VOL Veg_oils 0.27 0.87 1.73 0.23 0.66 1.14MIL Dairy 0.26 0.83 1.59 0.20 0.64 1.23PCR Proc_rice 0.24 0.71 1.27 0.22 0.68 1.29SGR Sugar 0.20 0.62 1.18 0.20 0.64 1.21OFD Foodprod_nec 0.21 0.60 1.00 0.20 0.63 1.20B_T Bev_tobacco 0.22 0.70 1.38 0.25 0.80 1.60TEX Textiles 0.34 1.18 2.44 0.11 0.30 0.48WAP Apparel 0.33 1.13 2.34 0.14 0.37 0.50LEA Leather 0.54 2.15 5.27 0.20 0.58 0.99LUM Wood_prod 0.25 0.75 1.29 0.18 0.52 0.86PPP Paper_prod 0.25 0.81 1.61 0.34 1.17 2.45CRP Chemical_pla 0.32 1.07 2.20 0.34 1.13 2.29NMM Minprod_nec 0.25 0.80 1.62 0.23 0.69 1.22I_S Ferrous_met 0.29 1.00 2.26 0.44 1.86 5.44
NFM Metals_Nec 0.37 1.42 4.23 0.29 1.11 3.58FMP Metal_prods 0.30 0.99 2.01 0.40 1.38 2.95MVH Motor_veh 0.28 0.93 1.89 0.38 1.33 2.84OTN Trans_eq_nec 0.25 0.93 2.07 0.51 1.83 3.83ELE Electronic 0.08 0.21 0.33 0.57 2.17 4.96OME Machine_nec 0.12 0.41 0.83 0.47 1.75 3.86OMF Manufact_nec 0.26 0.77 1.28 0.61 2.82 9.57SRV Services 0.19 0.60 1.16 0.20 0.64 1.24ENE Energy 0.29 0.95 1.91 0.37 1.42 3.59
Source: Ow n elaboration
Costa Rica Nicaragua
48
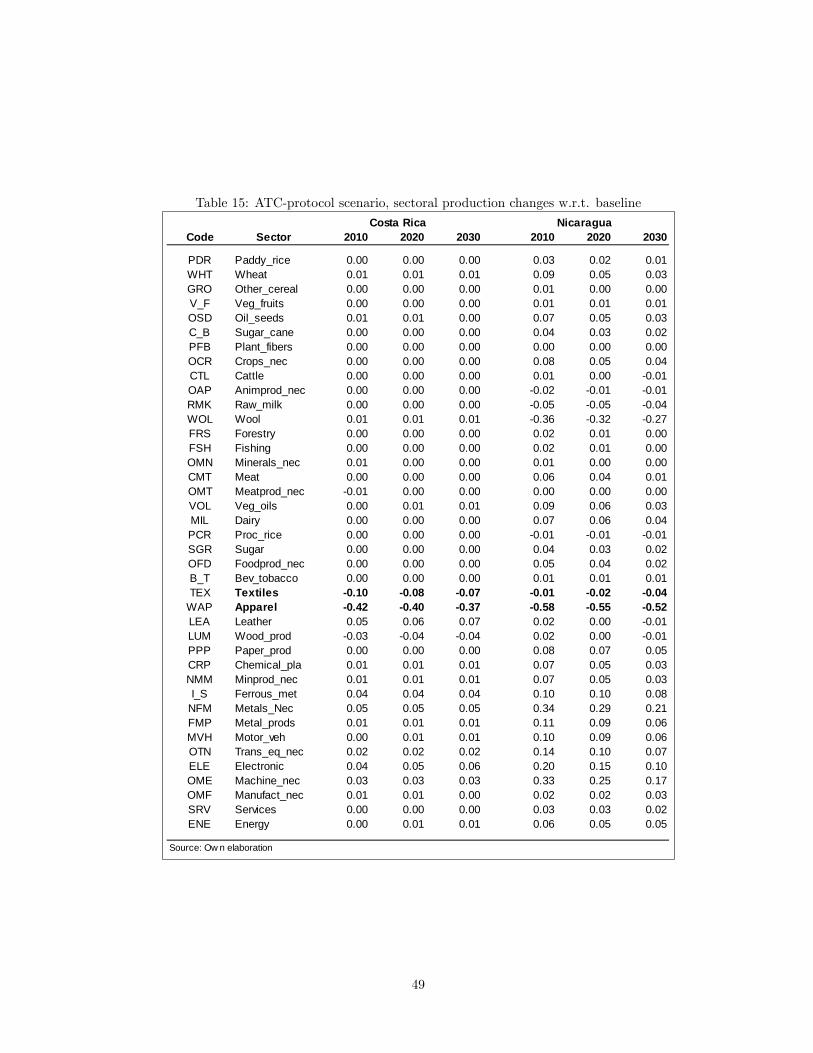
Table 15: ATC-protocol scenario, sectoral production changes w.r.t. baseline
Code Sector 2010 2020 2030 2010 2020 2030
PDR Paddy_rice 0.00 0.00 0.00 0.03 0.02 0.01WHT Wheat 0.01 0.01 0.01 0.09 0.05 0.03GRO Other_cereal 0.00 0.00 0.00 0.01 0.00 0.00V_F Veg_fruits 0.00 0.00 0.00 0.01 0.01 0.01OSD Oil_seeds 0.01 0.01 0.00 0.07 0.05 0.03C_B Sugar_cane 0.00 0.00 0.00 0.04 0.03 0.02PFB Plant_fibers 0.00 0.00 0.00 0.00 0.00 0.00OCR Crops_nec 0.00 0.00 0.00 0.08 0.05 0.04CTL Cattle 0.00 0.00 0.00 0.01 0.00 0.01OAP Animprod_nec 0.00 0.00 0.00 0.02 0.01 0.01RMK Raw_milk 0.00 0.00 0.00 0.05 0.05 0.04WOL Wool 0.01 0.01 0.01 0.36 0.32 0.27FRS Forestry 0.00 0.00 0.00 0.02 0.01 0.00FSH Fishing 0.00 0.00 0.00 0.02 0.01 0.00OMN Minerals_nec 0.01 0.00 0.00 0.01 0.00 0.00CMT Meat 0.00 0.00 0.00 0.06 0.04 0.01OMT Meatprod_nec 0.01 0.00 0.00 0.00 0.00 0.00VOL Veg_oils 0.00 0.01 0.01 0.09 0.06 0.03MIL Dairy 0.00 0.00 0.00 0.07 0.06 0.04PCR Proc_rice 0.00 0.00 0.00 0.01 0.01 0.01SGR Sugar 0.00 0.00 0.00 0.04 0.03 0.02OFD Foodprod_nec 0.00 0.00 0.00 0.05 0.04 0.02B_T Bev_tobacco 0.00 0.00 0.00 0.01 0.01 0.01TEX Textiles 0.10 0.08 0.07 0.01 0.02 0.04
WAP Apparel 0.42 0.40 0.37 0.58 0.55 0.52LEA Leather 0.05 0.06 0.07 0.02 0.00 0.01LUM Wood_prod 0.03 0.04 0.04 0.02 0.00 0.01PPP Paper_prod 0.00 0.00 0.00 0.08 0.07 0.05CRP Chemical_pla 0.01 0.01 0.01 0.07 0.05 0.03NMM Minprod_nec 0.01 0.01 0.01 0.07 0.05 0.03I_S Ferrous_met 0.04 0.04 0.04 0.10 0.10 0.08
NFM Metals_Nec 0.05 0.05 0.05 0.34 0.29 0.21FMP Metal_prods 0.01 0.01 0.01 0.11 0.09 0.06MVH Motor_veh 0.00 0.01 0.01 0.10 0.09 0.06OTN Trans_eq_nec 0.02 0.02 0.02 0.14 0.10 0.07ELE Electronic 0.04 0.05 0.06 0.20 0.15 0.10OME Machine_nec 0.03 0.03 0.03 0.33 0.25 0.17OMF Manufact_nec 0.01 0.01 0.00 0.02 0.02 0.03SRV Services 0.00 0.00 0.00 0.03 0.03 0.02ENE Energy 0.00 0.01 0.01 0.06 0.05 0.05
Source: Ow n elaboration
Costa Rica Nicaragua
49

for Nicaragua. In the case of Costa Rica the impact is also negative but close to zero. This re�ects the
small proportion of Costa Rican exports in the T&A sector.31
Figure 9: ATC scenario, consumption changes w.r.t. baselne
0,025
0,02
0,015
0,01
0,005
0
0,005
0,01
0,015
0,02
2004 2007 2010 2013 2016 2019 2022 2025 2028
NIC CRC
4.2.3 DR-CAFTA Scenario
Once we ran the scenario with the quota reduction to Chinese exports of T&A, we proceeded to estimate
the impact of DR-CAFTA. This calculation is done by assuming a full liberalization of trade between
the US and Central America in 2006 (for the case of Costa Rica in 2008), as well as free trade within
CA. Thus, we reduce all tari¤s between both regions to zero and eliminate all tari¤s within CA; but
keep the original tari¤s with the other 7 regions. In accordance with the agricultural exclusions made
in the agreement we do not remove the tari¤s for sugar from CA to the US, and implement a phase-out
period for sensitive goods from the US to CA using a GTAP7 classi�cation adaptation (Table 16). In
addition, some minor quotas across both regions and within CA were also eliminated.
In Table 17 we present the sectoral production changes for the DR-CAFTA scenario. First, we
observe that most agriculture sectors are either slightly decreasing or remaining the same as in the
baseline levels, for both Costa Rica and Nicaragua. However, there are some exceptions like raw milk
and dairy products in both countries and oilseeds in Nicaragua. The production of the apparel sector
falls signi�cantly compared to the baseline, but less than in the previous scenario for the ATC-protocol,
while the textile sector is experiencing a strong expansion. Since each scenario builds upon the last,
this means that DR-CAFTA is partly compensating for the negative e¤ects of the stronger Chinese
competition in T&A markets. But it is also creating a specialization in the textile sector away from the
apparel sector. On the other hand, many industrial sectors experience an increase in production with
respect to baseline values, in both countries. In the case of the US (not reported), the only relevant
31 In the case of Guatemala and the other Central American countries (El Salvador and Honduras), the impact of theATC protocol on T&A production is very important. The impact of China�s competition on these countries is strongerthan in Nicaragua. These results are not presented here, but are available on request.
50

Table 16: Phase-out schedule for sensitive goods from DR-CAFTA, changes relative to base tari¤ byyear
GTAP sector: GRO PDR MIL OMT SGR GRO PDR MIL OMT SGR
Description:WhiteCorn
PaddyRice
DiaryProducts
Meat SugarWhiteCorn
PaddyRice
DiaryProducts
Meat(Pork,
Bovine,
Sugar
Base Tariff 15.0 36.0 66.0 40.2 47.0 Excluded 63.0 40.0 90.0 55.0Year 1 6.7 0.0 0.0 0.0 6.7 0.0 0.0 0.0 2.2 6.7Year 2 7.1 0.0 0.0 0.0 7.1 0.0 0.0 0.0 4.4 13.3Year 3 7.1 0.0 0.0 0.0 7.7 0.0 0.0 0.0 6.7 20.0Year 4 8.3 0.0 0.0 0.0 8.3 0.0 0.0 0.0 11.7 26.7Year 5 9.1 0.0 0.0 2.2 9.1 0.0 0.0 0.0 16.7 33.3Year 6 10.0 0.0 0.0 2.2 10.0 0.0 0.0 0.0 21.7 40.0Year 7 11.1 0.0 0.0 3.8 11.1 0.0 0.0 0.0 26.7 46.7Year 8 12.5 0.0 0.0 3.9 12.5 0.0 0.0 0.0 31.7 53.3Year 9 14.3 0.0 0.0 4.1 14.3 0.0 0.0 0.0 36.7 60.0
Year 10 16.7 0.0 0.0 4.9 16.7 0.0 0.0 0.0 41.7 66.7Year 11 20.0 8.0 10.0 15.1 20.0 0.0 12.5 10.0 50.8 73.3Year 12 25.0 8.7 11.1 17.7 25.0 0.0 25.0 11.1 60.0 80.0Year 13 33.3 9.5 12.5 21.5 33.3 0.0 37.5 12.5 69.2 86.7Year 14 50.0 10.5 14.3 29.7 50.0 0.0 50.0 14.3 78.3 93.3Year 15 100.0 11.8 16.7 42.2 100.0 0.0 62.5 16.7 87.5 100.0Year 16 20.0 20.0 50.0 0.0 75.0 20.0 75.0Year 17 25.0 25.0 100.0 0.0 87.5 25.0 87.5Year 18 33.3 33.3 0.0 100.0 33.3 100.0Year 19 50.0 50.0 0.0 50.0Year 20 100.0 100.0 0.0 100.0
Source: ow n elaboration w ith information from Sánchez (2007) and DRCAFTA Country Text Annexes
NicaraguaCosta Rica
result is a reduction in the production of the T&A sector, but for the rest of sectors there are no
signi�cant changes.
The impact of DR-CAFTA on the GDP and consumption for the United States is negligible. In
Figure 10 we show the consumption e¤ects for Costa Rica and Nicaragua. For Costa Rica we see a
signi�cant increase of 1% after the implementation of the agreement, which gradually is reduced over
time. For Nicaragua, the ATC protocol impacts are still observed before 2007. However, when DR-
CAFTA is implemented consumption jumps 2% to o¤set the negative impact of the ATC protocol.
Later on consumption continues growing to reach almost 0.5% in 2030.
For the other Central America countries (not presented), DR-CAFTA also compensates for the
consumption losses driven from higher competition from Chinese products in the US T&A market.
Provided that the current CBI assures market access to many Central American products, in our
baseline scenario, DR-CAFTA is more than compensating for the negative e¤ects of the Chinese quota
reduction in T&A.
4.2.4 EU-CAAA Scenario
The EU-CAAA scenario is sequential with the other two trade policy shocks. Thus, we �rst include the
application of the Agreement on Textiles and Clothing (ATC) protocol in 2005, which expands China�s
exports of apparel and textile products to the US and the EU, and increases competition with Central
51

Table 17: DR-CAFTA scenario, sectoral production changes w.r.t. baseline
Code Sector 2010 2020 2030 2010 2020 2030
PDR Paddy_rice 0.01 0.02 0.06 0.04 0.10 0.13WHT Wheat 0.00 0.00 0.01 0.02 0.02 0.02GRO Other_cereal 0.01 0.02 0.06 0.01 0.00 0.01V_F Veg_fruits 0.00 0.00 0.00 0.01 0.01 0.01OSD Oil_seeds 0.00 0.00 0.01 0.29 0.22 0.19C_B Sugar_cane 0.00 0.00 0.00 0.01 0.01 0.01PFB Plant_fibers 0.01 0.01 0.00 0.01 0.00 0.00OCR Crops_nec 0.01 0.00 0.00 0.00 0.01 0.01CTL Cattle 0.00 0.00 0.00 0.01 0.01 0.00OAP Animprod_nec 0.00 0.01 0.02 0.01 0.01 0.01RMK Raw_milk 0.10 0.07 0.04 0.04 0.03 0.02WOL Wool 0.03 0.03 0.03 0.15 0.12 0.08FRS Forestry 0.01 0.00 0.00 0.00 0.00 0.00FSH Fishing 0.00 0.00 0.00 0.01 0.00 0.00OMN Minerals_nec 0.01 0.00 0.00 0.00 0.00 0.00CMT Meat 0.00 0.00 0.00 0.03 0.02 0.00OMT Meatprod_nec 0.00 0.01 0.03 0.00 0.01 0.02VOL Veg_oils 0.00 0.01 0.03 0.14 0.12 0.11MIL Dairy 0.11 0.08 0.05 0.13 0.09 0.02PCR Proc_rice 0.01 0.00 0.02 0.12 0.07 0.03SGR Sugar 0.00 0.00 0.00 0.01 0.01 0.00OFD Foodprod_nec 0.00 0.00 0.01 0.01 0.04 0.05B_T Bev_tobacco 0.01 0.01 0.00 0.01 0.01 0.00TEX Textiles 0.06 0.06 0.05 0.47 0.42 0.37
WAP Apparel 0.35 0.32 0.29 0.42 0.37 0.33LEA Leather 0.07 0.08 0.10 0.02 0.02 0.02LUM Wood_prod 0.06 0.06 0.06 0.02 0.02 0.02PPP Paper_prod 0.01 0.01 0.00 0.03 0.02 0.01CRP Chemical_pla 0.00 0.00 0.01 0.02 0.01 0.01NMM Minprod_nec 0.00 0.01 0.01 0.03 0.02 0.01I_S Ferrous_met 0.05 0.05 0.04 0.05 0.04 0.03
NFM Metals_Nec 0.04 0.04 0.04 0.12 0.10 0.07FMP Metal_prods 0.01 0.01 0.01 0.04 0.03 0.02MVH Motor_veh 0.00 0.00 0.00 0.03 0.02 0.02OTN Trans_eq_nec 0.09 0.07 0.05 0.05 0.04 0.03ELE Electronic 0.00 0.02 0.03 0.00 0.01 0.01OME Machine_nec 0.25 0.23 0.21 0.33 0.27 0.22OMF Manufact_nec 0.02 0.01 0.01 0.03 0.02 0.00SRV Services 0.01 0.01 0.01 0.01 0.01 0.01ENE Energy 0.03 0.03 0.02 0.02 0.01 0.00
Source: Ow n elaboration
Costa Rica Nicaragua
52

Figure 10: DR-CAFTA scenario, consumption changes w.r.t. baseline
0,025
0,02
0,015
0,01
0,005
0
0,005
0,01
0,015
0,02
2004 2007 2010 2013 2016 2019 2022 2025 2028
NIC CRC
American products. In the second sequential adjustment we apply the DR-CAFTA base case scenario
implementation, as described in Section 4.2.3. The implementation of the EU-CAAA is assumed to
begin in 2011.
The outcome of this scenario provides useful information, not only about the magnitude of the
potential macroeconomic e¤ects of EU-CAAA, but also about the comparative results between di¤erent
prospective negotiation outcomes. However, since the agreement is still being negotiated we must assume
the main negotiation outcomes. Thus, we simulate total liberalization: all tari¤s and quotas between
Central America and EU are eliminated, excluding two main sensitive sectors, sugar and bananas exports
from Central America to the European Union. For these sectors, we assume that the negotiated tari¤s
decrease by 50%.
The sectoral production results are shown in Table 18. The changes resulting from EU-CAAA are
di¤erent between Costa Rica and Nicaragua. For Costa Rica we observe a decrease in most agricultural
production. However, the vegetable and fruits sector �where bananas are included�experiences a 5%
increase by 2030. This re�ects the decline in the EU tari¤s for this product. On the other hand, we do
not observe changes in the production of sugar cane or processed sugar after the EU tari¤ reduction.
This is a re�ection of a very high initial base tari¤, which is still prohibitive after a 50% decrease. For
Nicaragua we observe that some agricultural sectors are expanding, most prominently oil seeds. While
other are decreasing and there is no change in the vegetable and fruits sector, since Nicaragua does not
export many bananas.
For both countries we observe an increase in many agro-industrial and industrial sectors. The
exceptions are textiles and apparel in both countries as a result of the ATC protocol. The electronics
sector in Costa Rica also experiences an important production decrease.
There is no signi�cant impact of EU-CAAA on the EU macroeconomic indicators. This is a conse-
quence of the very low share of Central American trade in terms of total EU trade. In Figure 11 we
show the consumption changes after the implementation of the EU-CAAA.
53

Table 18: EU-CAAA scenario, sectoral production changes w.r.t. baseline
Code Sector 2010 2020 2030 2010 2020 2030
PDR Paddy_rice 0.01 0.05 0.08 0.04 0.10 0.13WHT Wheat 0.00 0.13 0.10 0.02 0.02 0.02GRO Other_cereal 0.01 0.04 0.08 0.01 0.00 0.00V_F Veg_fruits 0.00 0.06 0.05 0.01 0.01 0.00OSD Oil_seeds 0.00 0.03 0.03 0.29 0.22 0.19C_B Sugar_cane 0.00 0.00 0.00 0.01 0.01 0.01PFB Plant_fibers 0.01 0.03 0.03 0.01 0.00 0.00OCR Crops_nec 0.01 0.03 0.03 0.00 0.01 0.01CTL Cattle 0.00 0.01 0.01 0.01 0.00 0.00OAP Animprod_nec 0.00 0.02 0.04 0.01 0.01 0.01RMK Raw_milk 0.10 0.05 0.02 0.04 0.02 0.02WOL Wool 0.03 0.02 0.02 0.15 0.11 0.07FRS Forestry 0.01 0.01 0.00 0.00 0.00 0.00FSH Fishing 0.00 0.00 0.00 0.01 0.00 0.00OMN Minerals_nec 0.01 0.01 0.00 0.00 0.00 0.00CMT Meat 0.00 0.01 0.01 0.03 0.02 0.00OMT Meatprod_nec 0.00 0.02 0.05 0.00 0.00 0.01VOL Veg_oils 0.00 0.00 0.02 0.14 0.13 0.12MIL Dairy 0.11 0.06 0.03 0.13 0.08 0.01PCR Proc_rice 0.01 0.01 0.02 0.12 0.07 0.03SGR Sugar 0.00 0.00 0.00 0.01 0.01 0.01OFD Foodprod_nec 0.00 0.01 0.01 0.01 0.04 0.06B_T Bev_tobacco 0.01 0.01 0.01 0.01 0.01 0.00TEX Textiles 0.06 0.03 0.03 0.47 0.43 0.38
WAP Apparel 0.35 0.30 0.27 0.42 0.37 0.32LEA Leather 0.07 0.14 0.15 0.02 0.03 0.02LUM Wood_prod 0.06 0.06 0.08 0.02 0.02 0.02PPP Paper_prod 0.01 0.01 0.01 0.03 0.01 0.01CRP Chemical_pla 0.00 0.03 0.03 0.02 0.01 0.01NMM Minprod_nec 0.00 0.00 0.01 0.03 0.01 0.00I_S Ferrous_met 0.05 0.06 0.05 0.05 0.04 0.03
NFM Metals_Nec 0.04 0.03 0.04 0.12 0.12 0.09FMP Metal_prods 0.01 0.02 0.02 0.04 0.02 0.02MVH Motor_veh 0.00 0.00 0.00 0.03 0.01 0.01OTN Trans_eq_nec 0.09 0.09 0.07 0.05 0.04 0.03ELE Electronic 0.00 0.19 0.18 0.00 0.01 0.01OME Machine_nec 0.25 0.31 0.27 0.33 0.28 0.23OMF Manufact_nec 0.02 0.02 0.01 0.03 0.03 0.02SRV Services 0.01 0.00 0.00 0.01 0.01 0.01ENE Energy 0.03 0.02 0.02 0.02 0.01 0.00
Source: Ow n elaboration
Costa Rica Nicaragua
54

Figure 11: EU-CAAA scenario, consumption changes w.r.t. baseline
0,025
0,02
0,015
0,01
0,005
0
0,005
0,01
0,015
0,02
2004 2007 2010 2013 2016 2019 2022 2025 2028
NIC CRC
We observe that the broad pattern of consumption is maintained, however, there is an increase
of around 0.5% in consumption for Costa Rica �when compared to the DR-CAFTA scenario. For
Nicaragua, there are almost no consumption changes. This is a consequence of the initial low levels
of trade that Nicaragua has with the EU and that a potential export product such as sugar, still has
prohibitive tari¤s even with the 50% reduction we simulated.
4.2.5 Final remarks on the CGE simulations of trade policies
Costa Rica and Nicaragua can expect signi�cant and lasting bene�ts from both FTAs. However, we are
only considering here the static adjustments related to these agreements. We do not account for dy-
namic e¤ects such as increased FDI in�ows, trade facilitation mechanisms that can reduce international
transportation costs nor productivity changes associated with increased trade �ows. There is a large
literature that relates trade with economic growth. Yet, there is a large debate about how to isolate the
e¤ect of trade liberalization from other economic policies that are usually carried out together. Thus,
there is no empirical link between trade �ows and TFP changes. Moreover, FDI in�ows are extremely
di¢ cult to model in a dynamic recursive framework where investment is not optimally decided over
time. To construct such a framework is beyond the scope of this study and therefore, we remain with
our static e¤ects. These can be considered to be a lower bound of the potential bene�ts of these FTAs.
4.3 Poverty e¤ects of the trade scenarios
This section presents the simulation results using the top-down approach, which combines the dynamic
CGE model with the microsimulations using household survey data. As explained in section 3.1.3, these
household surveys have data on both expenditures and incomes by household and by person. We use
both changes in expenditures and incomes to estimate changes in real incomes.
The impact of FTAs on poverty depends on how factor and food products prices change as a result of
trade agreements implementation. For poorer households, wages and food prices are the most relevant
55

variables. Both in Costa Rica and Nicaragua, income of the poorest household depends signi�cantly on
low-skill workers wages, while food goods represent and important share of total consumption. These
results were already presented in section 3.1.3. Therefore, we obtain the factor and �nal goods changes
from each scenario in the CGE model. With this information we determine the impact of each scenario
on poverty.
Following this methodology, we �rst analyze how wages for both skill types �high and low skill�
change for each scenario. In Figure 12 we plot the dynamic path of low-skill wages for our three trade
scenarios in Costa Rica. Is it important to remember that these trade scenarios are sequential, and
thus, DR-CAFTA scenario includes both this agreement and the ATC-protocol, while the EU-CAAA
scenario includes all the three trade shocks.
Figure 12: Costa Rica, changes in low-skill wages relative to baseline values
0,5%
0,4%
0,3%
0,2%
0,1%
0,0%
0,1%
0,2%
0,3%
0,4%
0,5%
2004
2005
2006
2007
2008
2009
2010
2011
2012
2013
2014
2015
2016
2017
2018
2019
2020
2021
2022
2023
2024
2025
2026
2027
2028
2029
2030
ATCprotocol DRCAFTA EUCAAA
The wages of low-skill workers in Costa Rica experience an expected decrease after the implemen-
tation of the ATC-protocol, which represents more competitions from low-skill intensive goods from
China. This initial decrease, however, is reversed after the DR-CAFTA agreement, where wages in-
crease by 0.5%. The implementation of the EU-CAAA agreement also has a positive impact on low-skill
wages, but it is about only 0.1%.
On the other hand, Figure 13 shows the changes in high-skill wages. In this case we see that all three
trade scenarios decrease the wages of high-skill workers signi�cantly. This are less intuitive results. The
ATC-protocol is decreasing high-skill wages, while DR-CAFTA increases them by more than 0.5% but
with the EU-CAAA returns wages to their ATC-protocol levels. In general, following standard trade
theory, more competition with relatively skill abundant regions such as the EU and the USA is expected
to hurt the wages of high-skill workers. However, in the case of Costa Rica, it seems that the T&A
sector had an important component of high-skill factor content. This can be a consequence of Costa
Rica competing in a specialized niche of the T&A market that does not rely entirely on cheap labour
to be competitive.
The wage results from our trade scenarios are very di¤erent for Nicaragua. Figure 14 we show the
dynamic changes for low-skill wages and in Figure 15 for high-skill wages. For both types of wages we
56
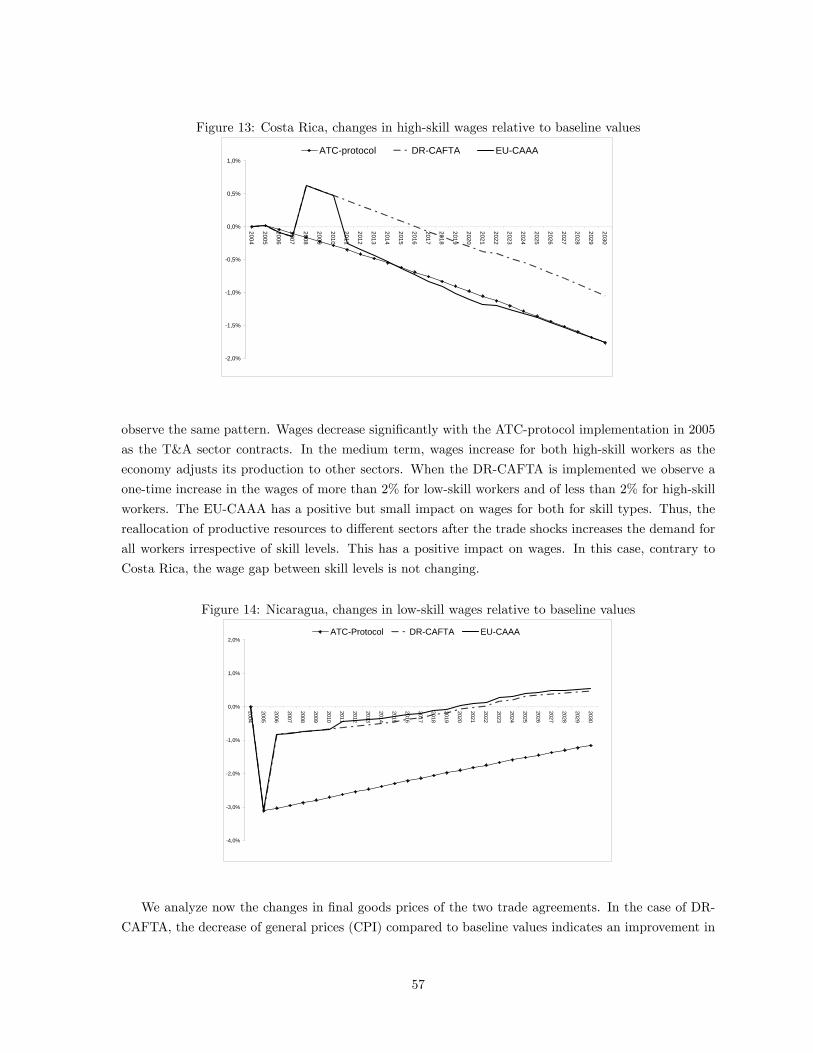
Figure 13: Costa Rica, changes in high-skill wages relative to baseline values
2,0%
1,5%
1,0%
0,5%
0,0%
0,5%
1,0%
2004
2005
2006
2007
2008
2009
2010
2011
2012
2013
2014
2015
2016
2017
2018
2019
2020
2021
2022
2023
2024
2025
2026
2027
2028
2029
2030
ATCprotocol DRCAFTA EUCAAA
observe the same pattern. Wages decrease signi�cantly with the ATC-protocol implementation in 2005
as the T&A sector contracts. In the medium term, wages increase for both high-skill workers as the
economy adjusts its production to other sectors. When the DR-CAFTA is implemented we observe a
one-time increase in the wages of more than 2% for low-skill workers and of less than 2% for high-skill
workers. The EU-CAAA has a positive but small impact on wages for both for skill types. Thus, the
reallocation of productive resources to di¤erent sectors after the trade shocks increases the demand for
all workers irrespective of skill levels. This has a positive impact on wages. In this case, contrary to
Costa Rica, the wage gap between skill levels is not changing.
Figure 14: Nicaragua, changes in low-skill wages relative to baseline values
4,0%
3,0%
2,0%
1,0%
0,0%
1,0%
2,0%
2004
2005
2006
2007
2008
2009
2010
2011
2012
2013
2014
2015
2016
2017
2018
2019
2020
2021
2022
2023
2024
2025
2026
2027
2028
2029
2030
ATCProtocol DRCAFTA EUCAAA
We analyze now the changes in �nal goods prices of the two trade agreements. In the case of DR-
CAFTA, the decrease of general prices (CPI) compared to baseline values indicates an improvement in
57

Figure 15: Nicaragua, changes in high-skill wages relative to baseline values
4,0%
3,0%
2,0%
1,0%
0,0%
1,0%
2,0%
2004
2005
2006
2007
2008
2009
2010
2011
2012
2013
2014
2015
2016
2017
2018
2019
2020
2021
2022
2023
2024
2025
2026
2027
2028
2029
2030
ATCProtocol DRCAFTA EUCAAA
real incomes for both countries. On the other hand, the changes in food prices are diverse. In Costa
Rica, the prices of some agricultural products decrease, while others grow (see Figure 16).
Figure 16: Costa Rica, DR-CAFTA scenario, changes on CPI and selected food prices w.r.t. baseline
3,0%
2,0%
1,0%
0,0%
1,0%
2,0%
3,0%
2004
2006
2008
2010
2012
2014
2016
2018
2020
2022
2024
2026
2028
2030
CPI
Rice
Diary
MeatProducts
OtherCereals
Vegetablesand Fruits
FoodProducts
It is important to recall that the productivity shocks and endowment growth rates in�uence the
agricultural markets in the baseline, while the price shocks in the FTA are related to changes in tari¤s.
Tari¤s changes can act through two channels on domestic prices. One is directly through foreign
competition to lower prices and the other channel is through a reallocation of production to the export
sector that can displace domestic production and increase prices. In both our FTA scenarios and in
both countries, CPI is declining mainly because of changes in manufactured goods, which are imported
at lower prices after the implementation of the agreements.
Figure 17 shows similar price e¤ects for Nicaragua. Consumer prices fall below baseline levels for
all the analyzed period, while in the case of food products most prices grow although others fall. The
decrease is signi�cant in the case of rice, which is an important consumption good for poor families.
58
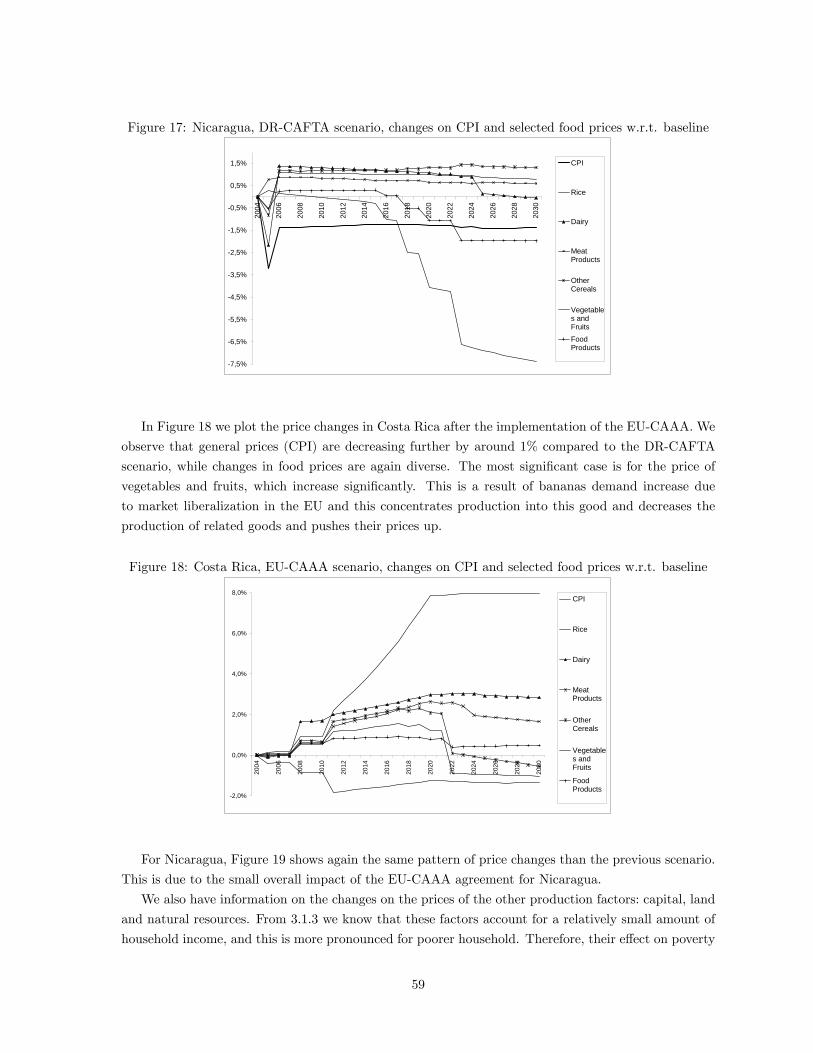
Figure 17: Nicaragua, DR-CAFTA scenario, changes on CPI and selected food prices w.r.t. baseline
7,5%
6,5%
5,5%
4,5%
3,5%
2,5%
1,5%
0,5%
0,5%
1,5%
2004
2006
2008
2010
2012
2014
2016
2018
2020
2022
2024
2026
2028
2030
CPI
Rice
Dairy
MeatProducts
OtherCereals
Vegetables andFruitsFoodProducts
In Figure 18 we plot the price changes in Costa Rica after the implementation of the EU-CAAA. We
observe that general prices (CPI) are decreasing further by around 1% compared to the DR-CAFTA
scenario, while changes in food prices are again diverse. The most signi�cant case is for the price of
vegetables and fruits, which increase signi�cantly. This is a result of bananas demand increase due
to market liberalization in the EU and this concentrates production into this good and decreases the
production of related goods and pushes their prices up.
Figure 18: Costa Rica, EU-CAAA scenario, changes on CPI and selected food prices w.r.t. baseline
2,0%
0,0%
2,0%
4,0%
6,0%
8,0%
2004
2006
2008
2010
2012
2014
2016
2018
2020
2022
2024
2026
2028
2030
CPI
Rice
Dairy
MeatProducts
OtherCereals
Vegetables andFruits
FoodProducts
For Nicaragua, Figure 19 shows again the same pattern of price changes than the previous scenario.
This is due to the small overall impact of the EU-CAAA agreement for Nicaragua.
We also have information on the changes on the prices of the other production factors: capital, land
and natural resources. From 3.1.3 we know that these factors account for a relatively small amount of
household income, and this is more pronounced for poorer household. Therefore, their e¤ect on poverty
59
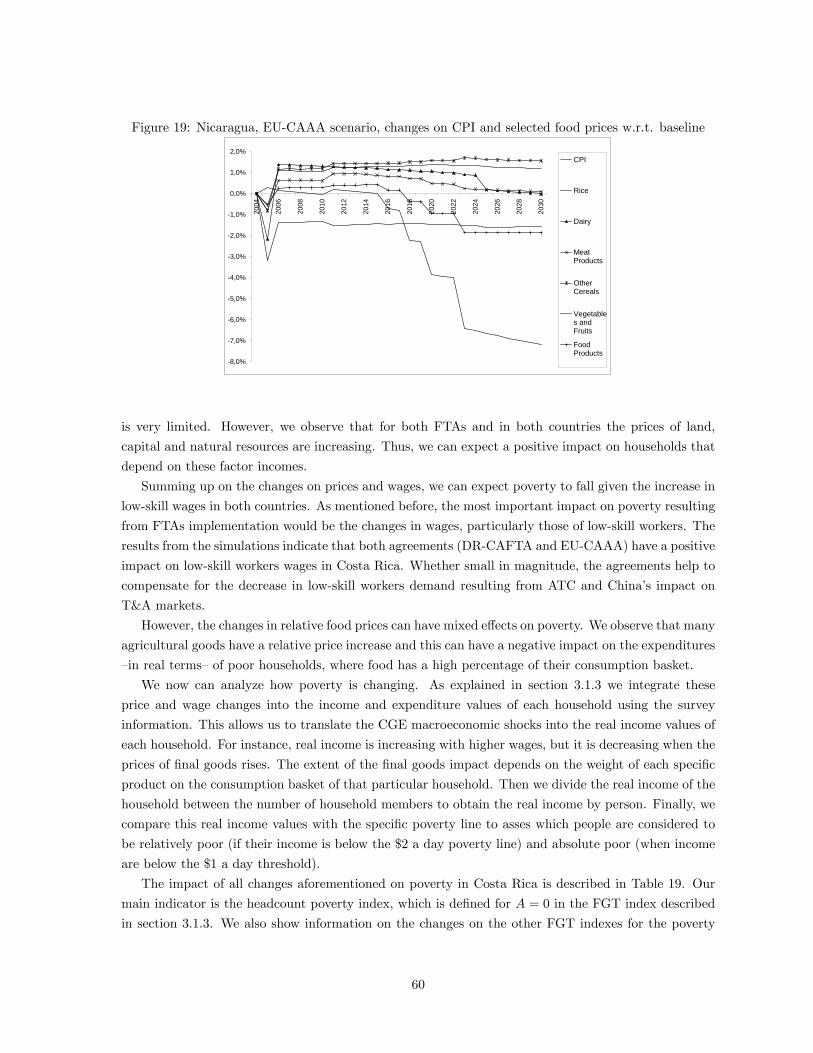
Figure 19: Nicaragua, EU-CAAA scenario, changes on CPI and selected food prices w.r.t. baseline
8,0%
7,0%
6,0%
5,0%
4,0%
3,0%
2,0%
1,0%
0,0%
1,0%
2,0%
2004
2006
2008
2010
2012
2014
2016
2018
2020
2022
2024
2026
2028
2030
CPI
Rice
Dairy
MeatProducts
OtherCereals
Vegetables andFruits
FoodProducts
is very limited. However, we observe that for both FTAs and in both countries the prices of land,
capital and natural resources are increasing. Thus, we can expect a positive impact on households that
depend on these factor incomes.
Summing up on the changes on prices and wages, we can expect poverty to fall given the increase in
low-skill wages in both countries. As mentioned before, the most important impact on poverty resulting
from FTAs implementation would be the changes in wages, particularly those of low-skill workers. The
results from the simulations indicate that both agreements (DR-CAFTA and EU-CAAA) have a positive
impact on low-skill workers wages in Costa Rica. Whether small in magnitude, the agreements help to
compensate for the decrease in low-skill workers demand resulting from ATC and China�s impact on
T&A markets.
However, the changes in relative food prices can have mixed e¤ects on poverty. We observe that many
agricultural goods have a relative price increase and this can have a negative impact on the expenditures
�in real terms�of poor households, where food has a high percentage of their consumption basket.
We now can analyze how poverty is changing. As explained in section 3.1.3 we integrate these
price and wage changes into the income and expenditure values of each household using the survey
information. This allows us to translate the CGE macroeconomic shocks into the real income values of
each household. For instance, real income is increasing with higher wages, but it is decreasing when the
prices of �nal goods rises. The extent of the �nal goods impact depends on the weight of each speci�c
product on the consumption basket of that particular household. Then we divide the real income of the
household between the number of household members to obtain the real income by person. Finally, we
compare this real income values with the speci�c poverty line to asses which people are considered to
be relatively poor (if their income is below the $2 a day poverty line) and absolute poor (when income
are below the $1 a day threshold).
The impact of all changes aforementioned on poverty in Costa Rica is described in Table 19. Our
main indicator is the headcount poverty index, which is de�ned for A = 0 in the FGT index described
in section 3.1.3. We also show information on the changes on the other FGT indexes for the poverty
60

gap (A = 1) and the square of poverty gap (A = 2) in the Appendix. The poverty values for 2004 are
those obtained directly from the households surveys and do not include any policy shock.
Table 19: Costa Rica, headcount poverty values for trade scenarios2004 2010 2020 2030
Baseline Relative poverty 19.6% 17.4% 16.2% 15.4% Absolute poverty 4.0% 6.0% 5.7% 5.7%
ATCProtocol Relative poverty 17.6% 16.3% 15.7% Absolute poverty 6.0% 5.7% 5.7%
DRCAFTA Relative poverty 17.4% 16.1% 15.3% Absolute poverty 6.0% 5.7% 5.7%
EUCAAA Relative poverty 17.4% 16.4% 15.5% Absolute poverty 6.0% 5.8% 5.8%
Notes: Relative poverty is estimated w ith the $2 a day poverty line, w hile absolute poverty uses $1 a day. The trade scenarios are sequential: DRCAFTA includes ATC protocol and EUCAAA includes all.Source: Ow n elaboration.
The most signi�cant poverty reduction is achieved in the baseline scenario. This is a direct conse-
quence of the 3% growth rate that is obtained after the increases in TFP, land e¢ ciency and the capital
stock. These changes result in sustained labor demand increases to cope with the production expansion
and this yields higher wages, while food prices are growing moderately.
Regarding our trade scenarios we observe only small deviations from this baseline poverty decrease.
In particular, the impact of the ATC-protocol on poverty is slightly negative, but it is compensated with
a poverty reduction of DR-CAFTA of about 0.4%. On the other hand, poverty rates increase slightly
with EU-CAAA. The increase in some food prices is the main force driving this outcome. However, the
impacts on poverty (positive and negative) are of a very small magnitude for both trade agreements.
For the case of Nicaragua, Table 20 shows again a general decrease in headcount poverty in the
baseline case. This follows from the same reasons explained in the case of Costa Rica. However,
in Nicaragua the negative impact of the ATC-protocol implementation is much higher, with poverty
increasing by almost 2% in 2010. DR-CAFTA mitigates these e¤ects and in 2030 the percentage of
poor households returns to the baseline values. The EU-CAAA has a very small impact on poverty.
As mentioned before, the impact of Chinese competition in the T&A global market negatively
a¤ected the country�s welfare. Both FTAs compensate these e¤ects by increasing promote growth and
consumption, which helps to reduce poverty. Wage increases and key food products price falls are
reinforcing this outcome. Finally, we observed that the changes in both relative and absolute poverty
are following the same pattern in each country.
4.4 Macroeconomic e¤ects of human capital policies
This section links the human capital satellite model with the dynamic CGE model. As explained in
section 3.2.1. the changes in human capital policies are fed into the CGE model using four linkage
variables. These are the labour e¢ ciency changes for low and high-skill workers and the labour supply
61

Table 20: Nicaragua, headcount poverty values for trade scenarios2004 2010 2020 2030
Baseline Relative poverty 39.4% 35.6% 32.5% 30.2% Absolute poverty 16.9% 17.5% 15.2% 13.0%
ATCProtocol Relative poverty 37.4% 33.7% 30.7% Absolute poverty 18.7% 16.1% 13.8%
DRCAFTA Relative poverty 36.3% 32.7% 30.0% Absolute poverty 17.6% 15.5% 13.0%
EUCAAA Relative poverty 36.3% 32.7% 29.9% Absolute poverty 17.6% 15.5% 13.0%
Notes: Relative poverty is estimated w ith the $2 a day poverty line, w hile absolute poverty uses $1 a day. The trade scenarios are sequential: DRCAFTA includes ATC protocol and EUCAAA includes all.Source: Ow n elaboration.
changes for both skill types. Using these linkage variables we can analyze the macroeconomic impact
of these policies.
Figure 20 depicts the impact of those human capital policies on consumption. In both countries
consumption decreases with respect to their baseline levels until 2018, but then it starts increasing with
rates superior not only to baseline but to all other simulation scenarios presented so far. The decrease of
consumption is a direct consequence of the opportunity cost e¤ect in education. This is, to increase the
level of school attainment a fraction of the population has to stay longer at school and thus, the labour
supply of workers is decreasing during this period. Yet, when these students with higher education
enter into the labour market not only is labor supply increasing, but also labour e¢ ciency is rising
because the new worker cohorts have higher school attainment, but also higher quality of education.
The remarkable e¤ect is that consumption and growth levels have not only a positive e¤ect but also
experience a change in the growth rate.
In a broad sense, the human capital satellite model is creating an endogenous growth process, where
shifts in the stock of human capital yield changes in the baseline growth rates. These results are in
stark contrast with the more static �i.e. one-time�impact of the trade scenarios.
Due to the di¤erences in human capital in Costa Rica and Nicaragua, the impact of education
policies is stronger for the Nicaraguan economy. The higher impact is determined by the lower initial
levels in Nicaragua and therefore the scope for improvement is wider.
The improvements in human capital for both countries promotes growth in practically all productive
sectors by 2030 (see Table 21). However, production is stagnant or decreasing in the previous periods
(i.e. 2010 and 2020) due to the initial opportunity costs of the human capital policies.
However, it is important to note that both Costa Rica and Nicaragua experience a relative increase
in the manufacturing sector, with respect to agriculture. This outcome shows the impact of education
policies on productive sectors which demand higher skilled workers.
The case of the T&A sector is illustrative. Trade policies partially compensated and in some cases
reversed the negative shock from the ATC implementation. After integrating this impacts with human
62

Figure 20: Human capital scenario, consumption changes w.r.t. baseline
0,02
0,01
0
0,01
0,02
0,03
0,04
0,05
0,06
0,07
0,08
0,09
2004 2007 2010 2013 2016 2019 2022 2025 2028
NIC CRC
capital policies, the T&A sector grows in both countries. This result con�rms that �nal impacts on
growth as a result of human capital policies depend on the skill intensity of productive sectors.
However, we observe a signi�cant increase in the production of the T&A sector for Nicaragua of
around 33%. In the case of Costa Rica the T&A expansion is also positive but of a lower magnitude at
around 12%. This results signals that although the T&A sector is considered to be based on low-skill
labor on a global sense, in Costa Rica and Nicaragua it can also be employing middle and high-skilled
workers. This result is also consistent with the wage changes we observed in the previous section when
we analyzed the impact of the ATC-protocol.32 Moreover, the services sector is also experiencing a
signi�cant impact, which is an expected result of a skill upgrading in the labor force.
It is worth mentioning that human capital policies outcomes are realized in the medium and long
term. Therefore, the impact on production and other variables would be sustained as far as a continuous
policy e¤ort is institutionalized. In other words, the short-term costs outweigh the bene�ts, but on a
broader perspective, these bene�ts impacts from human capital investments depend on its level of policy
priority.
4.5 Poverty e¤ects of human capital policies
Once again we follow the top-down approach and we plug the price and wage changes into the household
budgets. As expected from the high growth rates produced by the human capital policies, we have a
positive and very signi�cant impact on wages in Costa Rica and Nicaragua. Figure 21 plots the wage
changes for Costa Rica and Nicaragua for both skill types.
A �rst observation is that the wages of low-skill workers is increasing more than that for high-skill
workers. This is a direct consequence of the skill upgrading of the labor force, which means that low-skill
32Condo et al. (2004) indicate that the T&A sector in the region is diverse, with several segments along the value chain.This means that the expansion of the sector can occur at di¤erent segments that have a di¤erent low and high-skill factorcontent. Therefore, how this sector grows as a result of trade policies (particularly in Nicaragua) depends on how thesupply of low and high skill workers evolves over time.
63

Table 21: Human capital scenario, sectoral production changes w.r.t. baseline
Code Sector 2010 2020 2030 2010 2020 2030
PDR Paddy_rice 0.00 0.00 0.02 0.00 0.00 0.01WHT Wheat 0.00 0.01 0.02 0.00 0.01 0.01GRO Other_cereal 0.00 0.00 0.01 0.00 0.01 0.03V_F Veg_fruits 0.00 0.01 0.01 0.00 0.00 0.02OSD Oil_seeds 0.00 0.01 0.00 0.00 0.00 0.01C_B Sugar_cane 0.00 0.00 0.03 0.00 0.00 0.03PFB Plant_fibers 0.00 0.00 0.00 0.00 0.01 0.05OCR Crops_nec 0.00 0.01 0.00 0.00 0.00 0.01CTL Cattle 0.00 0.00 0.03 0.00 0.00 0.01OAP Animprod_nec 0.00 0.00 0.02 0.00 0.01 0.04RMK Raw_milk 0.01 0.00 0.04 0.00 0.01 0.08WOL Wool 0.00 0.00 0.02 0.00 0.03 0.25FRS Forestry 0.00 0.00 0.00 0.00 0.01 0.02FSH Fishing 0.00 0.00 0.00 0.00 0.00 0.00OMN Minerals_nec 0.00 0.00 0.00 0.00 0.00 0.00CMT Meat 0.00 0.00 0.03 0.00 0.00 0.01OMT Meatprod_nec 0.00 0.00 0.03 0.00 0.01 0.05VOL Veg_oils 0.01 0.00 0.05 0.00 0.01 0.06MIL Dairy 0.01 0.00 0.04 0.00 0.00 0.01PCR Proc_rice 0.00 0.00 0.03 0.00 0.00 0.03SGR Sugar 0.00 0.00 0.03 0.00 0.00 0.03OFD Foodprod_nec 0.00 0.00 0.03 0.00 0.01 0.06B_T Bev_tobacco 0.01 0.00 0.06 0.00 0.01 0.08TEX Textiles 0.01 0.01 0.11 0.00 0.04 0.35
WAP Apparel 0.01 0.01 0.12 0.00 0.04 0.33LEA Leather 0.01 0.02 0.15 0.00 0.03 0.27LUM Wood_prod 0.01 0.01 0.07 0.00 0.02 0.08PPP Paper_prod 0.01 0.00 0.08 0.00 0.03 0.20CRP Chemical_pla 0.01 0.01 0.07 0.00 0.03 0.15NMM Minprod_nec 0.01 0.00 0.06 0.00 0.02 0.12I_S Ferrous_met 0.01 0.01 0.10 0.00 0.02 0.10
NFM Metals_Nec 0.01 0.01 0.10 0.00 0.04 0.26FMP Metal_prods 0.01 0.01 0.08 0.00 0.03 0.19MVH Motor_veh 0.01 0.00 0.06 0.00 0.03 0.18OTN Trans_eq_nec 0.01 0.00 0.07 0.00 0.03 0.18ELE Electronic 0.00 0.00 0.02 0.00 0.04 0.22OME Machine_nec 0.01 0.01 0.05 0.00 0.05 0.27OMF Manufact_nec 0.01 0.00 0.04 0.00 0.01 0.07SRV Services 0.00 0.01 0.07 0.00 0.02 0.14ENE Energy 0.01 0.01 0.08 0.00 0.02 0.11
Source: Ow n elaboration.
Costa Rica Nicaragua
64

Figure 21: Costa Rica and Nicaragua, human capital scenario, changes in wages w.r.t. baseline
4,0%
2,0%
0,0%
2,0%
4,0%
6,0%
8,0%
10,0%
12,0%
14,0%
16,0%
2004
2005
2006
2007
2008
2009
2010
2011
2012
2013
2014
2015
2016
2017
2018
2019
2020
2021
2022
2023
2024
2025
2026
2027
2028
2029
2030
CRC lowskill CRC highskill NIC lowskill NIC highskill
labor supply is decreasing relative to high-skill supply. This supply e¤ects produce a positive impact
on the wages of low-skill relative to high-skill workers. In addition, both labor types are more e¢ cient
after the implementation of the human capital policies, and this creates the general increase in both
wage types.
As mentioned before, the e¤ects on production and consumption are present the medium term, when
education levels and labor e¢ ciency of the workforce improve. In the case of wages, a similar path is
followed. In Costa Rica, low-skill workers start earning higher wages after a shorter period of time,
compared to high-skill workers. Low-skill workers take advantage of better education and start working
on better paid jobs, at the same time that labor demand is increasing due to economic growth.
With regard to prices changes, we observe a similar pattern than with the trade scenarios. Many
agricultural goods prices are increasing relative to the rest of the economy and this increases the food
expenditures for households. Thus, this e¤ect can o¤set the positive poverty impact of higher low-skill
wages.
In Table 22 we present the poverty results for the human capital scenario for Costa Rica. Here we
observe that relative poverty is initially increasing in 2010, it is equal to the baseline value in 2020 and
it decreases by 2030. Although the poverty reduction is less than 1%, it is expected that the increasing
growth pattern of the human capital policies assures a steady decline of poverty over time, relative to
the baseline scenario. In the case of absolute poverty, we see no changes until 2030 where there is a
small reduction. The last scenario is analyzed in the following section.
Table 23 shows the poverty results for Nicaragua. In this case we observe that relative poverty
experiences a slight increase in 2010 but then begins to decrease steadily after 2020. By 2030 relative
poverty decreases more than 2% with respect to its baseline values. This decrease re�ects the large
wage rise produced by the skill upgrading of the working force. Moreover, these positive e¤ects are also
translated into changes in the absolute poverty level, which is reduced by more than 1%.
Even though the human capital policies are reducing poverty in both countries, the reductions are
not consistent with the large increase in low-skill wages. To analyze this results we went deeper into
the household income and expenditure information. There we found that negative savings �larger
65

Table 22: Costa Rica, headcount poverty values for human capital and integrated scenarios2004 2010 2020 2030
Baseline Relative poverty 19.6% 17.4% 16.2% 15.4% Absolute poverty 4.0% 6.0% 5.7% 5.7%
Human capital policies Relative poverty 17.6% 16.2% 14.6% Absolute poverty 6.0% 5.7% 5.6%
Integrated: Trade and HK policies Relative poverty 17.5% 16.3% 14.7% Absolute poverty 6.0% 5.8% 5.7%
Notes: Relative poverty is estimated w ith the $2 a day poverty line, w hile absolute poverty uses $1 a day.Source: Ow n elaboration.
Table 23: Nicaragua, headcount poverty values for human capital and integrated scenarios2004 2010 2020 2030
Baseline Relative poverty 39.4% 35.6% 32.5% 30.2% Absolute poverty 16.9% 17.5% 15.2% 13.0%
Human capital policies Relative poverty 35.7% 32.1% 27.9% Absolute poverty 17.5% 15.1% 11.7%
Integrated: Trade and HK policies Relative poverty 36.4% 32.4% 27.8% Absolute poverty 17.6% 15.3% 11.7%
Notes: Relative poverty is estimated w ith the $2 a day poverty line, w hile absolute poverty uses $1 a day.Source: Ow n elaboration.
expenditures than income�is a serious issue of the data. In general, we expect that some households
have temporary higher expenses than income and that this is re�ected in one-year period covered by the
surveys. This gap can be �nanced through formal and informal sources and it is re�ected in a positive
debt for that particular household. It can also be �nanced by using past periods savings.
However, we observe abnormally high levels of negative savings, specially for Nicaragua. There we
�nd that 36% of the population has negative savings. The corresponding value for Costa Rica is 18%.
Another feature is that these negative savings are clustered prominently in lower income household.
This is something that can also be expected given that these households have higher probabilities
of insu¢ cient income to cover current expenses. However, the concentration is very pronounced in
Nicaragua. For instance, 75% of the people with negative savings are below the 50th income percentile,
while 21% are in the lowest 10th income percentile. Figure 22 shows the distribution of savings for the
upper half of the population when sorted by income levels. We observe that the large proportion of
these households have no savings or slightly positive savings.
With 36% of households having negative savings, this means that most of these households are
below the 50th income percentile. For instance, Figure 23 presents the distribution of savings among
the household with incomes below the 10th percentile. It is clear from the graph that most of these
extremely poor households have negative savings. Moreover, some households have abnormally large
savings, if we compare it to the $1 a day poverty line.
66

Figure 22: Nicaragua, distribution of savings for households above the 50th income percentile
02.
0e0
64.
0e0
66.
0e0
6D
ensi
ty
2000000 0 2000000 4000000 6000000 8000000savings
Figure 23: Nicaragua, distribution of savings for households below the 10th income percentile
01.
0e0
52.
0e0
53.
0e0
54.
0e0
55.
0e0
5D
ensi
ty
150000 100000 50000 0 50000savings
A partial explanation of these results is that the Nicaraguan survey is under-valuing the amount
of foreign remittances to poor households. In our estimations of income composition in Figure 3 all
transfers represent around 10% of income for the poorer households. However, in the study by the
World Bank (2008) they estimate that remittances alone represent 22% of total income for the poorest
10% of household. Thus, part of these negative savings can be explained by missing remittances in the
survey data.
Another explanation is that other income sources are being omitted. In particular, since low-skill
wages represent more than 70% of income for the poorest households, is likely that this income source
is also undervalued.
In any case, the very low levels of income for poor households in Nicaragua signi�cantly weakens the
link between higher wages and higher incomes. In the case of Costa Rica we have a similar di¢ culty,
but here the negative savings is less pronounced. Less than 20% of the population have negative savings
and this is not as concentrate on the poorer families as in Nicaragua. For instance, Figure 24 shows the
distribution of savings among the poorest 10% of the population.
67
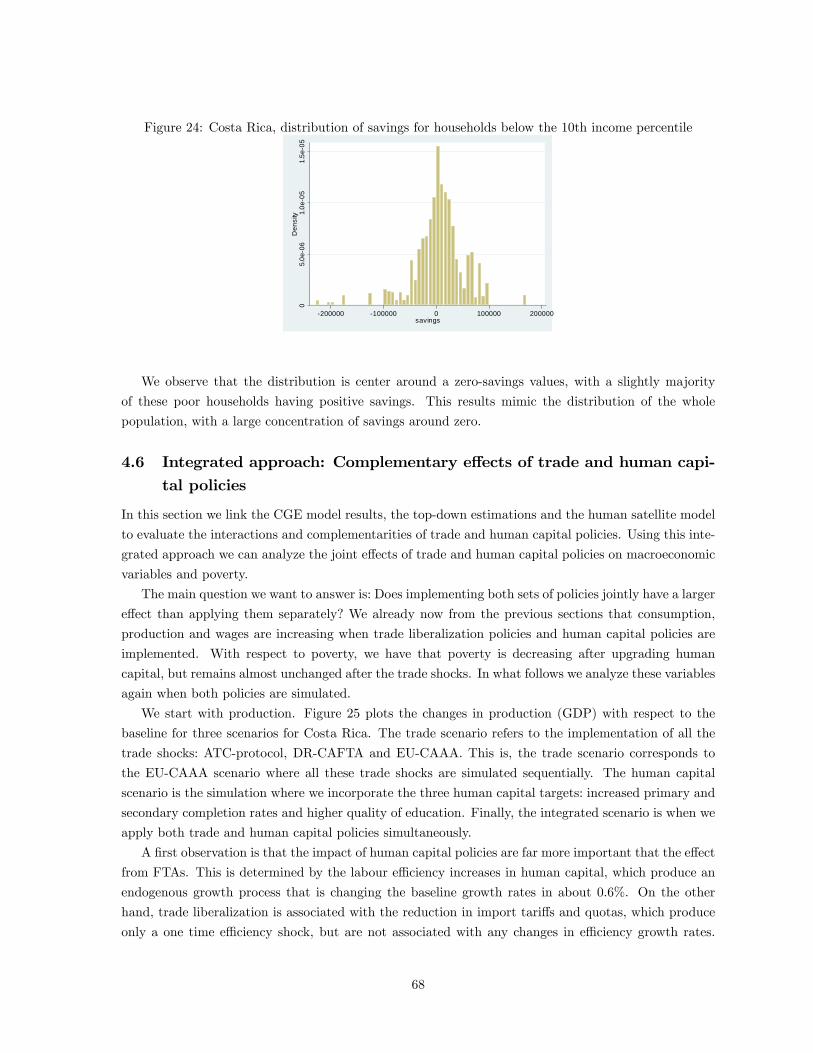
Figure 24: Costa Rica, distribution of savings for households below the 10th income percentile
05.
0e0
61.
0e0
51.
5e0
5D
ensi
ty
200000 100000 0 100000 200000savings
We observe that the distribution is center around a zero-savings values, with a slightly majority
of these poor households having positive savings. This results mimic the distribution of the whole
population, with a large concentration of savings around zero.
4.6 Integrated approach: Complementary e¤ects of trade and human capi-tal policies
In this section we link the CGE model results, the top-down estimations and the human satellite model
to evaluate the interactions and complementarities of trade and human capital policies. Using this inte-
grated approach we can analyze the joint e¤ects of trade and human capital policies on macroeconomic
variables and poverty.
The main question we want to answer is: Does implementing both sets of policies jointly have a larger
e¤ect than applying them separately? We already now from the previous sections that consumption,
production and wages are increasing when trade liberalization policies and human capital policies are
implemented. With respect to poverty, we have that poverty is decreasing after upgrading human
capital, but remains almost unchanged after the trade shocks. In what follows we analyze these variables
again when both policies are simulated.
We start with production. Figure 25 plots the changes in production (GDP) with respect to the
baseline for three scenarios for Costa Rica. The trade scenario refers to the implementation of all the
trade shocks: ATC-protocol, DR-CAFTA and EU-CAAA. This is, the trade scenario corresponds to
the EU-CAAA scenario where all these trade shocks are simulated sequentially. The human capital
scenario is the simulation where we incorporate the three human capital targets: increased primary and
secondary completion rates and higher quality of education. Finally, the integrated scenario is when we
apply both trade and human capital policies simultaneously.
A �rst observation is that the impact of human capital policies are far more important that the e¤ect
from FTAs. This is determined by the labour e¢ ciency increases in human capital, which produce an
endogenous growth process that is changing the baseline growth rates in about 0.6%. On the other
hand, trade liberalization is associated with the reduction in import tari¤s and quotas, which produce
only a one time e¢ ciency shock, but are not associated with any changes in e¢ ciency growth rates.
68

Figure 25: Costa Rica, GDP changes w.r.t. baseline for selected scenarios
2,0%
1,0%
0,0%
1,0%
2,0%
3,0%
4,0%
5,0%
6,0%
7,0%
8,0%
2004
2005
2006
2007
2008
2009
2010
2011
2012
2013
2014
2015
2016
2017
2018
2019
2020
2021
2022
2023
2024
2025
2026
2027
2028
2029
2030
Trade Human capital Integrated
Thus, we see that the trade shocks produce a scale increase in baseline production of about 0.5%. This
does not mean that trade policies are less important in increasing GDP growth than human capital
policies. In particular, our results are a re�ection of the modeling strategy we used, where we do not
have dynamic e¤ects associated with trade shocks.
It is worth mentioning that trade policy can have important dynamic e¤ects. These dynamic e¤ects
can be associated with di¤erent sources related to trade. For instance, investment growth through larger
�ows of FDI is regarded as one of the main dynamic e¤ects associated with trade liberalization. In addi-
tion, there are productivity changes associated with the import of more and better intermediate inputs.
Productivity can also increase when increased trade and capital �ows promote technological transfers
embedded in intermediate inputs or in FDI. Trade can also. increase internal market competition.
However, even when many of the economy-wide e¤ects of trade policy are dynamic in nature, these
mechanisms are very hard to incorporate into a CGE framework. As explained before, it is di¢ cult
to incorporate changes in FDI in�ows without a fully dynamic optimization process where agents are
maximizing over time consumption and savings. Moreover, there is not enough empirical evidence to
link increased trade volumes with productivity changes that can alter the baseline growth rates.33
Given these limitation, our CGE model is accounting only for static e¢ ciency e¤ects. The main
e¢ ciency impact is the improvement in the allocation of resources after the import tari¤ and quota
reductions. Therefore, our estimates can be regarded as the lower-bound impact of FTAs. Even when
the magnitude of the FTAs e¤ects with respect to the educational policies is small, they still represent
a positive change in GDP.
Regarding human capital policies, the results for Costa Rica are consistent with recent studies
that �nd a strong correlation between human capital investments, productivity and economic growth
(Jiménez et al., 2009).
33Cross-country estimates of trade and growth indicate that there is a strong link between trade, more investment andgrowth (Helpman, 2004). However, Rodríguez and Rodrik (2001) have critisized the empirical studies that associate tradewith growth. They argue that these studies do not properly isolate the e¤ects of trade liberalization from other policychanges.
69

Turning back to our main question. There are no complementary e¤ects in production between
trade and human capital policies. In other words, the increases in GDP attained separately with both
sets of policies are the same as when both policies are jointly implemented. For the case of consumption
we do observe some positive complementarity e¤ects, but they are small and represent an increase of
0.1% . In Figure 26 we have plot the changes in consumption for Costa Rica and we observe the same
pattern as for GDP.
Figure 26: Costa Rica, consumption changes w.r.t. baseline for selected scenarios
2,0%
1,0%
0,0%
1,0%
2,0%
3,0%
4,0%
5,0%
6,0%
7,0%
8,0%
2004
2005
2006
2007
2008
2009
2010
2011
2012
2013
2014
2015
2016
2017
2018
2019
2020
2021
2022
2023
2024
2025
2026
2027
2028
2029
2030
Trade Human capital Integrated
With respect of sectoral production changes, Table 4 in the Appendix shows that the integrated
scenario is producing an acceleration in the agricultural decline in Costa Rica with production increasing
in both manufacturing and services.
When we analyze wages we �nd that there are no complementarity e¤ects for low-skill wages (see
Figure 27), but we do observe a large complementarity e¤ect for high-skill wages. In Figure 28 we
observe that high-skill wages are declining for the trade scenario and increasing in the human capital
scenario, but in the integrated scenario wages are even slightly higher than in the human capital scenario,
re�ecting a complementarity e¤ect of almost 2 percentage points. This means that the implementation
of human capital policies completely o¤sets the wage losses associated with the trade shocks and even
have a higher e¤ect than when only the education changes are simulated. This is a remarkable result
and points to an important interaction of both policy sets for high-skill workers and those productive
sectors that use relatively more of this factor.
Finally, for the case of poverty we do not observe any complementarity e¤ects either. In the trade
scenario we have an increase in relative poverty of 0.1% with respect to the baseline (see Table 19).
For the human capital scenario we have a relative poverty decrease of 0.8% (see Table 22), while in the
integrated scenario relative poverty is decreasing by 0.7% (see Table 22). Thus, both e¤ects are the
same for the separate and the joint simulations. This is the case also for absolute poverty.
For Nicaragua we perform the same analysis starting with production. In Figure 29 we observe the
same relation between a static e¢ ciency e¤ect of the trade shocks and a dynamic e¢ ciency impact of
70

Figure 27: Costa Rica, low-skill wage changes w.r.t. baseline for selected scenarios
2,0%
0,0%
2,0%
4,0%
6,0%
8,0%
10,0%
12,0%
14,0%
2004
2005
2006
2007
2008
2009
2010
2011
2012
2013
2014
2015
2016
2017
2018
2019
2020
2021
2022
2023
2024
2025
2026
2027
2028
2029
2030
Trade Human capital Integrated
Figure 28: Costa Rica, high-skill wage changes w.r.t. baseline for selected scenarios
2,0%
1,5%
1,0%
0,5%
0,0%
0,5%
1,0%
1,5%
2,0%
2,5%
2004
2005
2006
2007
2008
2009
2010
2011
2012
2013
2014
2015
2016
2017
2018
2019
2020
2021
2022
2023
2024
2025
2026
2027
2028
2029
2030
Trade Human capital Integrated
the human capital policies on GDP. Yet, the upgrading of skills through educational policies in the
human capital scenario produces a shift in the growth rate from around 3:6% in the baseline, to 4:6% .
This is 1% increase is much larger than for Costa Rica (0:6%) and re�ects that the initial lower levels
of human capital in Nicaragua provide much opportunities for improvement. Moreover, for Nicaragua
we do have a small complementarity e¤ect of 0.2%. For consumption (not reported) we �nd again the
same pattern by with no complementarity e¤ect.
Sectoral production changes for Nicaragua in the integrated scenario are shown in Table 4 of the
Appendix. We observe that the pattern of overall production increase is also present with this scenario,
where all sectors are increasing but manufacturing is growing faster than the rest of the economy.
When we analyze wages in Figures 30 and 31 we �nd very similar results as for production and con-
sumption. However, for low-skill wages we �nd a small negative complementarity e¤ect of �0:2%;whilefor high-skill wages the complementarity e¤ect is positive but again relatively small at 0:2%:In the case
71

Figure 29: Nicaragua, GDP changes w.r.t. baseline for selected scenarios
2,0%
0,0%
2,0%
4,0%
6,0%
8,0%
10,0%
12,0%
14,0%
2004
2005
2006
2007
2008
2009
2010
2011
2012
2013
2014
2015
2016
2017
2018
2019
2020
2021
2022
2023
2024
2025
2026
2027
2028
2029
2030
Trade Human capital Integrated
of low-skill wages, the decrease is comparatively smaller since wages in 2030 are increasing by more
than 14% in the integrated scenario. This is double the e¤ect than for high-skill wages.
Figure 30: Nicaragua, low-skill wage changes w.r.t. baseline for selected scenarios
4,0%
2,0%
0,0%
2,0%
4,0%
6,0%
8,0%
10,0%
12,0%
14,0%
16,0%
2004
2005
2006
2007
2008
2009
2010
2011
2012
2013
2014
2015
2016
2017
2018
2019
2020
2021
2022
2023
2024
2025
2026
2027
2028
2029
2030
Trade Human capital Integrated
Finally, we analyze the complementarity e¤ects for poverty in Nicaragua. Using the information on
poverty changes by scenario from Tables 20 and 23 we �nd that there is a small negative complementarity
e¤ect of �0:2% for relative poverty. In particular, relative poverty is falling by 0:3% after the trade
shocks and is further decreasing by 2:3% after the educational policy shock, however, the integrated
scenario reports a relative poverty decrease of 2:4%:In other words. For the case of absolute poverty
there is a zero complementarity e¤ect.
To sum up this section, we �nd that the answer to our main question is that there are positive but
small complementarity e¤ects. The only exception is the positive and large complementarity e¤ect for
72

Figure 31: Nicaragua, high-skill wage changes w.r.t. baseline for selected scenarios
4,0%
2,0%
0,0%
2,0%
4,0%
6,0%
8,0%
2004
2005
2006
2007
2008
2009
2010
2011
2012
2013
2014
2015
2016
2017
2018
2019
2020
2021
2022
2023
2024
2025
2026
2027
2028
2029
2030
Trade Human capital Integrated
high-skill wages for Costa Rica. These wages where decreasing as a result of the trade shocks, but when
human capital policies where introduced the tendency was completely reversed and high-skill wages
where increasing, even slightly more than with the human capital scenario.
The lack of strong complementarity e¤ects in most of our main variables can be a result of comparing
two di¤erent policy shocks. Human capital policies have a dynamic e¢ ciency e¤ect, while trade policies
only a static e¢ ciency impact. Another explanation can be related to the setup of the CGE model. The
initial input-ouput coe¢ cients in the economy are set �xed in the base year and thus, the production
technology in each sector is also �xed. This means that changes in the quantity and quality of the
production factors are re�ected in sectoral production and trade changes, but not in how each sectors
combines the di¤erent factors. In a setting where the production technology is changing a human capital
upgrade can result in di¤erent input-output coe¢ cients that alter the patterns of production and trade.
This e¤ects are not present in CGE models.
73

5 Conclusions and policy recommendations
The impact on poverty is given by three di¤erent mechanisms: a) changes in goods and factor prices
through the FTAs, which a¤ect the income and expenditure of households; b) direct changes of education
policy on employment and wages; and c) the complementarities between trade and education policies.
With respect to the trade liberalization policies, the general results from our simulations show
that DR-CAFTA has stronger e¤ects on production, consumption, and poverty than EU-CAAA. In
addition, the EU-CAAA results in more signi�cant macroeconomic improvements for Costa Rica, since
this country has higher trade �ows with the European Union than Nicaragua. However, the impact
of both FTAs yields only a static e¢ ciency improvement that translates into a one-o¤ increase in the
baseline levels of consumption and production.
The main driver of economic growth in the analysis is provided by the upgrading of human capital
through educational policies. These policies result in an endogenous growth process where the growth
rate is increased by around 0:6% in Costa Rica and 1% in Nicaragua when compared to the baseline
growth rates for both countries. Thus, both Costa Rica and Nicaragua experience higher growth and
welfare e¤ects when labor e¢ ciency improves through human capital policies. In a �rst stage, low and
high-skill workers receive lower salaries (compared to baseline levels) but when these initial opportunity
costs are taken and the human capital accumulation process starts, wages begin to grow steadily.
Under these circumstances, the long run impact of human capital policies continues beyond 2030 �our
simulations �nal year�and we can expect that poverty reduction also follow a steady decline over time.
As a consequence of the di¤erent growth patterns produced by both policies, poverty impacts of
FTAs are positive, but small. Human capital policies, on the other hand, yield stronger poverty re-
ductions. Therefore, the poverty reduction we observe in our integrated scenario �where both trade
and educational policies interact�is a direct outcome of human capital improvements in both countries.
Much of this outcome derives from low-skill wages growth. High-skill labor and other production factors
also experience a sizeable increase, but these factors are much less important as an income source for
poor households.
Finally, poverty and other macroeconomic variables do present positive but relatively small comple-
mentarity e¤ects when both trade and educational policies are implemented jointly. The only exception
being the high-skill wages in Costa Rica, where educational policies completely o¤set the negative im-
pact caused by the trade shocks. A possible explanation for this lack of stronger policy complementarity
is that the magnitude of the human capital shocks are completely dominating the much lower trade
e¤ects. In a framework where both sets of policies have dynamic e¤ects on growth rates we expect the
results to be di¤erent.
Two main policy implications result from our analysis. First, in our study, we show that human
capital accumulation is crucial in the process of economic growth and poverty reduction. Therefore,
improvements in education should be part of an integrated approach for development policy design.
Human capital investments, moreover, should be a policy priority, irrespective of its interactions with
other public policies. However, the downturn from human capital policies is that they are a long-term
investment. The initial opportunity costs associated with students staying longer in school outweigh the
economic bene�ts in the short run. This can create problems in a political economy setting where the
74

policymaker is confronted with several investment choices with di¤erent short and long term returns,
but worries only for her short-term electoral performance.
For instance,. Jiménez et al. (2009) argue that human capital formation in Costa Rica was severely
a¤ected from the economic crises of 1980-82. The recovery of human capital investments levels took
almost two decades after that negative shock. They conclude that economic growth in the following
years depends on more investments in education, since total factor productivity growth in the last two
decades has been mainly driven more by capital and labor accumulation (growth of labor units) than
human capital accumulation.
In the case of Nicaragua, the World Bank (2008) argues that education investments are a key condi-
tion to improve labor productivity and enhance growth. They �nd that job creation and higher wages
can improve living conditions and development opportunities, particularly for the poorest households.
These potential medium and long term impacts of education investments on economic returns imply
that policy e¤orts should be prioritized. Guevara (2004) argues that education investments require a
sustained e¤ort, if the current state of human capital in Nicaragua is to be e¤ectively improved.
Therefore, Costa Rica and Nicaragua should strengthen education policies in order to create con-
ditions for growth and poverty reduction. Education policies should be one of the highest priorities in
both countries. The results from our satellite model and CGE model clearly state that the quantity
and (most importantly) the quality of education matters crucially for economic growth.
Secondly, we �nd that FTAs are having a positive impact on production and consumption, and on a
lower extent, on poverty reduction. These positive results can be considered as a lower-bound of possible
trade e¤ects, since we are not considering the dynamic e¤ects from trade that can foster economic
growth in the lung run. In this context, the attraction of FDI, for instance, and competitiveness
enhancing policies (i.e. through technology improvements and infrastructure modernization) are a
critical conditions to achieve these dynamic e¢ ciency bene�ts.
For Costa Rica and Nicaragua, FTAs represents a series of opportunities that can be exploited, but
also a series of critical challenges. Given the importance of US and EU trade and investment in the
region, in addition to the huge size di¤erences between countries and regions, the agreements will have
signi�cant sectoral and economy-wide e¤ects.
A key factor will be the scope and depth of the complementary policies associated with FTAs imple-
mentation. For instance, after analyzing the Mexican experience with NAFTA, Lederman et al. (2005)
conclude that FTAs o¤er great opportunities for Latin American countries, but without complemen-
tary policies, there is no guarantee that the agreements can increase growth. Thus, the full potential
of trade liberalization depends on complementary policies, when we take complementary policies in a
broad sense and de�ne them as productivity enhancing policies. Competitiveness is built upon the
productivity of the leading �rms and industries within the economy.
Education is regarded by the World Economic Forum as one of the pillars of competitiveness,
together with infrastructure, macroeconomic stability, technological readiness, and innovation, among
other drivers of growth. These pillars are key determinants of productivity growth. Trade policy
e¤ectiveness depends on the country conditions in those areas. Education is certainly a key component of
the growth equation. Schwab and i Martin (2009) indicate that education in Costa Rica is a competitive
advantage, but requires more educational investments in order to catch up with leading innovation-
driven economies. Meanwhile Nicaragua has made advances with primary education coverage, but the
75
quality of education and enrollment rates in secondary and tertiary education represent competitive
disadvantages that limit growth.
The governments of both countries have a role in adjusting policy to improve the countries�ability
to compete and bene�t from trade liberalization. The main concern in this respect, is the absence of
long-term development strategies in Costa Rica and Nicaragua. In some way, FTAs have been seen as
�substitutes� of such strategies. The key point is how governments create and implement a compet-
itiveness enhancing long term strategy. This requires more investment in human capital. Integrated
with FTAs, human capital accumulation are both growth engines that can create new development
opportunities.
Costa Rica and Nicaragua can expect positive and lasting bene�ts from both FTAs, but these bene�ts
can be multiplied if both countries can put in place the infrastructure, human capital, and institutional
capacity necessary to participate successfully in world markets. DR-CAFTA and EU-CAAA establish
a clear direction and powerful driver for leaders and policy makers to make much-needed political and
�nancial investments toward truly competitive and successful societies.
76

References
Aghion, T. P. and Howitt, P. (1998). Endogenous Growth Theory, The MIT Press, Cambridge, MA.
Aghion, T. P. and Howitt, P. (2009). The Economics of Growth, The MIT Press, Cambridge, MA.
Arrow, K. J. (2000). �Increasing Returns: Historiographic Issues and Path Dependence�, European
Journal on History of Economic Thought 7(2): 171�180.
Ashenfelter, O., Harmon, C. and Oosterbeek, H. (1999). �A Review of Estimates of the School-
ing/Earnings Relationship, with Tests for Publication Bias�, Labour Economics 6(4): 453�470.
Avila, A. and Evenson, R. (2004). �Total Factor Productivity Growth in Agriculture: The Role of
Technological Capital�, Mimeo, Economic Growth Center, Yale University.
Barro, R. and Sala-i-Martin, X. (1995). Economic Growth, McGraw-Hill, New York.
Benhabib, J. and Spiegel, M. M. (2005). �Human Capital and Technology Di¤usion�, in P. Aghion and
S. N. Durlauf (eds.), Handbook of Economic Growth, North Holland, Amsterdam, pp. 935�966.
Bourguignon, F. and da Silva, L. P. (2003). The Impact of Economic Policies on Poverty and Income
Distribution: Evaluation Techniques and Tools, The World Bank and Oxford University Press,
Washington, D.C.
Bourguignon, F., Robilliard, A.-S. and Robinson, S. (2003). �Representative versus Real Household in
the Macro-Economic Modelling of Inequality�, Document de travail DIAL / Unité de Recherche
CIPRE DT/2003-10.
Card, D. E. (1994). �Earnings, Schooling, and Ability Revisited�, NBER Working Paper 4832.
Caselli, F. and Coleman, W. J. (2006). �The World Technology Frontier�, American Economic Review
96(3): 499�521.
CEPAL (2008). �Panorama de la Inserción Internacional de América Latina y el Caribe.�, Discussion
Paper, División de Comercio, Comisión Económica para América Latina.
CEPAL (2009). Panorama de la Inserción Internacional de América Latina y el Caribe 2008-2009,
División de Comercio e Integración, Comisión Económica para América Latina, Santiago de Chile.
Cogneau, D. and Robilliard, A.-S. (2000). �Growth, Distribution and Poverty in Madagascar: Learning
from a Micro-simulation Model in a General Equilibrium Framework�, IFPRI TMD Discussion
Paper 61.
Condo, A., Colburn, F. and Rivera, L. (2005). The United States Central America Free Trade Agreement
(CAFTA): Negotiations and Expected outcomes, Nomura Research Institute, Tokyo.
Condo, A., Figueroa, L., Morales, L., Obando, L. and Jenkins, M. (2004). �El Sector Textil Exportador
Latinoamericano ante la Liberalización del Comercio�, Discussion Paper, Latin American Center
for Competitiveness and Sustainable Development, INCAE Business School.
77

Durlauf, S. N. (1996). �A Theory of Persistent Income Inequality�, Journal of Economic Growth
1(1): 75�93.
Easterly, W. (2001). �The Lost Decades: Developing Countries�Stagnation in Spite of Policy Reform
1980-1998�, Journal of Economic Growth 6: 135�157.
ECLAC (2009). �Enfrentando la Crisis: Istmo Centroamericano y República Dominicana. Evolución
Económica en 2008 y Perspectivas para 2009�, Discussion Paper LC/MEX/L.904, Economic Com-
mission for Latin America and the Caribbean, United Nations, New York.
Edwards, S. (1993). �Openness, Trade Liberalization, and Growth in Developing Countries�, Journal
of Economic Literature 31: 1358�1393.
Francois, J., McDonald, B. and Nordström, H. (1996). �Liberalization and Capital Accumulation in
the GTAP Model�, GTAP Technical Paper No. 7, Center for Global Trade Analysis.
Francois, J., Rivera, L. and Rojas-Romagosa, H. (2008). �Economic Perspectives for Central America
after CAFTA: A GTAP-based Analysis�, CPB Discussion Paper 99.
Galliani, S. (2007). �Reducing Poverty in Latin America and the Caribbean�, Report for the Copen-
hagen Consensus Center and the Inter-American Development Bank, Washington University in St.
Louis.
Gindling, T. H. (2007). �Labor Markets and Poverty in Costa Rica�, Costa Rica Poverty Assessment:
Recapturing Momentum for Poverty Reduction project, The World Bank.
Gindling, T. H. and Trejos, J. D. (2005). �Accounting for Changing Inequality in Costa Rica: 1980-
1999�, Journal of Development Studies 41: 898�926.
Glaeser, E. L. and Maré, D. C. (2001). �Cities and Skills�, Journal of Labor Economics 19(2): 316�342.
Glewwe, P. (2002). �Schools and Skills in Developing Countries: Education Policies and Socioeoconomic
Outcomes�, Journal of Economic Literature 40: 436.
Glewwe, P., Jacoby, H. G. and King, E. M. (2001). �Early Childhood Nutrition and Academic Achieve-
ment: A Longitudinal Analysis�, Journal of Public Economics 81: 345�368.
Gould, E. D. (2007). �Cities, Workers, and Wages: A Structural Analysis of the Urban Wage�, Review
of Economic Studies 74: 477�506.
Gould, E., Lavy, V. and Paserman, D. (2009). �Sixty Years After the Magic Carpet Ride: The Long-run
E¤ect of the Early Childhood Environment on Social and Economic Outcomes�, NBER Working
Paper 14884.
Grantham-McGregor, S., Cheung, Y. B., Cueto, S., Glewwe, P., Richter, L., Strupp, B. and ICDSG
(2007). �Developmental Potential in the First 5 Years for Children in Developing Countries�, The
Lancet .
Guevara, P. (2004). �E¢ ciency of Primary Education in Nicaragua: A System Dynamics Analysis�,
Master�s Thesis, University of Bergen.
78
Gutierrez, C., Paci, P. and Ranzani, M. (2008). Making Work Pay in Nicaragua. Employment, Growth,
and Poverty Reduction, The World Bank, Washington D.C.
Hanushek, E. (2007). Education Production Functions, Palgrave Encyclopedia.
Hanushek, E. A. (1986). �The Economics of Schooling: Production and E¢ ciency in Public Schools�,
Journal of Economic Literature 24(3): 1141�1177.
Hanushek, E. A. and Kimko, D. D. (2000). �Schooling, Labor-Force Quality, and the Growth of
Nations�, The American Economic Review 90(5): 1184�1208.
Hanushek, E. A. and Woessman, L. (2008). �The Role of Cognitive Skills in Economic Development�,
Journal of Economic Literature 46(3): 607�668.
Hanushek, E. A. and Woessman, L. (2009a). �Do Better Schools Lead to More Growth? Cognitive
Skills, Economic Outcomes, and Causation�, NBER Working Paper 14633.
Hanushek, E. A. and Woessman, L. (2009b). �Schooling, Cognitive Skills, and the Latin American
Growth Puzzle�, NBER Working Paper 15066.
Harmon, C. P., Oosterbeek, H. and Walker, I. (2003). �The Returns to Education: Microeconomics�,
Journal of Economic Surveys 17(2): 115�155.
Heckman, J. J. (2000). �Policies to Foster Human Capital�, Research in Economics 54(1): 3�56.
Heckman, J. J., Lochner, L. and Taber, C. (1998). �Explaining Rising Wage Inequality: Explanations
With A Dynamic General Equilibrium Model of Labor Earnings With Heterogeneous Agents�,
Review of Economic Dynamics 1(1): 1�58.
Helpman, E. (2004). The Mystery of Economic Growth, Harvard University Press, Cambridge, MA.
Hertel, T. W. and Tsigas, M. E. (1997). �Structure of GTAP�, in T. W. Hertel (ed.), Global Trade
Analysis: Modeling and Applications, Cambridge University Press.
Hoddinott, J., Maluccio, J., Behrman, J., Flores, R. and Martorell, R. (2009). �E¤ect of a Nutrition In-
tervention During Early Childhood on Economic Productivity in Guatemalan Adults�, The Lancet
.
INEC-CR (2006). �Encuesta Nacional de Ingresos y Gastos de los Hogares 2004: Documento
Metodológico y Principales Resultados�, Mimeo, Instituto Nacional de Estadísticas y Censos, San
José, Costa Rica.
INEC CR (2008). �Encuesta de Hogares del 2008�, Discussion Paper, Instituto Nacional de Estadísticas
y Censos, San José, Costa Rica.
INEC Nicaragua (2005). �VIII Censo Nacional de Población�, Discussion Paper, Instituto Nacional de
Estadísticas y Censos, Managua, Nicaragua.
INEC-Nicaragua (2006). �Encuesta Nacional de Hogares sobre Medición de Niveles de Vida 2005:
Manual del Usuario de la Base de Datos�, Mimeo, Instituto Nacional de Estadísticas y Censos
Nicaragua, Programa MECOVI, Managua, Nicaragua.
79

Instituto Nacional para la Evaluación de la Educación, INED (2008). Análisis Multinivel de la Calidad
Educativa en México ante los Datos de Pisa 2006, INED, México, DF.
Jacobs, B. (2004). �The Lost Race between Schooling and Technology�, De Economist 152(1): 47�78.
Jacobs, B. (2005). �Simulating the Lisbon skills targets in WorldScan�, CPB Memorandum 135.
Jiménez, R., Robles, E. and Arce, G. (2009). �Educación y Crecimiento Económico en Costa Rica.�,
in L. Messalles and V. H. Céspedes (eds.), Obstáculos al Crecimiento Económico en Costa Rica,
Academia de Centroamérica, San José, Costa Rica.
Katz, L. F. and Murphy, K. M. (1992). �Changes in Relative Wages, 1963-1987: Supply and Demand
Factors�, Quarterly Journal of Economics 107(1): 35�78.
Kets, W. and Lejour, A. M. (2003). �Sectoral TFP Developments in the OECD�, CPB Memorandum 58.
Krueger, A. B. (2003). �Economic Considerations and Class Size�, Economic Journal 113(485): F34�
F63.
Lederman, D., Maloney, W. F. and Servén, L. (2005). Lessons from NAFTA for Latin America and the
Caribbean, The World Bank and Stanford University Press, Washington DC.
Lejour, A. M., Veenendaal, P., Verweij, G. and van Leeuwen, N. (2006). �WorldScan: A Model for
International Economic Policy Analysis�, CPB Document 111.
Löfgren, H., Robinson, S. and El-Said, M. (2003). �Poverty and Inequality Analysis in a General
Equilibrium Framework: The Representative Household Approach�, in F. Bourguignon and L. P.
da Silva (eds.), The Impact of Economic Policies on Poverty and Income Distribution: Evaluation
Techniques and Tools, The World Bank and Oxford University Press, Washington, D.C.
Lucas, R. E. (1988). �On the Mechanics of Economic Development�, Journal of Monetary Economics
22(1): 3�42.
Macours, K., Schady, N. and Vakis, R. (2009). �Cash Transfers, Behavioral Changes, and Cognitive
Development in Early Childhood: Evidence from a Randomized Experiment�, Policy Research
Working Paper 4759, The World Bank.
Maluccio, J. and Flores, R. (2004). �Impact Evaluation of a Conditional Cash Transfer Program: The
Nicaraguan Red de Protección Social�, Discussion Paper, IFPRI, Washington, DC.
Mankiw, N. G., Romer, D. and Weil, D. N. (1992). �A Contribution to the Empirics of Economic
Growth�, Quarterly Journal of Economics 107(2): 407�437.
MIDEPLAN (2006). �Plan Nacional de Desarrollo "Jorge Manuel Dengo Obregón" 2006-2010�, Dis-
cussion Paper, Gobierno de Costa Rica, San José, Costa Rica.
Mincer, J. (1962). �On the Job Training: Costs, Returns and Some Implications�, Journal of Political
Economy 70(5): 50�79.
80

Ministerio de Educación de Nicaragua (2007). �Sistema de Estadísticas Nacionales (SEN). MINED en
Cifras�, Discussion Paper, Dirección General de Plani�cación, Managua, Nicaragua.
Ministerio de Educación de Nicaragua (2008). �Censo Escolar 2007. Informe de los Departamentos y
Regiones Autónomas�, Discussion Paper, Dirección General de Plani�cación, Managua, Nicaragua.
Monge-González, R., Rivera, L. and Rosales-Tijerino, J. (2009). �Productive Development Policies in
Costa Rica: Market Failures, Government Failures and Policy Outcomes�, Final Project Report,
Inter-American Development Bank.
Murnane, R., Willett, J., Duhaldeborde, Y. and Tyler, J. (2000). �How Important Are the Cognitive
Skills of Teenagers in Predicting Subsequent Earnings?�, Journal of Policy Analysis and Manage-
ment 19(4): 547�568.
Narayanan, B. and Walmsley, T. L. (eds) (2008). Global Trade, Assistance, and Production: The GTAP
7 Data Base, Center for Global Trade Analysis, Purdue University.
OECD (2007). PISA 2006 Science Competencies for Tomorrow�s World, OECD, Paris.
Paltsev, S. (2004). �Moving from Static to Dynamic General Equilibrium Economic Models�, Working
Paper, MIT.
Paxson, C. and Schady, N. (2007). �Cognitive Development Among Young Children in Ecuador: The
Role of Health, Wealth and Parenting�, Journal of Human Resources 42(1): 49�84.
Programa Estado de la Nación (2008). �Estado de la Educación Costarricense�, Discussion Paper,
Programa Estado de la Nación y CONARE, San José, Costa Rica.
Ravallion, M., Chen, S. and Sangraula, P. (2008). �Dollar a Day Revisited�, Policy Research Working
Paper 4620, World Bank, Development Research Group.
Reina, M. and Zuluaga, S. (2008). �Comercio y Pobreza: Análisis Comparativo de la Evidencia para
América Latina�, Serie Comercio Internacional 87, CEPAL, Santiago de Chile.
Rivera, L. and Rojas-Romagosa, H. (2007). �Economic Implications of an Association Agreement
between the European Union and Central America�, IIDE Discussion Paper 2007 10-01.
Rodríguez-Clare, A., Trejos, A. and Sáenz, M. (2004). �Análisis del Crecimiento Económico en Costa
Rica: 1950-2000�, in M. Agosín, R. Machado and P. Nazal (eds.), Pequeñas Economías, Grandes
Desafíos. Políticas Económicas para el Desarrollo de Centroamérica, Inter-American Development
Bank.
Rodríguez, F. and Rodrik, D. (2001). �Trade Policy and Economic Growth: A Skeptic�s Guide to the
Cross-National Evidence�, in B. Bernanke and K. Rogo¤ (eds.), Macroeconomics Annual 2000,
MIT Press for NBER, Cambridge MA.
Rojas-Romagosa, H. (2009). �Modelling Human Capital Formation in WorldScan�, Memorandum
Forthcoming, CPB Netherlands Bureau for Economic Policy Analysis.
81

Romer, P. M. (1990). �Human Capital and Growth: Theory and Evidence�, Carnegie-Rochester Con-
ference Series on Public Policy 32: 251�286.
Rutherford, T. F. (1995). �Extensions of GAMS for Complementarity Problems�, Journal of Economic
Dynamics and Control 19(8): 1299�1324.
Rutherford, T. F. (1999). �Applied General Equilibrium Modeling with MPSGE as a GAMS Subsystem:
An Overview of the Modeling Framework and Syntax�, Computational Economics 14(1-2): 1�46.
Rutherford, T. F. (2005). �GTAP6inGAMS: The Dataset and Static Model�, Prepared for the Work-
shop: Applied General Equilibrium Modeling for Trade Policy Analysis in Russia and the CIS,
The World Bank Resident Mission, Moscow.
Sánchez, M. V. (2004). Rising Inequality and Falling Poverty in Costa Rica�s Agriculture during Trade
Reform: A Macro-micro General Equilibrium Analysis, Shaker, Maastricht.
Sauma, P. and Sánchez, M. V. (2003). Exportaciones, Crecimiento Económico, Desigualdad y Pobreza.
El Caso de Costa Rica, Editorial ISIS, San José, Costa Rica.
Schwab, K. and i Martin, X. S. (2009). The Global Competitiveness Report 2009-2010, World Economic
Forum, Geneva, Switzerland.
SIDES (2009). �Sistema de Indicadores sobre Desarrollo Sostenible�, Discussion Paper, Ministerio de
Plani�cación, Costa Rica, www.mideplan.go.cr/sides.
Trejos, J. and Gindling, T. H. (2004). �La Desigualdad en Centroamérica durante el Decenio de 1990�,
Revista de la CEPAL 84: 23�36.
UNESCO and LLECCE (2008a). Los aprendizajes de los estudiantes de América Latina y el Caribe.
Primer reporte de los resultados del Segundo Estudio Regional Comparativo y Explicativo, Sale-
sianos Impresores S.A., Santiago, Chile.
UNESCO and LLECCE (2008b). Re�exiones en torno a la evaluación de la calidad educativa en
América Latina y el Caribe, Salesianos Impresores S.A., Santiago, Chile.
Verdisco, A., Näslund-Hadley, E., Regalia, F. and Zamora, A. (2007). �Integrated Childhood Develop-
ment Services in Nicaragua�, Child Health and Education 1(2): 104�111.
Webbink, D. (2005). �Causal E¤ects in Education�, Journal of Economic Surveys 19(4): 535�560.
Weingarden, A. and Tsigas, M. (2009). �Labor Statistics for the GTAP Database�, Discussion Paper,
U.S. International Trade Commision, Research Division, O¢ ce of Economics, Washington DC.
Winters, A., McCulloch, N. and McKay, A. (2004). �Trade Liberalization and Poverty: The Evidence
So Far�, Journal of Economic Literature 42: 72�115.
World Bank (2008). �Nicaragua Poverty Assessment�, Report No. 39736-NI, The World Bank, Central
America Country Management Unit, Washington D.C.
82

World Bank and Inter-American Development Bank (2008). �Costa Rica - Public Expenditure Review:
Enhancing the E¢ ciency of Expenditures�, Mimeo, The World Bank.
Young, M. and Richardson, L. (eds) (2007). Early Childhood Development. From Measurement to
Action. A Priority for Growth and Equity, The World Bank, Washington D.C.
83
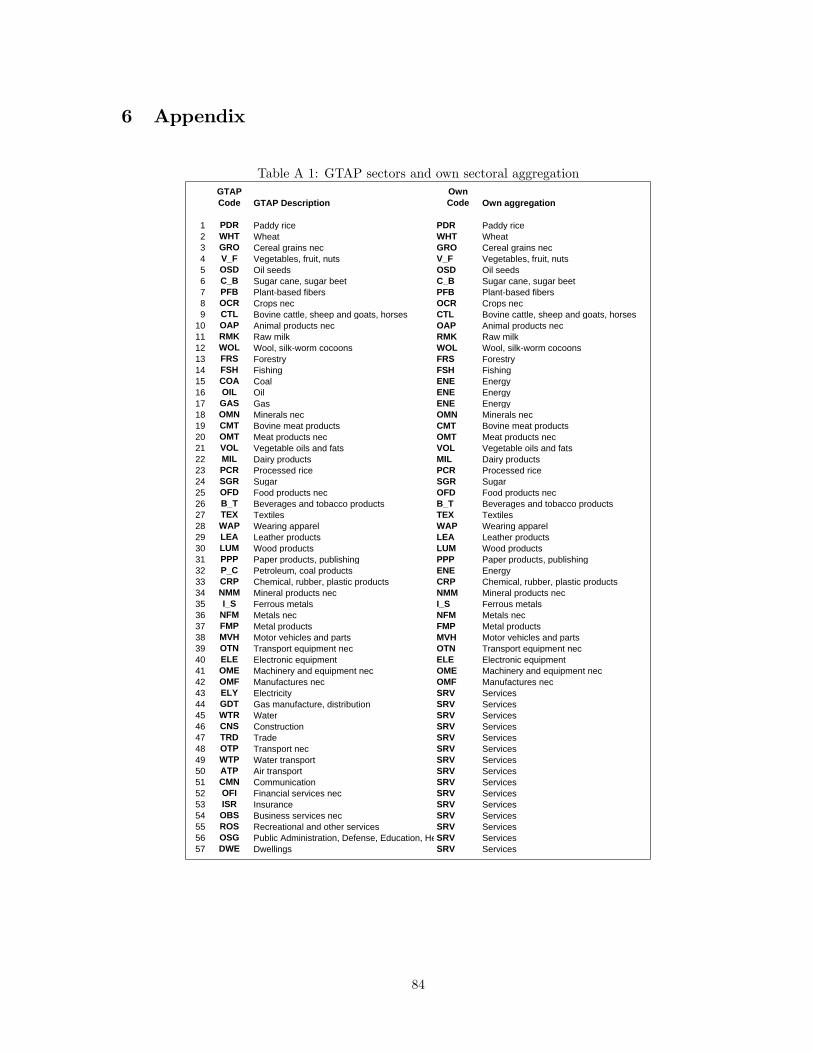
6 Appendix
Table A 1: GTAP sectors and own sectoral aggregationGTAPCode GTAP Description
OwnCode Own aggregation
1 PDR Paddy rice PDR Paddy rice2 WHT Wheat WHT Wheat3 GRO Cereal grains nec GRO Cereal grains nec4 V_F Vegetables, fruit, nuts V_F Vegetables, fruit, nuts5 OSD Oil seeds OSD Oil seeds6 C_B Sugar cane, sugar beet C_B Sugar cane, sugar beet7 PFB Plantbased fibers PFB Plantbased fibers8 OCR Crops nec OCR Crops nec9 CTL Bovine cattle, sheep and goats, horses CTL Bovine cattle, sheep and goats, horses
10 OAP Animal products nec OAP Animal products nec11 RMK Raw milk RMK Raw milk12 WOL Wool, silkworm cocoons WOL Wool, silkworm cocoons13 FRS Forestry FRS Forestry14 FSH Fishing FSH Fishing15 COA Coal ENE Energy16 OIL Oil ENE Energy17 GAS Gas ENE Energy18 OMN Minerals nec OMN Minerals nec19 CMT Bovine meat products CMT Bovine meat products20 OMT Meat products nec OMT Meat products nec21 VOL Vegetable oils and fats VOL Vegetable oils and fats22 MIL Dairy products MIL Dairy products23 PCR Processed rice PCR Processed rice24 SGR Sugar SGR Sugar25 OFD Food products nec OFD Food products nec26 B_T Beverages and tobacco products B_T Beverages and tobacco products27 TEX Textiles TEX Textiles28 WAP Wearing apparel WAP Wearing apparel29 LEA Leather products LEA Leather products30 LUM Wood products LUM Wood products31 PPP Paper products, publishing PPP Paper products, publishing32 P_C Petroleum, coal products ENE Energy33 CRP Chemical, rubber, plastic products CRP Chemical, rubber, plastic products34 NMM Mineral products nec NMM Mineral products nec35 I_S Ferrous metals I_S Ferrous metals36 NFM Metals nec NFM Metals nec37 FMP Metal products FMP Metal products38 MVH Motor vehicles and parts MVH Motor vehicles and parts39 OTN Transport equipment nec OTN Transport equipment nec40 ELE Electronic equipment ELE Electronic equipment41 OME Machinery and equipment nec OME Machinery and equipment nec42 OMF Manufactures nec OMF Manufactures nec43 ELY Electricity SRV Services44 GDT Gas manufacture, distribution SRV Services45 WTR Water SRV Services46 CNS Construction SRV Services47 TRD Trade SRV Services48 OTP Transport nec SRV Services49 WTP Water transport SRV Services50 ATP Air transport SRV Services51 CMN Communication SRV Services52 OFI Financial services nec SRV Services53 ISR Insurance SRV Services54 OBS Business services nec SRV Services55 ROS Recreational and other services SRV Services56 OSG Public Administration, Defense, Education, HealthSRV Services57 DWE Dwellings SRV Services
84
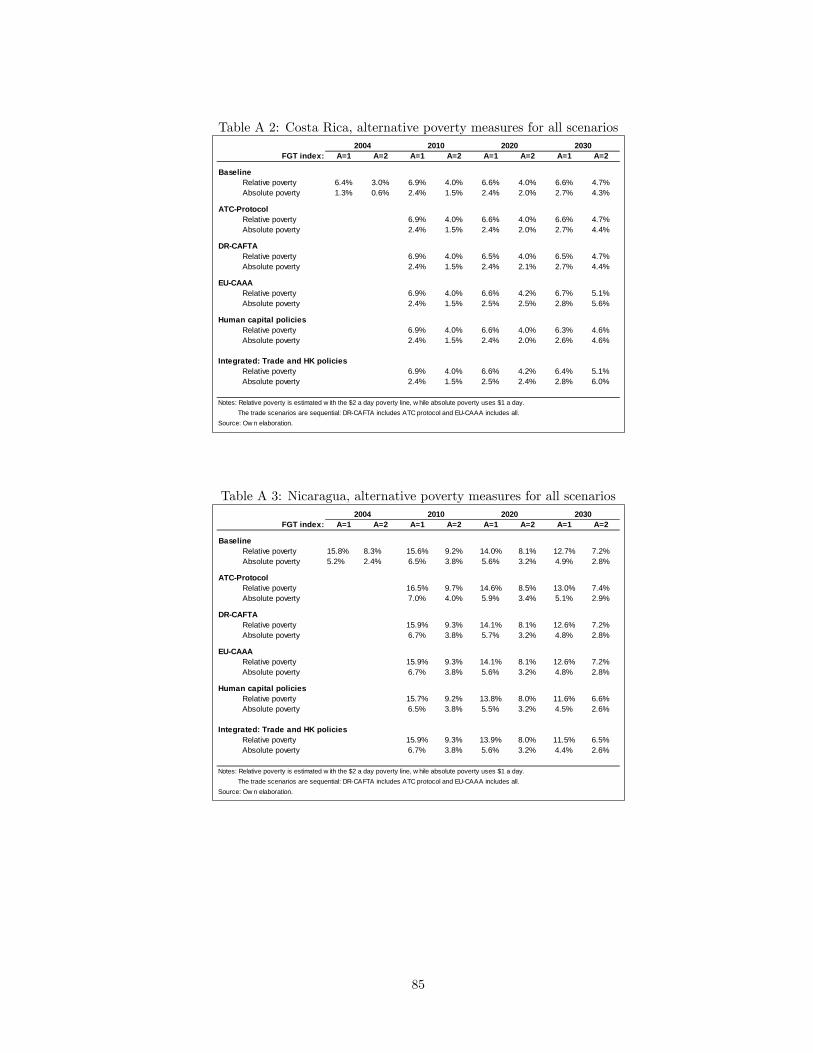
Table A 2: Costa Rica, alternative poverty measures for all scenarios
FGT index: A=1 A=2 A=1 A=2 A=1 A=2 A=1 A=2
Baseline Relative poverty 6.4% 3.0% 6.9% 4.0% 6.6% 4.0% 6.6% 4.7% Absolute poverty 1.3% 0.6% 2.4% 1.5% 2.4% 2.0% 2.7% 4.3%
ATCProtocol Relative poverty 6.9% 4.0% 6.6% 4.0% 6.6% 4.7% Absolute poverty 2.4% 1.5% 2.4% 2.0% 2.7% 4.4%
DRCAFTA Relative poverty 6.9% 4.0% 6.5% 4.0% 6.5% 4.7% Absolute poverty 2.4% 1.5% 2.4% 2.1% 2.7% 4.4%
EUCAAA Relative poverty 6.9% 4.0% 6.6% 4.2% 6.7% 5.1% Absolute poverty 2.4% 1.5% 2.5% 2.5% 2.8% 5.6%
Human capital policies Relative poverty 6.9% 4.0% 6.6% 4.0% 6.3% 4.6% Absolute poverty 2.4% 1.5% 2.4% 2.0% 2.6% 4.6%
Integrated: Trade and HK policies Relative poverty 6.9% 4.0% 6.6% 4.2% 6.4% 5.1% Absolute poverty 2.4% 1.5% 2.5% 2.4% 2.8% 6.0%
Notes: Relative poverty is estimated w ith the $2 a day poverty line, w hile absolute poverty uses $1 a day. The trade scenarios are sequential: DRCAFTA includes ATC protocol and EUCAAA includes all.Source: Ow n elaboration.
2004 2010 2020 2030
Table A 3: Nicaragua, alternative poverty measures for all scenarios
FGT index: A=1 A=2 A=1 A=2 A=1 A=2 A=1 A=2
Baseline Relative poverty 15.8% 8.3% 15.6% 9.2% 14.0% 8.1% 12.7% 7.2% Absolute poverty 5.2% 2.4% 6.5% 3.8% 5.6% 3.2% 4.9% 2.8%
ATCProtocol Relative poverty 16.5% 9.7% 14.6% 8.5% 13.0% 7.4% Absolute poverty 7.0% 4.0% 5.9% 3.4% 5.1% 2.9%
DRCAFTA Relative poverty 15.9% 9.3% 14.1% 8.1% 12.6% 7.2% Absolute poverty 6.7% 3.8% 5.7% 3.2% 4.8% 2.8%
EUCAAA Relative poverty 15.9% 9.3% 14.1% 8.1% 12.6% 7.2% Absolute poverty 6.7% 3.8% 5.6% 3.2% 4.8% 2.8%
Human capital policies Relative poverty 15.7% 9.2% 13.8% 8.0% 11.6% 6.6% Absolute poverty 6.5% 3.8% 5.5% 3.2% 4.5% 2.6%
Integrated: Trade and HK policies Relative poverty 15.9% 9.3% 13.9% 8.0% 11.5% 6.5% Absolute poverty 6.7% 3.8% 5.6% 3.2% 4.4% 2.6%
Notes: Relative poverty is estimated w ith the $2 a day poverty line, w hile absolute poverty uses $1 a day. The trade scenarios are sequential: DRCAFTA includes ATC protocol and EUCAAA includes all.Source: Ow n elaboration.
2030202020102004
85

Table A 4: Integrated trade and human capital scenario, sectoral production changes w.r.t. baseline
Code Sector 2010 2020 2030 2010 2020 2030
PDR Paddy_rice 0.01 0.05 0.06 0.04 0.10 0.12WHT Wheat 0.00 0.14 0.11 0.01 0.03 0.04GRO Other_cereal 0.01 0.04 0.06 0.01 0.01 0.04V_F Veg_fruits 0.00 0.06 0.04 0.01 0.00 0.02OSD Oil_seeds 0.00 0.04 0.02 0.29 0.22 0.17C_B Sugar_cane 0.01 0.00 0.03 0.01 0.01 0.04PFB Plant_fibers 0.01 0.03 0.02 0.01 0.01 0.05OCR Crops_nec 0.01 0.04 0.03 0.00 0.00 0.00CTL Cattle 0.00 0.01 0.02 0.01 0.00 0.02OAP Animprod_nec 0.00 0.02 0.01 0.02 0.00 0.03RMK Raw_milk 0.09 0.05 0.05 0.04 0.03 0.05WOL Wool 0.03 0.02 0.03 0.16 0.09 0.17FRS Forestry 0.01 0.01 0.00 0.00 0.01 0.02FSH Fishing 0.00 0.00 0.00 0.01 0.00 0.00OMN Minerals_nec 0.01 0.01 0.00 0.00 0.00 0.00CMT Meat 0.00 0.00 0.02 0.03 0.02 0.01OMT Meatprod_nec 0.01 0.02 0.03 0.00 0.00 0.03VOL Veg_oils 0.01 0.00 0.07 0.14 0.12 0.07MIL Dairy 0.11 0.06 0.07 0.13 0.08 0.02PCR Proc_rice 0.01 0.01 0.05 0.12 0.07 0.00SGR Sugar 0.01 0.00 0.03 0.01 0.01 0.04OFD Foodprod_nec 0.01 0.01 0.04 0.01 0.05 0.12B_T Bev_tobacco 0.01 0.01 0.06 0.01 0.02 0.08TEX Textiles 0.07 0.04 0.08 0.46 0.49 0.88
WAP Apparel 0.36 0.30 0.18 0.42 0.35 0.10LEA Leather 0.06 0.16 0.33 0.03 0.01 0.25LUM Wood_prod 0.07 0.07 0.01 0.02 0.01 0.06PPP Paper_prod 0.02 0.01 0.09 0.03 0.04 0.21CRP Chemical_pla 0.01 0.03 0.10 0.02 0.03 0.16NMM Minprod_nec 0.00 0.01 0.07 0.03 0.03 0.13I_S Ferrous_met 0.04 0.07 0.16 0.05 0.06 0.13
NFM Metals_Nec 0.03 0.04 0.15 0.12 0.17 0.38FMP Metal_prods 0.00 0.02 0.10 0.04 0.06 0.21MVH Motor_veh 0.01 0.00 0.07 0.03 0.04 0.19OTN Trans_eq_nec 0.08 0.09 0.15 0.05 0.07 0.21ELE Electronic 0.00 0.19 0.16 0.00 0.03 0.20OME Machine_nec 0.24 0.30 0.34 0.33 0.35 0.58OMF Manufact_nec 0.01 0.02 0.05 0.03 0.01 0.05SRV Services 0.01 0.01 0.08 0.01 0.03 0.15ENE Energy 0.04 0.01 0.06 0.02 0.03 0.11
Source: Ow n elaboration.
Costa Rica Nicaragua
86